An investor's guide to climate change: the simple and surprising facts - Schroders
←
→
Page content transcription
If your browser does not render page correctly, please read the page content below
Marketing material

In focus

An investor’s guide to climate change:
the simple and surprising facts
May 2021

Climate change is real, it is being driven
by record and still-rising greenhouse gas
emissions and human activity is mostly
responsible for it. The impact of global
warming is becoming uncomfortably
tangible. Every year, more and more people                                                Anastasia Petraki
                                                                                          Head of Policy Research
around the world feel its effects through
recurring extreme weather events that harm          The facts
life and property and dislocate populations.        A quick prelude
The good news is that we are concerned              For any of the facts that follow to make sense, we need to have a
                                                    quick introduction to climate change.
enough for Greta Thunberg to be
                                                    We start with greenhouse gases. These are gases that exist in the
immediately recognisable around the world.          atmosphere and include carbon dioxide, methane, nitrous oxide,
The bad news is that we are not scared              and fluorinated gases. These gases are emitted by both human
                                                    and natural activity and have the unique characteristic that they
enough. Despite all the policy action in the        absorb heat and trap it in the atmosphere. This causes the Earth’s
                                                    temperature to increase. The scale of this rise depends on how
last decades, greenhouse gas emissions are          much of these gases is emitted, how long they stay up there and
still increasing and the planet is still warming.   how much heat they absorb.

                                                    Human activity over the last few centuries has resulted in emissions
Perhaps the key lies in climate change              that are significantly above normal. As a result, the Earth is warming
literacy. Most of us have heard about global        to unprecedented levels, which is called global warming. The main
                                                    (but not the only) culprit is carbon dioxide generated from human
warming and its effects but how much do             activities that stays up in the atmosphere pretty much forever. This
                                                    is why emissions work in a cumulative way: the more we emit, the
we really know about how human activity is          more is up there causing more global warming.
harming the environment?                            This warming is causing the climate to change. Scientific research
                                                    has shown how it connects to a greater probability of extreme
This paper puts together some facts about           weather events, lower access to water, population dislocation and
climate change that can help all of us better       loss of biodiversity, to name only a few issues. The list is scarily long.

understand climate change and the role that         Since we (humans) keep emitting greenhouse gases, these keep
                                                    accumulating in the atmosphere, warming the planet even further
human activities play. It also makes some           which means that climate change and its effects will only get
suggestions about actions that we can               worse and more frequent. At some point (and we don’t know
                                                    exactly when this will be) the emissions from our activities will tip
take as individuals to manage our carbon            the balance in the environment in a devastating and (this cannot
                                                    be overemphasised) an irreversible way.
footprint and explains what Schroders is
doing as an investor and a company.                 It has been estimated that we may be able to prevent this if we
                                                    manage to keep the rise in average global temperature to 1.5
                                                    degrees Celsius below pre-industrial levels (which is universally
Reading this may get scary at times but             used as the baseline and almost always means temperatures
please do not look away!                            in 1850-1900; Source: BBC). We could achieve this by reducing
                                                    emissions to zero by about 2050 (Source: IPCC).
That’s right: reducing emissions will not be enough – we must             Ȃ Climate change-driven water scarcity, crop failure, sea-level
get them to zero. As this is practically impossible, the target is          rise and storm surges could dislocate over 140 million people
actually “net” zero. We could achieve this by reducing emissions            by 2050 in three densely populated regions of the world: Sub-
to an absolute minimum and finding ways to counterbalance                   Saharan Africa, South Asia, and Latin America (Source: World
them (sometimes with outright removal of greenhouse gases                   Bank). There have already been an estimated 23.1 million
from the atmosphere).                                                       displacements of people on average each year over the past
                                                                            decade (2010-2019) due to weather-related events (Source:
The cumulative nature of greenhouse gases means one further                 World Meteorological Organization).
thing: projected warming for the next decades is already set.
Whatever mitigation we undertake, temperature projections will            Ȃ People tend to think that conflict is the biggest driver of
only be affected in the second half of this century.                        population displacement (Source: Ipsos). However, in the
                                                                            first half of 2020, two thirds of population displacements
Having introduced the issue in a nutshell, we begin our list of             globally happened due to climate change (Source: Internal
(sometimes scary) facts about the environment and climate change.           Displacement Monitoring Centre).
                                                                          Ȃ The difference between 1.5 and 2 degrees Celsius is massive. In
On climate change                                                           a 1.5 degree rise scenario (Source: IPCC):
Ȃ The global average temperature already reached about 1.1                   Ȃ The average rise in sea levels by the end of the 21st century
  to 1.3 degrees Celsius above pre-industrial levels in 2020. The              will be lower by about 0.10 metres affecting 10.4 million
  six years 2015-2020 were the warmest six years on record and                 fewer people than in a 2 degree rise scenario
  2011-2020 was the warmest decade on record (Source: World
                                                                             Ȃ The proportion of birds, animals and plants that is projected
  Meteorological Organisation).
                                                                               to be geographically dislocated due to climate change will be
Ȃ Arctic sea ice is melting fast. Generally, the extent of the Arctic          half of that in a 2 degree scenario (but still substantial at 4%
  sea ice reaches its minimum each September and this minimum                  of vertebrates and 8% of plants)
  has been declining at a rate of 13.1% per decade (Source: NASA).
                                                                             Ȃ The estimated permafrost area that will thaw will be
  Unfortunately, it is not just the minimum. The extent of Arctic sea
                                                                               somewhere between 1.5 and 2.5 million square kilometres
  ice has been declining across all times of the year, the illustration
                                                                               smaller (more on permafrost below)
  of which has been dubbed the “Arctic death spiral” – see right
  hand chart below (Source: Arctic Death Spiral).                            Ȃ The proportion of population exposed to water stress caused
                                                                               by climate change would be half and 61 million fewer people
Ȃ If global warming continues to grow at the same (exponential)
                                                                               in Earth’s urban areas would be exposed to severe drought
  rate, global average sea levels could rise by up to 1.1 metres
  by 2100 (Source: IPCC) and by 0.5 metres by 2050 for over 570              Ȃ There would still be substantial changes. For example, the
  coastal cities. This could put over 800 million people at risk and           majority (70–90%) of tropical coral reefs that exist today
  create $1 trillion in economic cost (Source: C40 Cities). “Delta             will disappear
  cities” like Dhaka, Guangzhou, Ho Chi Minh City, Hong Kong,             Ȃ The world is on course for a 3.6 degrees rise in average global
  Manila, Melbourne, Miami, New Orleans, New York, Rotterdam,               temperature, which is almost two-and-a-half times the upper
  Tokyo and Venice, home to more than 340 million people, are               limit. The good news is that almost four years ago Schroders
  particularly vulnerable (Source: World Economic Forum).                   estimated it to be at 4.1 degrees, so at least the trajectory
                                                                            is in the right direction (Source: Schroders Climate
Arctic sea ice is melting fast                                              Progress Dashboard).

Average monthly Arctic sea ice extent each September                      Loss in the Arctic Sea ice volume (1970-2020)
(1979-2020)
Million square kilometres
9

8

7

6

5

4

3

2

1

0
    1979
    1981
    1983
    1985
    1987
    1989
    1991
    1993
    1995
    1997
    1999
    2001
    2003
    2005
    2007
    2009
    2011
    2013
    2015
    2017
    2019

                                                                                      Jan Feb Mar Apr May Jun Jul Aug Sep Oct Nov Dec

Source: NASA.                                                             Source: Arctic Death Spiral. Accessed in April 2021.

                                                                                                                                            2
Schroders Climate Progress Dashboard
Change in implied temperature rise since inception (in degrees Celsius)
                                 Imply higher
 3.0                                                                                                                      Imply lower termperature
                          termperature rises than
                                                                                                                             rises than mid-2017
                                  mid-2017
 2.0

 1.0

 0.0

 -1.0

 -2.0

 -3.0

 -4.0
         Climate Fossil fuel Fossil fuel Public Renewable   CCS     Political Corporate Political Electric Oil and gas Carbon
         finance production reserves concern      capacity capacity ambition planning     action vehicles investment prices
Source: Schroders calculations using inputs from various sources. Please see here for more details. Data updated as of end-March 2021

Our greenhouse gas emissions                                                                     Ȃ The largest emitters by region are: China (26%), the United
Ȃ Carbon dioxide in the atmosphere caused by human activities                                      States (13%), EU-27 (7.8%), India (6.7%) and Russia (5.3%). The
  rose by 48% over the 171 year period between 1850 and 2020.                                      top 10 emitters by country account for over two-thirds of global
  This was more than what happened naturally over a 20,000 year                                    emissions, over 50% of the global population and almost 60%
  period from the Last Glacial Maximum to 1850 (Source: NASA).                                     of the world’s GDP (Source: World Resources Institute).

Ȃ Who are the largest “emissions offenders”? There are two ways                                  Ȃ Covid-induced lockdowns and travel bans have made a
  to see this. The one is to look at it by sector. Most greenhouse                                 difference: global energy-related carbon emissions fell by
  gases are emitted in energy use in industry (24.2%), agriculture,                                5.8% in 2020, which is the largest annual decline since World
  forestry and land use (18.4%), energy use in buildings (17.5%),                                  War II (Source: International Energy Agency). Unfortunately,
  and transport (16.2%). Overall, the production of energy is                                      this is likely to be a one-off and despite the drop in 2020, the
  responsible for 87% of global greenhouse gas emissions                                           concentration of greenhouse gases now stands at record levels
  (Source: Our World in Data). The other is to look at it by human                                 (Source: World Meteorological Organisation).
  activities: making things (31%), plugging in (27%), growing                                    Ȃ The last time there was so much carbon dioxide in the
  things (19%), getting around (16%), and keeping warm and cool                                    Earth’s atmosphere was around 3.6 million years ago
  (7%) (Source: Bill Gates, How to avoid a climate disaster, 2021).                                (the Mid-Pliocene Warm Period which is commonly used
                                                                                                   for climate change analysis) (Source: National Oceanic and
                                                                                                   Atmospheric Administration).
Which activities are responsible for greenhouse
gas emissions?
Global greenhouse gas emissions by sector                                                        Greenhouse gas emissions by human activity
           Ag                                      tock
              ric
                 ult                         Lives nure
                                                   a
                     ura                    and m %)       Energ
                        l so                    (5.8            yu                               Making things
        Rice                 ils                                  se
             cultiv              (4.
                                    1%                               in                          (cement, steel, plastic)                                               31%
                    ation                                               in
                            (1.3% )                                       du
      Crop burn                     )
                  ing (3.5%
                              )
                                                                                st

   Deforesta
                                                                                  ry

             tion (2.2%               Agriculture,
                          )
                                                                                     (24

      Cropland (1                     forestry &
                   .4%)                                                                          Plugging in (electricity)                                            27%
                                                                                        .2%

    Grassland (0.1%)                  land use
                                      18.4%
                                                                                           )

    Landfills (1.9%)
 Wastewater (1.3%)          Was
                                   te 3
 Chemicals (2.2%)                       .2%
                          Industry                                                               Growing things
    Cement (3%)                                                  Energy                                                                                         19%
                            5.2%                                                                 (plants, animals)
    Energy in                                                     73.2%
    agriculture and
    fishing (1.7%)
                                                                                                 Getting around
                                                                                             )
                                                                                           .2%

  Fugitive emissions                                                                                                                                          16%
                                                                                                 (planes, trucks, cargo ships)
  from energy
                                                                                            16

  production (5.8%)
                                                                                          t(
                                                                                      or
                    fu
                    Un co

                                                                                 sp

                             ll                                                       n          Keeping warm and cool
                      el (7

                          m oca                                                   a
                       a

                        .8 bu ted                                              Tr                (heating, cooling,                             7%
                          % st
                           )    ion   En                                   )                     refrigeration)
                                           erg                           5%
                                              y use
                                                      in buildings   (17.

                                                                                                                                     0%     5% 10% 15% 20% 25% 30% 35%
Source: Our World in Data. Information as at 2016.                                               Source: Bill Gates, How to avoid a climate disaster, 2021.

                                                                                                                                                                            3
Our methane emissions                                                              Our use of fossil fuels
Ȃ Once emitted, methane stays in the atmosphere for about nine                     Ȃ Scientific research has established that emissions from our
  years but has a substantially higher warming effect than carbon                    burning of fossil fuels is the biggest cause of human-induced
  dioxide. When averaged over 20 years, methane’s warming                            climate change. The reason we are so reliant on fossil fuels is
  potential is 86 times higher than that of carbon dioxide. Over                     that since they don’t factor in the cost of climate change, they are
  100 years, one kilogram of methane has approximately 28                            cheap and produce vast amounts of reliable energy. One gallon
  times the warming impact of one kilogram of carbon dioxide                         of gasoline produces as much energy as 130 sticks of dynamite
  (Source: The Conversation).                                                        (Source: Bill Gates, How to avoid a climate disaster, 2021).
Ȃ Despite their relatively short life in the atmosphere, methane                   Ȃ When it comes to emissions, nothing is worse than coal: one
  emissions have so far driven between 23% and 40% of the total                      small coalmine is roughly equivalent to the annual carbon
  warming (Source: Our World in Data).                                               footprint of 650,000 people (Source: Mike Berners-Lee, How
                                                                                     bad are bananas?, 2020).
Ȃ A lot of methane is trapped in Arctic permafrost which means
  a vicious circle: methane emissions cause global warming,                        Ȃ We would need to leave 84% of the remaining fossil fuels in the
  which causes the Arctic to melt, which releases more methane                       ground to meet the 1.5 degrees target and 59% to meet the 2
  emissions etc. (Source: Schroders). This is sometimes referred                     degrees target. Only 4% of remaining fossil fuels would be left
  to as the “methane rebound”.                                                       untouched in a 3 degree scenario (Source: Financial Times).
Ȃ Currently, the main emitters of methane are agriculture and                      Ȃ Given our current levels of oil consumption and the known
  livestock, followed by waste (includes waste from food, burning                    world oil reserves, the world has about 47 years of oil left
  waste, wastewater treatment etc.) (Source: McKinsey).                              (Source: Worldometer).

Our energy use                                                                     Our use of renewables
Ȃ The average person uses about 59 kilowatt-hours every day,                       Ȃ More than 80% of all new electricity capacity added last year
  which in energy terms corresponds to approximately 6 litres of                     was renewable, with solar and wind accounting for 91% of new
  petrol (enough to drive a car for about 110km) or enough food                      renewables (Source: International Renewable Energy Agency).
  (calorific value) for 22 people for one day (Source: Mike Berners-                 As a result, the share of renewables in electricity generation is
  Lee, There is no planet B, 2019).                                                  expected to reach 30% in 2021. China is estimated to account
                                                                                     for about half of the global increase in renewable electricity
Ȃ We use over three times the energy we did 59 years ago. The
                                                                                     generation in 2021 (Source: International Energy Agency).
  development of new energy sources has added to our energy
  use rather than replaced old energy sources (Source: Mike                        Ȃ By 2050, the world will need to more than double the length
  Berners-Lee, There is no planet B, 2019).                                          of global power lines and transformers to enable the growth
                                                                                     of renewables, otherwise wind and solar farms will sit idle,
Ȃ In 2020, 83% of global energy consumption came from fossil
                                                                                     unable to send their power to the grid. On average, between
  fuels, one third of which was coal (Source: Schroders – see
                                                                                     5% and 10% of all electricity produced is lost on the grid due to
  chart below).
                                                                                     inefficient distribution systems (Source: Schroders).
                                                                                   Ȃ Solar and wind energy require substantial space to provide
                                                                                     energy. Fossil fuels and nuclear have at least 100 times more
                                                                                     power density (energy generation per square metre) than solar
                                                                                     energy and 500 times more than wind energy (Source: Bill
                                                                                     Gates, How to avoid a climate disaster, 2021).
Global energy mix over the last two centuries
Energy Demand By Energy Source (TWh)                                               Share of global energy consumed (forecast after 2020)
180000                                                                             100%

160000                                                                              90%

                                                                                    80%
140000
                                                                                    70%
120000
                                                                                    60%
100000
                                                                                    50%
 80000
                                                                                    40%
 60000
                                                                                    30%

 40000                                                                              20%

 20000                                                                              10%

      0                                                                              0%
       1800 1880 1960 1972 1980 1988                        1996       2004 2012          1800       1850        1900               1950       2000     2040
          Traditional biofuels Coal                                  Natural gas            Traditional biofuels  Coal             Oil and gas   Renewables
          Oil                  Nuclear                               Hydro
          Renewables
Source: IEA, IRENA, BNEF, SEIA, Schroders. Data from 1800 to 2017.                 Source: IEA, IRENA, BNEF, SEIA, Schroders. Information as at 31 December 2020.

                                                                                                                                                                    4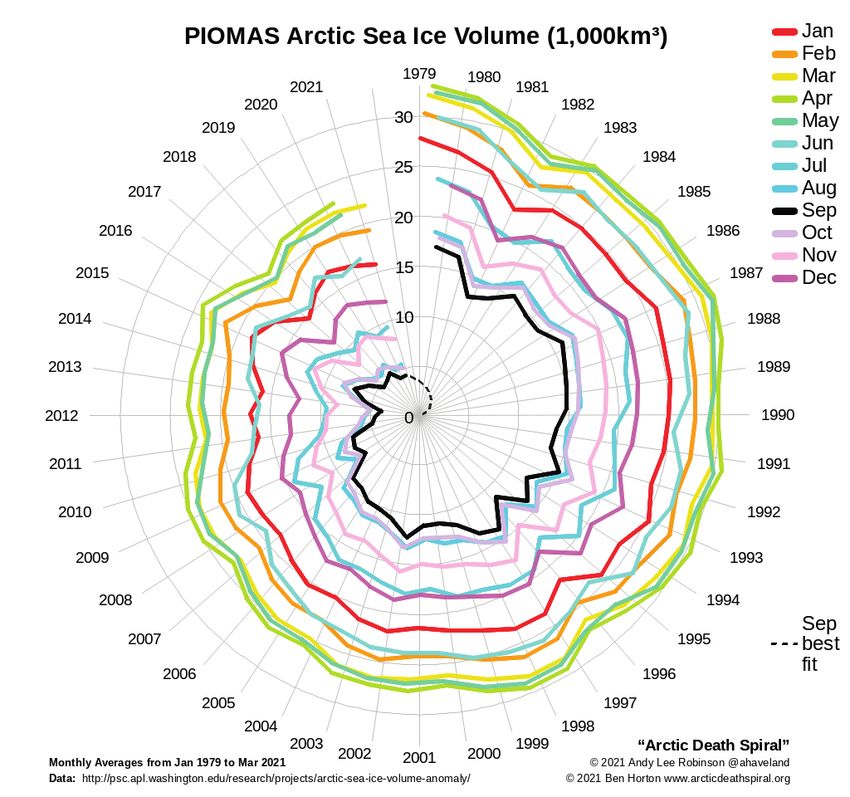
Ȃ With existing technology, nuclear energy remains the only               Our use of plastic
  energy source that is carbon-free and can deliver power reliably        The three main offenders in the carbon footprint of manufacturing
  with no interruptions. It accounts for 10% of world’s electricity       are steel, cement and plastic. Making one tonne of steel and one
  compared to 62% from fossil fuels (Source: Bill Gates, How to           tonne of cement produces about 1.8 and 1 tonnes of carbon
  avoid a climate disaster, 2021).                                        dioxide respectively. This is why steel and cement account for 8%
Ȃ Every bit of land we use for biofuels means that there is less          and 4.5% of the world’s carbon dioxide emissions. The biggest
  land available to grow food. The wheat required to power a              issue with plastic is what we most value in it: it does not degrade.
  Toyota Corolla on bioethanol for 1.1 miles could feed a person          Hence, it is one of the biggest sources of environmental pollution
  for a day (Source: Mike Berners-Lee, There is no planet B, 2019).       (Sources: Bill Gates, How to avoid a climate disaster, 2021; Mike
                                                                          Berners-Lee, How bad are bananas?, 2020).
Our transport
Ȃ The entire transport sector is responsible for about 16.2% of           Ȃ If nothing changes in human habits between 2016 and 2040,
  global greenhouse gases, putting it behind agriculture and                plastic waste generation is predicted to double, plastic leakage
  the energy we use to power and heat our buildings. Road                   in the ocean to triple and plastic stock in the ocean to more than
  transport and aviation account for 11.9% and 1.9% of global               quadruple. If we implement all existing government and industry
  emissions respectively. If we look at passenger use specifically,         commitments by 2040, we will manage to reduce annual plastic
  emissions are 7.1% and 1.5% from road transport and aviation              flows to the ocean by only 7% (Source: Pew Trust).
  respectively. So human use of cars has almost five times the            Ȃ If all the plastic we have discarded in the world were cling film,
  carbon footprint of flying (Source: Our World in Data).                   we would be able to wrap the whole planet one and a half times
Ȃ A drive in congested traffic can emit three times as much as the          in it (Source: Mike Berners-Lee, How bad are bananas?, 2020).
  same drive on a clear road (Source: Mike Berners-Lee, How bad           Ȃ Marine plastic pollution is already affecting more than 800
  are bananas?, 2020).                                                      species (Source: Pew Trust).
Ȃ Global sales of electric vehicles reached three million in 2020;        Ȃ Insufficient collection in rural areas has resulted in 45% of
  an increase of more than 40% from 2019. 46% of sales were                 today’s plastic leakage to the ocean. Approximately 4 billion
  in Europe, 39% in China, and 12% in North America (Source:                people will need to be connected to collection services by 2040
  McKinsey). But even if all new cars were electric now, it would           which means connecting about 500,000 people per day, every
  still take 15-20 years to replace the world’s fossil fuel car fleet       day, until 2040 (Source: Pew Trust).
  (Source: World Economic Forum).
                                                                          Ȃ The plastics that end up in our oceans and seas come mostly
Ȃ Cycling can result in 30 times lower emissions than driving a car         from flexible packaging, such as cling film and plastic bags
  powered by fossil fuels, and about 10 times lower than driving            (46% of leakage), multilayer plastics such as drinks cartons and
  an electric vehicle. (Source: The Conversation).                          diapers (26%) and microplastics (11%) (Source: Pew Trust).
Ȃ Strictly speaking, the carbon footprint of cycling depends on           Ȃ An average person could be ingesting 5 grams of plastic every
  what we eat to generate the energy to cycle. Getting the energy           week which is the equivalent of a whole credit card. The largest
  from burgers has almost 8 times the footprint of getting the              source of plastic ingestion is drinking water (Source: WWF).
  energy from bananas (Source: Mike Berners-Lee, How bad are
  bananas?, 2020). More on our eating habits follows below.

Putting aviation emissions into context

Share of each sector as % of global greenhouse gas emissions
(49.4 billion tonnes of carbon dioxide equivalent in 2016)

                        Other
                        23.7%
     Energy in
     buildings
      17.5%                                             Road       12%
                              Transport
    Agriculture,               16.2%
    forestry &
    land use                                            Aviation   1.9%
      18.4%      Energy in                              Rail       0.4%
                 industry                               Pipeline   0.3%
                  24.2%                                 Ship       1.7%

Source: Our World in Data. Emissions data as of 2016.

                                                                                                                                           5
Our food consumption Food: greenhouse gases across the supply chain
kg CO2 Ȃ equivalents per kg of foodstuff
Ȃ Protein from beef and lamb has 10 times more
emissions than poultry and fish and 30 times the Beef (beef herd) 59.6
emissions of pulses (Source: McKinsey). Lamb & Mutton 24.5
Ȃ The methane from beef has the same warming Cheese 21.2
effect as 2 billion tonnes of carbon dioxide and
accounts for about 4% of global emissions (Source: Beef (dairy herd) 21.1
Bill Gates, How to avoid a climate disaster, 2021). Chocolate 18.7
Ȃ A block of cheddar (250g) is equivalent to 10 kg of Coffee 16.5
carrots in terms of emissions generated. (Source:
Mike Berners-Lee, How bad are bananas?, 2020). Shrimps (farmed) 11.8
Ȃ Producing meat and dairy requires us to grow more Palm Oil 7.6
food. A chicken needs to eat two calories worth of Pig Meat 7.2
feed to give us one calorie of poultry. A pig eats
Poultry Meat
three times as many calories as we get when we 6.1
eat it. And cows need six calories of feed for every Olive Oil 6.0
calorie we get when we eat beef (Source: Bill Gates,
Soybean Oil 6.0
How to avoid a climate disaster, 2021).
Fish (farmed) 5.1
Ȃ Chocolate has almost the same carbon footprint
as beef (for dairy). The problem with chocolate is Eggs 4.5
that it contains some environmentally damaging
Rice 4.0
ingredients, such as dairy, cocoa, sugar, and palm
oil. And the land use impact of growing cocoa is Rapeseed Oil 3.7
the single biggest contributor to chocolate’s sticky Sunflower Oil 3.5
footprint (Source: Schroders).
Tofu 3.0
Ȃ A litre of orange juice has a carbon footprint similar
to over 6 kg of oranges due to additional emissions Milk 2.8
from processing, pasteurising, refrigerating, and Cane Sugar 2.6
the footprint from the carton (Source: Mike Berners-
Lee, How bad are bananas?, 2020). Groundnuts 2.4
Ȃ About six garbage trucks full of edible food is lost Oatmeal 1.6
or wasted every second (Source: Ellen MacArthur Other Pulses 1.6
Foundation). This corresponds to around 25% of
Wheat & Rye (Bread)
the calories the world produces (Source: Our world 1.4
in data). Tomatoes 1.4
Ȃ When wasted food rots, it produces enough Beet Sugar 1.4
methane to cause as much warming as 3.3 billion
Wine 1.4
tonnes of carbon dioxide each year (Source: Bill
Gates, How to avoid a climate disaster, 2021). This is Barley (Beer) 1.1
roughly three times the greenhouse gas emissions Maize (Meal)
from the aviation sector (Source: Our world in data). 1.1
Berries & Grapes 1.1
Ȃ Consumption patterns of G7 countries cause the
loss of 3.9 trees per person per year, on average. Soymilk 1.0
Chocolate consumption in the UK and Germany Cassava 0.9
can drive deforestation in Ivory Coast and Ghana.
Beef and soy demand in the US, the EU and China Peas 0.8
causes deforestation in Brazil. Drinking coffee in Bananas 0.8
the US, Germany and Italy causes deforestation in
central Vietnam. Demand for timber in China, South Other Fruit 0.7
Korea and Japan results in deforestation in northern Other Vegetables 0.5
Vietnam (Source: Hoang and Kanemoto, Mapping
Brassicas
the deforestation footprint of nations reveals 0.4
growing threat to tropical forests). Potatoes 0.3
Ȃ Deforestation accounts for about 30% of all Onions & Leeks 0.3
agriculture-related emissions (Source: Bill Gates,
Root Vegetables 0.3
How to avoid a climate disaster, 2021). One
deforested hectare (about the size of a rugby field) Apples 0.3
results in emissions equivalent to driving a car 50- Citrus Fruit
100 times around the Earth (Source: Mike Berners- 0.3
Lee, How bad are bananas?, 2020). Nuts 0.2
-10 0 10 20 30 40 50 60
Land use change Animal Feed Farm Processing Transport Packaging Retail
Source: Our World In Data, January 2020. Data source: Reducing food’s environmental impacts
through producers and consumers, Science, Poore, J., & Nemecek, T, 2018.
6Our impact on biodiversity
Ȃ The world population (7.6 billion) represents just 0.01% of all
living things by weight but human activities have managed
to cause the loss of 83% of all wild animal and half of all plant
species (Source: World Economic Forum).
Ȃ 1 in 8 species is threatened with extinction, in many cases
within decades (Source: United Nations).
Ȃ Human activity has significantly changed 75% of the land-
based environment and about 66% of the marine environment.
More than a third of the world’s land surface and nearly 75%
of freshwater resources are now devoted to crop or livestock
production (Source: United Nations).
Ȃ Only 2% - 3% of the Earth’s land surface can be considered
ecologically intact (Source: World Economic Forum).
Ȃ Loss of biodiversity is bad news for human health as it means:
less rich and diverse diet, more diseases as human activities
encroach upon the natural world, fewer natural ingredients that
serve as sources for pharmaceuticals, fewer buffers from natural
disasters such as floods (Source: World Economic Forum).
Our use of information technology and communications
Ȃ Our use of phones, computers, tablets, TVs, networks and even
cryptocurrencies accounts for 2.5% of global emissions (Source:
Mike Berners-Lee, How bad are bananas?, 2020).
Ȃ A new laptop has the footprint of a flight from London to
Rome but its use is low-carbon. A video call has similarly low
emissions but can save emissions by reducing travel from
people going to the same point (Source: Mike Berners-Lee,
How bad are bananas?, 2020).
Ȃ Most of the emissions from a smartphone are caused by its
manufacture and transport. Using a smartphone is a low-
emitting activity: it would take approximately 34 years of
average smartphone use for the electricity footprint to equal
the footprint from making and transporting the smartphone
(Source: Mike Berners-Lee, How bad are bananas?, 2020).
Ȃ The annual energy consumption of Bitcoin (120 terawatts)
is similar to that of the Netherlands. The emissions from a
$1billion inflow into Bitcoin are equivalent to 1.4 coal fired
power plants per year or the yearly energy use of 632,000
homes. The high carbon footprint is mainly driven by the
mechanisms set in place to prevent a hack (Source: Bank
Our use of fashion of America Global Research).
Ȃ The fashion industry accounts for 10% of annual global
emissions and is a major driver of deforestation and soil
degradation (Source: European Parliament Think Tank).
Ȃ In the last 15 years, clothing production has doubled while
our use of clothing has declined by almost 40% (Source: Ellen
MacArthur Foundation).
Ȃ As much as 30% of clothes are over-produced and thrown
away without anyone having worn them (Source: European
Parliament Think Tank).
Ȃ We throw away more than half of “fast fashion” within a year
of its production. It is estimated that one truckload of clothing
is landfilled or burned every second (Source: Ellen MacArthur
Foundation).
Ȃ The fashion industry consumes 1.5 trillion litres of water each
year and causes 20% of global clean water pollution (Source:
European Parliament Think Tank).
Ȃ It can take 2,700 litres to produce the cotton needed to make a
single t-shirt. This amount equals a person’s drinking needs for
2.5 years (Source: WWF).
7What can each of us do? Individual actions that may seem less obvious include:
The facts about climate change create one long list of bad news. Ȃ Writing to the manufacturers of products we buy to ask them
The good news is that since climate change and environmental to provide carbon footprint information (one that includes the
damage is caused by human behaviour then we, humans, can footprint of supply chains) or use biodegradable packaging.
prevent further damage by changing our behaviour. Simply signalling greater demand for something could be
enough of an incentive for a product manufacturer to start
To state the obvious, there is no silver bullet. This problem is so thinking about it.
multifaceted that many things need to happen together. This Ȃ Contacting the local government representative to understand
in itself is perhaps part of the challenge as we are faced with their intentions about environmental policy. This is part of our
one massive tragedy of the commons: our habits harm the rights as constituents and we can (literally) vote with our feet if
environment but no one is individually accountable or responsible we want.
for fixing it. Hence, the main (but not only) driver in managing
climate change will have to be government policy. It is immensely Ȃ Raising awareness among a bigger audience by organising local
good news to see so many governments around the world community groups and even protests. If you think this cannot
committing to a net zero emissions target. bring anything I have two words for you: Greta Thunberg.
Ȃ Where investment is an option, choosing an investment
For us as individuals, it may be very tempting to put this in the product that allocates money in a way that supports
“too difficult” or “I couldn’t possibly make a difference” bucket. The environmental goals and contributes towards net zero
reality is that each one of us must change a great many aspects of emissions by 2050. Schroders has put together a glossary of
our lives and everyday habits. key sustainability terms for investors to help them navigate this
field: An A-Z of sustainability terms for investors
What can individuals do?
First of all, we need to educate ourselves. We need to become as What is Schroders doing?
climate change savvy as possible, not least so that we can judge Asset managers are in a key position and can have a significant
which changes can make the biggest difference to our own carbon impact by allocating capital to economic activities that contribute
footprint. The evidence suggests that we are not as good at it as to the transition. At Schroders, we use a multipronged approach.
we may think (Source: Ipsos).
Integrating climate change risk in our investment decisions
The good news is that there is no shortage of material out there.
A quick internet search will point to numerous books, research Schroders has invested heavily in proprietary research and tools
reports by independent organisations, documentaries to help our investment desks to better understand the risks
and podcasts. climate change poses to investments. These tools include:
Ȃ Climate progress dashboard: estimates the average global
Moreover, it has become easier to calculate our own carbon temperature increase implied by indicators measuring progress
footprint. This is important as we can’t reduce what we can’t in political action, business and investment, technology
measure. Again a simple internet search produces several options. development and fossil fuel use.
Second, we can use our power as consumers and as voters. Some Ȃ Carbon Value at Risk (VaR): estimates the impact of rising
changes will probably seem quite obvious: carbon costs on a company’s profitability. We find that up
to 20% of the value of global equity indices is at risk under a
Ȃ Developing greener transport habits such as driving less, using scenario in which we transition toward the commitments made
more public transport, cycling or walking. In the case of electric under the Paris Agreement. On the other hand, up to $2 trillion
vehicles, it is important to make sure that the electricity that of investment will be needed every year to meet those goals,
powers the car is not reliant on fossil fuels with commensurate opportunities.
Ȃ Changing our diets by consuming less meat in general (red Ȃ Physical risks: estimates what businesses would have to pay to
meat in particular), eating more grains, opting for organic insure their physical assets against hazards caused by rising
and fair-trade food, buying local products where possible, and global temperatures and weather disruption. The potential
wasting much less of every food item we buy costs to some companies of insuring their assets against the
Ȃ Exhausting all possibilities of repairing or re-using before impact of climate change could equate to more than 4% of their
replacing and recycling market values, according to our physical risk assessment. We
find that oil & gas, utilities and basic resources are the sectors
Ȃ Appreciating all the clothes we already have much more and
most exposed to the physical impact of climate change while
wearing them for as long as possible
technology, personal & household goods and healthcare are
Ȃ Cutting out single-use plastics such as cups or straws, and the least exposed.
reducing the amount of plastic we throw away, for example by
Ȃ Stranded assets risk: estimates the impact on the value of the
using bags for life instead of plastic bags and using re-fillable
reserves fossil fuel producers own but would be unable to
and re-usable containers (even if they are plastic!) for food,
develop if the global economy transitions toward a 2 degrees
cleaning products etc.
pathway.
Ȃ Renovating our homes to insulate them better and opting for a
Ȃ Climate change growth model: measures the positive or
greener energy provider
negative impacts on companies’ value from the faster or slower
growth in demand for different products and services resulting
from a low carbon transition.
8Ȃ SustainEx: estimates the positive and negative externalities Light at the end of the ‘climate change’ tunnel
that companies have on society. This is made up by about 50
Each one of us needs to become more climate change savvy.
indicators (including carbon emissions) and using academic
We need to understand why climate change is happening, how
research, reported data and big data analytics, we translate all
human behaviour contributes to it and what we can change to
externalities into a concrete financial figure. This then serves as
prevent irreversible damage to our planet.
a measure of risk that these externalities pose for the value of
each company. There is no shortage of knowledge material on climate change.
Ȃ Long-term asset return forecasts: our economics team has The issue is not where to start but rather to not get discouraged
adjusted its 30-year asset return forecasts to reflect the physical by the magnitude of the problem. The truth is that learning about
and transition risks of climate change. climate change involves being confronted with an endless array
of very bad news. It is an intense experience but we simply cannot
Active ownership afford to stay in denial.
We engage with companies to make sure that they are aware of
the risks and opportunities that climate change may pose for their We may not be able to change what will happen in the next couple
business model and that they are adapting accordingly. of decades as our past actions have already set this. But we can
change what will happen in the second half of this century which
Often our proprietary tools will flag a specific risk which we is the future that our children will experience. That is why we must
then use in our discussion with companies as well as to monitor focus on both climate change adaptation for the near-term future
progress afterwards. Put in a different way, our tools help us and climate change mitigation for the longer-term future.
identify which companies are most exposed to climate change risk
and active ownership is about supporting and monitoring how It is easy to think that no one can make a difference. If Greta can,
companies are managing and adjusting to this risk. so can we!
Moreover, Schroders is pushing for best practice. For example, our
CEO wrote to FTSE 350 companies asking them to produce and
publish detailed, costed, transition plans.
Schroders as a corporate
Schroders is a company that itself needs to be aware of climate
change risks and adapt.
Schroders is one of the few asset managers to have committed
to the Science-based Target Initiative. This means that we commit
to set targets to reduce our carbon footprint in line with the Paris
Agreement, including Scope 1, 2 and 3 emissions1, as well as
report on progress every year.
Moreover, we are part of the Net Zero Asset Managers Initiative,
which includes 73 asset managers with combined assets of $32
trillion that have committed to support the goal of achieving net
zero greenhouse gas emissions by 2050.
The reason asset managers’ net zero pledges are important
actually lies in the assets that they manage. According to
Schroders estimates, the asset management sector is the third
lowest emitting sector if one considers only Scope 1 and 2
emissions. The carbon footprint, however, increases substantially
if Scope 3 emissions are added, which includes emissions of
companies in which asset managers invest and the assets that
they own. These account for 97% of the asset management
sector’s emissions and if we include them in our analysis, the asset
management sector becomes the third highest emitting sector.
1 For company reporting, there are three types of emissions: Scope 1: direct emissions
from owned or controlled sources; Scope 2: indirect emissions from the generation
of purchased energy; Scope 3: all indirect emissions that occur in the value chain,
including those related to the use of its products.
9Important Information The views and opinions contained herein are those of the authors Any data contained in this document have been obtained from sources as at the date of publication and are subject to change due to we consider to be reliable. Schroders has not independently verified or market and other conditions. Such views and opinions may not validated such data and they should be independently verified before necessarily represent those expressed or reflected in other Schroders further publication or use. Schroders does not represent or warrant communications, strategies or funds. the accuracy or completeness of any such data. This document is intended to be for information purposes only. The All investing involves risk including the possible loss of principal. material is not intended as an offer or solicitation for the purchase or sale of any financial instrument or security or to adopt any investment Exchange rate changes may cause the value of any overseas strategy. The information provided is not intended to constitute investments to rise or fall. Past Performance is not a guide to future investment advice, an investment recommendation or investment performance and may not be repeated. This document may contain research and does not take into account specific circumstances of “forward-looking” information, such as forecasts or projections. any recipient. The material is not intended to provide, and should Please note that any such information is not a guarantee of any future not be relied on for, accounting, legal or tax advice. Any references performance and there is no assurance that any forecast or projection to securities, sectors, regions and/or countries are for illustrative will be realised. For your security, communications may be taped purposes only. or monitored. Information herein is believed to be reliable but Schroders does not To the extent that you are in North America, this content is issued by represent or warrant its completeness or accuracy. No responsibility or Schroder Investment Management North America Inc., an indirect liability is accepted by Schroders, its officers, employees or agents for wholly owned subsidiary of Schroders plc and SEC registered adviser errors of fact or opinion or for any loss arising from use of all or any providing asset management products and services to clients in the part of the information in this document. No reliance should be placed US and Canada. For distributing in the UK, this content is issued by on the views and information in the document when taking individual Schroder Investment Management Limited, 1 London Wall Place, investment and/or strategic decisions. Schroders has no obligation to London, EC2Y 5AU. Registered No. 1893220 England. Authorised notify any recipient should any information contained herein change and regulated by the Financial Conduct Authority. For your security, or subsequently become inaccurate. Unless otherwise authorised by communications may be taped or monitored. Schroders, any reproduction of all or part of the information in this document is prohibited. 601180
You can also read