Don't sleep and drive - VW's fatigue detection technology
←
→
Page content transcription
If your browser does not render page correctly, please read the page content below
Don’t sleep and drive –
VW’s fatigue detection technology
von Jan, T.; Karnahl, T.; Seifert, K.; Hilgenstock, J.; Zobel, R.

Summary
This paper takes an in-depth look at an innovative
driver state monitoring system, which VW has
developed to assist drivers. The system is designed
to help drivers manage their physical and mental
resources properly when they are behind the wheel.

The article begins by explaining the motivation that
led to the development of the system and then goes
on to discuss the characteristics of the physical and
cognitive states under observation as well as the
system hardware and software components. The
reader is given an insight into the empirical deriva-
tion of the prediction algorithm. The article also
presents the results of the initial customer survey.
                                                                     Fig. 1: Maximum injury in car collisions
1 The human factor in car acci-                                      overall in relation to maximum injury in car
  dents                                                              collisions caused by fatigue
Human error is known to be a causal factor in many
accidents. There are, however, various aspects of                   These facts motivated the research team at VW to
driver error, and an analysis of these aspects can be               investigate driver state recognition systems and
used to derive better engineering solutions for hu-                 look for suitable solutions to the problem.
man-machine interaction. Various proposals have
been put forward as the basis for an analysis of                    1.1    Driver state recognition as an
human error including Norman (1981), Rasmussen
(1982) and Reason (1990). Human error is ex-                               active safety measure
plained by shortcomings in perception, interpreta-
tion of information, decision-making, information                   A whole range of improvements in vehicle design
recall and direct performance of an action. How-                    and the provision of airbags and safety belts as
ever, general physical and cognitive aspects such as                standard equipment are safety measures, which
attention and fatigue also play an important role,                  have helped reduce the effects of accidents on vehi-
because they affect other cognitive processes. The                  cle occupants in general and drivers in particular.
driver’s state has a crucial influence on perform-                  However, it takes active safety measures to actually
ance reserves at any point in time and consequently                 provide a chance of preventing accidents. Active
on the conditions that determine the driver’s ability               safety systems, which have proven to be effective
to operate the vehicle safely.                                      such as ESP and ABS help the driver control the
                                                                    vehicle. Driver state monitoring can also be re-
Accident statistics provide grim evidence of the                    garded as an active safety measure, because the
effects that driver fatigue can produce. The percent-               goal is to evaluate the driver’s performance re-
age of accidents caused by fatigue varies between 5                 sources. It can provide prospective information to
– 25 % depending on the individual study. One                       drivers about their condition, and the vehicle can
essential characteristic of these accidents is the                  automatically adapt to changes in the driver’s per-
disproportionate severity of injuries, as can be seen               formance capabilities. Other driver assistance sys-
from the graph (Fig. 1). The explanation for this                   tems can, for example, provide warning in a more
phenomenon can be derived directly from the ef-                     timely fashion to give the driver more time to react.
fects of fatigue. When drivers are tired, they fail to
take any action at all to avoid an accident (espe-                  There are difficulties with the methods that are used
cially braking or steering). Fatigue impairs percep-                to assess the driver’s state and the driver’s fatigue
tion and the ability to make the decision to react,                 level in particular. This in turn creates a problem
and it also degrades actual performance of the ac-                  when an attempt is made to test the suitability of
tion(s).                                                            fatigue recognition technology. At first, the answer
                                                                    to the question “what is fatigue?” appears to be
                                                                    quite straightforward. However, research on this
                                                                    phenomenon is still incomplete, and it is not possi-

                                                                                                  Tycho von Jan 1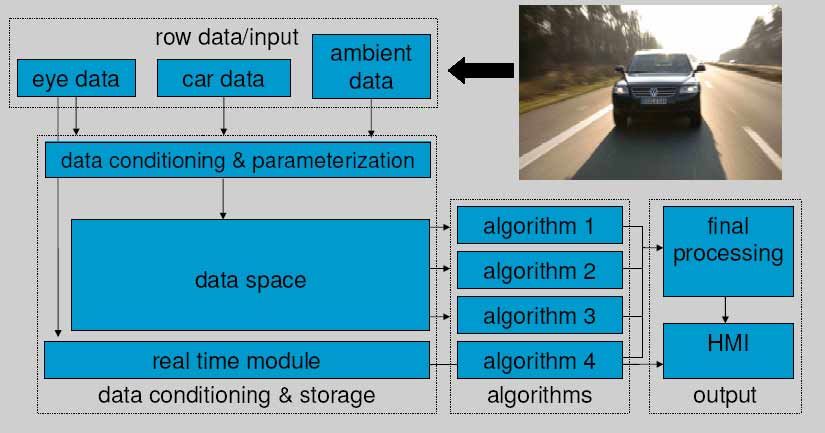
ble at this time to provide an exact, quantitative               (2) cognitive (perception and information
assessment of fatigue. There is no generally ac-                     processing)
cepted “golden rule” and no fatigue metrics that can
                                                                 (3) motor (behavior)
be used to calibrate a fatigue recognition system
(Bittner et al., 2000).                                          (4) subjective (experience)

There are also limits to the effectiveness of atten-    Changes in the first three categories are generally
tion monitoring systems in real-life driving situa-     accessible for observation and “objective” meas-
tions. Monitoring the gaze position or head orienta-    urement, but this is not the case for the subjective
tion is one plausible method, which can be used to      experience of a fatigued person. In addition, there is
assess visual attention and ensure that drivers have    often no direct correlation between “objective”
access to essential information. Ease-of-use consid-    parameters and subjective experience (“Paradoxien
erations dictate that the assessment must take place    des Müdigkeitsgefühls”, Hacker, 1980, pp.70ff.).
without contact and without the need for calibration
by the driver, and this presents an additional engi-    Because the terms are not clearly defined, the
neering challenge. One fundamental problem with         boundary between the symptoms and the effects of
this type of measurement is that “looking at some-      fatigue is not well-defined. In practice, there is
thing” does not necessarily mean, “being aware of       actually no need to make a theoretical distinction.
something”.                                             The symptoms and effects of fatigue can be sum-
                                                        marized as follows (Tab. 1; refer to FHWA, 1997):
1.2    What do we mean by attention
                                                        Category            Symptoms and effects of
       and fatigue
                                                                            fatigue
Attention is a concept, which we have all experi-       physiological       •    reduced psycho-
enced and which seems plausible to us. However, it                               physiological stimulation
actually refers to a multi-faceted phenomenon.
Attention is an essential prerequisite, which enables   cognitive           •    reduced alertness and vigi-
a person to select information, which is coming                                  lance
from the person’s surroundings, process the infor-                          •    information processing and
mation and control action (James, 1890). Attention                               decision-making takes
can be focused intentionally in an attempt to locate                             longer
information or unintentionally as a result of physi-
cal stimulus. Attention can be focused on one spe-      motor               •    reaction time increases
cific area, or it can be divided to a certain extent                             when critical events occur
between several areas. Training and factors such as                         •    control reactions are more
fatigue and motivation can influence the degree to,                              variable and less effective
which attention and cognitive resources can be                              •    reduced preparedness to
divided. Another aspect of attention is vigilance,                               react
which means maintaining focus. A person needs to
be vigilant to perform a task over a long period of
time. All of these factors are important for drivers,    Tab. 1: Classification of fatigue symptoms
because they make available the cognitive and            and effects
physical resources needed to carry out an activity.
                                                        Brown (1994) believes that the main effects of
Fatigue is another phenomenon that influences a         fatigue are a progressive withdrawal of attention
person’s ability to perform a task on various levels.   from traffic and what is happening on the road
Hacker (1989) defined fatigue as a “state in which      combined with a more risky approach to decision-
performance capabilities are temporarily impaired       making.
by continual activity demands which exceed the
ongoing capacity to restore performance capabili-       Brown (ibid) suspects that reduced alertness is most
ties.” A dangerous situation occurs when the driver     often the result of eyelid closure, which accompa-
of a vehicle suffers from psychological fatigue         nies fatigue. He also describes another effect of
(temporary impairment of information acquisition        fatigue on drivers as “driving without awareness”
and processing capabilities).                           (DWA). When road and traffic conditions are not
                                                        very demanding, the driver’s attention is gradually
The effects of psychological fatigue manifest them-     diverted from traffic to distracting thoughts. This
selves in four categories:                              state of inattentiveness is caused by the fact that
         (1) physiological (regulation of the vege-     visual search behavior in the presence of highly
             tative and nervous system)                 repetitive and predictable visual stimulus is deter-
                                                        mined to an increasing extent by internal oculomo-
                                                        tor control (top down) rather than by the actual task

                                                                                       Tycho von Jan 2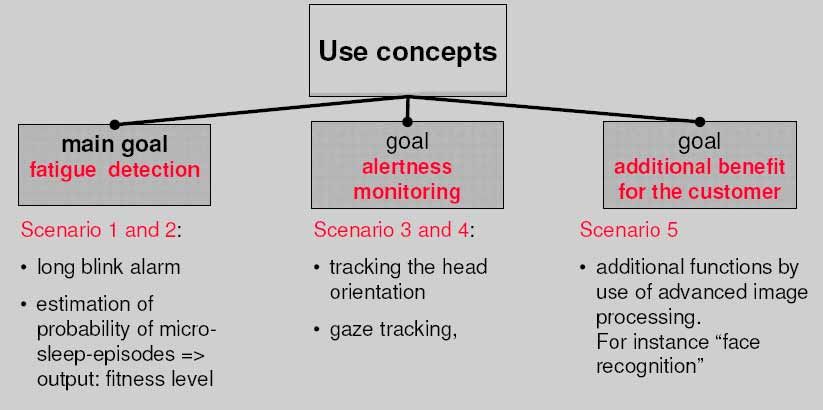
at any moment in time. Regarding the practical           stems from the fact that “fatigue” is a vague con-
effects of this state, Brown (ibid) concludes that       cept, which is used as a general term to describe
DWA will increase the probability of rear end colli-     phenomena, which result from a variety of factors.
sions in particular, whereas the likelihood that the     Literature published in English uses the following
vehicle will leave the road without another vehicle      terminology in this context: “fatigue”, “sleepiness”,
being involved will increase if drivers close their      “drowsiness”, “microsleeps”, “attention”, “alert-
eyes.                                                    ness”, “vigilance“, “hypovigilance”, “performance
                                                         variability”, “error vulnerability” etc. These terms
Knowledge about how fatigue progresses over time         or more or less used synonymously.
is vital for the development of a fatigue recognition
system. Many studies have shown that driver fa-          At first, the answer to the question “what is fa-
tigue occurs intermittently. There is not a linear       tigue?” appears to be quite straightforward. How-
increase in fatigue level when drivers with sleep        ever, research into this phenomenon is still incom-
deprivation are at the wheel for long periods of         plete, and it is not possible at this time to perform
time. Instead, there is a sequence of episodes in-       an exact, quantitative assessment of fatigue level.
volving fatigue and reduced alertness with a general     There is no generally accepted “golden rule” and no
tendency towards increased fatigue (e.g. Hargutt &       fatigue metrics that you can use to calibrate a fa-
Tietze, 2001; Bittner et al., 2000; Richardson et al.,   tigue recognition system (Bittner et al., 2000).
1997). These findings are in agreement with “clas-
sical” results from general fatigue research, which      2 VW’s approach to
describe repeated short blocks or lapses during
vigilance tasks interspersed between periods of            (in)attentiveness and fatigue
normal performance (Warren & Clark, 1937).
                                                         As can be seen from the information presented in
The theoretical explanation for these observations is    the previous sections, fatigue in general is a very
that fatigue does not develop as part of a passive       complex phenomenon. It has been the subject of
process. What we actually see is interaction be-         intense scientific study, and drowsiness at the wheel
tween deactivation processes and compensation            is a very familiar cause of accidents. Fatigue and
processes. A driver can, for example, react when he      the resulting microsleeps are merely a subset of the
realizes that he is getting tired and change the way     potential causes of accidents, which can be traced to
he is driving to compensate for the (perceived or        a lack of fitness or performance capability on the
suspected) impairment of his ability to react. As a      part of the driver. From the pragmatic standpoint,
result, it is much more difficult to demonstrate a       fatigue and lack of alertness and the effects on
fatigue-related decrease in performance under real-      driving may be summarized under the term inatten-
istic conditions than during “artificial” trials under   tiveness. To put it another way, fatigue is one of a
laboratory conditions. According to Hockey (1993),       number reasons for inattentiveness (Brown, 1994).
people adopt a performance protection strategy           Inattentiveness is a major cause of accidents and
when they are doing something that they perceive         can occur when the driver is reading traffic signs or
as being important. A modified action strategy can       talking with passengers in the vehicle. Unless an
to some extent compensate for reduced perform-           accident or dangerous incident occurs, the driver is
ance capabilities. Determining where the limits of       unlikely to even notice the inattentiveness. That is
this ability to compensate lie is subjective and de-     one of the reasons why our customers perceive
pendent on the situation. The limits vary and are        fatigue to be a more significant problem than inat-
difficult to predict.                                    tentiveness. Nearly all drivers can remember a
                                                         situation when they were driving while they were
As a result of interaction between the deactivation      tired whether or not they had trouble controlling the
and compensation processes, fatigue manifests            vehicle as a result of fatigue. This means that a
itself more as an increasing variability in perform-     system that addresses the general problem of inat-
ance than a steady decline in performance (Dinges        tentiveness would be more effective in increasing
& Kribbs, 1991).                                         traffic safety. Customers are more concerned with
                                                         fatigue and microsleep, and media reports tend to
The factors, which systematically determine the          reinforce this attitude.
variation between alertness and blockages from one
minute to the next remain unknown. Technology            To make a valid assessment or relatively reliable
designed to recognize blockages in information           estimate of a driver’s fatigue level and provide a
processing and the activity of drowsy drivers must       timely recommendation for action to be taken be-
be designed to monitor changes continually (Dinges       fore a dangerous situation arises, represents a sig-
et al., 1998).                                           nificant challenge (see section 1). Deciding whether
                                                         a driver is paying sufficient attention to traffic is far
A fundamental problem in the validation of fatigue       more complicated.
recognition technologies is the selection of a suit-
able criterion (Hartley et al., 2000). The difficulty

                                                                                         Tycho von Jan 3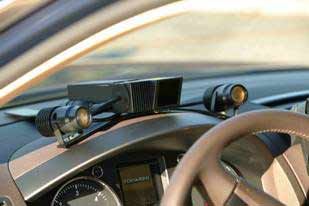
What is the best way to assist the driver, give him      include parameters such as the position of the head
information about his condition and help him drive       with relation to the chassis, gaze position parame-
the vehicle? To find an answer to this question, we      ters and eyelid data. The change in eyelid spacing
will start by using a pragmatic conceptual model.        (the distance between the upper and lower eyelid)
How, for example, can we tell whether persons            over time can be used to calculate the frequency
attending a meeting are attentively following what       and duration of eyelid motion and other parameters.
is going on or instead have nearly fallen asleep? We     Parameters derived from eyelid motion are then
can find out or at least make a reasonable assess-       used to generate an estimate of the driver’s fit-
ment by watching their faces. Are they looking at        ness/fatigue level. An assessment of attentiveness is
the speaker’s charts at the front of the room? Are       based on head and gaze position.
they looking out the window or flicking through
their notes with a bored expression of their faces?      The on-board system also includes an image proc-
Do they already have “heavy” eyelids that open and       essor, which analyzes the images and performs the
close slowly and almost remain closed?                   necessary calculations.

This tells us that one way to assess the fitness level   The way in which the camera is integrated into the
of another person or a driver is to observe the face,    vehicle is largely determined by the cabin design
head and eyes. We can draw conclusions about a           and the need to position the camera so that it can
driver’s alertness if we can determine what seems        monitor the head and especially the eyes. The cam-
to be holding the driver’s attention, what direction     era’s location, orientation and field of view must be
he has turned his head in or where he is looking. If     adapted to suit the particular vehicle.
we can determine whether and how a driver’s eye-
lids are moving or whether they are actually closed,     Once the system is activated, the image processor
we can assess whether the driver is tired. The VW        reads the data that is sent periodically from the
approach is to transfer this human assessment capa-      camera and performs the necessary processing
bility to a technical system, which vigilantly ob-       steps. The processor must be able to calculate the
serves the driver.                                       parameters in real time. The system also includes
                                                         light sources to provide adequate illumination under
The on-board equipment needed to monitor and             all ambient conditions.
assess or estimate the driver’s state is as follows:
       • a video sensor (camera), which can              The data from the system is fed into a fatigue moni-
            provide an image of the driver in all        toring system and the result (e.g. a warning) is
            lighting conditions and with sufficient      passed onto a human-machine interface.
            resolution, and image processing soft-
            ware as part of the camera, which iden-      The observation camera system mounted in the
            tifies parameters such as eyelid opening,    cabin contains the following components:
            head position and gaze position.             • camera
       • a prediction algorithm, which calcu-
                                                         • image processor
            lates or estimates the driver’s fit-
            ness/fatigue level based on eye closure      • light sources
            data
       • logic or an algorithm, which accepts the        Similar camera systems and video sensors are al-
            various inputs and provides a suitable       ready being used in laboratory trials in a wide range
            output to a human-machine interface.         of applications. The challenge is to adapt these
                                                         systems to the vehicle and make them suitable for
Proposed solutions for a driver state monitoring         use in that environment. We also have to be able to
system, the associated difficulties with the system      produce sufficient quantities of the camera in high
and the resulting technical requirements are pre-        volume production.
sented below. We will also describe our first on-
board engineering prototype and what our custom-         2.1.1 System components
ers think of this approach.
                                                         2.1.1.1 Camera
2.1    Video sensor (camera) and image                   A camera is mounted in the cabin to supply a video
       processing                                        signal, which provides an image of the driver’s
                                                         head, the area around the eyes and certain facial
We use a video camera, which is suitable for vehi-       features to the image processor. The camera is
cle-based applications to monitor the driver. The        connected directly to the processor’s video input,
camera is positioned so that we can monitor the          and it must meet certain technical requirements
driver’s head and especially the eyes. We want to        including for example adequate resolution, frame
measure the movement of the head, eyes and eye-          rate and sensitivity.
lids with the aid of the camera. The output should

                                                                                       Tycho von Jan 4
The field of vision must include the driver’s face in • A status value should be made avail-
all seating positions if possible without the need for able with very low latency. The status
any camera adjustments. The camera must be able should include data on the driver’s cur-
to accommodate variations in the size, possible rent position, approximate orientation
seating positions and posture of different drivers. and eyelid opening status.
Body sizes can range from the 5% female to the • The system must reliably flag meas-
95% male. Possible body and head posture must urement dropout or errors.
also be taken into account. The camera must offer a • It should provide data on head position
certain depth of field because the distance between particularly on the x-y axis (left and
the camera and the driver can vary depending on right rotation) over a wide range and
the driver’s seating position. The camera’s periph- within a relatively small angular drift.
eral field of view also must be defined. Head orientation in the x-z axis (nod-
ding) over a small range is also impor-
Additional simulation and in-vehicle testing are tant.
required to arrive at a precise definition of the re- • Using the head position as the basis,
quired field of vision. Fig. 2 shows a sample study. the next step is to determine the gaze
position relative to a fixed, defined
cabin element. Qualitative differentia-
tion is required to determine whether
the driver is looking at the instrument
panel (multi-function control, radio,
etc.), looking out at traffic through the
windshield on the driver’s side, looking
through the windshield on the passen-
ger side or looking out the side win-
dow. Testing must be carried out to
check whether it is possible to reliably
determine when the driver is looking at
the inside or outside mirrors.
• Capability to perform additional functions
such as driver identification would in-
crease customer benefit.
Fig. 2: Example - camera integrated in Only specific operational criteria will be added to
the A-pillar, Volkswagen Phaeton this long list of requirements.
2.1.2.1 Operational criteria
2.1.1.2 Light sources
The functional requirements must be fulfilled in a
Light sources are needed to ensure sufficient illu- variety of situations. These operational criteria are
mination of the object under all ambient conditions. essentially divided into ambient criteria and person-
They must be adapted to suit the size and shape of related criteria.
the particular vehicle. The amount of light emitted
in the visible spectrum must be so low that the
driver does not notice it. The light sources must be 2.1.2.2 Ambient criteria
safe for the eyes, and they must comply with appli-
cable legislation. The system must continue to operate reliably re-
gardless of ambient lighting conditions. It must be
able to handle the full range of light intensity that is
2.1.2 Image processing functional likely to occur during vehicle operation, ranging
requirements from total darkness to direct sunlight. The system
must also be able to handle rapidly changing light-
The cabin-mounted camera system must essentially ing conditions (e.g. travel along a tree-lined road
perform the following functions: with sunlight from the side). On systems that oper-
• It must detect whether someone is sit- ate in the near-infrared range, consideration must be
ting in the driver’s seat. given in particular to near-infrared interference and
• It must determine the approximate po- the effect of the windows in the target vehicle.
sition of the driver’s head in space
(x,y,z). The system is designed for use on the road. Typical
• It must provide current eyelid opening vibration must not impair system reliability or
data in millimeters for both eyes. Mi- cause system failure.
nor latency is acceptable if an exact
eyelid opening value is required.
Tycho von Jan 5During vehicle testing, the system must operate in A differentiated, conservatively designed quality
the standard test temperature range without any indicator should be used for this purpose.
restrictions.
2.1.2.7 Determining the 3-dimen-
2.1.2.3 Person-related criteria sional position of the
There must be no dependence on the driver’s physi- driver’s head
cal appearance including hair style. Ethnic origin
(Asian, African or Central/South/North Euro- In a number of applications, it is important to know
pean/American), sex, make-up and prosthetic the approximate position of the driver’s head. If
changes to the person’s face must not affect system possible, there should be no need for ranging sen-
performance. We should attempt to provide unre- sors other than the camera. When these criteria are
stricted functionality for persons wearing glasses, met, the camera image along with biometric as-
and this is currently the most difficult image proc- sumptions (e.g. spacing between the eyes) can be
essing challenge. Reflections from the lenses or used to determine the approximate distance of the
frame cause errors during image processing and face from the camera. The distance and the position
evaluation. The system must be able to measure of the face in the camera image can then be used to
eyelid spacing through glasses even in unfavorable determine the other two coordinates.
lighting conditions. It has to accommodate different
styles of glasses and lens types (mineral glass, plas- 2.1.2.8 Status output
tic and tinted/untinted lenses) and prescriptions.
The only exception relates to sunglasses that filter The system should provide a status signal, which is
out a significant amount of infrared light. output in real time or nearly so. This is necessary to
achieve reliability and an alarm rate, which is ac-
2.1.2.4 Measuring eyelid opening ceptable to the customer in a number of situations,
which occur when the vehicle is in traffic.
Precision measurement of eyelid movements is a The table below (Tab. 2) shows a sample status
basic prerequisite for determining the driver’s fa- value:
tigue level. The distance between the eyelids is used
for example to calculate lid opening and closing Status Description
speeds, eyelid closure time and blinking frequency. Base view The face of the driver is
It is also used to determine how wide the eye is in the field of view. Both
opened and other parameters. The system must eyes are detected in the
provide the current distance between the eyelids for camera image
both eyes at the camera frame rate. Output must not Blink The face of the driver is
exceed a defined latency level. within the field of view.
The eyes are closed
Turn out of range The driver has turned his
2.1.2.5 Accuracy head. The head is still in
the field of view, but the
The image-processing unit should be capable of
eyes are not visible from
detecting the position of the eyelid edges with an
the camera, and the
accuracy of less than one pixel. Variation in meas-
distance between the
urement errors is particularly critical. Rapidly
eyelids cannot be deter-
changing measurement errors create major prob-
mined
lems during fatigue monitoring. Key parameters
Occlusion The eyes are covered by
such as eyelid opening speed are derived directly
an object, but they are
from the distance between the eyelids, and false
otherwise within the
discontinuity on the blinking curve leads to very
field of view
critical measurement errors. Measurement errors
that remain constant over time are somewhat less Lateral out of range The driver has moved to
critical. A small, constant offset or factor on eyelid the side out of the cam-
era’s field of view
opening data can be tolerated.
No person No one is within the
camera’s field of view
2.1.2.6 Quality indicator Measurement error The face is in the field of
view, but the eyes can-
It is important that the system is able to recognize not be located
and flag unavoidable dropout and large measure-
ment inaccuracies to ensure that the downstream Tab. 2: Output of the driver state
unit that monitors fatigue and detects head and gaze
position does not misuse the data or misinterpret it.
Tycho von Jan 62.1.2.9 Reliability of the status value mally come from the pupil, for example, at a time
when the eye behind the lens may actually be
The “Blink” status is used to trigger a warning as closed. The frame can be misinterpreted as the
soon as the driver’s eyes have been closed for a upper or lower edge of the eyelid. This could lead
certain length of time. Latency must be minimal in to generation of false data relating to the spacing
order to provide timely warning to the driver. The between the eyelids or the gaze position.
fatigue level is determined by measuring the dis-
tance between the eyelids (see section 2.1.2.4).
Latency is less critical here.
The “Blink” status must be highly accurate. If
“Blink” remains set for a defined length of time, a
downstream unit (a suitable HMI) will warn the
driver. Long blinks will lead directly to a driver
warning. If the “Blink” status erroneously indicates
a long blink, a false alarm would be sent to the
driver. The “Blink” status must never lead to a
warning if the eyelids were not actually closed for
the defined length of time. However, long blinks
should always be detected if possible. 95% of long
Fig. 3: Prototype of a video sensor in a
blinks should be detected using the “Blink” status.
VW car
This issue presents also a big challenge for the
image processing functions. The requirements The availability of the sensor signal in all lighting
placed on other status values are less stringent. conditions poses another problem. What we are
talking about here is lighting conditions that are
2.1.2.10 Calibration related to the weather conditions, time of day (sun
low on the horizon at sunrise or sunset) or ambient
The system design must ensure that no calibration conditions (e.g. rapid transition between light and
is needed over the system’s lifecycle. However, shadow on tree-lined roads) and differences in
automatic calibration without the need for user lighting conditions that are related to geographical
intervention is acceptable. There should also be no location.
need for calibration during installation or service.
The camera lens aperture angle should ensure that Whether or not we will see this type of system in
there will be an adequate field of view despite the future cars depends to a large extent on our ability
usual installation tolerances. to find satisfactory vehicle-based solutions, which
meet the requirements described above and which
2.1.3 Sensor tests and outlook eliminate the current problems.
The requirements we have outlined for an on-board 2.2 Prediction algorithm
video sensor used for driver state monitoring are
partially taken from a standard specification list, We will now take a look at the methodology, results
which applies to any new electronic component or and conclusions from trials, which were conducted
system, which is to be integrated into a vehicle at VW to determine the driver’s state, and his fit-
during the course of the development process. VW ness/fatigue level in particular, using eye closure
has also conducted a large number of tests in-house data. An appropriate prediction algorithm was de-
on video sensor prototypes (Fig. 3 shows an exam- veloped and tested in a vehicle application.
ple).
2.2.1 Methods and results
Without going into the details of the trials, we
would at this point like to briefly explain some of The behavior of drivers suffering from extreme
the problems that still need to be resolved before fatigue was investigated in a driving simulator
we can consider widespread use of this technology during the first phase of the project. In addition to
in vehicle applications. looking at other driving parameters, the study fo-
cused on blinking and identification of fatigue indi-
The sensor system should work with drivers who cators.
are wearing glasses. Current image processing
systems on prototype sensors have the disadvantage The pilot study, which ended in 2002, demonstrated
that they generate false interpretations or reflections a significant correlation between blinking parame-
coming from the lenses or frames. These reflections ters and fatigue. These results were validated in
can be confused with the reflections, which nor-
Tycho von Jan 7another trial. The wealth of data available from The methods used in experiment 1 include:
these trials was used to develop a fatigue prediction
• threshold analysis
algorithm, which is based on driving and eye pa-
rameters. • a C5 decision tree
In parallel, a prototype sensor was tested and evalu- • multiple regression
ated. Up to that point, complex video analysis was
needed to accurately detect blinking. The sensor These methods were used to construct the predic-
was designed to perform this function automati- tion algorithms. The approach taken was to use half
cally. A prototypical sensor was used to detect of the test persons to “teach” the algorithms. The
blinking. Raw data from the sensor was processed other half was used to test the quality of the predic-
and parameterized during the project. tions. The prediction is retrospectively based on all
data collected during the preceding 60 seconds, and
The algorithm was intended to provide accurate it is re-calculated every second (frequency = 1 Hz).
state evaluations for all drivers if possible. The Sensitivity and specificity criteria taken from signal
fatigue behavior of a variety of persons was studied detection theory (Green & Swets, 1966) were used
at different times. A broad, varied sample of drivers to assess the quality of the prediction. To calculate
was selected for the study, which roughly repre- the quality of the prediction, the output of the algo-
sented the population of persons holding driving rithm is categorized into correctly detected, missed,
licenses in Germany. Trials were conducted at vari- correctly rejected and false alarm events. Specific-
ous times during the day to ensure that parameter ity gives an indication of the extent to, which an
differences, which are related to time of day were event was only and exclusively detected when a
identified. Monotonous travel on a freeway was microsleep phase actually occurred. It can also be
selected to maintain strict control of simulated expressed as a percentage value for correctly cate-
situations and conditions. Otherwise it would not gorized event-free time segments. Sensitivity is a
have been possible to relate parameter differences ratio of the number of correctly identified events
to a single cause. Thus the results of the study can compared to the total number of events expressed
be generalized to apply to various test persons and as a percentage.
times of the day, but it is only valid for a monoto-
nous stretch of freeway. correct _ rejection
Specifity = • 100%
correct _ rejection + false _ alarms
A third goal was to establish additional fatigue hits
Sensitivit y = • 100%
criteria, which were missing from the pilot study. hits + mis sin gs
For algorithm training, prediction variables that can
be established in the vehicle have to be linked with Algorithms in this study should have a maximum
a fatigue or alertness level criterion. Since no gen- value for sensitivity and specificity.
erally valid measurement standard for fatigue ex-
ists, three different criteria were established to Fig. 4 below shows how results were classified. It
compensate for the advantages and disadvantages indicates when a prediction is counted as a hit, false
of each criterion. Firstly, the drivers taking part in alarm, correct rejection or missing in relation to the
the study were asked to assess their level of alert- 5-minute prediction interval.
ness. Secondly, following training on a defined set
of observation criteria, neutral observers used video
analysis to evaluate driver fatigue. The third “objec-
tive” standard was measurement of brain activity Hits and Missings
(EEG), which was applied in some tests. False Alarms and Correct Rejections
Micro Sleep Event
A total of 83 persons, who were specifically se-
lected from a large database containing information
t
from responses to an ad campaign, took part in the
series of experiments. The participants appeared for
5 minutes
testing at three different times during the day: 8 = 20 %
A.M., 1 P.M. and 10 P.M. Each person drove for
about two hours on a monotonous stretch of free- 20 minutes
= 80 %
way.
The data collected during the experiments was Fig. 4: Evaluation of driver’s fatigue rec-
processed and parameterized to provide a basis for ognition algorithm
prediction models (prediction algorithms), which
use a variety of mathematical methods. Prediction algorithms were developed and tested on
the basis of this methodology. The best results were
achieved when the results of different algorithms
Tycho von Jan 8were merged into one consolidated algorithm. This quality of the input data is adequate to detect blink-
is discussed in more detail in the next section. ing events (event detection). A check should be
made to determine the extent to which data from the
Indicator models were developed during the 2002 left and right eye vary. Once eye closing events
pilot study. Parameters and their fatigue-dependent have been identified, they can be parameterized (the
variation were systematized. Experiment 1 was then duration of the blinking event or speed at which the
conducted to develop algorithms to predict an im- eyelid is opened can be determined). The quality of
manent sleep event. Experiment 2, which followed the measurement performed on each blinking event
in 2003/2004, was conducted essentially to repeat can then be evaluated. The quality assessment is
the testing and improve the reliability and validity performed during algorithmic processing. Once the
of the algorithms that were developed during the significant statistical values per event for the pre-
previous experiment. A further experiment was ceding minute have been generated, the data is
conducted in 2004 to study the effect of warnings exported to the data pool and is available to the
on the prediction quality. algorithm modules for further manipulation.
Vehicle and ambient data are placed on the CAN
bus (Controller Area Network) and fed into the
framework. Vehicle data is used to determine activ-
ity patterns, which can then be used to perform an
additional check of the fatigue prediction. Ambient
data such as the time is used to generate the predic-
tion depending on what time of day it is. The pre-
diction takes into account circadian rhythm (our
internal time-dependent clock).
Initial development of the prediction algorithm took
place under controlled conditions in the simulator.
Fig. 5: Empirical basis of driver's fatigue The effect of warnings and feedback on drivers and
recognition algorithm on the validity of the prediction was also tested in
the driving simulator before a test series was carried
out on the road.
2.2.2 On-board implementation The results of evaluations conducted on the newly
developed warning system under actual conditions
Tests under real driving conditions were carried out were encouraging. The calculation of the quality
to evaluate the data processing and algorithm indicator as well as feedback from test drivers who
framework. The general framework is shown in the gave an assessment of the warning system indicate
diagram below (Fig. 6). that at the current stage development the system is
already producing satisfactory results and is some-
thing that customers would like to have.
In principle, the algorithm is transferable to actual
behavior in traffic. It is still difficult to capture eye
data without error when the driver looks away. This
problem was discovered under real-world condi-
tions where more stimuli were present. It did not
occur in the carefully controlled environment of the
simulator.
It also became clear that the way fatigue progressed
under actual road conditions was different from
Fig. 6: Framework of driver's fatigue recogni- what was observed in the simulator. Drowsiness
tion algorithm came on significantly faster in the simulator if the
assessment is based on the final fitness value of the
Eye data captured by the video sensor was fed into
prediction algorithm. Subjective self-assessment by
the system. Eye opening as a function of time and
the participants indicated that the fatigue level in-
the parameters derived from that data are used dur-
creased over the course of the test drive. Sensitivity
ing calculation of the fitness/fatigue level. Data
and specificity calculated on a minute basis were
smoothing has to be performed in order to generate
both above 90 %. These results show that the proto-
meaningful parameters from the raw data signal.
type delivers satisfactory performance.
Then compensation must be added for missing
input data. After these steps are performed, the
Tycho von Jan 9There is however still scope to improve detection of These use concepts will not be presented in more
eye behavior for persons who are wearing glasses. detail in this paper because the applications are still
It is also clear that it is not possible to develop an under development.
algorithm, which can be used to predict the fit-
ness/fatigue level for the entire driving population. 3 What does our customer
Some drivers do not exhibit the type of behavior,
which indicates fatigue to a sufficient extent, and want? Some results of a cus-
this makes it impossible to develop a universally tomer opinion survey
valid assessment. Results of the testing completed
so far indicate that the fitness/fatigue level could be It takes more than a demonstration of technical
predicted for about 80% of the participants. Ways feasibility to achieve a successful transition from a
in which a warning could be issued to the rest of the research project to a product strategy and from
drivers when microsleep incidents occur are out- there to volume production. Creating a link to the
lined in Section 2.3. customer and the market is at least as important,
and this is why we used marketing techniques to
2.3 Other applications for a camera include customer preferences and requirements in
the project. In collaboration with our market re-
mounted in the cabin to monitor search and product marketing teams, we designed
the driver and carried out an online questionnaire-based sur-
vey. The advantage of this type of study is the abil-
For this group of less-predictable drivers we are ity to survey a large number of customers in a rela-
looking at various scenarios and strategies to gener- tively short period of time. The disadvantage is that,
ate a benefit from the fatigue/alertness assistant. despite the use of today’s computer and animation
technology, the respondents only get a virtual im-
One possibility is to develop a long blink or doze- pression. The customers have not used the product
off alarm (please refer to section 2.1.2.8). The fa- or experienced its features, and they can only
tigue/fitness level can be used to produce a warning evaluate the concept. The responses do, however,
before the driver falls asleep. In contrast, the long provide information about expectations associated
blink or doze-off alarm does not produce an alarm with the product. They also identify any aversion to
until the eyes have remained closed for a pre- this type of technology and shed some light on the
defined length of time. A high frequency is not reasons behind this attitude.
needed to determine the eyelid spacing sequence.
The system needs “only” to determine whether the In the summer of 2004, a standardized online inter-
eyes are open or closed. However, this decision view was used to survey 431 Volkswagen and Audi
must be made in a very short time, because a warn- drivers in all product segments. The table below
ing must be transmitted to the driver as quickly as (Tab. 3) shows the details of the interview sample.
possible. The danger for the driver and others be-
SEGMENTS
comes acute once the eyes have closed. False A B C D
MPV/A-
MPV
NFZ TOTAL
alarms are not acceptable, because this would sig- Targeted sample size 80 80 80 40 80 80 440
nificantly reduce confidence in the system and thus Actual sample size 83 83 82 37 81 65 431
customer acceptance. This scenario places high
Sex
demands on the image processing function, which Male (Female) [%]
59 (41) 71 (29) 66 (34) 84 (16) 62 (38) 89 (11) 70 (30)
must be very precise and accurate. Other scenarios, Ø Age [ years] 29 33 36 49 35 42 36
which make use of the camera in the cabin to moni-
tor the driver, are shown in Fig. 7. The goal is to Private car
(business car) [%]
78 (22) 84 (16) 74 (26) 54 (46) 86 (14) 60 (40) 78 (22)
provide more information on the driver’s alertness
by determining the head orientation and gaze posi-
tion. Tab. 3: Sample population
In very general terms, the goal was to solicit opin-
ions from our customers on the alertness/fatigue
assistant. Various usage models were presented
(refer to Fig. 7). Scenario 1 was given the working
title “doze off alarm”, Scenario 2, calculation of the
fatigue/fitness level, was called the “fatigue detec-
tor”, Scenarios 3 and 4 together were called “alert-
ness assistant”. The scenarios 1 and 2 were the best
accepted ones by the customers surveyed, because
they were expected as the most helpful functions.
The approval level for the alertness assistant was
Fig. 7: Use concepts for an in-cabin cam- also high, but clearly behind the doze off alarm and
era the fatigue detector. Respondents were allowed to
Tycho von Jan 10select more than one item. Another question is FHWA (1997). Commercial motor vehicle driver
whether customers accept the idea of having a cam- fatigue and alertness study. Technical Summary.
era in the cabin to monitor the driver. They were FHWA report number: FHWA-MC-97-001. // TC
specifically asked whether they would accept a report number: TP 12876E.
camera to assess fatigue/alertness and if necessary http://www.tc.gc.ca/TDC/publicat/tp12876/english/
infrared light sources in the vehicle as well. Over 12876_e.htm [Accessed: 10.7.2001]
80% of customers surveyed think that a camera and
the necessary infrared lighting in the vehicle are a Green, D. M. & Swets, J. A. (1966). Signal detec-
good idea. This means that only a minority of those tion theory and psychophysics. New York, NY, US:
surveyed rejected the concept. Wiley.
Finally, we can say that there is demand for a fa- Hacker, W. & Richter, P. (1980). Psychische
tigue/alertness assistant in markets where there is Fehlbeanspruchung: Psychische Ermüdung,
high customer acceptance of technology, such as Monotonie, Sättigung und Stress. Berlin: VEB
Germany. There is a need to take a critical look at Deutscher Verlag der Wissenschaften.
the expectations that customers place on this type of
system. Customers have indicated that the doze off Hacker, W. (1989). Ermüdung. In: Greif, S.,
alarm is more important than the fatigue detector. Holling, H. & Nicholson, N. (Eds.), Arbeits- und
This function should be available on the system to Organisationspsychologie. Internationales
ensure that customers believe that it will provide Handbuch in Schlüsselbegriffen, 209-212.
tangible support. München: Psychologie Verlags Union.
Authors’ note: Hargutt, V. & Tietze, H. (2001). Erfassung von
Ermüdung und Müdigkeit via EEG und
The technical requirements and specifications re- Lidschlagverhalten unter besonderer
garding fatigue detection and monitoring outlined Berücksichtigung des PERCLOS-Maßes. Vortrag
in this paper reflect current thinking based on re- auf der Tagung „Müdigkeit im Verkehr. Ursachen,
search activities conducted to date. These require- Erkennung und Gegenmaßnahmen“, Essen, 20 - 21
ments are subject to change based on ongoing and June 2001.
future research and development efforts in technical
disciplines as well as in the behavioral and medical Hartley, L., Horberry, T. & Mabbot, N. (2000).
sciences. The development of such systems is nec- Review of fatigue detection and prediction tech-
essarily an iterative process that can be described nologies. Melbourne: NTRC.
only in broad terms. Individual results over time
will determine the nature and content of specifica- Hockey, G. R. J. (1993). Congitive-energetical
tions that can form the basis of production systems. mechanisms in the management of work demands
and psychological health. In: Baddeley, A. &
References Weiskrantz, L. (Eds.), Attention. Selection, Aware-
ness, and Control, 328-354. Oxford: University
Bittner, R., Hána, K., Poušek, L., Smrčka, P., Press.
Schreib, P., Vysoký, P. (2000). Detecting Fatigue
States of a Car Driver. Proceedings of the First James, W. (1890). The principles of psychology.
International Symposium on Medical Data Analy- New York: Holt.
sis, 260-273. Berlin: Springer.
Norman, D.A. (1981). Categorization of actions
Brown, I. D. (1994). Driver Fatigue. Human Fac- slips. Psychological Review, 88, 1-14.
tors, 36 (2), 298-314.
Rasmussen, J. (1982) Human errors – A taxonomy
Dinges, D. F. & Kribbs, N. B. (1991). Performing for describing human malfunction in industrial
while sleepy: effects of experimentally induced installations. Journal of Occupational Accidents, 4,
sleepiness. In: Monk, T. H. (Ed.). Sleep, Sleepiness 311-333.
and Performance, 97-128. Chichester: Wiley.
Reason, J. (1990). Human Error. Cambridge: Cam-
Dinges, D. F., Mallis, M. M., Maislin, G. & Powell, bridge University Press.
J. W. (1998). Evaluation of Techniques for Ocular
Measurement as an Index of Fatigue and the Basis Richardson, J., Fairclough, S. H. & Fletcher, S.
for Alertness Management. DOT-HS-808762. (1997). Driver Fatigue: An Experimental Investiga-
Washington, D.C.: U.S. Department of Transporta- tion. In: Noy, Y. I. (Ed.), Ergonomics and Safety of
tion. Intelligent Driver Interfaces, 329-343. Mahwah:
Erlbaum.
Tycho von Jan 11Warren, N. & Clark, B. (1937). Blocking in Mental
and Motor Tasks During a 65-Hour Vigil. Journal
of Experimental Psychology, 21, 97-105.
Tycho von Jan 12You can also read