The Congestion Question - Phase One Report: Could road pricing improve Auckland's traffic? - Ministry of Transport
←
→
Page content transcription
If your browser does not render page correctly, please read the page content below
Phase One Report:

The Congestion
Question
Could road pricing improve
Auckland’s traffic?
#congestionquestion

Contents
Executive summary................................................................................. 1
Definitions and abbreviations...............................................................3
Part 1: About the project........................................................................6
Part 2: The challenge........................................................................... 10
  2.1 Where are we now?.............................................................................. 11

    2.2 Future projections................................................................................15

    2.3 The strategic approach to addressing Auckland’s transport challenges..........17

    2.4 What does a future without congestion pricing look like?....................................19

Part 3: What is congestion pricing and how does it work?.......... 24
  3.1 Definition........................................................................................... 25

    3.2 How has congestion pricing been used internationally?............................. 29

    3.3 Has congestion pricing been considered in Auckland before?......................37

    3.4 What are the technology options for congestion pricing?.......................... 38

Part 4: What’s next for the project?.................................................. 42
    4.1 How will we explore with Aucklanders whether congestion pricing
        should be part of the solution?.............................................................. 43

    4.2 Analytical framework........................................................................... 45

Part 5: Conclusions and next steps................................................... 48
Appendix – Terms of Reference.........................................................51
Executive summary
             This report summarises the findings from the first phase of a
             joint project between Auckland Council and the Government
             to investigate congestion pricing for Auckland.
             This phase has involved establishing baseline data, background information and our communications
             and engagement approach to provide a foundation for the rest of the project.

             Congestion pricing is a method used to ease congestion by charging road users at different times and/
             or locations to encourage some users to change the time, route or way in which they travel.

             This investigation builds on the findings of the Auckland Transport Alignment Project (ATAP), which set
             out a 30-year vision for Auckland’s transport system. This vision comprised three integrated elements:
             targeting investment to the most significant challenges, making better use out of the existing network
             and focusing more on managing travel demand.

             ATAP identified pricing as having significant potential to manage travel demand and reduce congestion,
             in conjunction with implementing the wider strategic approach. The work we have undertaken in this
             project to date reaffirms this.

             Our analysis shows Auckland’s congestion across the network has worsened over the past few years.
             An average weekday motorway trip now takes almost 10 percent more time than it did four years ago,
             and motorists now need to allow an additional 40 to 55 percent longer for their trips to be assured of
             arriving on time. Congestion is also increasingly a problem throughout the day and at weekends, not
             just in the peak times.

             Without congestion pricing, our analysis shows that congestion is expected to become more
             widespread, even after a significant programme of investment in roading, public transport and active
             modes. The proportion of car travel in severe congestion is projected to increase by around 30 percent
             in the morning and afternoon peak, and 50 percent in the interpeak. This means that Aucklanders’
             access to jobs, education and other opportunities will become more difficult, negatively impacting
             both the productivity and liveability of the city.

             International evidence from a number of cities shows congestion pricing is being used successfully
             to influence travel demand and ease congestion. However, Auckland’s widespread congestion, heavy
             car dependency and dispersed commuting patterns represent uncharted territory when it comes to
             developing and implementing a congestion pricing solution.

             Our review shows technology is not a constraint to implementation, but we need to be flexible to adapt
             to future technology changes. Automatic number plate recognition technology is likely to be the best
             immediate technology solution, but satellite-based technologies could offer a more sophisticated
             solution in the near future.

1 The Congestion Question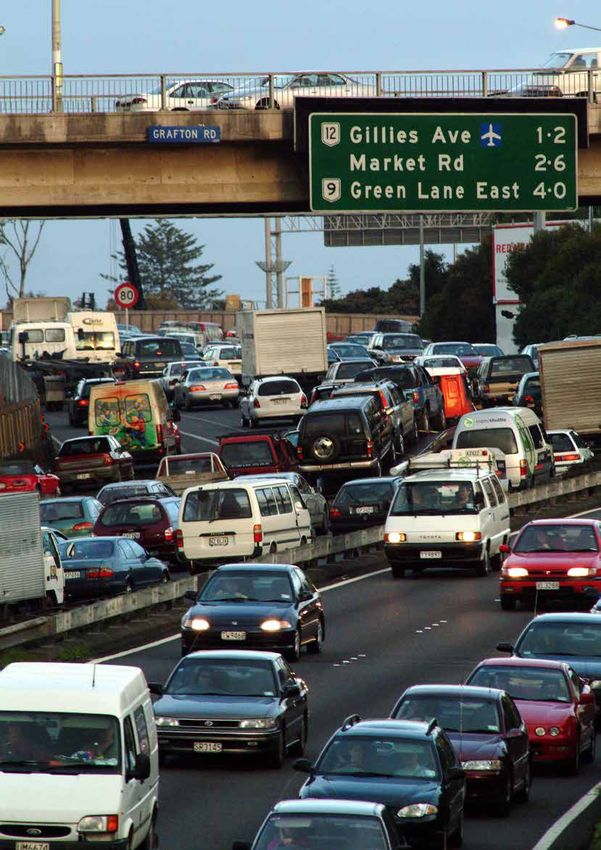
ATAP envisaged a progressive move to a pricing system that would apply across the entire road network,
reflecting the actual cost of each trip (‘smarter’ transport pricing). The evidence to date suggests smaller
scale options, used as stepping stones, are the best starting point. This would enable a scheme to be
monitored for any distributional or equity issues and evolve over time, managed throughout staged
implementation.

Building public understanding and acceptance will be critical to successfully implementing any
congestion pricing solution. We will need to ensure meaningful and appropriate public involvement
in the project.

We know congestion pricing can improve things, but we need to do further work to understand
whether it might work in Auckland and if so, how. Our analysis in phase one of this project has built
a compelling case for continuing the work we have done so far, so we can better understand the social,
economic and environmental costs and benefits of congestion pricing for Auckland.

                                                                                                   The Congestion Question   2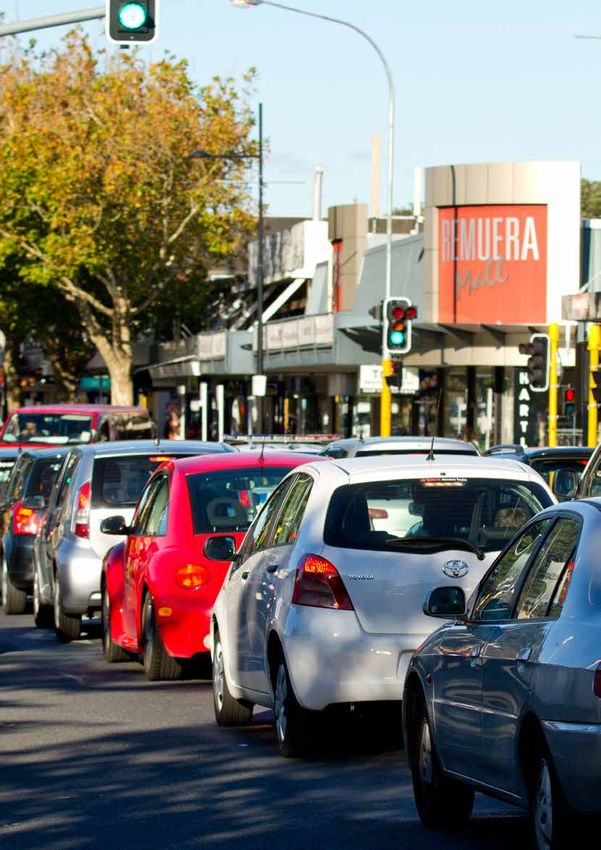
Definitions and abbreviations
               Term/Abbreviation         Definition/Description

               Active modes              Walking and cycling

               ANPR                      Automatic Number Plate Recognition. Technology to identify vehicles based on video technology to
                                         read their number plates and match that number to a database of vehicle owners.

               Area-based charging       Charging vehicles for crossing a ring or driving within that ring at specific times of days, typically to
                                         manage demand. London’s Congestion Charge is an area charge.

               Arterial network          Arterial roads are defined as high capacity local roads that connect suburbs in urban areas, and play
                                         a critical role in moving people and goods.

               ATAP                      Auckland Transport Alignment Project – a joint project between the Government and Auckland
                                         Council to develop a strategic approach to addressing Auckland’s transport challenges.

               Autonomous vehicles       Vehicles where little to no human intervention is required to drive.

               Carpooling                A carpool is when two or more people share the ride to a similar or nearby destination (also called
                                         ridesharing).

               Congestion                Congestion can be defined in different ways, but generally relates to vehicles travelling at slower
                                         speeds than they would otherwise be able to travel due to increased traffic on the roads.

               Congestion pricing        Charging vehicles for use of specific roads during specific times and days, in order to reduce
                                         the severity and duration of congestion on the network. Revenues from such charging are not
                                         necessarily linked to any road or transport infrastructure costs.

               Connected vehicles        Connected vehicle technologies let vehicles and infrastructure communicate directly with each
                                         other using wireless connections, which has the potential to bring safety and efficiency benefits.

               Cordon pricing            Charging vehicles for crossing a ring or line of charge points across a series of roads at specific times
                                         of day, typically to manage demand. Cordon pricing does not charge for traffic movements within
                                         the cordon. Stockholm’s congestion pricing is a cordon.

               Corridor-based charging   Charging vehicles to use all of the roads in a corridor (main highway and secondary routes).

               Demonstration             In the context of road charging, a live trial of a series of possible policy/technology options for
                                         implementing a road charging system. A demonstration is time-limited, includes a limited set of
                                         participants and tests a range of technology and product options to assess whether one or more
                                         of them have sufficient merit for more detailed consideration. A road charging demonstration does
                                         not collect revenue, although it may operate a simulation of how much revenue might have been
                                         collected for illustrative purposes.

               DSRC                      Dedicated Short Range Communications. Also known as tag and beacon road charging, whereby
                                         a small battery powered device is installed in a vehicle to enable identification in a toll system. Not
                                         used in New Zealand.

               eRUC                      Electronic Road User Charging – the electronic system offered by some providers in New Zealand
                                         (currently Eroad and Coretex) to provide a GNSS platform to charge RUC.

               ERP                       Electronic Road Pricing – the congestion pricing system operational in Singapore (the same
                                         terminology is also used for proposals in Hong Kong and Jakarta).

               Exemption                 Legal exemption from having to pay in a road charging scheme, based on vehicle or vehicle owner
                                         characteristics.

3 The Congestion Question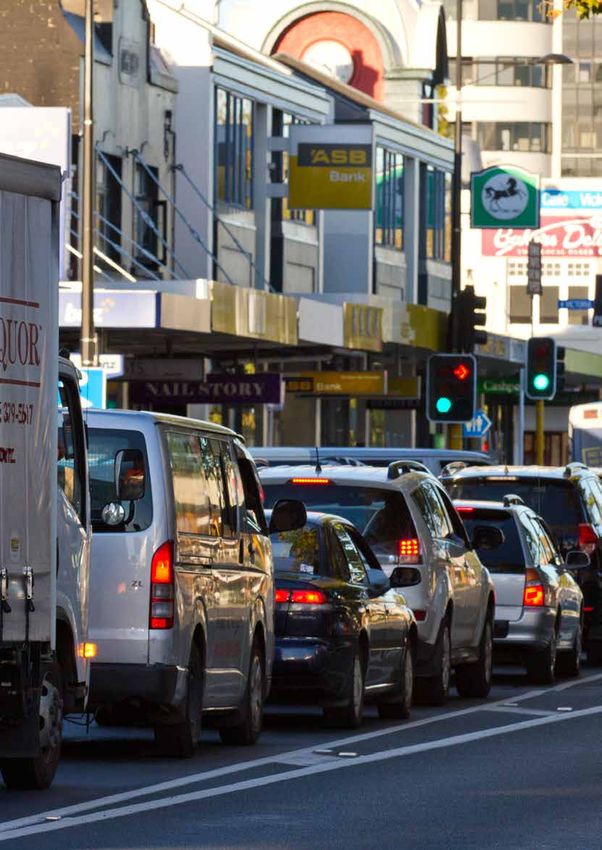
Expenditure plans        The expenditure plans profile maintenance expenditure and capital investments planned by all levels
                         of government on key road segments over the next four years.

Network-based charging   Charging all vehicles on a road network varying by time, location and vehicle type, typically by some
                         form of metering of distance or time spent on the network.

GNSS                     Global Navigation Satellite System. A generic term for such systems which includes GPS, GALILEO
                         and GLONASS.

GPS                      Global Positioning System, the US-Government provided GNSS system.

Heavy vehicles           Vehicles 3.5 tonnes and over – typically rigid and articulated trucks and buses as well as special
                         purpose vehicles such as cranes.

HOT lane                 High Occupancy Toll lane. A highway lane that is exclusively for use of buses and high occupancy
                         (i.e. one or more passenger) cars, or for single occupancy vehicles if they pay a toll.

Light vehicles           Light vehicles include cars, motorcycles, mopeds, vans, people-movers, trailers with a total weight
                         of less than 3.5 tonnes.

Mobility as a Service    A new approach to transport that combines journey options from transport providers into a single
                         mobile service.

Mode share               Proportion of travel undertaken by a certain mode (for example, car, public transport, or walking).

NZTA                     New Zealand Transport Agency

Pilot                    A live trial of the proposed policy/technology option as an initial small-scale implementation of
                         a road pricing system. A pilot may or may not be time-Iimited and may or may not be limited by
                         number of participants.

Ridesharing              Two or more people share the ride to a similar or nearby destination (also called carpooling).

Road charging            Direct charging of road users for the use of the road network, distinct from tolls in that charging
                         is not applied to a single part of the network to recover the infrastructure costs for that part of the
                         network.

RUC                      Road User Charge. The New Zealand weight/distance road charging system applicable to heavy
                         vehicles and light diesel vehicles.

Severe congestion        In this report, severe congestion is defined as a volume to capacity ratio of 0.8 or over – which
                         equates to stop start traffic and significant delay.

Tolls/ toll roads        Direct user charges in the form of regulated, facility-based tolls for usage of specific road corridors.

Toll lane                One or more lanes on a highway that may only be accessed by paying a toll, typically physically
                         segregated from other untolled lanes.

Trials                   Demonstrations and pilots. Any form of application of technology or systems in a form
                         primarily to obtain information, data and feedback about its performance in advance of full
                         implementation.

                                                                                                                         The Congestion Question   4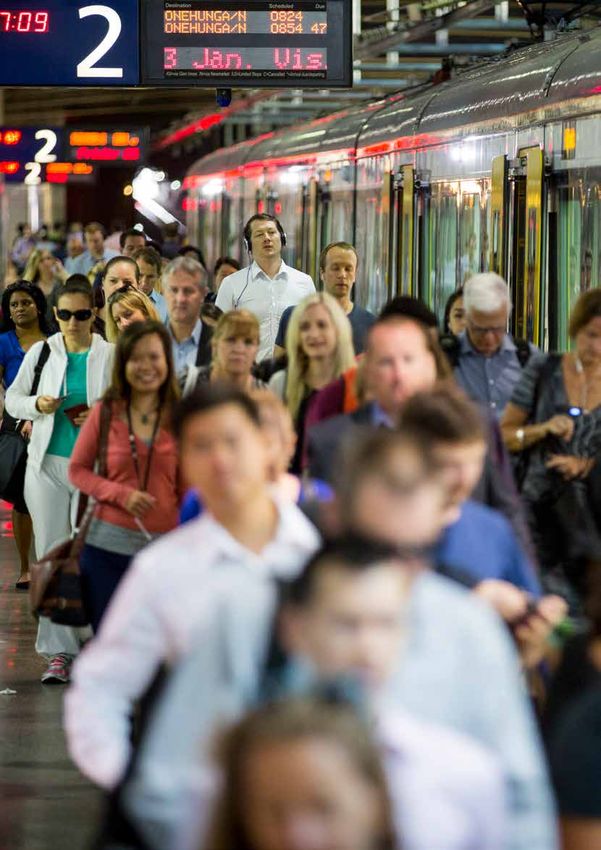
Part 1:
About the project
Part 1: About the project

                                 In 2016, central and local government officials worked together on
                                 a strategy for the development of Auckland’s transport system over
                                 the next 30 years. The results are set out in the Auckland Transport
                                 Alignment Project (ATAP) – Recommended Strategic Approach.
                                 The core finding of ATAP was that a new approach is needed if we are to keep pace with the growth
                                 anticipated in Auckland. We need to target investment to the most significant challenges, but also need
                                 to increasingly focus on maximising opportunities to influence travel demand, and making better use
                                 of existing networks.

                                 ATAP developed an indicative investment package that illustrated the kinds of investments that may
                                 be required to implement the strategic approach. This was updated in August 2017 following the release
                                 by Statistics NZ of new, higher than expected population projections1.

                                 Over the last year, a lot of work has been underway to implement ATAP’s recommendations.
                                 One recommendation was to establish a dedicated project to explore whether congestion pricing
                                 in Auckland was one part of the solution to influence travel demand and ease congestion, which led
                                 to the Government and Auckland Council establishing this project.

                                 The project’s Terms of Reference were agreed in April 2017 (see appendix) and outline the project’s
                                 purpose, objective, and deliverables. The final deliverable will be a recommendation to the Minister of
                                 Finance, the Minister of Transport and the Auckland Mayor on whether to implement congestion pricing
                                 in Auckland.

                                 This is the first of three project reports, prepared by officials from the six agencies involved (the Ministry
                                 of Transport, Auckland Council, NZ Transport Agency, Auckland Transport, the Treasury and the State
                                 Services Commission).

                                 During this first phase of the project we have developed baseline data, background information and
                                 analytical tools to be able to evaluate and test pricing options, and a comprehensive communications
                                 and engagement strategy.

                                 Statistics NZ Subnational Population Projections, February 2017
                                 1

                    7 The Congestion Question
Part 1: About the project
This report shares the findings and insights gained from the work
to date. It includes:
• an overview of the challenge Auckland’s transport system faces over the next 30 years,
and what the future without congestion pricing is projected to look like
• how congestion pricing could be one part of a solution to address these challenges,
based on international evidence
• our process for developing and evaluating different pricing options, including how we
propose to involve the Auckland public.
The Congestion Question 8Part 2: The challenge
Part 2:
The challenge
2.1
Where are we now?
Rapid growth and rising vehicle ownership
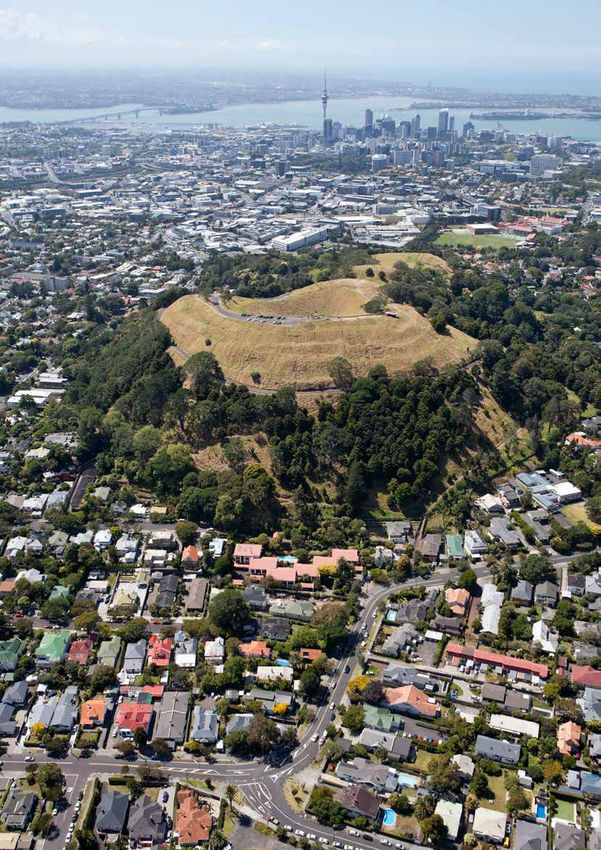
Auckland’s population has increased by 10 percent in the last four years – this is an increase of roughly
170,000 more people, more than the population of Hamilton.
This significant growth in population, combined with a buoyant economy, is driving a rapid increase in
the demand for travel, for both private vehicles and public transport. Aucklanders now drive an average
of 1.6 billion kilometres a year further than they did in 2013 and own more cars on a per capita basis
than ever before. Over 700 additional cars are being registered in Auckland every week.
Although private vehicles provide for the significant majority of trips in Auckland, public transport plays
a critical role in efficiently moving large numbers of people to major employment areas at peak times.
Recent years have seen record growth in public transport use in Auckland, with annual public transport
boardings increasing by almost 30 percent over the last four years.
Government and Auckland Council are investing
Investment in Auckland’s transport system has also increased significantly over recent years. Over
$2 billion is now being invested annually in roading, public transport and active modes infrastructure
and services. The results of this can be seen in the delivery of projects such as the widening of the
Northwestern motorway, the upgrade and electrification of the metro rail network, and the under-
construction City Rail Link.
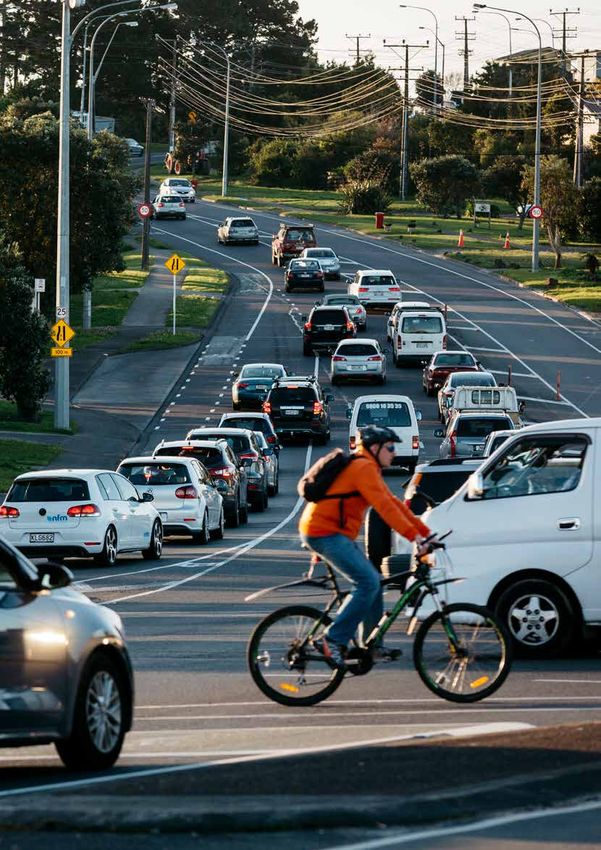
Even with this level of investment, increased demand has led to a substantial decline in network
performance. A key issue is the impact of congestion on the motorway and primary arterial road
network. These roads make up only 27 percent of the road network, but carry 53 percent of morning
peak traffic and account for 63 percent of severely congested2 conditions.
2 Based on results from Auckland’s Macro Strategic Model. Severe congestion is defined
as a volume to capacity ratio of 0.8 or over – which equates to stop start traffic and significant delay.
11 The Congestion QuestionPart 2: The challenge
Congestion is spreading
             Peak period congestion has increased significantly – 33 percent more of the arterial network is now
             congested3 during the morning peak hour than in 20144 (see figure 01). Peak period congestion
             is not confined to the CBD and surrounds, but now spreads more widely from the north to the south
             of Auckland’s urban area.

             Interpeak congestion has also grown at a similar rate to the peak, albeit from a lower base. Key parts
             of the network, such as State Highway One between the CBD and Penrose, are often congested
             throughout the day. This growth in interpeak congestion is increasingly affecting business and freight
             travel, which mainly occurs during the middle of the day. Congestion at weekends is also increasing.

             The general trend of increasing regional average congestion levels does appear to have stabilised
             recently with the opening of the Waterview Tunnel in late June 2017 – highlighting the positive impact
             of the Western Ring Route on the surrounding network. The full impact will become clearer as trends
             develop in the coming months, and is likely to be supported as new projects open on the Northern
             and Southern motorways. However, we expect that continued growth in demand for travel will see
             congestion trends resume, although from a lower base than before the Waterview Tunnel opened.

             Figure 01:
             Proportion of arterial network subject to congested conditions during the AM peak hour and Interpeak
                   Proportion of network subject to congestion network

                                                                         35%

                                                                         30%

                                                                         25%

                                                                         20%

                                                                         15%

                                                                         10%

                                                                         5%

                                                                         0%

                                                                               Sept-13       Mar-14      Sept-14     Mar-15      Sept-15      Mar-16      Sept-16       Mar-17       Sept-17

                                                                                         AM Peak hour congested conditions (travel at less than 50% of speed limit)
                                                                                         Interpeak congested conditions
                                                                                         AM Peak hour 12 months rolling congested conditions
                                                                                         Interpeak hour 12 months rolling congested conditions

                                                                                                                                                       Source: Auckland Transport monitoring data

             3 Congestion is defined here as average travel speeds of less than 50 percent of the posted speed.
             4 The average proportion of the arterial network subject to congestion was 24.3 percent for the year
                to September 2017, compared to 18.2 percent for the year to September 2014.

13 The Congestion Question
Overall, the impact of growing congestion is increased travel times and unreliability, and ultimately higher
cost. In Auckland, this impact can be seen in significantly reduced average travel speeds on the motorway
network (see figure 02), meaning that an average weekday motorway trip now takes almost 10 percent
longer than it did only four years ago. Meanwhile, increasing unreliability means that motorists now need
to allow an additional 40 to 55 percent more time for their trips to be assured of arriving on time.
These delays and costs are affecting people’s ability to access work and education opportunities.
They have a resulting negative impact on Auckland’s productivity – which given Auckland produces
37 percent of national GDP, has implications for the whole of New Zealand’s economy. They also make
Auckland a less attractive place to live and affect the quality of life for many Aucklanders, reducing the
time available to spend on leisure activities and with friends and family.
Figure 02:
Average weekday speed on the motorway network
Current year network speed index
85
>80
80
75 77.4 70-80
Speed index (km/hr)
75.5
73.6
70
70.7
70.0
65 60-70
60
55 50-60
50Part 2: The challenge
2.2
Auckland’s future growth
Auckland is growing at a rapid pace
Looking ahead, Auckland’s rapid population growth is projected to continue. Recently revised medium
population projections by Statistics NZ have Auckland’s population reaching 2 million people in 2028,
four years earlier than in the previous projections used by ATAP.
Beyond 2028, Auckland’s population is projected to reach between 2.4 million5 by 2046 – an increase
of 800,000 on current figures. The number of employees is expected to grow by 40 percent over the
same period. This is shown in figure 03.
Auckland’s growing population and labour market provide many opportunities and benefits, such as
the potential to increase innovation, productivity and prosperity. Its increasing diversity makes Auckland
a more exciting and attractive place to live. However, the travel demands of a growing population will
continue to place pressure on Auckland’s transport networks, increasing travel times, and reducing
reliability and access.
Figure 03.
Forecasted growth in population and employment 2016 (base)–2046
Population - medium projection Employment - medium projection
2.5M
2M
1.5M
1M
500K
2013 2016 2026 2036 2046
Source: Statistics New Zealand and Auckland Forecasting Centre
5 Taken from the Statistics NZ February 2017 projections (see footnote 1).
These do not take into account any potential future changes to immigration policies.
15 The Congestion QuestionPart 2: The challenge
Part 2: The challenge

                             2.3
                             The strategic approach to addressing
                             Auckland’s transport challenges
                             Congestion pricing could have a major impact
                             ATAP identified congestion pricing as having significant potential to influence travel demand and reduce
                             congestion in Auckland. However, this was only one of range of measures recommended to address the
                             challenges of Auckland’s transport system.

                             The ATAP strategic approach contains three integrated elements:

                                                                     Maximise new
                                                                    opportunities to
                                                                    influence travel
                                                                        demand

                                                                                             Target
                                                   Make better
                                                                                          investment
                                                  use of existing
                                                                                          to the most
                                                    networks
                                                                                           significant
                                                                                          challenges

                             Figure 04.
                             The ATAP Recommended Strategic Approach

                17 The Congestion Question
Part 2: The challenge
This acknowledges that we need to continue to invest significantly in transport infrastructure, services
and technology – roading, public transport and active modes – as Auckland continues to grow. Our
current understanding of what these investments might entail is detailed in the August 2017 ATAP
update report, which proposed expanding the original investment package in response to higher
population projections.
ATAP recognised that it is becoming increasingly expensive to build new roads or expand existing ones
due to land availability constraints and the high costs of purchasing land. To maximise the benefits of
our investments, we need to get more out of the existing network by increasing throughput of people
and goods.
This could be achieved through smarter and more active traffic management, increasing availability
of real-time travel information, and interventions such as intersection upgrades, minor road layout
changes, street space reallocation and traffic light optimisation. In the longer term, developing
technologies such as autonomous and connected vehicles offer further potential to get more out
of the existing network.
We also need a greater focus on influencing travel demand to actively inform and shape people’s travel
decisions. This includes better integrating land use and transport planning including through urban
design, and encouraging increased vehicle occupancy through shared mobility technologies such
as ridesharing and carpooling.
ATAP found that congestion pricing has the potential to be a powerful tool to influence travel demand
and significantly improve network performance. However, it will be most effective if it is implemented
alongside these other initiatives, many of which are already underway.
The Congestion Question 18Part 2: The challenge
2.4
What does a future without congestion
pricing look like?
Since the original ATAP report came out in 2016, new information has been released and further work
has been undertaken on how Auckland’s transport system is likely to evolve over the next 30 years. To
understand whether these changes impact on the case for congestion pricing, we have modelled future
network performance using the Auckland Forecasting Centre’s Macro Strategic Model, which has been
updated and validated to a base year of 2016. As outputs from this model have only recently become
available, the results reported below represent an initial assessment.
The modeling scenario does not include congestion pricing, and is based on:
• the most recent population and employment projections6
• the indicative package of transport investments recommended in the ATAP Update report7.
Under this scenario, continued rapid population growth is projected to lead to increases in demand
for travel, with total daily trips by all modes rising from 5.4 million in 2016 to 7.8 million by 2046.
Public transport and active mode share (walking and cycling) improves significantly over this period,
but the distance travelled by private vehicles is still expected to grow by 50 percent – increasing the
pressure on the road network.
While the major investment programme proposed in the ATAP Update report provides significant new
public transport and greenfield roading capacity in response to this growth, the scale of increased
demand means that further declines in road network performance are still projected. The main effect
predicted by the modelling is that congestion becomes more widespread on the existing road network,
with the length of lane kilometres subject to severe congestion increasing by 40 percent over the next
30 years. This can be seen in figure 05 which provides a comparison of severe congestion during the
morning peak in 2016 and 2046. The motorway system is heavily affected, with the number of lane
kilometres subject to severe congestion more than doubling and congestion spreading from
the Bombay Hills in the south to Redvale in the North.
6 Scenario I11, based on Statistics New Zealand’s Sub-national population projections issued February 2017.
7 Auckland Transport Alignment Project report
19 The Congestion QuestionPart 2: The challenge
Figure 05.
The growth of severe congestion in the morning peak: 2016 compared to 2046
007 Vehicle Vol_Cap 007 Vehicle Vol_Cap
16174 - 2016 46162
40-49% of speed limit 30-39% of speed limit Less thanA30%
M 2016_Run5_19_M3_Ffare_Toll
of speed limit
Veh V/C
0.8 - 0.9
Source: Auckland Forecasting Centre, Macro Strategic Model outputs
0.9 - 1.0
1.0 -->
ART3.3
Scenario 46162: 2046 AM ATAP1_1OTDMCrowdZFNoPrice
2017-11-15 10:13 (jojovale1)
The Congestion Question 20Part 2: The challenge
The modelling indicates that by 2046:
• the proportion of car travel in severe congestion increases by 29 percent in the morning
and afternoon peaks and by 38 percent in the interpeak
• severe congestion on the freight network during both the morning peak and interpeak
will increase by 50 percent.
Figure 06 below shows the change in proportion of vehicle travel subject to severe congestion over
time. These regional average performance figures include the effect of construction of new road
capacity to support greenfields growth and uncongested rural roads. As a result, they are likely to mask
higher congestion impacts at a subregional level. As the maps in figure 05 indicate, conditions within
the existing urban area are likely to become much worse than the regional average figures suggest.
Figure 06.
Proportion of regional vehicle kilometres travelled in severe congestion
25%
20%
15%
10%
5%
2013 2026 2036 2046
AM Peak PM Peak Interpeak
Source: Auckland Forecasting Centre, Macro Strategic Model outputs
21 The Congestion QuestionPart 2: The challenge
The modelling indicates that in 2016 only 39 percent of the potential labour force was available to
employers within a 30 minute car journey. This is a significant decline compared to the 51 percent
availability calculated for 2013 – suggesting that congestion has exacerbated skills shortages, even with
population growth.
Looking forward, Auckland’s total labour force is projected to increase by around 280,000, or 40 percent,
over 30 years. However, the congestion levels mean that the potential number of employees available to
a business within a 30-minute car trip only increases by 87, 000, or 34 percent, over the next 30 years (see
figure 07). Although access to the labour force by public transport improves, cars are expected to remain
the main mode by which people get to work, accounting for 69 percent of commuting trips in 2046.
Consequently, the increases in congestion and slower travel times mean that many of the potential
benefits from Auckland’s growth, such as the increased productivity that would arise from a larger
and more connected labour force, are likely to be limited.
In summary, our analysis shows that Auckland’s congestion has worsened over the past few years.
Although future investment is expected to make a critical contribution, without some form of
congestion pricing, congestion will continue to increase and overall network performance will
deteriorate further. The result is that Aucklanders access to jobs, education and other opportunities
will become more difficult and the benefits of growth will be limited.
Figure 07.
Access to the labour pool in the morning peak
Access to the labour pool: number of potential Access to the labour pool: proportion
employees accessible within a reasonable of total labour pool accessible within
Proportion of total potential employees accessible
travel time (AM peak) a reasonable travel time (AM peak)
Number of potential employees accessible
45%
40K 40%
350K 35%
300K 30%
250K 25%
200K 20%
150K 15%
100K 10%
50K 5%
2013 2026 2036 2046 2013 2026 2036 2046
Car 30 mins PT 45 mins Car 30 mins PT 45 mins
Source: Auckland Forecasting Centre, Macro Strategic Model outputs
The Congestion Question 22Part 3: What is congestion pricing and how does it work?
Part 3: Congestion Pricing

                                    3.1
                                    Definition
                                    What is congestion pricing?
                                    Currently, motorists pay for the use of roads through a range of methods: petrol taxes, road user
                                    charges, vehicle registration fees and rates. These charges do not take into account the time or location
                                    of travel – for example, driving on a congested motorway in rush hour versus driving along a quiet road
                                    late at night. However, the true costs of these two journeys are very different – driving at peak times
                                    adds to the congestion on the road, which affects (or has a ‘cost’ to) other road users. These costs
                                    affect both the economy (for example, by adding to freight travel times and costs) and individuals
                                    (for example, people have less time at home with family).

                                    Congestion pricing is a method used to ease congestion by charging road users at different times and/
                                    or locations to encourage some users to change the time, route or way in which they travel.

                                    Implementing a congestion pricing scheme would more accurately reflect where the cost of using
                                    the roads is higher, thereby encouraging people to think about travelling in different ways – this is an
                                    example of influencing travel demand. Having a higher cost where the roads are congested, in order to
                                    manage demand, can increase the number of vehicles that can move along a road in any given time, as
                                    it increases the average speed of traffic. Even a relatively small reduction in traffic can have a big impact
                                    on congestion.

                       25 The Congestion Question
Part 3: Congestion Pricing
Part 3: Congestion Pricing

                                    There are conceptually four types of congestion pricing:

                                                                Charging vehicles for crossing a boundary or driving within that
                                       Area-based               boundary at specific times of day.

                                                                Example: London (figure 08)

                                                                Charging vehicles for crossing a ring or line of charge points across
                                                                a series of roads at specific times of day. Unlike area-based schemes,
                                       Cordon-based             cordon-based schemes do not charge for traffic movement solely within
                                                                the cordon.

                                                                Example: Stockholm (figure 09), Gothenburg

                                                                Charging vehicles to use one or more of the roads in a specific
                                       Corridor-based           congested corridor or corridors (main highway and secondary routes).

                                                                Example: Dubai (figure 10), Singapore

                                                                Charging vehicles for travel on all congested roads in a defined
                                       Network-based            geographical area.

                                                                Example: Singapore from 2020, proposed for London

                       27 The Congestion Question
Part 3: Congestion Pricing
Figure 08.
Area scheme London
Figure 09.
Cordon scheme Stockholm
Figure 10.
Corridor scheme Dubai
The Congestion Question 28Part 3: Congestion Pricing
3.2
How has congestion pricing
been used internationally?
Our review of international experiences demonstrates that congestion pricing can influence travel
demand and ease congestion8. Some jurisdictions have used congestion pricing to reduce congestion
within the targeted areas at peak periods by 15-30 percent. This is similar to the reduction in morning
peak congestion levels associated with school holiday periods in Auckland.
While some overseas jurisdictions have successfully introduced a congestion pricing scheme, many
others have attempted but not proceeded. We can learn lessons from both successful and unsuccessful
attempts, and it is important we tailor these to Auckland’s specific challenges.
Why is Auckland different?
No ‘New World’ city with dispersed trip patterns and relatively low density of housing
has yet introduced congestion pricing9. The widespread nature of Auckland’s congestion
means that schemes that have worked well elsewhere may not be as effective in improving
congestion across Auckland.
Auckland’s geography, urban form, trip patterns, and governance require bespoke policies,
public involvement, design and delivery that build incrementally to address
the most widely acknowledged challenges.
8
Review of international pricing initiatives, previous reports and technologies for demand management purposes – D’Artagnan Consulting
9
I n the United States, some cities have developed networks of high occupancy/toll lanes that enable motorists willing to pay for priority lanes
to bypass congested part of the highway network. They are not, strictly speaking, congestion pricing schemes as they do not relieve congestion,
but provide a congestion free alternative.
29 The Congestion QuestionPart 3: Congestion Pricing
Part 3: Congestion Pricing

                                    The international review has provided the following lessons to inform our consideration of whether
                                    congestion pricing is right for Auckland and what it should look like. The case studies below also
                                    identify the key points of difference between Auckland and the city being discussed.

                                    Policy lessons
                                             •      Establish clear objectives that address an agreed problem. Diverse and competing interests
                                                    can lead to too many objectives and subsequent public scepticism.

                                             •      Focus on the most obvious broadly recognised problems and design a solution that
                                                    persuasively addresses them.

                                             •      Lead with policy, not technology – let policy lead technology choices, even if technology
                                                    choices may provide limits around what is achievable on a step-by-step basis.

                                             •      Ensuring clarity on how revenue will be used is critical to building public acceptance. It helps
                                                    for at least some of the revenue to be applied to roads, demonstrating a clear benefit to those
                                                    paying to use the roads.

                                             •      Ensure the scheme design considers distributional impacts – with the right information,
                                                    economic appraisal can identify how social benefits and costs of reduced congestion are
                                                    distributed. Such information can help in designing more targeted congestion charging,
                                                    and in identifying any remedy needed to address any distributional impacts.

                                             •      Consider complementary measures – core to successful schemes internationally has been
                                                    the availability of sufficient high quality public transport to support modal shift where this
                                                    has been a viable alternative. There is also a need to ensure bypass routes around charging
                                                    locations can manage increased demand for changes to traffic patterns.

                                             •      Poorly designed schemes can disproportionately affect those least able to pay,
                                                    particularly in areas with high private vehicle use by people on low incomes. For users heavily
                                                    affected by the scheme, exemptions or discounts or some other measure to mitigate negative
                                                    impacts may need to be considered, but care should be taken not to undermine the scheme’s
                                                    effectiveness.

                       31 The Congestion Question
Case study: Stockholm and Gothenburg Stockholm introduced a cordon charge in 2007, with prices varying between peak and off-peak. This came after a comprehensive pilot, which effectively trialled the full scheme for six months, exposing the public to the impacts of the scheme. It was followed by a referendum providing a narrow mandate to proceed. Today the scheme has a high degree of public acceptance and has largely sustained the benefits of its introduction, with charges increased once and an expansion of the scheme to charge through-traffic. Most of the net revenues have been used to fund major urban road improvements (including a bypass route to the charging zone), but more recently have also been used to fund public transport and cycling infrastructure. An attempt to replicate the success of Stockholm’s scheme in Gothenburg provides a cautionary tale. Gothenburg introduced congestion pricing in 2013, which makes it the most recent jurisdiction to introduce such a scheme. However, it has much lower levels of public acceptance. This is because Gothenburg has much less serious congestion than Stockholm, much lower mode share for public transport, and the scheme was designed principally to maximise revenue, rather than to target congestion. It was intended to use the revenue raised from the Gothenburg scheme to fund a package of transport investments, the biggest of which is an underground rail tunnel which has yet to be completed. Research shows that users do not perceive any major benefits from the scheme. Although congestion was largely concentrated in one location during peak periods, the scheme operates all day across a cordon. This has created concerns about community severance and unfairness. Auckland’s points of difference A key point of difference between Auckland and Stockholm is the higher use of public transport in Stockholm and higher density of trips into the central area. Gothenburg has a higher car dependency than Auckland, but unlike Auckland, its congestion highly concentrated in a few areas rather than widespread.
Part 3: Congestion Pricing

                                    Public acceptance and communications lessons
                                            •       Lack of public acceptance is the single biggest factor that has halted development of urban
                                                    congestion pricing schemes internationally. Successful schemes have achieved synergy
                                                    between policy, design and communications with the public, particularly those most likely to
                                                    pay the charge.

                                            •       Take charge of communications by leading the public narrative on the purpose of the
                                                    scheme and the benefits to road users.

                                            •       Provide plenty of information and be responsive by ensuring the public has access to all
                                                    the information it needs, and have answers for as many questions as possible. The more
                                                    responsive the communications and information, the greater public confidence will be.
                                                    Have a strategic engagement strategy for all parts of the scheme.

                                            •       Use demonstrations/pilots to engage with the public as these can be valuable in building
                                                    public confidence by focusing people on a real-life application and engaging public opinion
                                                    on different policy and user options. Trials can be used for a variety of purposes, including
                                                    testing technology, proving the impact of the scheme on demand, testing interfaces
                                                    between customer service and account management, or obtaining feedback on options from
                                                    participants.

                       33 The Congestion Question
Part 3: Congestion Pricing Singapore Singapore was the first jurisdiction to introduce congestion pricing and it currently operates by far the most sophisticated and effective system. It started using a paper-based area licensing scheme in the CBD in 1975 and progressed to today’s cordon, arterial and expressway-based scheme in 1998. This involves around 80 charging points covering two adjacent cordons and some strategic corridors. The prices at each charging point are reviewed every three months to ensure speeds on the routes that are charged are within ranges of 45-65 kilometres per hour for expressways, and 20-30 kilometres per hour for local streets. When the average speed drops below the bottom of the target range, the price is increased, and if the average speed exceeds the top of the range it is reduced. The gantries used to detect and process payment are some of the largest and most expensive used for urban congestion pricing anywhere, taking up 11m of road length. By 2020, Singapore will be the first to introduce a Global Navigation Satellite System (GNSS) urban congestion pricing scheme. This will be capable of enabling full network-based (distance, time and location and vehicle type) pricing – but will, in the first instance, be used to replicate the existing pricing system and then evolve over time to apply charges on a more flexible basis. Some gantries (although far fewer than currently in place) will need to be retained for enforcement purposes. Auckland’s points of difference Singapore’s political culture, urban form and geography are significantly different to those of any other city. Compared to Auckland, housing density is much higher, car ownership is much lower and public transport is much more extensive.
Part 3: Congestion Pricing

                                    Design lessons
                                            •       Start small and evolve – focus on designing a scheme that can easily be implemented
                                                    and that will demonstrate clear and sustainable benefits without constraining options for
                                                    scalability and flexibility to evolve further. Design a scheme that will be effective in improving
                                                    conditions for the location/s targeted but don’t promise a magic bullet.

                                            •       Don’t chase perfection first up as complexity risks confusion, suspicion and public
                                                    opposition. Singapore started with a simple, easy to understand, but effective scheme.
                                                    It evolved and expanded over subsequent years into a sophisticated system.

                                            •       Balance simplicity with a targeted approach – target congestion where and when it occurs.
                                                    The blunter the scheme, the greater the concerns about fairness and the need to mitigate
                                                    equity issues.

                                            •       Maintain momentum – there is no ideal timeframe from conception to implementation.
                                                    Long timeframes create challenges for sustaining broad agreement and maintaining scope.
                                                    Early agreement can be undermined by changes in political landscape. Evidence suggests
                                                    Auckland should be able to implement a pilot or small scheme within two and a half years
                                                    once agreement to proceed on a chosen option is reached.

                                            •       Minimise discounts and exemptions – while these can be useful to avoid charging vehicles
                                                    that are not intended to be deterred from travelling, they reduce the scheme’s impact on
                                                    congestion, increase costs and can create opportunities for defrauding the scheme.
                                                    In London, a long list of vehicles with substantial discounts or exemptions has undermined
                                                    its core objective. Today it is estimated that 50 percent of vehicles circulating in the London
                                                    charging area are subject to a discount or exemption.

                       35 The Congestion Question
Part 3: Congestion Pricing
London
London was the first major European city to introduce congestion pricing in 2003.
It operates an area scheme that is conceptually simple, introduced under a political mandate. Initial
reductions in congestion were high inside and approaching the charged area (20-30 percent). Due to
growth in traffic (particularly vehicles subject to exemptions) and significant re-allocation of road space
to public transport, walking and cycling, congestion is now back to levels seen before the charge was
introduced. Nonetheless, the congestion pricing is still having some impact and congestion in central
London would be much worse without it.
A recent report10 indicates the current scheme is no longer fit for purpose and the Mayor’s draft
transport strategy 2017 proposes the eventual replacement of the scheme with full network road pricing
across Greater London based on time, location and distance. In the meantime, an ultra low emission
zone is proposed to cover much of inner London (around 20 percent of London by area) by 2021.
Auckland’s points of difference
Compared to Auckland, London has greater density, and higher levels of traffic congestion and public
transport use. Prior to introducing the congestion charge, only 12 percent of trips into the charging
zone were undertaken by car – by comparison, just under 50 percent of trips into Auckland’s CBD are
by private vehicle. The congestion charging zone in London covers an area of 21 square kilometres, an
area over four times larger than Auckland’s CBD (4.3 square kilometres).
10
London Stalling – London Assembly Transport CommitteePart 3: Congestion Pricing
3.3
Has congestion pricing been
considered in Auckland before?
Although congestion pricing has not been introduced in New Zealand, central government and
Auckland Council have looked at it several times over the past 15 years to examine the merits and
consider the options to influence travel demand in Auckland. These include consideration of cordon
and area schemes, motorway tolling, and parking levies.
We reviewed this previous work for any lessons for this project. Overall, we found most of the schemes
previously investigated had shortcomings, either in their ability to ease congestion or in the resulting
economic and social impacts.
The Ministry of Transport’s Auckland Road Pricing Evaluation Study (ARPES) 2006 and Auckland Road
Pricing Study (ARPS) 2008 concluded that there could be considerable merits in introducing congestion
pricing, but identified shortcomings to all the options, particularly around either local economic and
social impacts, or traffic impacts.
Auckland Council’s Future Auckland Transport Funding Report looked at a motorway toll as one option
to raise additional revenue for transport in Auckland (rather than to ease congestion). It found that a
motorway user charge could have net positive impacts on Auckland if it encouraged behaviour change
that could reduce congestion, but did not consider equity issues.Part 3: Congestion Pricing 3.4 What are the technology options for congestion pricing? We reviewed the technology options currently available to implement congestion pricing, as well as technologies that might be available in the near future11. We found that automatic number plate recognition technology is likely to be the most suitable and cost-effective solution for a congestion pricing scheme that is available today. This is already in use on New Zealand’s three toll roads and would be necessary for any scheme for enforcement purposes. In the near future, in-vehicle technology incorporating a Global Satellite Navigation System (GNSS) could offer a more sophisticated solution, but there are a number of risks and logistical barriers to overcome before this is feasible. GNSS is not yet proven for urban congestion pricing, with Singapore expected to be the first city to introduce such a scheme by 2020. Expansion and evolution of the current electronic Road User Charges (eRUC) system for heavy vehicles in New Zealand could be one pathway for any eventual implementation of GNSS-based systems for demand management purposes. Given the inherent uncertainty around how transport technologies might evolve, it is important that we consider the flexibility and scalability of any pricing option for Auckland. 11 Review of international pricing initiatives, previous reports and technologies for demand management purposes – D’Artagnan Consulting
Part 3: Congestion Pricing

                                    Existing technology
                                             •      Dedicated Short Range Communications (DSRC): otherwise known as ‘tag and beacon’.
                                                    This is very reliable (99 percent) but relatively expensive as it involves gantries or poles for
                                                    antennae and beacons for each charging point, and each vehicle must be equipped with
                                                    a small electronic ‘tag’ so they can be detected. Number plate recognition would still be
                                                    required for enforcement. DSRC was first used for free-flow tolling12 in 1997, and has been
                                                    used in first generation road charging schemes and extensively in Australia on toll roads.
                                                    DSRC is now becoming obsolete as newer technologies mature.

                                             •      Automatic Number Plate Recognition (ANPR): converts images of number plates into digital
                                                    information that allow a vehicle to be identified and matched to owner accounts and charging
                                                    products, as well as enabling identification through the Motor Vehicle Register. It is already
                                                    used in New Zealand’s three toll roads to identify and charge vehicles. As imaging and camera
                                                    technology have improved significantly in recent years, ANPR is starting to replace DSRC
                                                    as a means of identifying vehicles for charging purposes, because its accuracy and reliability
                                                    means the ‘tags’ used for DSRC are no longer necessary.

                                                    Costs are dependent on the number of charging points as cameras need to be located at
                                                    each point for each direction of travel to capture images for all lanes. Gantries are not always
                                                    required for ANPR – cameras can be fitted to poles or lamp-posts (depending on the road
                                                    configuration), as is the case in London.

                                                    ANPR is an essential element of any urban road pricing scheme for enforcement purposes
                                                    (proof of time and place of a vehicle). For any system that may use other technologies, ANPR
                                                    would also be needed as a backup charging system for occasional users, unless any other
                                                    technology were made mandatory (for example, GNSS On Board Units).

                                             •      Electronic Road User Charges (eRUC): used in six European countries for heavy vehicles and
                                                    in Oregon (USA) for heavy and light vehicles 13. It is currently used in New Zealand as an option
                                                    to measure road use and pay road user charges for approximately 12 percent of the heavy
                                                    vehicle fleet14. This is a GNSS-based charging system (see next page) based on weight, vehicle
                                                    type/configuration and road type.

                                    12
                                         Tolling that does not require a vehicle to slow down or stop to pay the toll
                                    13
                                        I n Oregon, eRUC is an option to pay heavy vehicle weight-distance tax, similar to NZ,
                                         and is an option for light vehicles choosing to pay by distance instead of fuel tax as part of the OReGO pilot.
                                       Evaluation of the new road user charges system 2016
                                    14

                       39 The Congestion Question
Part 3: Congestion Pricing
Emerging technology
• Global Navigation System by Satellite (GNSS): the only emerging technology capable of
implementing a full network-based congestion pricing scheme. This would require devices
to be installed in every vehicle (called an On Board Unit – OBU) that receive signals from a
satellite-based navigation system to enable the OBU to identify when and where a vehicle is
travelling.
This system has the advantage of being able to charge different road segments at different
times of day, to enable congested routes to be targeted directly. It does not require roadside
infrastructure at each charging point.
This is leading edge technology that has not yet been implemented for full network
congestion pricing in any city to date (although it has been used for less complex forms
of road pricing). The sheer volume of OBUs required in Auckland, which would need to be
distributed to vehicle owners to install in each vehicle, could present logistical issues with
the adoption of this technology. The technology would need to be supplemented with ANPR
to service out-of-town or occasional users without OBUs in their vehicle.
• In-vehicle telematics: electronic, vehicle-based systems employing wireless communications
that transmit data to a supplier’s system, including GNSS technologies. As connected vehicle
technologies emerge, these systems are becoming more sophisticated and may have the
capability to incorporate applications to enable network based charging. Currently no
jurisdiction uses this technology for road charging, in part due to the lack of interest most
vehicle manufacturers have shown in making such systems available for these purposes.
Due to New Zealand’s slow fleet turnover it will be many years before this technology is
widespread enough to become useful for congestion pricing, and would require specific
agreements with individual vehicle manufacturers and telematics providers to be feasible.
• Smartphones: these have had GNSS technology as standard since 2009. Smartphones could
have useful applications to alert drivers to impending charge zones, enable management
of congestion pricing accounts, provide means for occasional users to pay for road use and
advise on alternatives such as public transport and park and ride services outside the zone.
However, smartphones alone cannot be used for urban road charging because they need
to be reliably correlated to a specific vehicle (not a person), they lack accuracy to reliably
distinguish the locations of charging points, and not everybody owns a smartphone.
The Congestion Question 40Part 4: What’s next for the project?
Part 4: What’s next?

                              4.1
                              How will we explore with Aucklanders
                              whether congestion pricing should be
                              part of the solution?
                              Public understanding is key
                              While there may be several approaches to congestion pricing that could be effective, they are unlikely
                              to be successful if people do not understand or accept its potential. The key impacts of congestion
                              pricing on those using the transport system, businesses and households, including fairness, equity
                              and distributional impacts, will also have to be carefully considered. There may need to be trade offs
                              between addressing these impacts, such as through mitigations or exemptions, and the effectiveness
                              of the overall scheme in reducing congestion.

                              Alongside our analytical framework for assessing congestion pricing options, it will be critical for us
                              to involve Aucklanders as we develop and evaluate options to inform our recommendations on whether
                              to introduce congestion pricing.

                              Communication and engagement strategy
                              We have developed a communication and engagement strategy for the project. This has four objectives:

                                      1.      Stakeholders and the Auckland public understand how the project relates to them and the
                                              broader context of improvements to the transport system.

                                      2. The Auckland public has opportunities to inform the course of the project.

                                      3. The project, its leadership and the processes used are seen as credible.

                                      4. Participating agencies have sufficient understanding of the position of stakeholders and the
                                         Auckland public to inform their recommendations.

                              The initial focus of the strategy has been on progressing the following important elements necessary
                              to plan meaningful and appropriate public involvement in the project.

                                      1.      Stakeholder identification, understanding and initial engagement to ensure existing
                                              knowledge and networks are used to understand and involve a range of Auckland’s interest
                                              groups and diverse communities.

                                      2. A benchmarking research programme to understand where different groups of Aucklanders
                                         are at with their thinking and understanding of congestion and solutions to address it.

                                      3. A visual identity established for the project, which is public-facing, including a website
                                         as the central source of information and updates.

                 43 The Congestion Question
Part 3: What’s next?
How Aucklanders can be involved
The research programme is designed to gain insights to help empower and engage key stakeholders
and the Auckland public. It will be an iterative process where research is both an input (knowledge
gathering and listening) and output (information sharing) of the public’s involvement.
A Stakeholder Working Group will be established as a forum to ensure key stakeholders are in a position
to inform how best to involve Auckland’s diverse communities and business interest groups in the
project, and to assist with this involvement.
The project website will be the initial hub for public information and involvement, supported by a social
media strategy.
As the project progresses, so too will the design of public involvement, informed by the research
and stakeholder engagement (including the insights of the Stakeholder Working Group).
The Congestion Question 44You can also read