2018 MISSOURI POVERTY REPORT - STATE OF THE STATE A BIENNIAL PUBLICATION FROM MISSOURIANS TO END POVERTY - caastlc
←
→
Page content transcription
If your browser does not render page correctly, please read the page content below

2018 MISSOURI
POVERTY
  S TAT E O F T HREPORT
                 E S TAT E
    A BIENNIAL PUBLICATION FROM MISSOURIANS TO END POVERTY

                                                             •1
51% of Missouri’s                                49% of Missouri’s
           population is female.                             population is male.

                                                                                   16.1% of Missouri’s
                                                                                   population is
                                                                                   65 years old or older.

                                                                                                            22.8%
                                                                                                            of Missouri’s
                                                                                                            population is
                                                                                                            18 years old
                                                                                                            or younger.
          6.1% of
        Missouri’s
     population is
      6 years old
      or younger.                  A single dot represents
                                        approximately
                                       604 Missourians.

2•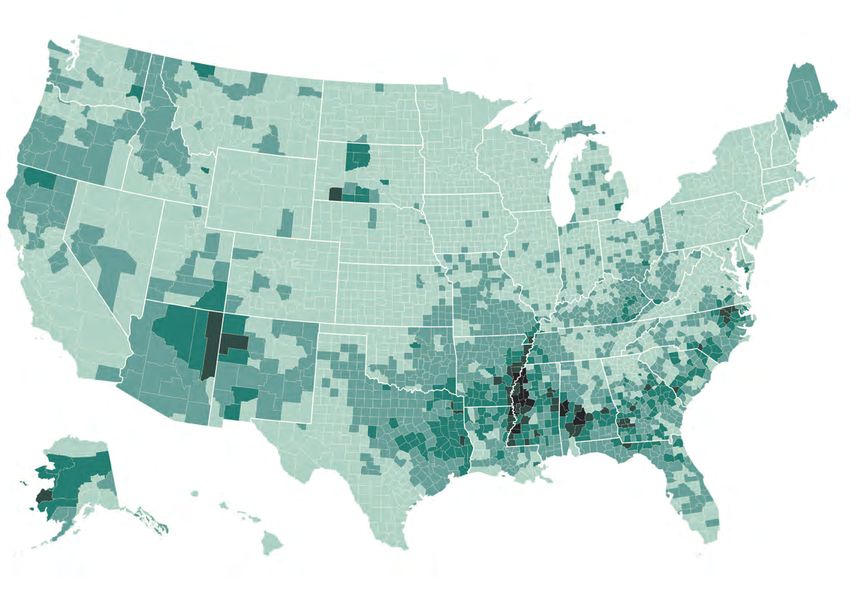
5 Elements
of Poverty
Throughout this
report, you’ll see
these symbols.
Each symbol
MISSOURI POVERTY represents one of
the five elements
The State of the State
of poverty.
Economic
and Family
Poverty. It’s a problem. A health care problem. A living wage problem. A food Security
insecurity problem. An affordable housing problem. It’s complex. Complicated.
And it is anything but linear. 12.7% of Americans currently live at or below the
Education
federal poverty level. In Missouri the poverty rate is even higher at 14%. For a
statewide population of 5,911,099, that’s 826,358 Missourians.
Food and
THE 2018 MISSOURI POVERTY REPORT, from 19.2% for children. In real numbers, poverty in Nutrition
Missourians to End Poverty, is created to Missouri impacts more than 826,358 individuals.
provide a comprehensive snapshot of poverty 260,867 Missouri children live in poverty. While
in Missouri. It is the hope of the coalition that many children are born into situations of Health
the facts and information surrounding poverty poverty, children have little to no control over
presented here give a better understanding of their situation. To address poverty, we need to
the realities of this important social issue. All help children. Children are part of families, and Housing
Missourians deserve the opportunity to thrive to help children we need to help families. and Energy
and to live with dignity. For this to be a reality, Factors pushing people into poverty include
for real change to take place, the issues need to affordable housing shortages, food insecurity, The information
be clearly defined and understood by you—the low-wage jobs, and increasing health care in this report
change makers, the difference makers. costs, among other things. Factors keeping is organized
Missourians to End Poverty has identified five people out of poverty include a strong support by these five
key factors that impact poverty—economic and system, social and welfare programs, organized elements. Just
family security, education, food and nutrition, community efforts, employment, and tax as these areas
health, and housing and energy. These factors, reform. All of these help individuals, families, are inexplicably
or elements of poverty, guide the advocacy and children work toward thriving lives. interconnected
work of the coalition. When there is struggle in Perhaps you don’t see poverty around you. in real life, so is
the information
one of these areas, the other areas in a person’s But it’s there. Your children’s classmates, your
within this report.
life suffer. Together these elements highlight friends, neighbors, people in your community, We have shown
poverty’s interconnected nature and the need and your fellow Missourians are faced with a glimpse of this
for multi-dimensional solutions. situations of poverty for different reasons interwoven aspect
Missouri is a state rich in natural beauty. at different times. You can help. When your by illustrating
Opportunities for education and employment, child’s classmates do well, yours do, too. When the connection
security and health, individual success, and your neighbors do well, you do, too. When between elements
dignity should be just as abundant. However, your community does well, so do you. We are of poverty where
the statewide poverty rate is 14% overall, and Missourians to End Poverty. We’ll show you. possible. So much
of the interrelated
Missouri’s nature of these
state motto is elements of
“Salus Populi poverty is unseen,
Suprema Lex yet we hope to
Esto”, which illuminate the
means “Let the reality of the
welfare of the many Missourians
people be the experiencing
supreme law.” situations of
Let it be so. poverty.
•3Poverty: An Overview
Poverty. How is it defined? What does it look like across the United States? What does it look like in Missouri?
Is Missouri any better or worse than other states? The information here, primarily provided by the US Census
Bureau’s 2017 release of poverty data, aims to address these questions. The level of poverty across Missouri,
and our nation, has changed over time. Here is what poverty looks like according to available data.
Measuring Poverty Poverty Across the United States
Official Poverty Measure This 2017 US Census Bureau poverty data shows poverty rates for the United States
The current official poverty measure in 2016. States with the lined pattern indicate a statistically significant decrease in
was developed in 1963 and is based on poverty rate from last US Census reporting. Vermont, labeled with the dot pattern, is
the cost of the minimum food diet for the only state with a statistically significant increase in poverty rate. States without a
various family sizes in today’s prices pattern had no statistically significant change in poverty rate. US Census Bureau
multiplied by 3. This official poverty
calculation does not take into account
the value of federal benefits, such as
those provided by the Supplemental
Nutrition Assistance Program (SNAP),
and housing and energy assistance.
Neither does it account for typical
household expenses such as work
expenses or child care.
Supplemental Poverty Measure Poverty
The Supplemental Poverty Measure Rates
by State
considers family resources, such as
>18%
income, along with benefits including
16% to 17.9%
SNAP, subsidized housing, and the
13% to 15.9%
Low-Income Home Energy Assistance
11% to 12.9%
Program (LIHEAP). 2016 US Census
poverty data released in 2017 does not < 11%
show a statistically significant difference 12.7% Increase
between poverty rate and supplemental 20%
of all people in the US live Decrease
poverty rate for Missouri. below the poverty level.
2018 Poverty Guidelines 10 Year Snapshot: Missouri 16.2%
The Poverty Guidelines are determined Missouri’s poverty rate steadily increased 15%
by the Department of Health and from 13.3% in 2007 to 16.2% in 2012. Since
Human Services and updated annually. 2012, the poverty rate has declined to 14%. 14%
13.3%
The amounts are based on number of The US Census Bureau deems the 2016 rate
persons in a family per household. For as a statistically significant decrease.
US Census Bureau Small Area Income 10%
families or households with more than
8 persons, $4,320 is added for each and Poverty Estimates
additional person. For 2018, poverty
07
08
09
10
11
12
13
14
15
16
20
20
20
20
20
20
20
20
20
20
guidelines for the 48 contiguous states
and Washington DC are:
10 Missouri Counties with Highest Poverty Rate
PERSONS/ GROSS MISSOURI POVERTY MEDIAN EDUCATIONAL NO HEALTH
HOUSEHOLD INCOME COUNTY RATE INCOME ATTAINMENT* INSURANCE**
1 ................................ $12,140 1. Pemiscot County.......... 30.9%............. $31,671........... 74.8%......................... 13.0%
2................................ $16,460 2. Texas County................ 29.9%............. $35,730........... 82.1%......................... 15.8%
3 ................................ $20,780 3. Mississippi County........ 28.4%............. $29,214........... 72.8%......................... 15.1%
4 ................................ $25,100 4. Ripley County............... 27.7%............. $34,145........... 78.2%......................... 16.1%
5 ................................ $29,420 5. Dunklin County............. 27.2%............. $31,220........... 73.9%......................... 15.1%
6 ................................ $33,740 6. Shannon County.......... 26.4%............. $32,284........... 81.7%......................... 16.6%
7 ................................ $38,060 7. Wayne County.............. 26.0%............. $33,954........... 75.3%......................... 15.9%
8 ................................ $42,380 8. Ozark County................ 25.3%............. $31,087........... 83.8%......................... 17.8%
9. New Madrid County...... 25.0%............. $31,615........... 75.9%......................... 13.6%
10. Oregon County............. 24.9%............. $30,442........... 83.6%......................... 15.3%
*Percent of population with high school graduation or higher **Percent of population without health insurance under age 65
4•Missouri Poverty Rate: County by County
Missouri’s 2016 statewide poverty rate is 14%, a .8% change from 2015. Below are the poverty
rates by Missouri county. 23 counties have a poverty rate above 20%. Seven counties have a Missouri’s population is
poverty rate below 10%. US Census Bureau Small Area Income and Poverty Estimates
5,911,099
14.2% 17.5% 19.8% 16.1%
12.8%
ATCHISON
17%
NODAWAY
WORTH
18.1%
HARRISON
13.6%
MERCER
PUTNAM SCHUYLER SCOTLAND
15.5%
CLARK 14% 14%
14.6% 17% 23.8%
of Missourians
14.1% GENTRY
17.1%
SULLIVAN
ADAIR 18.9% 16.9% live below
HOLT GRUNDY KNOX
9.7% LEWIS
the federal
ANDREW 16.9%
15.7% DAVIESS 16.1% 16.3%
poverty level.
DEKALB 16.6% 14.5%
LINN MACON
SHELBY MARION
17.6%
17.8%
BUCHANAN 10.4%
CLINTON
12.7%
CALDWELL
LIVINGSTON
13.3%
15.4%
10.9%
RALLS
826,358
16.6% CHARITON
16.1% MONROE Missourians are at
6.1% CARROLL RANDOLPH
PLATTE 8.4% 11% 18% or below 100% of the
RAY PIKE
CLAY
17% federal poverty level.
15.9% 15.9% AUDRAIN
HOWARD 11.2%
12.7% SALINE
15.6%
15.5% LAFAYETTE 16.6% LINCOLN
JACKSON BOONE MONTGOMERY
14.7% 11.6%
COOPER CALLAWAY
11.8% 5.2%
14.4% 15.2%
WARREN ST. CHARLES
8.7% JOHNSON PETTIS 24.3%
CASS
11.6% 9.2% CITY OF
MONITEAU 12.1% ST. LOUIS ST. LOUIS
10.9% GASCONADE
19.6% COLE 8.6%
20.7% OSAGE 10.7%
MORGAN FRANKLIN
HENRY 17.9% 10.1%
13.8% BENTON
BATES 16.3% JEFFERSON
MILLER 15.2%
MARIES
20.7% 16.8%
ST. CLAIR CAMDEN 18.6% 22%
19.3% CRAWFORD WASHINGTON 11.7%
HICKORY 19.6% STE.
17.5% 14.2% PHELPS GENEVIEVE
VERNON PULASKI
Percent of 19.8% 16.3% 10.3%
CEDAR 18.6% 15.7% 22.4% ST. FRANCOIS PERRY
Missouri 16.8% DALLAS LACLEDE 19.8%
Population POLK DENT IRON
16.1% 18% 15.2%
Living in BARTON 17.5% MADISON CAPE
Poverty DADE 22.1% GIRARDEAU
16.7% 24.2% 29.9% REYNOLDS
by County 16.5% WEBSTER WRIGHT TEXAS 26.4% 17.4%
17.5% GREENE
SHANNON BOLLINGER
JASPER 14.9% 26%
> 25% WAYNE
LAWRENCE 18.4%
20%-24.9% 10.7% 19.8% 21.2% SCOTT
14.3% CHRISTIAN DOUGLAS CARTER
15%-19.9% NEWTON 19.1% MISSISSIPPI
20.5% STODDARD 28.4%
21.4% 12.9% HOWELL 22%
10%-14.9% 24.9% BUTLER
21.4% BARRY STONE 17% 25.3% OREGON
27.7%
< 10% McDONALD TANEY OZARK RIPLEY
25%
NEW MADRID
30.9%
10 Missouri Counties with Lowest Poverty Rate 27.2%
PEMISCOT
DUNKLIN
MISSOURI POVERTY MEDIAN EDUCATIONAL NO HEALTH
COUNTY RATE INCOME ATTAINMENT* INSURANCE** Missouri’s child
1. St. Charles County ....... 5.2%............... $75,603........... 94.3%......................... 7.0% poverty rate is higher
2. Platte County................ 6.1%............... $70,879........... 95.3%......................... 7.9% than the overall state 19.2%
3. Clay County.................. 8.4%............... $63,702........... 92.7%......................... 9.3% poverty rate of 14%.
4. Osage County .............. 8.6%............... $54,119........... 90.3%......................... 10.5%
5.
6.
Cass County.................. 8.7%............... $63,613........... 92.5%......................... 9.2%
St. Louis County........... 9.2%............... $61,103........... 93.0%......................... 8.2%
19.2%
of Missouri children
7. Andrew County............. 9.7%............... $54,804........... 90.6%......................... 10.0%
8. Jefferson County.......... 10.1%............. $58,232........... 87.5%......................... 10.8% live in poverty.
9. Perry County................. 10.3%............. $53,014........... 87.5%......................... 10.4%
10. Clinton County............. 10.4%............. $57,486........... 92.5%......................... 10.3% 260,867
*Percent of population with high school graduation or higher **Percent of population without health insurance under age 65 Missouri children live in poverty.
•5Economic and Family Security
Economic and family security is foundational for the well-being of an individual or family. A variety of factors
impact economic and family security. Many of these issues are related to the local economy, availability of
employment, minimum wage regulations, and taxes. Here is a snapshot of the factors surrounding economic
and family security for Missourians.
Minimum Wage in Missouri What Is a Living Wage in Missouri?
In many American communities, families working low-wage jobs make insufficient
$
7.85
income to live at a minimum standard of living given the local cost of living. MIT
developed a living wage calculator to estimate the cost of living in communities
across the US. The Missouri statewide living wage average shown below is the hourly
As of January 1, 2018, the minimum rate that an individual must earn to support his or her family, if they are the sole
wage in Missouri is $7.85. Over the past provider working full-time. Dr. Amy K. Glasmeier; Massachusetts Institute of Technology
10 years, the minimum wage increased
by 80 cents, from $7.05 in 2009. Studies show
Washington has the highest minimum that most
wage in the US at $11.50, and several children
states have enacted gradual minimum 1 Adult 1 Adult 1 Adult 1 Adult 1 Adult raised in
wage increases to take effect over the Working $10.76 1 Child 2 Children 3 Children low-income
next several years. Wyoming has the Full Time $23.45 $26.96 $33.97 families will
lowest minimum wage at $5.15 an hour. likely have
Six states do not have a state-mandated very low
minimum wage. Bureau of Labor Statistics incomes as
2 Adults 2 Adults 2 Adults 2 Adults 2 Adults adults, while
1 Working $18.36 1 Child 2 Children 3 Children children
$12
Full Time $21.92 $25.39 $27.98 raised in
Washington: $11.50
high-income
$11 families can
anticipate
$10 very high
2 Adults 2 Adults 2 Adults 2 Adults 2 Adults incomes as
$9 Both $9.18 1 Child 2 Children 3 Children adults.
Working $12.62 $15.09 $17.30
$8 $7.85 Full Time 43%
*The MIT living wage calculator of children
does not extrapolate all born to the
$7 family scenarios for part-time poorest
2 Adults 2 Adults* households. Only one is used for
families
1 Full Time 1 Child illustration purposes.
$6 remain
1 Part Time $16.50
poor into
Wyoming: $5.15
$5 adulthood.
Pew Charitable
Trusts
09
10
11
12
13
14
15
16
17
18
20
20
20
20
20
20
20
20
20
20
>$200,000: 3.5%
$150,000-$199,999: 3.9% The median income for men in
Before taxes, a Missourian Missouri is $10,830
working full time for 40Missouri vs. US National Unemployment Rates
Since 2011, the Missouri unemployment rate has been lower than the US average. The state’s average unemployment rate for
2017 was 3.8% with a high of 4.2% in January and a low of 3.4% in November. Overall, Missouri has seen a steady decline in the
unemployment rate since it peaked in 2010 following an uptick after the 2008 economic crash. At the end of 2017, Missouri ranked
16th in unemployment. Hawaii’s 2% unemployment rate ranked 1st, and Alaska’s 7.3% ranked 51st. Bureau of Labor Statistics
12%
10%
8% Missouri Average: 3.8%
6% National Average: 4.1%
4%
2%
0% J F M A M J J A S ON D J F M A M J J A S ON D J F M A M J J A S ON D J F M A M J J A S ON D J F M A M J J A S ON D J F M A M J J A S ON D J F M A M J J A S ON D J F M A M J J A S ON D J F M A M J J A S ON D J F M A M J J A S ON D
2008 2009 2010 2011 2012 2013 2014 2015 2016 2017
Earned Income Tax Credit
Earned Income Tax Credit, or EITC, is a tax benefit designed to help For Tax Year 2015 Asset Poverty
low-to-moderate income, working people. Workers must file tax
returns to receive the credit. The federal government, 26 states, 519,000 Asset poverty expands the notion of
poverty to include how much of a
and Washington DC have credits. Missouri does not have an EITC. Missourians financial cushion a household has to
More than 27 million Americans received almost $67 billion in claimed the weather a financial crisis such as a
federal EITC. job loss, medical emergency or the
federal, refundable credits in the year 2015. An estimated 20% of
eligible workers do not claim the EITC. $2,377 need to fix a car. It can be defined as a
household’s inability to access wealth
EITC refunds are a fiscal stimulus to US Census Bureau annual was the average resources that are sufficient to provide
the state, work incentive to the recipient, poverty data show federal federal EITC for a for basic needs for a period of three
child care assistance where applicable, refundable tax credits as total of months. Experts have agreed that three
and a financial asset and savings tool. It the second most important
can boost financial assets for families, anti-poverty program after $1.2 months of living expenses at the poverty
level is a conservative cushion for a
helping them avoid future financial
setback, all while putting new money
Social Security.
billion family that loses its income. Estimation
of asset poverty is based on household
in Earned Income
into the economy. 519,000 Missourians filed for the federal EITC net worth—durable assets, such as a
Tax Credits home or business, that would need
for tax year 2015. The average EITC was $2,377. That’s $1.2 billion helping Missouri to be liquidated in order to help cover
boosting Missouri’s economy and helping Missouri families. families. day-to-day expenses. Even with this
National Conference of State Legislators
conservative definition, asset poverty
exceeds income poverty in all states
except for South Carolina. Prosperity Now
College Debt Unbanked and Underbanked
Class of 2016 Missouri 8.5% of Missouri’s households are If we believe that low-income families
graduates have an unbanked, or not served by a bank or should have the chance to build a
average debt of similar financial institution. 22.3% of pathway out of poverty, then we have
$27,532, ranking the state 29th for Missouri’s households are underbanked; to care about asset poverty. If we
amount of debt per graduate. 57% of these households had a checking or understand that poverty is a cycle that
Missouri college graduates have debt, savings account yet obtained financial often traps families from generation to
generation, then we have to care about
ranking the state 30th nationwide for products and services outside of the
asset poverty.
percent of students with debt. As cost banking system. This is —Compass Working Capital
of higher education increases, debt will higher than the US average
continue to increase. Read more about of 7% unbanked and 19.9% Missouri Poverty Rate: 14.0%
education on page 8. The Institute of underbanked. Federal Asset Poverty in Missouri: 27.4%
College Access and Success Deposit Insurance Corporation Liquid Asset Poverty: 40.1%
•7Education
Education is a key strategy for poverty reduction, but significant barriers exist for low-income students. Studies
show that educational attainment increases employment rates and earnings, which impact economic and family
security long-term. Education for children is also critical as it provides opportunity for development and growth,
and points to long-term success, including breaking generational cycles of poverty.
School Reading Levels A HEAD START National High School
According to the National Center for Education Statistics, MAKES ALL THE Graduation Rates
average reading scores for both 4th and 8th grade students DIFFERENCE Among the 50 states and
differ based on National School Lunch Program eligibility. Consistent evidence Washington DC, Missouri ranks
The score disparity between NSLP eligible and non-eligible has been found that 10th. National Center for Education
the positive effects Statistics 2014-2015 School Year
students is consistently about 20 points. National Center for
Education Statistics of Head Start during 1. Iowa..............................90.8%
its earliest years 2. New Jersey...................89.7%
GRADE YEAR NSLP Eligible Not Eligible transferred across 3. Alabama.......................89.3%
4. Texas.............................89.0%
4th Grade 2015 211 236 generations in the
2011 4th 5. Nebraska......................88.9%
4th Grade 2013 211 236 form of improved 6. Wisconsin.....................88.4%
graders are
4th Grade 2011 207 234 2015 8th
long-term outcomes 7. New Hampshire...........88.1%
graders. for the second 8. Kentucky......................88.0%
8th Grade 2015 255 278 Disparity in generation. 9. Tennessee....................87.9%
8th Grade 2013 256 277 score persists Read more 10. Missouri..................87.8%
as students 11. Vermont.......................87.7%
8th Grade 2011 255 276 age.
on page 19.
*Each year measures a new class of students. 12. Maine............................87.5%
13. Massachusetts.............87.3%
14. Connecticut.................87.2%
High School Graduation Rate 15. Indiana.........................87.1%
The National Center for Education Statistics lists Missouri 10th at 87.8% for 16. Maryland......................87.0%
graduation rate based on nationwide data for 2014-2015, the most recent available. 17. North Dakota...............86.6%
The Missouri Department of Elementary and Secondary Education shows 79 school 18. West Virginia................86.5%
districts, or 18% of the 438 districts reporting, had a high school graduation rate of 19. Montana.......................86.0%
100% in 2017. Of the 438 school districts reporting high school graduation rates, the 20. Virginia.........................85.7%
21. Kansas..........................85.7%
following five districts had the lowest graduation rates in 2017:
22. North Carolina.............85.6%
23. Illinois...........................85.6%
DeLaSalle Charter School...............................43.18% 24. Delaware......................85.6%
Division of Youth Service.................................45.89% 25. Arkansas.......................84.9%
St. Louis City..................................................52.16% 26. Utah..............................84.8%
Special School District St. Louis Co.................58.82% 27. Pennsylvania................84.8%
Kansas City 33................................................72.19% 28. South Dakota...............83.9%
Missouri Department of Elementary and Secondary Education 29. Rhode Island................83.2%
30. Oklahoma....................82.5%
31. California......................82.0%
Likelihood of Immediate College Attendance 32. Minnesota....................81.9%
Regardless of racial or socioeconomic demographics of their high school, graduates 33. Hawaii..........................81.6%
from high schools in the suburbs are most likely to immediately enroll in college. 34. Ohio..............................80.7%
35. South Carolina.............80.3%
Rural students are less likely to attend college the fall semester after high school
36. Michigan.......................79.8%
graduation than urban or suburban counterparts. This data reflects 2015 numbers, 37. Wyoming......................79.3%
the most recent available. National Student Clearinghouse 38. New York......................79.2%
College Enrollment Rates the Fall Semester Following High School Graduation 39. Idaho............................78.9%
40. Georgia.........................78.8%
Higher-Income, Urban 72% 41. Washington..................78.2%
Majority-White Suburban 73% 42. Florida..........................77.9%
Schools 43. Louisiana......................77.5%
Rural 61% 44. Arizona.........................77.4%
45. Colorado......................77.3%
Urban 62% 46. Alaska...........................75.6%
47. Mississippi....................75.4%
All Schools Suburban 67% 48. Oregon..........................73.8%
Rural 59% 49. Nevada.........................71.3%
50. New Mexico..................68.6%
0 10% 20% 30% 40% 50% 60% 70% 80% 51. Washington DC............68.5%
8•11.2% A college education
10.4% Graduate Less than has become
or Professional High School
Degree Diploma 27.6% increasingly
important in
Educational Attainment Missouri College the US. By 2020,
In 2016, 11.2% of Missourians had Graduation Rate analysts predict
educational attainment less than a US Census that 45% of all
high school diploma, and 31.1% had a 17.2% Bureau American
Bachelor’s
jobs in the US
high school diploma. With each level of 31.1% Community Survey
Degree economy will
education completed and more skills High School
require a college
developed, the more access a person
Diploma or In 2016, the employment
Equivalency degree. Yet, at
has to higher paying occupations. The 22.5% rate was higher for
current completion
percentage of Missourians with less Some College, people with higher
7.6% rates, the US will
than a bachelor’s degree was 72.4%.
No Degree levels of educational
Associate’s face a shortfall of
US Census Bureau Degree attainment. 5 million college
educated workers
by 2020. For many
Unemployment and Earnings by Educational Attainment of those who
Without adequate education, people are often relegated to unskilled service jobs that fail to provide wish to pursue a
economic security. In these charts, data reflects persons age 25 and older, and earnings are for full-time, college degree,
salaried workers. These education categories reflect only the highest level of educational attainment. They increasing costs
do not take into account completion of training programs such as apprenticeships and other on-the-job and inadequate
training. US Bureau of Labor Statistics financial
aid present
Unemployment Rate Median Usual Weekly Earning significant
1.6% Doctoral degree $1,664 barriers—
especially for the
1.6% Professional degree $1,745
poorest Americans.
2.4% Master’s degree $1,380 Since 1980, the
Average of cost of college
all workers: 2.7% Bachelor’s degree $1,156 attendance has
4% risen by 70%
3.6% Associate’s degree $819
at community
4.4% Some college, no degree $756 Average of colleges, 160%
all workers: at 4-year public
5.2% High school diploma $692 $885 universities, and
7.4% < High school diploma $504 170% at 4-year
private universities,
8 7 6 5 4 3 2 1 0 0 500 1000 1500 2000when adjusted
for inflation.
College Affordability Meanwhile,
As the price of college has risen, need-based federal Pell Grant college education funding to low- and national median
middle-income Americans has covered a shrinking share of college costs. In 1980, the average Pell Grant household income
covered three-fourths of the cost of attendance at a public 4-year college. Today, the proportion has has not kept pace.
dropped to one-third. Tuition increases disproportionately affect low-income students. Between 2007 and Despite these
2011, students from the poorest 25% of families, making less than $31,000 per year, saw their net tuition trends, the benefits
price as a percentage of annual income increase from 29% to 40%, compared to an increase from 16% to of a college degree
18% for families making between $69,000 and $111,000. Institute for Research on Poverty still far outweigh
the costs, with
Education and Housing “[Homelessness and food insecurity] is a college graduates
In 2016-2017, 32,739 unaccompanied homeless youth largely invisible problem. Stereotypes of earning, on
completed the Free Application for Federal Student Aid Ramen-noodle diets and couch surfing average, $800,000
partiers prevent us from seeing it. They more than high
(FAFSA) nationally. In Missouri, 1,227 FAFSA applicants were
trick us into thinking that food insecurity
unaccompanied homeless youth. The FAFSA does not gather school graduates
is a rite of passage, that hunger and even
homeless information to determine population of homeless homelessness among our students is
by retirement age.
students attending colleges, but rather, homeless questions Sara Goldrick-Rab,
normal. But it is time to admit that we have Ph.D., Talk Poverty
are used to determine an applicant’s dependency status for a serious problem in higher education.”
Federal Student Aid. National Center for Homeless Education; FAFSA —Sara Goldrick-Rab, Ph.D.
•9Food and Nutrition
Food is one of life’s most basic necessities. Without nutritious food, risk of disease and health issues increase,
while mental focus at work for adults and at school for children decreases. Yet this basic necessity is a struggle
for many Missourians. Barriers to nutritious foods may include a household’s low income, the affordability of
food, or even access to nutritious food. Whatever the barrier, or barriers, might be for an individual or family, the
numbers show that Missourians experience food insecurity at rates higher than the national average.
Here in Missouri, the average meal
costs $2.73. Additional money
required to meet food needs of
Missourians is $464,284,000.
Feeding America
Food Insecurity
Rates by US
County, 2015
> 30%
25-29%
20-24%
15-19%
4-14%
Feeding America’s
interactive Map the
Meal Gap tool shows
2015 food insecurity
across the nation.
In 2015, the food
insecurity rate for
345,912
Missouri was 15.6%.
With the now 14.2%
Missouri households food insecurity rate,
were food insecure in 2016. Missouri has seen a
Food Research & Action Center 1.4% decrease.
Food Insecurity: Food Insecurity by Household Characteristics “The costs of food insecurity are
The state of being Prevalence of food insecurity varied among household types economic, social, physical and
without reliable nationally. Food insecurity rates for each group were higher psychological. For example, the
access to a than the 13.0% national average. USDA Economic Research Service economic costs of food insecurity
among adults include income loss,
sufficient quantity
All households with children............................ 16.5% work absenteeism, higher demand for
of affordable, public benefits and social services and
nutritious food. Households with children under age 6............ 16.6% increased health care expenditures.
Households with children Food insecurity and poverty are
13.0% headed by a single woman............................... 31.6% clearly connected—poverty is the best
single predictor of food insecurity,
National food Households with children
and hunger strongly correlates with
insecurity rate headed by a single man.................................... 21.7%
lower educational achievement,
Women living alone........................................... 13.9% unemployment and impaired work
14.2% Men living alone................................................ 14.3% performance. Recent studies of
Missouri’s food children show food insecurity and
Black, non-Hispanic households...................... 22.5% hunger are significant predictors
insecurity rate
Hispanic households......................................... 18.5% of chronic illness, low birth weight,
USDA Economic
lower school performance and
Research Service Low-income households with incomes
developmental problems.”
below 185% of the poverty threshold.............. 31.6%
— Missouri Hunger Atlas,
*The federal poverty line was $24,339 for a family of four in 2016.
University of Missouri
10 •Food Insecurity
Missouri ranks 19th for food insecurity On an
among the 50 states and Washington annual basis,
DC. Mississippi has the highest food
insecurity rate of 18.7% and Hawaii has
the lowest food insecurity rate of 8.7%.
1,190,600
The food insecurity national average is unique
13%. USDA Economic Research Service Percent of individuals
Household
Income
in Missouri
1. Mississippi.................18.7%
Required are served
HIGHER THAN NATIONAL AVERAGE --------------------------------------->
2. Louisiana...................18.3% for Food
3. Alabama....................18.1% by Feeding
20.0%-24.4%
4. New Mexico...............17.6% 18.2%-20.0% America
5. Arkansas....................17.5% 16.4%-18.2%
6. Kentucky...................17.3% 15.1%-16.4%
partner food
7. Maine.........................16.4% 11.4%-15.1% banks.
8. Indiana......................15.2% That’s nearly
9. Oklahoma.................15.2% Food Affordability
10. North Carolina..........15.1% Experts suggest spending less than 15% of household 20% of
11. West Virginia.............14.9% income on food when creating a household budget. Only 22 Missouri’s
12. Ohio...........................14.8% of Missouri’s counties spend this percentage of household population.
13. New Hampshire........14.7% income on food. Households in the remaining 93 counties Feeding Missouri
14. Arizona......................14.6%
and City of St. Louis spend an average of more than 15% of
15. Oregon.......................14.6%
16. Kansas.......................14.5% household income on food. Missouri Hunger Atlas 2016
17. Texas..........................14.3%
18. Michigan....................14.3% Food Insecurity Compromises
19. Missouri...............14.2% Feeding America’s Hunger in America study identified compromises and coping
20. Georgia......................14.0% strategies of food insecure Americans. These are some choices food insecure people
21. Tennessee.................13.4%
make in order to eat. Feeding America
22. South Carolina..........13.0%
US.............................. 13.0%
23. Montana....................12.9%Health
Most Missourians have access to health care with employer-provided insurance, but in our system of employer-
provided insurance, those at the lowest levels of income are rarely provided coverage by their employer. This
creates a system in which low-income families often pay out of pocket for health care while higher income
individuals receive employer subsidies. This impedes low-income individuals’ access to primary and preventative
care, increasing health care costs for all Missourians.
Health Insurance Coverage Historical Trends
11.7% In 2016, only 8.9% of Missourians did
not have health insurance coverage.
After reaching a high of 14.6% in 2009, the percent of
Missourians without health insurance decreased to 8.9%
of Americans do
Of the 91.1% of the population with in 2016, which was 532,000 Missourians. In 2009, 871,000
not have health
insurance coverage. coverage, 70% had private coverage Missourians did not have health insurance. US Census Bureau
US Census Bureau while 30% had public coverage.
US Census Bureau
15% 14.6%
Many health insurance Uninsured: 8.9%
consumers face limited
options, high costs, and 12%
On March
incomplete coverage. Private 23, 2010,
Insurance: President
Public Obama
Insurance: 70%
8.9% 30% 9%
signs the
Affordable
8.9%
of Missourians do Insured Missourians: Care Act
not have health 91.1% into law.
insurance coverage.
6%
US Census Bureau
07
08
09
10
11
12
13
14
15
16
20
20
20
20
20
20
20
20
20
20
Adolescent Pregnancy Unintended Pregnancy
The adolescent pregnancy rate in In 2011, the most recent year for which national- Abortion:
Missouri was 25 per 1,000 women aged level data are available, 45% of all pregnancies in the 21%
15–19 in 2015, down from 43 per 1,000 United States were unintended, including three out
Birth: 64% Miscarriage:
in 2013. The national rate was 22.3 per of four pregnancies to women younger than 20. There 15%
1,000. Services are needed to support were 45 unintended pregnancies per every 1,000
pregnant or parenting young people, women aged 15–44, a rate significantly higher than
regardless of the unintended nature of that in many other developed countries. Economically
the pregnancy. Guttmacher Institute disadvantaged women are disproportionately affected
Pregnancy Outcomes
by unintended pregnancy. In 2011, the unintended In 2010, 64% of unintended
22.3 25 pregnancy rate among women with a family income
lower than the federal poverty level, at 112 per 1,000,
pregnancies in Missouri
resulted in births and 21%
Adolescent Adolescent was more than five times the rate among women with in abortions; t he remainder
pregnancies per pregnancies per an income greater than 200% of the poverty level. resulted in miscarriages.
1,000 nationally 1,000 in Missouri Guttmacher Institute Guttmacher Institute
Poverty and Life Expectancy America throughout the past 15 years. of despair”—drug overdoses, alcohol
A 2016 MIT study shows the richest 1% of The life expectancy for men and women poisoning and suicides—as the leading
US men live 14.6 years longer on average in the bottom 5% of the income tables, cause. The greatest increase is found
than the poorest 1% of US men. Among however, increased only .32 and .04 years. among drug overdoses. There were 420
women in those same percentiles, the In Missouri, the average life expectancy deaths from drug overdose in 1995-1999,
difference is 10.1 years. Additionally, life is 77.2 years; however, average life compared to 3,040 deaths from drug
expectancy increased by 2.34 years for expectancy varies based on demographic. overdose in 2010-2014.
men and 2.91 years for women who were Missouri has seen white mortality MIT; Missouri Department of Health and Senior
among the top 5% of income earners in rates increase since 2000 with “deaths Services; Missouri Foundation for Health; National
Center for Health Statistics
Missouri Average Life Expectancy by Demographic
70 71 72 74 75 76 77 78 79 80
73 74.6 Average 77.7 Average
79.7
Black Male 77.2 White 78.6 Female
12 •Missouri ranked
Health and...
In 2016
Missouri had
21st Economic and Family Security
As family income increases, the number
nationally for
of families reporting poor health
267 number of active
physicians in 2016. decreases. Institute for Research on Poverty
active physicians Association of
per 100,000 American Medical
Education Adolescent depression
residents. Colleges can adversely affect school performance
Association of and can increase the severity of other
American Medical
health conditions such as obesity and
Colleges
asthma. Forum on Child and Family Statistics
PEOPLE PER Food Insecurity Food insecure
SQAURE MILE
families are at higher risk for chronic
2,000.0-69,468.4
500.0-1,999.9 diseases, diabetes, hypertension and
88.4-499.9 weight gain. These physical and mental
20.0-88.3 health effects are especially detrimental
1.0-19.9
0.0-0.9
due to the lack of access to proper
medical care. Missouri Hunger Atlas
Medical Access Across the State Housing and Energy An estimated
In 2017, there were 145 hospitals in Missouri. Although they were widely dispersed, 26% of homeless adults staying in
they were not distributed evenly throughout Missouri. Of the 114 counties and City shelters live with serious mental illness
of St. Louis, 42 did not have a hospital. Of the 73 counties with hospitals, the larger and an estimated 46% live with severe
metropolitan counties had multiple facilities, leaving rural areas with little access to mental illness and/or substance use
hospitals. Missouri Hospital Association; US Census Bureau disorders. National Alliance on Mental Illness
Adverse Childhood Experiences
Adverse Childhood Experiences, or ACEs, are stressful or se
rea
k Inc
traumatic events, including abuse and neglect. They may Ris
also include household dysfunction such as witnessing
Possible risk
domestic violence or growing up with family members who 0 ACEs 1 ACE 2 ACEs 3 ACEs 4 ACEs outcomes of
have substance use disorders. ACEs are strongly related to As the number of ACEs increases, so does Adverse Childhood
the development and prevalence of a wide range of health the risk for negative health outcomes.
Experiences
problems throughout a person’s lifespan, including those include:
associated with substance misuse. Excluding persistent What is Considered an Adverse
economic hardship as an ACE, poor children are more than Childhood Experience? BEHAVIOR
twice as likely as their more affluent peers to have had three ACEs fall under 3 categories—abuse, Lack of physical
or more other ACEs. Nearly 14% of children living at or below neglect, and household dysfunction— activity,
the poverty level experienced three or more ACEs, while only and include the following: smoking,
• Economic hardship alcoholism,
6% of children living at more than twice the poverty rate had
• Divorce or separation of a parent drug use,
three or more ACEs. Robert Wood Johnson Foundation; Child Trends and missed work
Data Bank • Death of a parent
• Physical abuse or neglect
Percentage of Children with ACEs by Poverty • Sexual abuse PHYSICAL AND
Excludes economic hardship as an adverse experience. • Emotional abuse or neglect MENTAL HEALTH
80% • Witnessing domestic violence Severe obesity,
70.2% • Mother treated violently diabetes,
70%
Above 200% of Poverty Level • Intimate partner violence depression, suicide
60% 59.2% attempts, STIs,
54.1% 101%-200% of Poverty Level • Witnessing neighborhood
50% Poverty Level and Below violence heart disease,
• Substance misuse within cancer, stroke,
40%
household COPD, and broken
30% bones
• Living with someone who was
20% mentally ill or suicidal
13.8% 11.6%
10% 5.9% • Being treated or judged unfairly
0
due to race/ethnicity
No Adverse Experiences 3 or More Adverse Experiences • Incarcerated household member
• 13Housing and Energy
What happens when your housing is unaffordable or affordable housing does not exist? When you constantly face
the impossible choice between rent and other life necessities? When you’re one paycheck or emergency away
from eviction? In the worst case, you could be homeless. In many other cases, you will likely have to settle for
substandard housing, including a home that is energy-inefficient.
Housing and Family Living
$896 Arrangements in Missouri
Highest average rent
for a 2-bedroom
apartment in Missouri 2,760,084 2,372,362
Housing Units Households
US Census Bureau US Census Bureau
16%
66.8% 2.48
Persons per
Owner Household
Occupied US Census Bureau
Cost of Rent $141,200 84%
16%
vs. Ownership Median Value of Living in the
According to the US Census Bureau data released in 2017, Owner-Occupied Same House
the median monthly housing costs in Missouri in 2016 for $641 Housing Units
US Census Bureau
1 Year Ago
mortgaged owners was $1,210, $407 for non-mortgaged Lowest average rent
owners, and $759 for renters. An estimated 25% of owners had
mortgages, while 12% of owners did not have mortgages. 47%
for a 2-bedroom
apartment in Missouri .83% 6,194
of renters in Missouri spent 30% or more of household income Department of Housing Foreclosure Rate Homeless People
on housing. US Census Bureau and Urban Development US Census Bureau United States Interagency
Council on Homelessness
Federal Minimum Wage
at Time of Analysis
Missouri Fair Market Rent
and Housing Wage
The Out of Reach report, published by the
$
7.70
National Low Income Housing Coalition,
outlines the hourly wage one must make
in each state to afford a 1- or 2-bedroom
rental home. In 2017, the average fair
market rent for 1-bedroom housing in
Missouri was $638 per month. To afford
this housing, a person needs to make
$12.27 per hour, or $25,528 per year. Fair
market rent for 2-bedroom housing was
$815 per month. To afford this housing,
a person needs to make $15.67 per hour,
or $32,588 annually. These housing
costs are more than one can afford on
the minimum wage in Missouri. In fact,
in no state can a minimum wage worker Hours at Minimum Wage to
afford a 1-bedroom rental home at fair Afford a 1-Bedroom Rental Home
78 hours per week or more
market rent, working a standard 40-hour
61 to 78 hours per week
work week, without more than 30% of
60 hours per work or less
his or her income going toward housing. This state’s minimum wage
National Low Income Housing Coalition exceeds the federal minimum wage.
Nationwide, the 1-bedroom housing wage is $17.14 per hour. In Missouri, the 1-bedroom housing wage is $12.27 per hour.
The 2-bedroom housing wage is $21.21 per hour. The 2-bedroom housing wage is $15.67 per hour.
14 •Energy Expense Impact Homelessness in Missouri Youth Homelessness
on Missouri Families A point-in-time count is an unduplicated On any given night in the US, more
High household energy count on a single night each January than 61,000 families with children,
expenditures and below-average of the people in a community who are 3,800 unaccompanied children under
family incomes strain the budget experiencing homelessness, including 18, and 31,900 unaccompanied youth
of Missouri’s lower- and middle- both sheltered and unsheltered (18–24) sleep in a homeless shelter
income families. Missouri’s 1.2 populations. The Missouri point-in- or are unsheltered. More than half
million households with pre-tax time count for 2017 was 1,243 people. a million families stay in homeless
annual incomes below $50,000 It shows the following factors for shelters and 1.3 million schoolchildren
represent 52% of Missouri’s homeless individuals in Missouri: experience some form of homelessness.
families. These families spend an Furthermore, as many as 1.7 million
Homeless Individuals................1,243
estimated average of 17% of their Households..................................... 862 children—most between 15 and 17—are
after-tax income on residential Unsheltered Individuals................. 291 told to leave or stay away from home for
and transportation energy. Sheltered Individuals..................... 952 at least a night. US Census Bureau
Energy expenses for 732,000 Chronic Homelessness...............237 Age of Homeless Gender of Homeless
Missouri households earning Sheltered Individuals..................... 197 (80%) Youth in Missouri Youth in Missouri
Unsheltered Individuals ................ 48 (20%)
less than $30,000 before taxesWhat Is To Be Done? We’ll Show You.
The five elements of poverty stand alone, yet they are also interconnected. When one aspect of a person’s life—
economic and family security, education, food and nutrition, health, or housing and energy—is compromised, the
whole person suffers. Here are examples of positive and effective ways Missourians are uplifted in these five areas.
22,600 416,000 148,453 127,551
Families Children Households Women and
Safety Net Programs receiving child receiving receiving Low children receiving
care subsidies Supplemental Income Home Women, Infants
and Missourians Center for Law Nutrition Assistance Energy and Children (WIC)
Safety net programs lift Missourians out and Social Policy
Program (SNAP) Assistance Supplemental
of poverty. Each program addresses an benefits Program (LIHEAP) Nutrition Assistance
element of poverty and influences an
78,214 Children’s Defense Fund assistance Program benefits
Households
individual’s ability to make strides in US Department of Health Food Research
other areas of life, working toward self-
receiving federal 38,473 and Human Services & Action Center
rental assistance
sufficiency and increased overall well- Center on Budget and Adults and 624,308 519,000
being. For example, pregnant women Policy Priorities children receiving
Children
Temporary Recipients
who participate in the WIC program have enrolled in
20,789 Assistance for
Medicaid and of Federal
fewer low birth weight babies, experience Needy Families
Participants Children’s Health Earned Income Tax
fewer infant deaths, see the doctor earlier in all Head Start (TANF) Credit (EITC)
in pregnancy and eat healthier. Through US Department of Health
Insurance Program National Conference of
programs (CHIP)
and Human Services State Legislators
nutrition, the program’s goal is to improve Center for Law The Henry J. Kaiser
and Social Policy
the health of women, infants and children. Family Foundation
Medicaid Expansion and Health Insurance Coverage
Of the 50 states and Washington DC, 33 have expanded Medicaid. As of 2018,
Birth to age 5 is critical
Missouri is one of 18 states without Medicaid expansion. Of the states with expanded for development; just a
Medicaid, 22 states have uninsured rates of less than 8% of the population. Only one few years of poverty may
state without expanded Medicaid, Wisconsin, has an uninsured rate less than 8%. negatively affect a child’s
life course. Access to
adequate health care during
these formative years is
imperative.
Percentage of State
Population Without
Health Insurance
Coverage
14.0% +
12.0%-13.9%
10.0%-11.9%
8.0%-9.9%
Less than 8.0%
Lined Overlay Denotes
Medicaid Expansion
16 •Missouri Voters
and the Safety Net Energy Assistance for Missourians
In a recent study conducted by Missouri Many programs help Missourians with energy affordability in emergency,
Foundation for Health, 49% of voters short-term, and long-term situations. Each serves a purpose in the unique
responded they are currently receiving circumstance of any given family.
help from the safety net, have in the
past or have a family member who has. UTILICARE, when funded, provides utility customers with state funds to help
avoid disconnection for non-payment during periods of extreme cold and heat.
“We’ve either LIHEAP is the Low-Income Home Energy Assistance Program, which helps
been there or had family low-income families pay their heating bills. LIHEAP offers assistance in the form of
that was there.” a cash grant, sent directly to the utility company, or a crisis grant for households in
immediate danger of being without heat.
Are you or a family member currently WEATHERIZATION is the practice of protecting a home and its
getting help from a safety net program?
inhabitants from the adverse effects and wear-and-tear of weather and elements.
This long-term approach to assistance includes weatherstripping and caulking, but
it’s so much more than that. Weatherization is about modifying a building to reduce
24% energy consumption, increase energy efficiency, and make homes safer for families.
Yes
76%
No Weatherization:
The total health
Direct and Indirect Benefits Families have and household-
While the Weatherization Assistance Program homes that are related benefits
more livable, for each home
(WAP) is primarily an energy efficiency
resulting in fewer weatherized are
program, there are many indirect benefits missed days
If NO, have you or
a family member ever gotten
to families whose homes are weatherized of work and
$
14,148
through the program. Individuals and families decreased out-of-
help from a safety net program?
experience fewer late payments as they pocket medical
establish economic security from lower utility expenses by an Families see
average of an average
bills. Children miss less school and are ready
annual energy
33% to learn when homes are safe from adverse
effects of weather. Indirect benefits of WAP
$
514 cost savings of
Yes
67% are to the right. US Department of Energy $
283
No
Weatherization and the Economy
For every $1 invested in weatherization, $1.72 is generated DID YOU KNOW?
in energy benefits, plus $2.78 in non-energy benefits, thus Not only do families
spurring economic growth and reducing environmental benefit from home
Do you think these safety net programs
weatherization,
are very important, somewhat impact. US Department of Energy
but communities
important, not too important,
=
benefit, too!
or not at all important?
The Weatherization
Assistance Program
supports 8,500 jobs
$1 Invested in $1.72 Generated in Energy across America,
38% Weatherization Benefits
54% Somewhat
growing local
Very employment. This
Important
Important SNAP Benefits and the Economy provides additional
SNAP benefits generate economic activity. In a weak economy, family and
$1 in SNAP benefits generates $1.70 in economic activity. economic security
Center on Budget and Policy Priorities for families in local
6% communities.
2%
=
US Department of
Not
Energy
Don’t Know Important
Missouri Foundation for Health
$1 SNAP Benefits $1.70 in Economic Activity
• 17What Is To Be Done? We’ll Show You.
School Meal Programs: Food Banks Feeding
Before, During, and After School 2,488 Feeding Missouri is a coalition of the Missouri
Breakfast and Lunch
Missouri schools six Missouri food banks working to food banks
participate in NSLP.
provide hunger relief in the state. These distribute
The School Breakfast Program provides
funding that makes it possible for 228,397 food banks serve the pantries and food
more than
Missouri students programs in the regions illustrated
schools to offer a nutritious breakfast to receive free and below, which cover all 114 Missouri 123,000,000
students each day. The School Breakfast reduced-price
Program (SBP) and the National breakfast on average
counties and the City of St. Louis. pounds
Collectively, the six Feeding Missouri
School Lunch Program (NSLP) share daily through the
food banks feed more than 1 million
of food
School Breakfast
the same goal: to protect the health Program. Missourians and distribute more than each year and
and well-being of the nation’s children feed more than
by providing nutritious school meals 385,156 123,000,000 pounds of food annually.
every day. NSLP provides funding that Missouri free and Feeding Missouri
1 million
reduced-price
makes it possible for schools to offer a lunch students Missourians.
nutritious school lunch. Schools receive participate in NSLP
federal funds for each breakfast and on average daily. 1
lunch served, provided that the meal
meets established nutrition standards.
+44.9% 2
3 4
Percent change
Missouri residents who are the parent or in Missouri free
primary caregiver for a child or children and reduced lunch
participation in last 10
who attend public schools qualify if
years. Food Research
household income does not exceed & Action Center, 6
5
specific limits per household size listed: School Year 2015-2016
NATIONAL SCHOOL LUNCH Persons/Household Gross Income That’s nearly
1 ................................ $21,978 Feeding Missouri Food Banks
PROGRAM ELIGIBILITY
Families with school age children 2................................ $29,637 1. Second Harvest Community Food Bank
20% of
with household incomes (before 3 ................................ $37,296
4 ................................ $44,955
2. Harvesters Community Food Network Missourians
taxes) below these income guide- 3. The Food Bank for Central
lines qualify for free or reduced 5 ................................ $52,614
and Northeast Missouri
receiving
school breakfast and lunch. 6 ................................ $60,273 assistance from
4. St. Louis Area Foodbank
Missouri Department of Elementary 7 ................................ $67,950
and Secondary Education
5. Southeast Missouri Food Bank food banks.
8 ................................ $75,646
6. Ozark Food Harvest
After School Meals BUDDY PACKS
The Food Bank for Central and Northeast
Missouri says 1 in 5 children in its service
are bags of Addressing Hunger
kid-friendly The Missouri Hunger Atlas looks at need versus performance—
area faces hunger on a regular basis nutrition sent
how communities are addressing the issue of hunger.
with more than half qualifying for free or home on Fridays
and before school
Twenty-four counties and the City of St. Louis have both
reduced-price meals at school. Studies
breaks to children high need/high performance. Twelve counties were labeled
show children who face food insecurity
who rely on high need/low performance. It is unclear whether public and
are more likely to experience problems
subsidized school private agencies are having difficulty targeting resources to
at school, are more likely to suffer from
meals. Each bag these high need/low performing counties, but trends reveal
anxiousness and irritability, and tend contains two that recent economic conditions have taken their toll on
to repeat a grade at school more often ready-to-eat Missouri counties. Fourteen counties qualify as low need/
than peers who are not food insecure. entrees, fruit cups, high performance. In these low need/high performance areas,
Many food banks facilitate Buddy Pack a nutritional bar,
the results of this report suggest that
programs. Buddy Packs are bags of kid- cereal and shelf-
stable milk with
service providers are adequately
friendly food sent home on Fridays and
peanut butter. handling food insecurity and hunger
before school breaks to children who
Just $15 a month needs in their regions.
rely on subsidized school meals. Across
provides a Missouri Hunger Atlas
central and northeast Missouri, teachers
Buddy Pack
report improved grades, behavior and to a child in your
High Need/High Performance
social skills when children receive Low Need/High Performance
community for an Average Need/Average Performance
Buddy Pack nutrition compared to food entire school year. Low Need/Low Performance
insecure peers who do not receive Buddy
High Need/Low Performance
Packs. Feeding Missouri
18 •You can also read