We're All Teachers Now: Remote Learning During COVID-19
←
→
Page content transcription
If your browser does not render page correctly, please read the page content below
JOURNAL OF SCHOOL CHOICE
https://doi.org/10.1080/15582159.2020.1822727

We’re All Teachers Now: Remote Learning During COVID-19
Dick Carpentera and Joshua Dunnb
a
 Leadership, Research, and Foundations, University of Colorado at Colorado Springs, Colorado Springs,
Colorado, USA; bPolitical Science, , Colorado Springs, Colorado, USA

    ABSTRACT                                                                   KEYWORDS
    This study examined educational experiences of families under              COVID
    COVID and their schooling decisions in the 2021 school year.
    Results from a survey of 1743 parents indicate most schools
    provided educational resources ranging from hardcopy packets
    to live online instruction. Parents were generally positive about
    the experience. Parents in private and charter schools reported
    a more positive experience than those in traditional public
    schools. Only a small percentage of respondents said they were
    going to homeschool in fall 2020, but more than a third planned
    to send their child to a virtual school out of concern about their
    child’s health.

This study examines the experiences and perspectives of parents and families
with remote learning in spring 2020 during COVID-19 closures. For the latter
part of the 2020 school year, parents had the primary responsibility of teaching
their children at home. This presented parents with the opportunity to observe
and evaluate (a) what their children were learning, (b) the ability and will-
ingness of schools to provide educational resources to families, and (c) other
educational options.
  This experience at remote learning may have confirmed parents’ reliance on
the neighborhood school, while for others it may have compelled them to
consider other options. Since we are writing in August 2020, this is one of the
first studies to systematically examine the educational experiences of families
under COVID and what that may mean for schooling decisions in the
2020–2021 school year and beyond.

Background
How schools responded

When schools began closing in mid-March, teachers and administrators rushed
to create educational content through hundreds of thousands of paper packets
and online lessons (Blume, Kohli, Xia, & Esquivel, 2020; Crain, 2020; Keane,

CONTACT Dick Carpenter        dcarpent@uccs.edu   University of Colorado Colorado Springs, 1420 Austin Bluffs
Parkway, Colorado Springs, CO 80918
© 2020 Taylor & Francis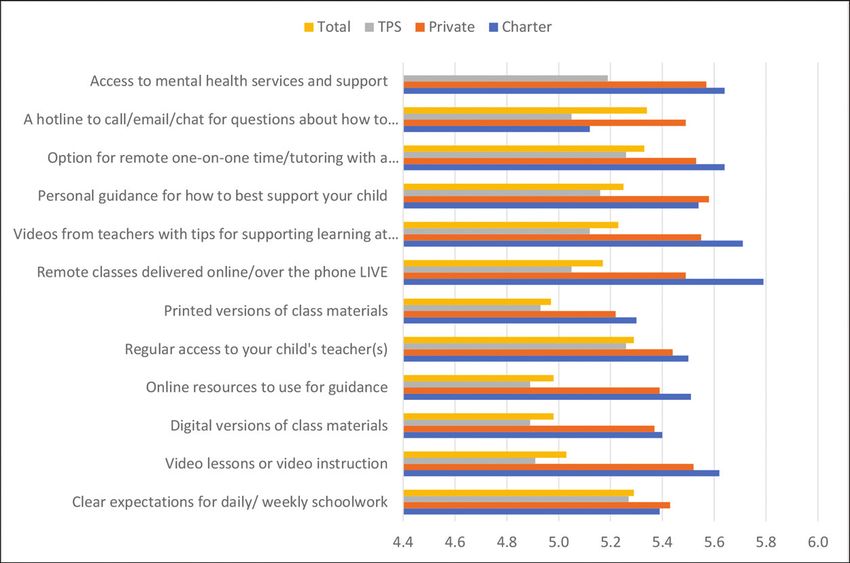
2     D. CARPENTER AND J. DUNN

2020). One common, although not exclusive, approach was sending students
weekly assignments at the beginning of each week. Students would then work
independently or with a parent, seeking help from teachers during office hours if
they had questions (Koh, 2020). Teachers became “advisers” and maintained
contact through video chats or over the telephone (Keane, 2020; Koh, 2020).
   The implementation of such initiatives was uneven, as illustrated by two
adjacent districts in Milwaukee (Richards, 2020). Nicolet High School,
a single-school district with about 1,000 students, created an online learning
system in a matter of days and worked to secure necessary hot spots for
students and staff. Next door the Whitefish Bay School District, which enrolls
around 3,000 students, took a month to create a virtual learning plan drawing
numerous complaints from parents.
   Inconsistent possession of or access to technology was a part of the uneven
implementation (Crutchfield & Londberg, 2020). Moving to online instruction
often required schools to ensure families had devices – laptops or tablets – and
even internet access. Duval County Public Schools in Florida, for example,
distributed 3,500 hotspots and 37,000 laptops (Bloch, 2020). The Jacksonville,
Florida, school district estimated more than 27,000 students needed laptops
(Bloch, 2020), and the Miami school district provided students 90,000 devices
and 11,000 hotspots (Richards, 2020). Los Angeles Unified, purchased 200,000
computers for students and contracted with Verizon to connect households to
the internet for free. A California state partnership with Google provided free
Wi-Fi to 100,000 households (Blume et al., 2020).
   Nevertheless, acquiring technology and internet access reportedly proved
difficult for many parents. Some estimated, for example, 200,000 California
households lacked devices to participate in virtual instruction (Koh, 2020).
States provided funds for internet hot spots, but extreme demand left store
shelves empty and families waiting weeks to get online. Even if technology was
available, some families struggled to gain permission from their landlords to
install the necessary equipment (Blume et al., 2020). Students unable to access
internet at home sat outside businesses with free wifi to do homework (Bloch,
2020). And some districts reportedly failed to deliver needed devices out of
fear the mere distribution would facilitate spread of the virus (Crutchfield &
Londberg, 2020).
   The uneven implementation of at-home learning extended beyond technol-
ogy. One survey of parents found only around a third of families received
resources from their schools, such as lessons or curricular materials (Park &
Winchester, 2020). Some schools required students to sign into learning plat-
forms daily and graded students’ work, while others checked in with students
only periodically and gave all students As on their assignments (Richards,
2020). Still others elected not to provide any online classes but provided
families with resources at the district website (Needles, 2020).
JOURNAL OF SCHOOL CHOICE      3

   For schools providing organized instruction, the offerings took many forms:
live video lessons, recorded lectures, one-on-one support over the phone, or
feedback delivered through an online platform (Gross & Opalka, 2020;
Richards, 2020). In a study of school district responses to COVID-19,
Malkus, Christensen, and Schurz (2020) found one in five schools were in
districts that offered rigorous remote instruction. Perfunctory remote instruc-
tion was more common, with 40% of schools falling into this category. The
remaining schools offered moderate packages of remote instruction.
   Some districts offered synchronous, online classes mimicking the classroom
experience, but most students saw their teachers only for a few minutes a day
or a week, and some not at all (Cavanagh, 2020; Davis, 2020). Many districts
explicitly encouraged or expected teachers to make direct contact with their
students. The most common method was e-mail communication. Other forms
included web-based platforms, scheduled office hours, phone calls, and home-
work hotlines (Malkus et al., 2020). One survey of parents found less than half
(47%) reported receiving “a lot” of information from their child’s school about
resources and support available to them. More than 80% said they received
information from their child’s school at least once a week, and more than half
(54%) received information three times a week or more.
   Much of the preceding came from contemporaneous reporting during the
COVID school closures, but two research teams tracked school responses from
March to May, with summary results available at the end of the school year. The
first (Gross & Opalka, 2020) found the large majority of public districts tracked –
85% – made sure their students received some form of grade- and subject-specific
curriculum in packets, assignments posted online, or guidance to complete seg-
ments of online learning software. Yet, just one in three districts expected teachers
to provide instruction, track student engagement, or monitor academic progress
for all students, leaving learning largely to chance or the diligence of parents.
   The second (Malkus et al., 2020) found across most measures in the study,
public schools ended the year by providing core educational services. Ninety-
five percent provided meals to students, 66% provided devices, and 70% pro-
vided internet access to students at home. Almost all schools (97%) provided
some form of remote instruction, most commonly asynchronous web-based
platforms, followed by hardcopy instructional packets and then synchronous
web-based classes. Many schools (67%) announced assignments were being
graded, although the plurality graded only on completion. Finally, although
almost two-thirds of schools expected student participation, less than a third
established any mechanism for taking “attendance.”

What learning looked like at home
Had school districts monitored student engagement, they would have found
children spent an average of 4.2 hours per weekday on school work, with 22%
4     D. CARPENTER AND J. DUNN

of parents reporting their child spending less than one hour per weekday on
school work (Park & Winchester, 2020). For their part, parents – mostly
mothers – spent approximately 2.5 hours per weekday helping their children
with school (Park & Winchester, 2020; Watson, 2020). For parents regularly at
home, some structured the time, with daily schedules that included not only
school work, but also chores, exercise, meals, and free time (Carter, 2020;
Needles, 2020; Watson, 2020). Nonetheless, many media reports told of
parents being overwhelmed. This was particularly so in families with multiple
children spread widely across grades. One Pennsylvania mother of three
children described the challenge of keeping track of four different school
e-mail accounts and 12 Google livestreams, all while transitioning her job to
home (Flaccus & Gecker, 2020).
   Many parents, however, were not home during the day, which meant in
families with siblings, older children cared for younger ones, making school-
work difficult (AP, 2020a). In such circumstances, schoolwork was pushed to
weekends or late in the evenings (AP, 2020a). In other cases, parents tapped
informal networks of friends and family to create study groups of classmates
doing remote learning together (Ovide, 2020). For students without adults at
home and no peer support group, remote learning reportedly grew increas-
ingly difficult (Blume et al., 2020; Crutchfield & Londberg, 2020).
   Early on, some school districts appeared to exacerbate the situation by
attempting to continue the curricula on the same pace as in school (Davis,
2020). Some students reported the workload was even greater than they had
been used to in school (Bloch, 2020). Although 90% of families said they used
school-provided resources (Park & Winchester, 2020), reports occasionally
surfaced of schools assigning science experiments and art projects that
required parents to go to stores in search of materials not commonly kept in
homes (Davis, 2020).
   Not surprisingly, some frustrated and exhausted parents chose to discon-
nect entirely for the remainder of the school year (Flaccus & Gecker, 2020),
including teachers and college professors (Cavanagh & Fox, 2020; Weiner,
2020). Instead of schooling at home, their children watched TV, played video
and board games, cooked and baked, cleaned and sewed, read, and pursued
their own interests (AP, 2020a; Carter, 2020; Cavanagh & Fox, 2020; Koh,
2020; Weiner, 2020). One enterprising father even taught his son how to short
stocks (Das, 2020).
   These are, of course, general, anecdotal descriptions. The most significant
differences appeared to be based on the type of school families attended. Many
private schools, freed from red tape and populated with digitally savvy
families, pivoted more easily to remote learning (Richards, 2020). In
Tacoma, Washington, for example, public schools chose not to provide active
remote learning, instead posting and distributing resources that included
activity packets and links to additional learning tools (Needles, 2020).
JOURNAL OF SCHOOL CHOICE       5

Meanwhile, Charles Wright Academy, a private school in Tacoma, shifted to
a remote learning platform that included both asynchronous work and syn-
chronous classes.
   One study (Common Sense Media/SurveyMonkey, 2020) compared the
remote learning activities of teens in public versus private schools and found
stark differences illustrated in Table 1. Private school students more often were
in contact with teachers, attended online classes, and used technology to
connect with the school. In a different study, when asked about class atten-
dance, 47% of public school students said they had not attended a class,
compared with just 18% of private school students (Kamenetz, 2020a).

Assessing the experience
In the final assessment, remote learning in spring 2020 received decidedly
mixed reviews (Hamilton, 2020). Although large percentages of parents pro-
fessed to feeling prepared to help their children (EdChoice, 2020; Education
Trust-West, 2020), 52% agreed the experience was harder than they expected
(Park & Winchester, 2020). Moreover, a large majority expressed concern
about providing productive learning at home (Baldassare, Bonner, Dykman, &
Lawler, 2020). Media anecdotes frequently reported parents feeling over-
whelmed and inadequate (Bloch, 2020), including university professors (AP,
2020a), college presidents (Strauss, 2020), and Hollywood celebrities
(Newcomb, 2020).
   According to some, schools performed poorly (Henderson, 2020), with
remote learning declared an “utter failure” (DeMarche, 2020). By mid-May,
many school districts ended early, “giving up” on “cumbersome” remote
learning (Strassel, 2020). As the spring months wore on, student participation
declined (Bloch, 2020) as students struggled with technology and found home
environments not optimal for learning (Blume et al., 2020; Davis, 2020; Koh,
2020). One survey taken in May reported more than two-thirds of parents

   Table 1. Differences in learning activities between public and private school students.
                                                                                Public       Private
    Connecting with their teacher
    . . . once a day or more                                                    31%          66%
    . . . a few times a day                                                     15%          33%
    . . . once an hour or more                                                  2%           14%
    . . . less than once a week                                                 28%          4%
    Having a dedicated space where they can do schoolwork at home               71%          67%
    Attended an online or virtual class                                         53%          82%
    Using e-mail to stay connected to school                                    68%          78%
    Using a learning management system to stay connected to school              50%          65%
    Using video chat or videoconferencing to stay connected to school           39%          88%
    Using texts to stay connected to school                                     33%          33%
    Using social media to stay connected to school                              26%          23%
    Using messenger apps to stay connected to school                            21%          24%
    Using phone calls to stay connected to school                               19%          15%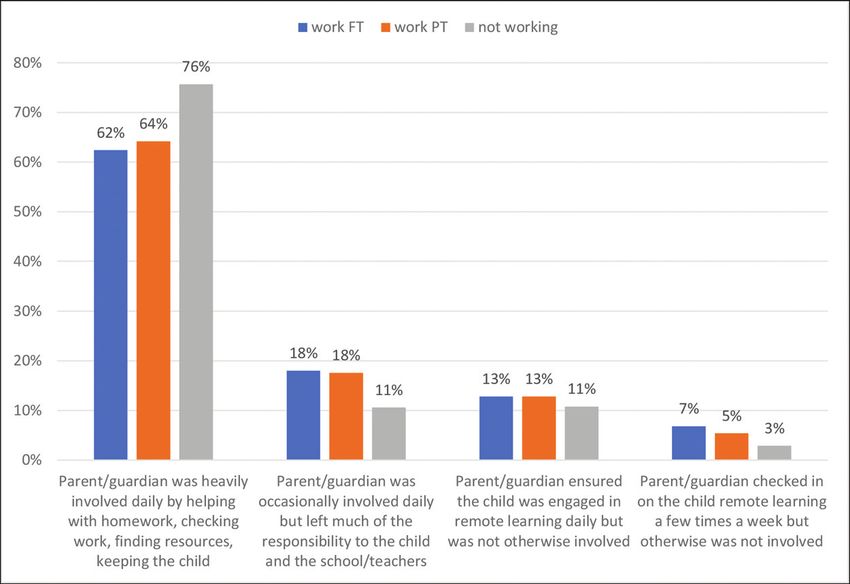
6     D. CARPENTER AND J. DUNN

were concerned about their children falling behind, and almost the same
percentage feared it would affect their educational success for longer than
a year (Koh, 2020). “A lot of parents were disillusioned with what they saw
over the last 120 days,” said Luis Huerta, a professor of education and public
policy at Teachers College at Columbia University. “They felt the level of
instruction was not up to par and that schools dropped the ball during the
transition” (Ali, 2020).
   Conversely, other evidence suggested parents were satisfied with their
schools’ performance. One survey found 57% of parents agreed their child’s
remote schooling worked better than expected (Park & Winchester, 2020).
Another reported more than 90% of parents approved of how schools handled
closures (Baldassare et al., 2020), and still another found more than 80% of
parents believed their schools were doing a good or excellent job (Education
Trust-West, 2020). In a USA Today/Ipsos poll (Education Trust-West, 2020),
more than 70% of parents approved of their schools’ efforts, and more than
60% believed their schools prepared their children well for remote learning.
   Of course, the most revealing assessment may be what parents elected to do
for fall 2020. Some authors predicted the schooling at home experience would
compel parents to choose different options for their children. McDonald
(2020) asserted, “we may be on the brink of a massive educational reset.”
Henderson (2020) opined, “Get ready. A school renaissance is coming.” By
that Henderson meant increased school choice, specifically more homeschool-
ing and lower enrollment in public schools.
   Yet, signals from parents did not clearly point to a “renaissance.” Some polls
showed most parents were going to send their children back to their neighbor-
hood schools (Chua, DeJonckheere, Reeves, Tribble, & Prosser, 2020). Only small
percentages planned to hold their children out, mostly due to concern for the
health of someone in their homes (Chua et al., 2020; Gallegos, 2020). Other
sources suggested the number of students not returning to neighborhood schools
was going to be greater. School officials in Alabama, for example, expressed belief
that 15% to 20% of parents would not send their children to traditional schools
(Crain, 2020). After surveys from parents showed greater preferences for virtual
learning, some school officials around the country began preparing fully online
options (Belsha, 2020). At the end of May, Crain (2020) reported seven states were
already planning to offer full-time virtual school, and school districts with pre-
existing virtual schools were seeing a surge of enrollment.
   Interest in homeschooling also appeared to spike. Homeschooling organi-
zations reported unprecedented numbers of contacts from parents seeking
advice and resources (Ali, 2020; Bethencourt, 2020; Goree, 2020; Kamenetz,
2020b). Estimates of families that would homeschool during in 2020–2021
ranged from 40% to 60% (Lardieri, 2020; Schultz, 2020; USA Today/Ipsos,
2020), and some predicted 1% to 2% of those would continue homeschooling
even after the pandemic (Ali, 2020).
JOURNAL OF SCHOOL CHOICE    7

   Throughout summer 2020, homeschool pods emerged as an option. Based
on micro-schools or homeschool coops, pods would operate with a small group
of children consistently schooling together in a home (Picchi, 2020). Parents
would lead instruction in some (Lisickis, 2020), while in others teachers or
tutors hired by participating families would lead (Courtney, 2020; Kamenetz,
2020b; Picchi, 2020). Although critics pointed to inequities created by such
pods (Bastian, 2020) – more affluent families can afford such schooling –
parents concerned about their children’s education and health and their own
employment longevity appeared unmoved by such concerns (Picchi, 2020).
   Of course, these projections were largely published in early summer 2020.
Results from our research are based on a survey of parents administered in
August 2020, making them a bit more accurate. Moreover, aside from a few
exceptions (Gross & Opalka, 2020; Malkus et al., 2020; Park & Winchester,
2020), much of the narrative above came from contemporaneous media report-
ing throughout spring 2020, not systematic research. Thus, our findings are
among the first to systematically examine families’ experiences and assessments
during COVID remote learning. Much more research on the educational
implications of COVID-19 will be forthcoming. Studies like ours will help
provide the context necessary to understand and interpret that future research.

Methods
Our study was guided by five primary questions:

  (1) What access did parents and students have to resources provided by the
      school?
  (2) What forms did remote learning take?
  (3) What was the engagement of parents and students with remote learning?
  (4) What were parent perceptions of the effectiveness of their at-home
      schooling experience?
  (5) What were parents planning to do for schooling options in 2020–2021?

Data
Answers to these questions were based on survey data we collected from
a sample of 1743 parents (representing 3,414 children) across the United
States. A professional polling firm (Technometrica) administered the survey,
which we created, online during the first two weeks of August 2020. The survey
included 44 mostly closed-ended questions about the resources families had
during at-home schooling, how children spent their day, how much time was
spent on schoolwork, communication with school, assessment of the experience,
plans for the 2021 school year, and basic demographics.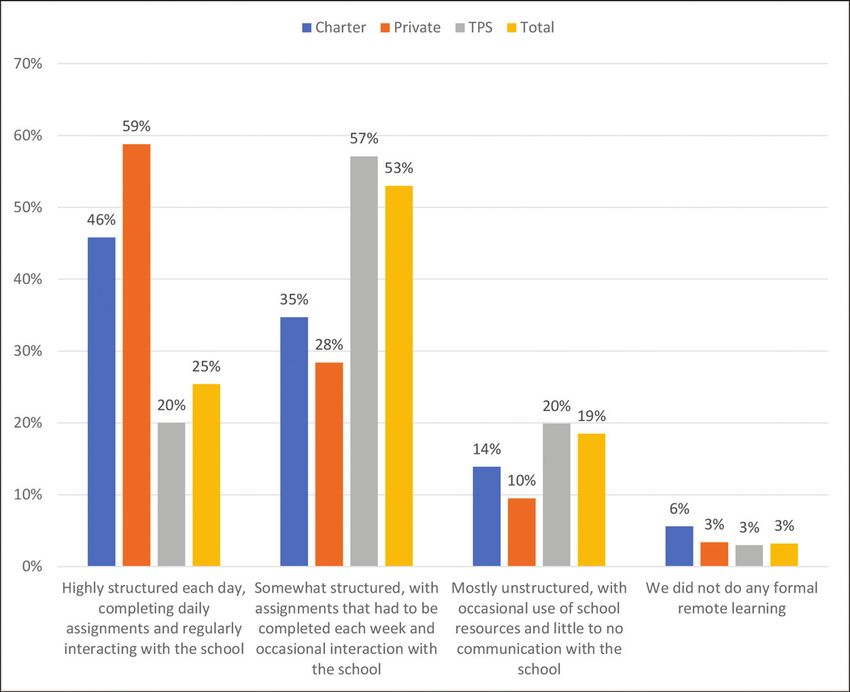
8     D. CARPENTER AND J. DUNN

    To ensure a representative sample by school type, we stratified based on
traditional public school (TPS; 84%), private school (10%), and charter school
(6%) using a quota system built into the survey. Throughout, respondents were
prompted to answer substantive questions while focusing on their youngest child
in a given school type. That child was used to fill school type quotas. For example,
if a parent reported having three children in charter schools, the parent was asked
to focus on the youngest of those. So the unit of analysis was a parent/guardian
answering on behalf or thinking of a specific child. Similar to other research in
which parents are asked to think about a particular child when answering survey
questions (Carpenter & Winters, 2015), the “youngest child” approach was used to
focus respondents’ attention on a particular school and child when answering
questions. Many of the questions asked about school responses and resources,
amount of time a child spent on schoolwork, and the like. Without focusing on
a specific child, respondents with multiple children would answer questions by
trying to “average” across schools and children, struggle to know how to answer,
or simply skip questions. Prompting respondents to think of a particular child,
therefore, reduces “noisy” and/or missing data.
    Table 2 presents the sex, race/ethnicity, education levels, and household
incomes of respondents. The majority were white females. More than 50%
held at least a college degree. Slightly more than 60% reported household
incomes of greater than 50,000 USD. Additionally, respondents’ mean age was
39 (sd = 9), and the mean number of children per respondent was two (sd =
1.2). Almost 76% of respondents were married.
    When compared to national population statistics (U.S. Bureau of the
Census, 2018, 2020, n.d.), the sample composition is similar in some respects
but different in others. Substantially more of the respondents were women,
and education levels were somewhat higher in the sample. A greater percen-
tage of the sample was White, but differences in income between the sample
and the national population were small.
    Disaggregated by school type, there were differences among these charac-
teristics. As Table 2 illustrates, TPS respondents were more often female than
those responding about charters and private schools. Charter and private
school respondents reported higher education levels and higher household
incomes. Differences in respondent age were trivial, but those in charters
(mean = 3.0, SD = 1.6) reported having more children than those in TPS
(mean = 1.9, SD = 1.1) and private schools (mean = 2.0, SD = 1.4). A greater
percentage of private school respondents (96%) also reported being married,
as compared to those in charters (84%) and TPS (73%).
    Table 3 includes the employment status of respondents and their spouses.
A little more than half of respondents were working full time when data were
collected. The next largest percentage (18%) classified themselves as home-
makers. A little more than 60% of their spouses were working full time. Equal
percentages of respondents and spouses were working part-time (10%).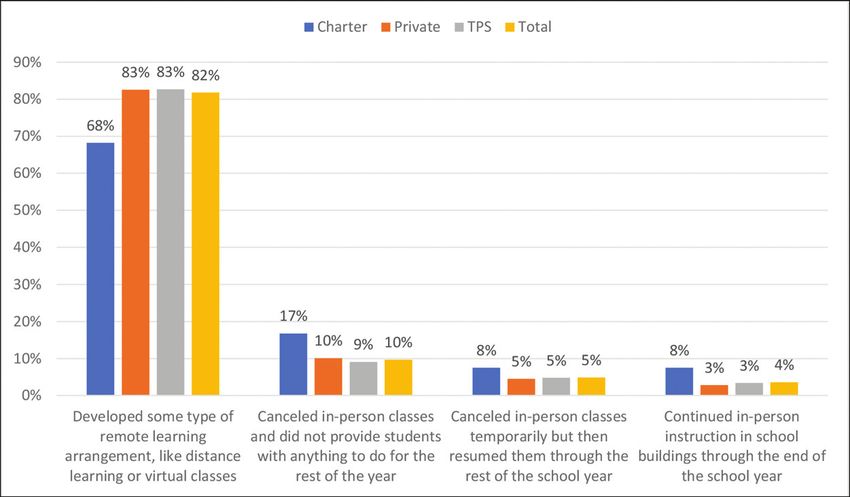
JOURNAL OF SCHOOL CHOICE             9

Table 2. Sex, race/ethnicity, education levels, and household income of respondents by school
type.
                                     Charter       Private   TPS      Total   National Population
 Sex
 Male                                  59%          66%      23%      29%            49%
 Female                                41%          34%      77%      71%            51%
 Race/Ethnicity
 White                                 68%          82%      75%      75%            60%
 Black                                  6%          4%       8%       7%             13%
 Asian                                  6%          6%       5%       5%             6%
 Native American                        1%          0%       1%       1%             1%
 Other                                  0%          0%       1%       1%             1%
 Hispanic                              20%          8%       11%      11%            19%
 Education Level
 Some high school                       2%          0%       3%       3%             7%
 High school graduate                  10%          5%       21%      19%            28%
 Some college                           9%          8%       25%      23%            28%
 College graduate                      26%          16%      28%      26%            21%
 Some graduate courses                  5%          2%       3%       3%              NA
 Graduate/Professional degree          50%          69%      20%      27%            12%
 Household Income
 Under $20,000                          9%          1%       13%      11%            15%
 Between $20,000 and $30,000            8%          2%       13%      11%            9%
 Between $30,000 and $40,000            3%          5%       10%      9%             9%
 Between $40,000 and $50,000            5%          3%       8%       7%             8%
 Between $50,000 and $75,000           13%          12%      19%      18%            17%
 Between $75,000 and $100,000          12%          11%      14%      14%            13%
 Between $100,000 and $200,000         34%          48%      18%      22%            22%
 Between $200,000 and $250,000          8%          12%      3%       5%              9%
 Over $250,000                          8%          6%       2%       3%
 Not sure                               1%          1%       1%       1%              NA

         Table 3. Respondent and spouse employment status.
                                                              Respondent       Spouse
           Employed full-time                                     54             64
           Employed part-time                                     10             10
           Unemployed and currently looking for work               6              4
           Unemployed and not currently looking for work           2              3
           Student                                                 1              0
           Retired                                                 2              3
           Homemaker                                              18              9
           Self-employed                                           4              3
           Unable to work                                          3              2

Analysis
We analyzed data with descriptive statistics (e.g., means and frequencies)
using sample weights so the sample reflected the population based on respon-
dent race/ethnicity and region of the country. We did not apply inferential
statistical tests, instead choosing only a descriptive approach for this article. In
subsequent products we will be applying statistical testing in more sophisti-
cated analyses to examine differences across a number of community and
respondent characteristics. For some questions we disaggregated results by
school type and by parental work status. As discussed above, contempora-
neous reports often showed differences in remote learning by school type.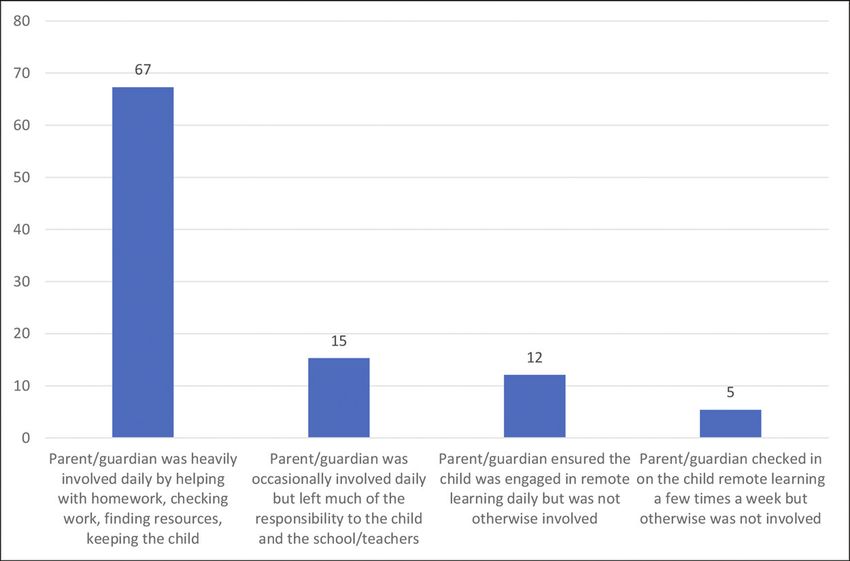
10     D. CARPENTER AND J. DUNN

Media stories also commonly highlighted the struggles of working parents in
coordinating remote learning with work responsibilities. Therefore, we
explored whether systematic differences existed consistent with the media
reporting from spring 2020.

Limitations
Like any study, ours is not without limitations. First, as Table 2 illustrates, the
sample may skew more toward women and people who have higher education
levels. Moreover, the percentages of personal characteristics are not always equal
based on school type. Sample weights applied during analyses address some but
not all these differences. Second, by necessity, parents were instructed to answer
questions thinking of their youngest child in a certain school type. This may
result in responses more representative of children in younger grade levels.

Results
We begin by describing the experiences of families with at-home schooling.
This is followed by an assessment by parents and finally results on what
families planned for the 2020–2021 school year.

The experiences of parents and students
After schools closed in March, 82% of participants reported their schools
eventually developed some type of remote learning (see Figure 1).
Ten percent reported schools canceled classes and provided no remote learn-
ing, with the remainder resuming or continuing classes until the end of the
school year. For families in schools canceling classes and providing no
resources, most students (49%) spent their time primarily watching TV and
playing games. Only 28% engaged in a learning program created by parents.
The remainder worked around the house, worked for pay, or pursued other
interests.
   The responses of schools by type of school were not, however, consistent.
Charter schools compared to the other school types were less likely to provide
remote learning and more likely to cancel in-person classes and provide no at-
home learning. Charters compared to the other school types were also some-
what more likely to continue in-person classes. Although this pattern in
charter schools may seem inconsistent, Figure 1 illustrates the distributions
by school type. Greater than 90% of TPS and private school families either did
remote learning or no formal learning at all. That left only small percentages
that continued in person. Among charter parents, however, a smaller percen-
tage participated in remote learning, leaving a comparatively greater number
JOURNAL OF SCHOOL CHOICE     11

Figure 1. How schools responded to COVID-19.

of families distributed across the other options of no remote learning or
continuing in person.
   The remote learning schools provided took the form of instructors teaching
live through a video platform (59.8%) and/or providing students software or
pre-recoded videos (59.2%). Half of parents also reported receiving paper
packets, worksheets, or books. Among schools providing remote learning, it
varied by school type (see Figure 2). Private schools more often provided real-
time, online learning and were least likely to provide hardcopy materials.
Charters more than TPS also provided real-time and video learning.
   Given how much remote learning depended on technology, access to
devices (laptops/tablets) was particularly important. As it turns out, such
access was nearly ubiquitous, with 94% of families reporting access (TPS =
93%, private = 98%, charter = 100%). For almost a third of those families,
however, their schools provided the devices, with TPS most often distributing
devices (TPS = 34%, private = 16%, charter = 29%). Relatedly, 84% of families
described their internet access as reliable or very reliable (TPS = 81%, private =
96%, charter = 96%). Most families (95%) paid for their own internet, but
when schools provided internet, charter schools more frequently did so than
the other school types (TPS = 3%, private = 5%, charter = 18%).
   Remote learning was most often semi-structured, with weekly assignments
and occasional communication with the school (see Figure 3). A quarter of
respondents said remote learning was highly structured with daily assign-
ments, and somewhat less than that said it was mostly unstructured. The
structure of remote learning differed by school type, with private and charter
schools more often than TPS requiring daily assignments and frequent com-
munication with teachers. Conversely, families in TPS more often worked in
semi- or unstructured environments.
12       D. CARPENTER AND J. DUNN

Figure 2. Types of remote learning by school type.

Figure 3. Parents’ descriptions of the structure of remote learning.

   Communication between teachers and students most often occurred at least
a few times per week, and for almost 30% of families, it happened daily (see
Figure 4). Given the differences by school type in the format of remote
learning, it is not surprising that differences in communication were large,
with charter and private schools communicating more frequently with stu-
dents than TPS. Notably, 14% of TPS participants reported communication
occurred less than once a week or rarely.
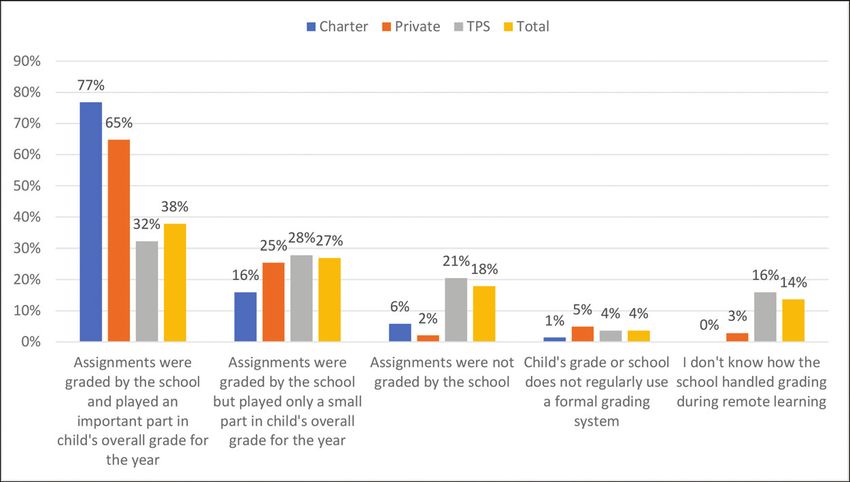
JOURNAL OF SCHOOL CHOICE   13

Figure 4. Frequency of communications between teachers and students.

  During remote learning, schools also had varying expectations of students.
Overall, a little more than one-third of parents reported assignments were
graded and played an important role in the final grade for the year (see
Figure 5). That differed substantially, however, by school type. Seventy-
seven percent and 65% of charter and private school parents respectively
reported that expectation, compared to 32% of TPS parents. Conversely, only
small percentages of charter and private school parents said assignments
were not graded, but more than one fifth of TPS parents said that was the
case in their schools.
  Participation or “attendance” in remote learning also varied by school
type. Overall, 79% of parents said schools required their child’s

Figure 5. Expectations during remote learning.
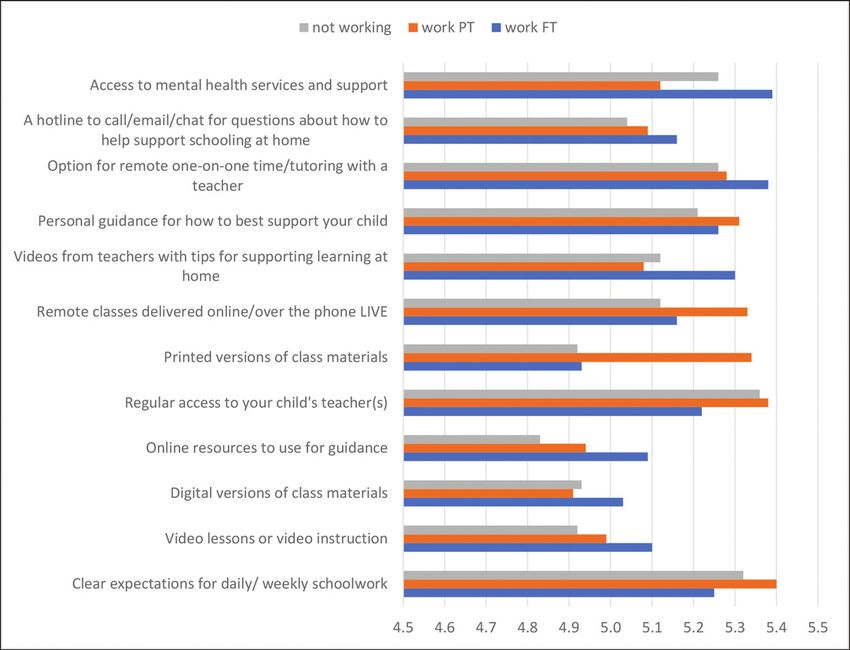
14      D. CARPENTER AND J. DUNN

participation. By school type, 93% of charter and 91% of private-school
parents reported mandatory participation compared to 77% of TPS par-
ents. Although required, schools did not always closely monitor participa-
tion. Sixty-one percent of parents said their school actively tracked
participation, with charters (87%) and private schools (85%) actively
tracking more than TPS (57%).
   During remote learning, mothers most often assumed the responsibility for
managing or helping their children (59%), but almost 30% of the time mothers
and fathers managed the responsibility equally. Parents spent about 2.5 hours
per day helping with schoolwork; children spent about an hour more each day in
remote learning. Parents most often (67%) characterized their engagement as
heavily involved daily (see Figure 6). For those less involved than that, 45% said
work responsibilities consumed their attention, but 43% said their child did not
want help.
   When parental involvement was disaggregated by work status, the results
were predictable (see Figure 7). More parents who were not working more
often reported heavy, daily involvement as compared to those working. The
difference between those working part time and those working full time,
however, was marginal.
   Part of parental involvement included communicating with schools. That
communication most often occurred through e-mail, particularly for TPS and
private schools (see Figure 8). Charter and private school parents also fre-
quently communicated with schools through video conferencing, but TPS
parents did so significantly less often. Charter schools also appeared to use
online methods such as school websites, mobile apps, and online portals more
often than the other school types.

Figure 6. Level of parental involvement in remote learning.
JOURNAL OF SCHOOL CHOICE   15

Figure 7. Level of parental involvement in remote learning by parent work status.

Figure 8. Types of communication between parents and schools.

Parents’ assessment of the experience

Two common themes in media reporting in spring 2020 were (a) how difficult
parents found at-home schooling and (b) the chaotic and inconsistent
response by schools. Our survey results, however, tell a different story.
16       D. CARPENTER AND J. DUNN

   First, parents reported feeling, on average, somewhat prepared to help with
remote learning (see Figure 9). Differences by school type showed charter and
private school parents felt more prepared than those in TPS schools.
   Parental assessments of their schools’ responses were, on the whole, positive
(see Figure 10). Across a list of resources provided by schools, parents con-
sistently rated them as at least helpful and sometimes approaching very help-
ful. None were rated as unhelpful. When disaggregated by school type, parents
in charter and private schools compared to those in TPS consistently rated the
resources as more helpful.
   When disaggregated by work status, those working full time tended to find
the resources more helpful than those working part time or those not working
(see Figure 11). Exceptions included “clear expectations for daily/weekly
schoolwork” and “regular access to your child’s teachers.” For both items,
those working full time found the resources less helpful, as compared to those
working part time or not working. It should be noted, however, the range of all
these differences was between 4.8 and 5.4, in other words, not substantial.
   Similarly, when parents rated the effectiveness of communications between
the school and them, the various methods were rated as effective and some-
times approaching very effective (see Figure 12). For almost all methods of
communication, charter schools were perceived as most effective, followed by
private schools and then TPS. One notable exception was the use of texts,
where charter schools were not perceived as effective as the other two school
types.
   In response to a series of summary statements, parents likewise appeared
sanguine, although with some exceptions (see Figure 13). Overall, parents
agreed their children had sufficient resources and materials and believed
they and their children were connected to their teachers. They also somewhat

Figure 9. How prepared parents felt to help with remote learning. Scale: 1 = very unprepared, 2 =
unprepared, 3 = somewhat unprepared, 4 = somewhat prepared, 5 = prepared, 6 = very prepared
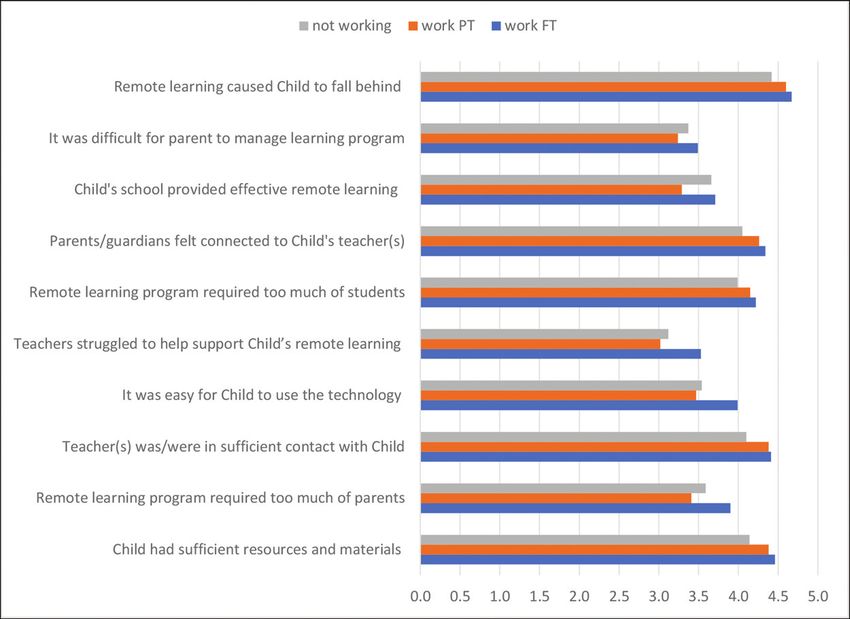
JOURNAL OF SCHOOL CHOICE          17

Figure 10. How helpful parents found resources provided by schools. Scale: 1 = useless, 2 = barely
helpful, 3 = somewhat unhelpful, 4 = somewhat helpful, 5 = helpful, 6 = very helpful

Figure 11. How helpful parents found resources provided by schools disaggregated by respondent
work status. Scale: 1 = useless, 2 = barely helpful, 3 = somewhat unhelpful, 4 = somewhat helpful,
5 = helpful, 6 = very helpful

agreed children were able to use the technology easily and the schools pro-
vided effective remote learning. At the same time, parents agreed remote
learning required too much of them and their children and were concerned
the experience caused their children to fall behind.
18 D. CARPENTER AND J. DUNN
Figure 12. Effectiveness of communication between schools and parents by school type. Scale: 1 =
very ineffective, 2 = ineffective, 3 = somewhat ineffective, 4 = somewhat effective, 5 = effective,
6 = very effective
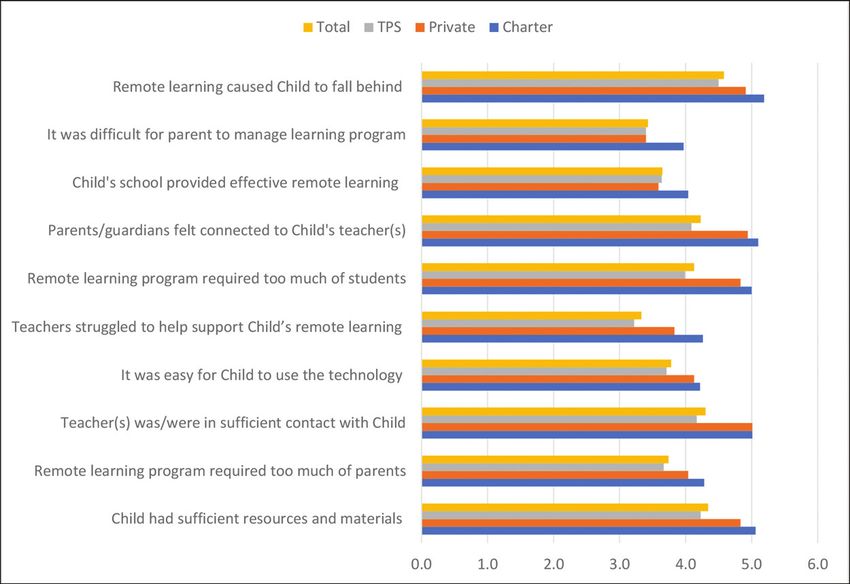
When disaggregated by school type, a clear trend is evident, wherein charter
parents agreed more strongly with the summary statements followed by private
school parents and then those in TPS. This means, for example, charter parents
expressed stronger agreement that their children possessed sufficient resources
and materials, but they also more strongly believed the experience left their
children behind academically. In other words, charter parent responses were
more polarized in that they more likely agreed with positive summary statements
listed in Figure 13, but also were more likely to agree with the negative ones.
A similar trend is evident when the summary statements are disaggregated
by respondent work status (see Figure 14). Those working full time were more
likely to express stronger agreement across all the statements – positive and
negative – as compared to those working part time or not working.
Conversely, those not working often, although not always, reported less
agreement across the statements.
In an overall assessment, we asked parents how satisfied they were with
the remote learning experience. On average, parents said they were some-
what satisfied (Scale: 1 = very satisfied 2 = satisfied, 3 = somewhat satisfied,
4 = somewhat unsatisfied, 5 = unsatisfied, 6 = very unsatisfied), although
response varied by school type. Those in charter schools expressed greater
satisfaction, followed by private-school parents and then those in TPS. When
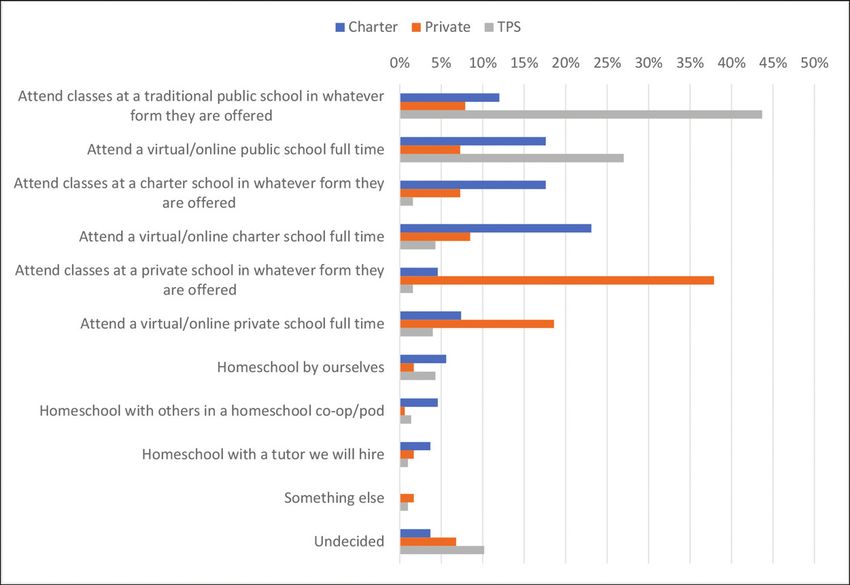
disaggregated by respondent work status, those working full time reportedJOURNAL OF SCHOOL CHOICE 19 Figure 13. Summary statements about remote learning by school type. Scale: 1 = disagree strongly, 2 = disagree, 3 = disagree somewhat, 4 = agree somewhat, 5 = agree, 6 = strongly agree Figure 14. Summary statements about remote learning by respondent work status. Scale: 1 = disagree strongly, 2 = disagree, 3 = disagree somewhat, 4 = agree somewhat, 5 = agree, 6 = strongly agree the greatest satisfaction, followed by those working part time and then those not working. Yet, when asked about their plans for the 2020–2021 school year, charter parents appeared less committed to remain in a charter school (see Figure 15).
20      D. CARPENTER AND J. DUNN

Figure 15. School plans for the 2020–2021 school year.

Instead, TPS parents seemed to express a stronger preference to remain in the
same sector. Charter school parents more than those in the other two sectors
planned to homeschool in some form. On average, 47% of parents planned to
send their children to traditional schools however they operated, 36% were
going to send their children to virtual schools, and 7% planned to homeschool
in some fashion.
   Finally, for those who planned to attend a virtual school or homeschool, we
asked the reason for that decision. The results were predictable. Eighty-seven
percent expressed concern for the health of their children or someone in their
homes if the children were to become infected. Seven percent said their
children would receive a better education that way, and only 5% expressed
concern about managing work and childcare.

Discussion and conclusion
This study surveyed 1,743 parents in traditional public, charter, and private
schools across the United States in August 2020. We asked about what school-
ing at home looked like for their families, what educational resources schools
offered, parents’ assessment of the experience, and their plans for the
2020–2021 school year.
  We found the vast majority of schools provided educational resources
ranging from hardcopy packets and worksheets to live online instruction.
Schools sometimes provided laptops and even internet service for those who
needed it. For their part, students and parents – mostly mothers – spent an
average of 3.5 and 2.5 hours a day, respectively, working through assignments
JOURNAL OF SCHOOL CHOICE     21

and materials provided by schools. Teachers maintained frequent contact with
families through various methods including e-mail, texting, video meetings,
web portals, and phone calls. Despite the grim real-time descriptions of
schooling at home that dominated the media in spring 2020, parents we
surveyed were generally positive about the experience.
   Although as of this writing schools and parents were still deciding about
enrollment for the 2020–2021 school year, only a small percentage of respon-
dents to our survey said they were going to homeschool, but more than a third
planned to send their child to a virtual school. Of those who were going to
homeschool or choose a virtual school, concern about their child’s health was
naturally the dominant motivation. Most respondents said they were going to
send their children to their traditional public/charter/private school in what-
ever form the school opened – in person, hybrid, or completely online.
   The positive opinions expressed by parents could reflect the sample com-
position. Those of greater means, two-parent households, and higher educa-
tion levels may not have experienced the burdens of remote learning as
profoundly as those in more challenging circumstances. We note, however,
many of the survey questions focused on the actions and resources of the
schools themselves. Parents were not simply evaluating their efficacy at remote
learning; they were also reflecting on how their schools responded, and parents
with children in private and charter schools report a more positive experience
than those in traditional public schools. Those opinions are in no small part
a measure of what schools did or did not do.
   Additionally, given the circumstances, parents may have given schools the
benefit of the doubt in the quality of the schools’ responses. Indeed, this may
help explain what appears to be contradictory findings – parents generally
expressing satisfaction with their remote learning experience but also worry
their children may have fallen behind academically. Recall other surveys
indicated 57% of parents found remote learning worked better than expected
(Park & Winchester, 2020). Thus, remote learning may have been better than
anticipated, leading to a sense of satisfaction (i.e., relief), but not effective
enough to allay concerns about their child’s academic growth.
   This may also explain differences by work status. Those working full time
were consistently more sanguine about the resources provided by schools and
the remote learning experience. Given the pressures on full time workers to
manage work and home responsibilities, a better-than-anticipated experience
may have produced higher satisfaction. Of course, these results may also interact
with school type, where full time workers – who tend to report greater house-
hold incomes – may also send their children to private schools at greater rates.
In future research, we intend to explore such relationships in greater detail.
   What, then, is to be learned from these results? First, they suggest large scale
change to schooling in the United States is technically possible. As Keane
(2020) described, prior to the COVID-19 closures, the quantity and quality of
22        D. CARPENTER AND J. DUNN

online instruction and even technology use in classrooms was uneven and
mostly ad hoc. Questions persisted about whether widespread virtual educa-
tion was possible (Horn & Staker, 2011). These results suggest it is. The
circumstances were not optimal, with schools rushing to create remote learn-
ing programs in a matter of days and weeks, and the quality of the program-
ming certainly would have been greater with more preparation time. But these
results show that despite little time to prepare, inadequate resources, and no
training, schools created programs with which parents were at least somewhat
satisfied overall and elements of which they rated as helpful and effective.
Indeed, given the circumstances, it is surprising schools did so well. If they
could do so under these conditions, what more is possible under better
circumstances?
   Yet, possible and probable are not the same thing. To put it plainly, our data
indicate the “educational renaissance” some soothsayers predicted will not
occur (Henderson, 2020). When asked their plans for fall 2020, the percentage
of parents choosing homeschooling was small, nothing close to the 40% to 60%
predicted by some (Lardieri, 2020; Schultz, 2020; USA Today/Ipsos, 2020).
Yes, a non-trivial percentage chose virtual schools, but primarily for health
concerns, not for a better education. This strongly suggests when the pan-
demic wanes, many of those in virtual schools will return to their brick-and-
mortar schools as before. In other words, the percentage of families choosing
virtual schools for the 2020–2021 school year is comparably large but likely
temporary. Moreover, popular articles throughout summer 2020 frequently
announced “Interest in homeschooling has ‘exploded amid pandemic’” (AP,
2020b), provided homeschooling resources (Kenniston, 2020; Remadna,
2020), and featured stories about homeschool pods (Basu, 2020), but our
results suggest this reflects a small minority of families.
   To the extent parents will school at home, our results indicate they want
someone else to lead it, hence the percentages of parents choosing virtual rather
than homeschool. Recall, when schools canceled classes and provided no
resources, most students spent their time on things other than schooling.
Moreover, the results in Figure 15 show most TPS parents are remaining in a TPS.
   Wholesale change to homeschooling and even virtual schooling in the long
term is unlikely for one simple reason: Parents cannot or will not do it. As
Horn and Staker (2011) observed,

     Home and full-time virtual schooling requires significant parental involvement . . ..The
     majority of students in America need school – or a supervised place to learn. Various
     societal stakeholders “hire” schools to do many things for their children, just one of
     which is learning. A custodial job – keeping children safe – is equally important for
     many.

They conclude, “home schooling and full-time virtual schooling will not
substitute for mainstream schooling.” Our data suggest the same.
JOURNAL OF SCHOOL CHOICE 23 Of course, plans on the part of schools and parents were exceptionally fluid as the 2020–2021 school year began. Moreover, widespread coverage of pos- sible teacher sick-outs (Cassell, Gaudiano, & Mays, 2020) and reports of positive COVID cases in schools accompanied by quarantines (deBruijn, 2020; Muller, 2020) likely exacerbated the unsettled circumstances. Parents could make last-minute flights to homeschooling to create a greater sense of certainty and stability for their children. Even if that happens, our data still suggest it will be a short-term move rather than a “massive educational reset” (McDonald, 2020). This assumes, of course, the pandemic and closure deci- sions do not continue indefinitely, and no other similar event transpires. Second, the results likely illustrate the influence of markets on school performance. Throughout the results, and consistent with findings from ear- lier research (Common Sense Media/SurveyMonkey, 2020), private schools frequently appeared to be the most responsive, engaged, and innovative, followed by charters and then TPS. In the school choice literature, much ink has been spent debating the outcomes of public versus private schools (Krueger & Zhu, 2004; Miller & Moore, 1991), with choice opponents attri- buting superior private school outcomes to student differences (Pianta & Ansari, 2018). Here, however, there are no student outcomes. Differences are manifest in the schools themselves. Private schools more often chose to communicate with students, create real-time, online programs, and set higher expectations. One may assert private schools were able to do so because of greater resources. Yet, most private schools in the United States are modest enter- prises. The average student body is 150 students. Two-thirds are religious schools (Broughman, Kincel, & Peterson, 2019). The average tuition is 11,000 USD (National Center for Education Statistics, 2013), a figure almost identical to (i.e., slightly less than) average per pupil expenditures in public schools (National Center for Education Statistics, 2019). Private schools operate with less bureaucracy than public schools, but the most relevant difference is that private schools operate in a market and TPS largely do not. Because enroll- ment is the lifeblood of private schools, they worked during COVID closures to retain students by operating more responsively and resourcefully than TPS, whose funding streams, although reduced, continued throughout the COVID- 19 closures. When it comes to student outcomes, some of the differences between private and TPS do reflect differences in student populations, but these results suggest differences also likely reflect how the schools operate and the influence of markets on those operations. TPS are not completely immune from competition. Reporting from late May, for example, described concerns among some Alabama district superintendents about losing students in fall 2020 to already-operational virtual schools in other districts (Crain, 2020). Concern was so acute, the state department of education pursued a statewide virtual school that would enroll children from any district
24       D. CARPENTER AND J. DUNN

but – critically – allow the home districts to retain funding attached to the
students (Crain, 2020; Sell, 2020). Of course, Alabama’s private schools will not
be similarly relieved of market pressure, meaning they will continue to have to
operate responsively and innovatively to retain students.
    During spring 2020, the predictions of educational pundits became an echo
chamber: “Teaching will never be the same” (Bolton, 2020), “Why schools will
never be the same” (Keierleber, 2020), or “Homeschooling during the coro-
navirus pandemic could change education forever” (Broom, 2020). Whether
the pandemic would be a watershed moment for educational change depended
at least in part on the experiences and attitudes of parents. Our results suggest
little permanent change will result from those experiences. The inertia of TPS
appears able to withstand even a worldwide pandemic.

Disclosure statement
No potential conflict of interest was reported by the authors.

Funding
This work was supported by the Searle Freedom Trust [na].

References
Ali, S. S. (2020). Parents are opting to home school their children because of COVID-19, but
  experts say it might not be for everyone. Retrieved from https://www.nbcnews.com/news/us-
  news/parents-are-opting-home-school-their-children-due-covid-19-n1232739
AP. (2020a). ‘I just can’t do this.’ Frustrated parents giving up on home school. Retrieved from
  https://www.fox5ny.com/news/i-just-cant-do-this-frustrated-parents-giving-up-on-home-
  school
AP. (2020b). Interest in homeschooling has ‘exploded’ amid pandemic. Retrieved from https://
  www.mprnews.org/story/2020/08/12/interest-in-homeschooling-has-exploded-amid-
  pandemic
Baldassare, M., Bonner, D., Dykman, A., & Lawler, R. (2020). Californians & education.
  Retrieved from https://www.ppic.org/wp-content/uploads/ppic-statewide-survey-
  californians-and-education-april-2020.pdf
Bastian, R. (2020). How educational inequality In America could be impacted by the home-
  schooling pod frenzy. Retrieved from https://www.forbes.com/sites/rebekahbastian/2020/07/
  19/how-educational-inequality-in-america-could-be-impacted-by-the-homeschooling-pod-
  frenzy/#9b03a872cbaf
Basu, T. (2020). American parents are setting up homeschool “pandemic pods”. Retrieved from
  https://www.technologyreview.com/2020/07/30/1005810/american-parents-are-setting-up-
  homeschool-pandemic-pods-microschool/
Belsha, K. (2020). Some students will stay home in the fall. School districts have to figure out how
  to teach them. Retrieved from https://ctmirror.org/2020/06/28/some-students-will-stay-
  home-in-the-fall-school-districts-have-to-figure-out-how-to-teach-them/
JOURNAL OF SCHOOL CHOICE 25 Bethencourt, A. (2020). Parents consider homeschooling next school year, worry classrooms won’t be safe from virus. Retrieved from https://kfoxtv.com/newsletter-daily/parents- consider-homeschooling-next-school-year-worry-classrooms-wont-be-safe-from-virus Bloch, E. (2020). ‘Mama is tired’: After school closures, some families burn out on online classes, others thrive. Retrieved from https://www.usatoday.com/story/news/education/2020/05/05/ coronavirus-online-classes-school-closures-homeschool-burnout/3055101001/ Blume, H., Kohli, S., Xia, R., & Esquivel, P. (2020). Tough realities as students struggle with home learning. Los Angeles Times, Retrieved from https://enewspaper.latimes.com/infinity/ article_share.aspx?guid=a0189d0116-0180c0189b-4563-b0128d-c6036c0181d0116e0182. Bolton, R. (2020). Teaching will never be the same again. Retrieved from https://www.afr.com/ work-and-careers/education/teaching-will-never-be-the-same-again-20200320-p54cc2 Broom, D. (2020). Homeschooling during the coronavirus pandemic could change education forever, says the OECD. Retrieved from https://www.weforum.org/agenda/2020/04/corona virus-homeschooling-technology-oecd/ Broughman, S. P., Kincel, B., & Peterson, J. (2019). Characteristics of private schools in the United States: Results from the 2017–18 private school universe survey first look (NCES 2019- 071). Carpenter, D. M., & Winters, M. (2015). Who chooses and why in a universal choice scholar- ship program: Evidence from Douglas County, Colorado. Journal of School Leadership, 25 (5), 899–939. doi:10.1177/105268461502500505 Carter, M. (2020). Some parents considering making home school permanent after schools reopen. Retrieved from https://www.wkbw.com/rebound/coronavirus-stress/some-parents- considering-making-home-school-permanent-after-schools-reopen Cassell, M., Gaudiano, N., & Mays, M. (2020). Teachers unions test goodwill with strike threats, hardball negotiations. Retrieved from https://www.politico.com/news/2020/08/18/teachers- unions-school-reopening-coronavirus-397997 Cavanagh, E. (2020). An award-winning teacher with 12 years of experience explains why she isn’t homeschooling her kids during the coronavirus pandemic. Retrieved from https://www. insider.com/a-teacher-says-she-isnt-homeschooling-during-the-coronavirus-pandemic -2020-3 Cavanagh, E., & Fox, E. G. (2020). Some parents say they’re not homeschooling during the coronavirus pandemic because it’s too stressful. Retrieved from https://www.insider.com/ parents-wont-homeschool-in-coronavirus-pandemic-because-of-stress-2020-3 Chua, K.-P., DeJonckheere, M., Reeves, S. L., Tribble, A. C., & Prosser, L. A. (2020). Plans for school attendance and support for COVID-19 risk mitigation measures. Retrieved from https://ihpi.umich.edu/sites/default/files/2020-06/plans%20for%20school%20attendance% 20and%20support%20for%20risk%20mitigation%20measures%20among%20parents% 20and%20guardians_final.pdf Common Sense Media/SurveyMonkey. (2020). How teens are coping and connecting in the time of the coronavirus. Retrieved from https://www.commonsensemedia.org/sites/default/files/ uploads/pdfs/2020_surveymonkey-key-findings-toplines-teens-and-coronavirus.pdf Courtney, N. J. (2020). Parents are spending $125,000 a year on at-home education pods to protect kids from coronavirus risks at school. Retrieved from https://www.insider.com/par ents-spending-125000-private-tutors-to-teach-kids-at-home-2020-7 Crain, T. P. (2020). Alabama prepares for more students to choose online school next year. Retrieved from https://www.al.com/news/2020/05/alabama-prepares-for-more-students-to- choose-online-school-next-year.html Crutchfield, A., & Londberg, M. (2020). ‘I’m really struggling’: In 6 home classrooms, families keep learning alive in a pandemic. Retrieved from https://www.wvxu.org/post/im-really- struggling-6-home-classrooms-families-keep-learning-alive-pandemic#stream/0
You can also read