Foodservice Profile Spain
←
→
Page content transcription
If your browser does not render page correctly, please read the page content below
International
Markets
Bureau

                MARKET ANALYSIS REPORT | JUNE 2011

                Foodservice Profile
                             Spain
                    Source: Shutterstock

                                                     Source: Shutterstock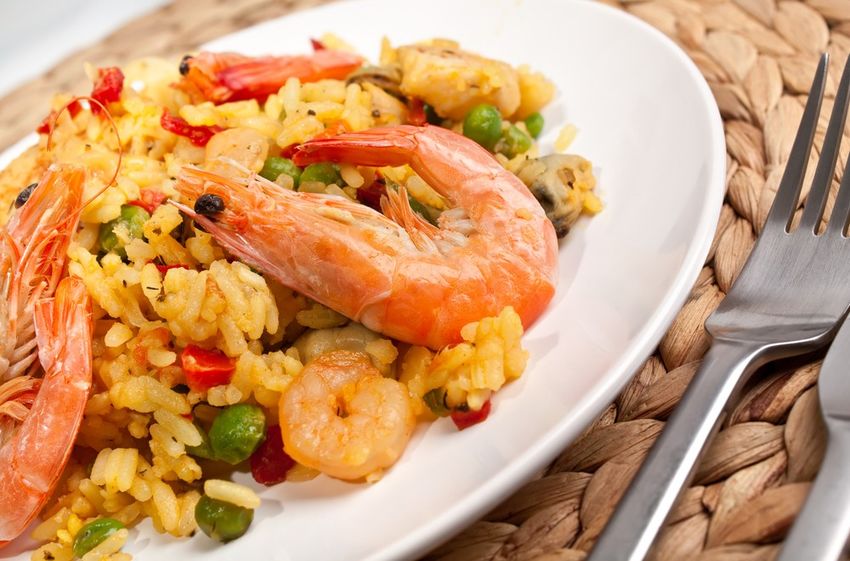
Foodservice Profile
Spain
EXECUTIVE SUMMARY INSIDE THIS ISSUE
With a population of 46.5 million and a GDP of US$1.374 trillion Executive Summary 2
(2010), Spain is the thirteenth largest economy in the world, as
well as one of the most complex and diverse consumer markets in Introduction 3
Europe. Spaniards are generally affluent and oriented toward high
quality products. As a result, the country is an important market Overview of Spain 3
for Canadian agribusiness, especially those interested in a major
consumer foodservice market. Economy 4
While it is true that Spain has stagnant economic growth and high Population 4
unemployment, the size of the Spanish consumer food market
must be considered. Although the Spanish economy was hit hard Regions of Spain 4-5
by the current economic recession, the recovery is expected to
Consumer Profile 5
bring growth in most consumer sectors. Due to economic
difficulties, many consumers have traded down to private labels
Trends and Developments 6-7
and generic brands, while others switched to discount stores.
However, the demand for high quality products, especially fruits, in Consumer Foodservice
vegetables, meat, fish and seafood, remains high.
Spending on Foodservice 7
The restaurant segment offers some special opportunities as
Restaurants 7-11
eating out is very popular in Spain. While the full-service
restaurant is a mature sector and is thus not poised for growth, it Tourism 11
will remain an important part of the industry. The fast food
segment will remain the main driver of the industry, with chained Hotels 12
fast food restaurants, home delivery and pizza sectors all
expected to perform well. Distribution Systems 13
Spanish tourism and hotel industries also offer good opportunities Major Company Profiles 14-15
in consumer foodservice. As European economies recover from
the recession, more foreign tourists visit Spain, boosting the Global Competitors 16-18
restaurant and hotel industries and contributing to the country‟s
economic upturn. Conclusions 19
Due to immigration, Spain is becoming increasingly diverse, which Bibliography 19
will trigger a higher demand for ethnic restaurants and food
products. Spaniards‟ attempts to improve their health, along with Contacts 20
an aging population, will lead to increasing demand for specific
health and wellness, as well as organic products.
Source: Shutterstock
PAGE 2
INTRODUCTION
Spain‟s market is known for its high standards and heavy competition, but also for its wealth and size.
This report provides insight into the Spanish economic landscape, summarizes leading trends in the
foodservice industry, and identifies opportunities for Canadian agriculture and agri-food suppliers.
The first section of this report outlines the main characteristics of the Spanish economy, population, geographic regions and
consumer profile. Spain‟s consumer market is well educated, with relatively high incomes across the country, which makes
for a large and savvy market segment interested in a wide range of products and foreign cuisines. Spain was heavily
affected by the global recession of 2008-2009, and the International Monetary Fund (IMF) expects the Spanish economy to
grow at a slower pace than similar sized economies. As a result, a growing segment of the population has become more
frugal, resulting in increased competition in an already saturated marketplace. As the private label trend grows in Western
Europe, suppliers will either face strong challenges in competing with them or see major opportunities if they choose to
supply them.
The second section of this report reviews the main components of the foodservice industry in Spain (food
market, tourism, restaurant and hotel industries) and lists the main characteristics of the foodservice distribution system and
major companies. The service sector accounts for more than 70% of Spain‟s gross domestic product (GDP) and will remain
the primary driver of the Spanish economy. The demand for high quality products will continue to increase, while the
economic recoveries of other European countries will revive Spain‟s tourism, hotel and restaurant industries. The
distribution structure continues to witness the pressure of large operators trying to eliminate the wholesaler and establish
their own import channels.
The last section reviews the global competitors in the Spanish foodservice market, analyzes the dynamics of Spain‟s global
trade of agri-food and seafood, and identifies opportunities for Canadian agriculture and agri-food suppliers. Canadian
exports to Spain have increased despite the economic downturn, while all major competitors experienced a decrease. This
clearly indicates the potential of the Spanish market to absorb high quality Canadian agriculture and agri-food products.
OVERVIEW OF SPAIN
Spain is a medium-sized country within the European Union (E.U.) situated in the Iberian Peninsula with coastal orientation
in all four directions. The mainland‟s neighbours are Portugal and France. The territory also includes the Balearic Islands (in
the Mediterranean), the Canary Islands, and the Moroccan enclaves of Ceuta and Melilla. The country is also a member of
the United Nations, NATO, the Organization of Economic Co-operation and development (OECD) and the World Trade
Organization (WTO) and has set itself the objective of catching up to the most advanced European economies in terms of
wealth.
Spain is a developed country with a very high living standard (20th highest Human development Index) and a high quality of
life index. The structure of the Spanish economy is that of a developed country, with the services sector being by far the
main contributor to GDP (71.6%), followed by industry (25.5%) and a shrinking agricultural sector (2.9%) (Central
Intelligence Agency, 2010).
Spain is currently facing an economic crisis which, according to Euromonitor International, saw GDP growth in 2010 down
by 0.4% (the only GDP drop amongst the leading world economies). The current negative economic scenario is
fuelled by rising unemployment - which stood at 20% by mid 2010, almost double the E.U. average - and lending
restrictions, prompting consumer confidence to weaken following more than a decade of dynamic growth. According to the
OECD and the European Commission, Spain‟s recovery from the economic crisis is not expected before 2011, making it
one of the countries to take the longest to emerge from the crisis. Moreover, it is feared that due to the high deficit level,
Spain will follow Greece and require a massive financial bail-out. This would require the government to take extra
measures, such as increasing taxes. This or other similar measures would translate into a drop in disposable incomes,
leaving consumers with limited spending power and a further weakening of confidence.
PAGE 3
ECONOMY
Spain's economy grew steadily for 10 consecutive years prior to the 2009 recession.
Euromonitor notes that during this period of prolonged growth, the Spanish economy generated more
than half of all new jobs in the Eurozone. However, the economy began to deteriorate rapidly when the
country's housing bubble collapsed and a large fiscal debt was accumulated. Real GDP contracted by 3.7% in 2009.
Table 1
Economic facts about Spain (2010)
Total GDP: US$ 1.374 trillion Share of Agriculture in GDP: 2.9%
Per Capita GDP: US$ 29,500 Debt to GDP ratio: 63.4%
GDP real growth rate: -0.4% Trade balance: -69.2 billion
Sources: Planet Retail 2011, Euromonitor 2011, Central Intelligence Agency 2011
Agriculture's share in GDP has fallen over time and was at 2.9% in 2010 (Table1). Farming continues to be a very important
sector, although water shortages limit production. Fruits, nuts, olives, tomatoes and peppers are the main export products.
Manufacturing output fell in 2009, but the pace of the downturn began to ease in the first quarter of 2010. Employment in
manufacturing has also declined as firms continue to cut costs. Presently, the sector accounts for around 14.7% of the
workforce. Tourism, which accounts for 11% of GDP, is a key economic sector and employs roughly 10% of the workforce.
The real value of tourist receipts fell by 10.2% in 2009 compared to 2008. A further decline of 2.0% is predicted for 2011
(Euromonitor, 2011).
POPULATION
The population of Spain was estimated at 46 million people in 2010. This is the result of a 13.1% increase over the 1995 to
2007 period with an annual growth of 1% from 1990 to 2000. According to the Spanish Institute of Statistics (INE),
population growth in Spain has accelerated since 2000, reaching figures of as much as 2.1% on average, due mostly to
immigration.
Similar to other developed countries in Western Europe, the phenomenon of population aging and slow generational
renewal will affect population growth in Spain over the next decade, and could cause general economic difficulties. This
demographic shift is expected to continue to evolve over the next decade, although the rate of new arrivals into Spain is
expected to decrease in the medium and long term.
REGIONS OF SPAIN
Spain is a clearly urban society and is increasingly becoming
multicultural, multiracial and religiously diverse due to the
latest growth of immigration especially from Latin America,
Northern Africa and Eastern Europe. Spain's rich history with
many cultural influences has led to a unique cuisine. It
consists of a great variety of dishes that come from
differences in geography, culture and climate. It is also
greatly influenced by seafood available from the waters that
surround the country, and reflects the country's deep
Mediterranean origins. As expected, each of Spain‟s regions
has its own unique food culture. While fish, seafood and fresh
fruits and vegetables are more popular in coastal areas, in
inner regions the traditional cuisine is based on meat, beans
and cereals.
Source: Shutterstock
PAGE 4
REGIONS OF SPAIN (CONTINUED)
There are three main regional divisions in Spain:
Mediterranean Spain – includes all the coastal provinces (Catalonia, Valencia, Murcia, Andalusia, and
the Balearic Islands) and represents almost half of the country‟s population with over 22 million inhabitants. The region has
some of the biggest urban centers such as Barcelona, Valencia, Sevilla, Alicante, Malaga and Palma de Mallorca. This
region also has a higher living standard and per capita GDP, especially in Catalonia (US$36,019) and the Balearic Islands
(US$ 33,291). Some popular local foods include seafood, such as pescaíto frito; several cold soups such as gazpacho; and
many rice-based dishes such as paella from Valencia and arroz negro from Catalonia (National Statistics Office-INE, 2009).
Inner Spain – consists of Castilla La Mancha, Extremadura, the Community of Madrid, Aragon, La Rioja, and Castilla and
Leon. This region contains about 13.5 million inhabitants, many of them living in Madrid and other large cities. Per capita
GDP is high, especially in Madrid (US$ 39,885), Aragon (US$ 33,747) and La Rioja (US$33,199). Extremadura has the
lowest per capita GDP at US$21,574. Meat is more common in inner Spain, with pork being especially popular in the
Extremadura and Castilla region. Other popular foods include hot, thick soups such as the bread and garlic-based Castilian
soup, along with stews such as cocido madrileno. Food is traditionally preserved by salting, like Spanish ham for example,
or immersed in olive oil, like Manchego cheese (INE, 2009).
Atlantic Spain – includes Galicia, Asturias, Cantabria, the Basque Country, Navarre and the Canary Island for a total
population of over 9 million. The Basque Country has the highest GDP per capita in the country (US$41,196), followed by
Navarre (US$ 39,249) and Cantabria (US$ 31,421). Popular foods include vegetable and fish-based stews such as pote
gallego and marmitako, and also the lightly cured lacon ham (INE, 2009).
CONSUMER PROFILE
Spain has one of the most demanding consumer markets in Europe in terms of product quality and diversity. Nevertheless,
recent changes in population and family structure had a major influence on the Spanish consumer base and consequently,
on the consumer foodservice sector. There is an increasing number of childless families (18% of all Spanish households),
single person families (roughly one quarter of all households), and women entering the workforce, whose eating habits are
also changing. With smaller families and less time, Spaniards are less inclined to cook, turning to simpler meal
solutions such as eating out, ready-made meals and quickly prepared packaged foods. These new trends benefited the
restaurant sector, especially fast food and take away outlets which performed relatively well during the economic downturn.
Ready-made meals and quickly prepared packaged foods were introduced into Spanish diets in the late 1990s and have
experienced tremendous volume growth ever since. According to Euromonitor, sales of prepared salads increased by 50%
between 1995 and 2007, while demand for frozen and chilled foods rose 19% over the same period. As a result of an
increasingly busy lifestyle, "quick cuisine" and convenience foods are slowly taking over the Mediterranean diet and
everyday traditional cooking.
Spain has a large aging population with a rising life expectancy. According to the INE, over seven million
people in Spain (around 18% of all population) are over the age of 65. As a result, in the future, Spain will have one of the
oldest populations in the world, which will boost the demand for certain products, specifically in the areas of health and
wellness, and better-for-you products. Increasing awareness about the benefits of a healthy diet will also translate into a
growing demand for high quality foods, such as fruits, vegetables, and fish and seafood.
Although Spaniards are attached to their own cuisine and eating habits, they are also open to foreign foods. As
immigration became the main source for population growth in Spain, the foodservice industry grew more and more diverse.
Aside from western fast food giants such as McDonald‟s and Burger King (which dominate the hamburger market), and
TelePizza (leader in the pizza market), recent trends show an increasing number of fast food outlets serving Asian and
Middle Eastern food, which aim to satisfy an increasing demand for foreign foods.
PAGE 5
TRENDS AND DEVELOPMENTS IN CONSUMER FOODSERVICE
Spanish economy shapes consumer foodservice sales
Poor economic conditions affected the performance of consumer foodservice with sales declining by
4.2% in 2009. The high unemployment rate caused a decrease in average disposable incomes in Spain thus affecting the
overall consumer foodservice performance. Furthermore, due to the economic downturn, an increasing number of
consumers shifted from full-service restaurants to cheaper solutions such as fast food restaurants. According to
Euromonitor data, sales through cafés/bars and full-service restaurants suffered the most, dropping significantly in terms of
sales in 2009.
By contrast, fast food and 100% home delivery/takeaway outlets performed better as they were perceived as a cheaper way
to „eat out.‟ Since eating out and socializing in bars is still very much part of Spanish culture, Spaniards will continue to
share meals with each other, although they are now likely to choose cheaper options. As a result, the 100% pizza home
delivery/takeaway sector will suffer from sales of ready meals through modern distribution, as they offer a good alternative
at a cheaper price. However, according to Euromonitor, sales in the fast food category will grow by 9% in constant value
terms over the 2010-2014 period,
Chained outlets concentrate in cities and shopping centres
Due to the strong economic development of the country up to 2007, new suburban housing developments
appeared especially in the large cities. These new suburbs, populated mostly by middle- and upper-income families with
young children, encouraged the development of new out-of-town shopping centres. The trend is having an effect on
consumer foodservice, with a number of franchised operations and large chains opening new outlets to the disadvantage of
independent businesses, for which rents within shopping centres remain too high.
According to Euromonitor, in 2009 there were 514 shopping centres in Spain, most of them located in big cities such as
Madrid, Barcelona and Valencia. Madrid is also home to between 25% and 30% of the total chained outlets active in the
Spanish consumer foodservice market. At the same time around 30% of all chained consumer foodservice outlets were
located in shopping centres, which tend to attract a large number of young Spaniards. As a result of the competition from
new areas, the owners of many outlets located in town centres have decided to invest in their property, in an attempt to
attract or even maintain customers. The number of shopping centres is expected to increase in the next five years, although
the growth rate will be significantly lower, due to the credit shortage and slow rate of new suburban housing developments.
However, shopping centres will remain the main driver behind the expansion of chained consumer foodservice outlets.
Changing demographics
Spanish society is increasingly becoming multicultural, multiracial and religiously diverse. The rapid economic growth and
relatively lax immigration laws fuelled the recent growth of immigration. According to Euromonitor, in 2009 nearly 12% of
Spain‟s population was foreign born – more than double the level registered in 1990. The Spanish consumer foodservice
market is rapidly adapting to these new demographic trends. This is especially visible in the menu changes at local
restaurants, characterized by the addition of foreign items such as bagels, pita bread or corn tortillas. These new offerings
make such outlets more attractive to younger consumers and immigrants, along with Spaniards looking for an alternative to
the typical Spanish cuisine. Another effect is the increasing number of foreign foodservice brands such as Taco Bell, which
entered the Spanish market in 2008, and the success of Middle Eastern fast food outlets such as Doner Kebab and Abbasid
Kebab.
Although the rate of new arrivals into Spain is expected to decrease in the medium and longer term, immigration is expected
to remain a significant influence in Spain. Euromonitor estimates that the foreign-born population will reach 27% of the
population by 2015, which will further enhance Spain‟s cultural, demographic and socioeconomic profile. This will stimulate
new developments and innovations in the consumer foodservice market, as manufacturers will try to harness the needs and
demands of these growing market niches. As a result, the number of exotic food chains, such as Cantina
Mariachi (Mexican food), WOK (Asian food) and Middle Eastern outlets, will grow in order to satisfy the preferences of the
rising immigrant population.
Health and Wellness
In recent years, Spaniards‟ attitudes towards health and wellness issues have changed as consumers are showing more
and more interest. The traditional Spanish diet uses large amounts of fish, olive oil, fruits and vegetables and is renowned
for its health benefits. However, as in other parts of the world, there have been recent changes to the diets of many
Spaniards, especially younger generations, characterized by an increasing consumption of processed and ready meals as
well as fast food. As a result, there has been a recent spike in the prevalence of obesity in Spain. According to official
sources, Spain has one of the highest overweight and obesity rates in the world, with nearly 30% of Spanish children under
the age of 12 years overweight, the second highest level in the E.U. (Euromonitor, 2011).
PAGE 6
TRENDS AND DEVELOPMENTS IN CONSUMER FOODSERVICE (CONTINUED)
This rising concern for health and wellness has also been reinforced by an increasing number of
information and educational campaigns endorsed by governmental agencies that promote a healthy
and balanced diet. At the same time the government has enacted laws to fight obesity, such as
prohibiting fast food outlets from offering gifts with children‟s meals (affecting, for example, the McDonald‟s Happy Meal and
Burger King Diverking). Food manufacturers have also adopted measures such as reducing the amount of sugar, salt, and
fat in their products. All these measures have put fast food companies in Spain under further pressure.
Overall, this health trend will negatively affect sales through fast food restaurants, while benefiting the performance of
full-service restaurants, perceived as offering healthier menus. Self-service cafeterias, which are launching salad bars and
offering healthy food at competitive prices, are likely to benefit most from the growing concern about healthy food. In
addition, fast food restaurant chains are expected to reposition themselves as quality food providers, by offering healthier
options. Chains such as Rodilla, Bocatta and Pans & Co are among those responding to health trends and offering low
calorie and better-for-you products. Even McDonald's and Burger King, the leading burger fast food chains, have moved
towards better-for-you fast food which has helped improve their sales. Meanwhile, more chains are expected to follow suit in
an attempt to gain share in this national fight against obesity.
SPENDING ON FOODSERVICE
In Spain, around a fifth of the consumer budget is devoted to food compared to only 13% in the U.S. and 29% in Portugal.
According to the World Bank, the amounts spent by Spaniards on food and housing were amongst the highest in Europe
(second only to Italy), while the levels spent on education and healthcare were much lower. The economic downturn caused
a decrease in consumer spending, while food, drink and housing claimed more than half of household budgets (55.3%).
Going out and spending time in restaurants and cafes with friends and family remains a very popular activity within Spanish
culture. Indeed, the country boasts one of the highest levels of spending devoted to restaurants and catering, taking 8.4% of
total household budget expenditure. In comparison, the European average is around 4%. Tastes are also influenced by the
fact that middle-aged Spaniards of non-Spanish origins are the most affluent consumers in Spain (Planet Retail 2010).
RESTAURANTS
The restaurant segment in Spain is fragmented, with independent domestic operators dominating in terms of number of
outlets and value sales (Tables 2 and 3). The vast majority of independent outlets are full-service restaurants, café/bars and
bakeries, which benefit from a strong insight into their customers and often have a better image among consumers than
their chained counterparts. Independent restaurants are also associated with healthy eating, although numerous chains that
provide a local feeling and emphasize quality are developing, and slowly changing consumer perceptions. While most
traditional restaurants in Spain are family-owned, there is a growing number of national and international chains. These
chained restaurants are often supported by multinational companies and offer various advantages, such as
value-added gifts, loyalty programs, and services like unlimited wireless Internet in their outlets. Chains also frequently
update their menus and offer seasonal dishes and balanced food options developed by nutritional specialists, which helps
them compete with the independent outlets.
Table 2
Consumer Foodservice by Independent Vs Chained Outlets: Units/Outlets 2009
Spain Independent Chained Total
Cafés/Bars 168,688 2,273 170,961
Full-Service Restaurants 67,195 1,257 68,452
Fast Food 2,633 2,229 4,862
100% Home Delivery/Takeaway 276 900 1,176
Self-Service Cafeterias 31 278 309
Street Stalls/Kiosks 1,454 117 1,571
Pizza Consumer Foodservice 215 1,121 1,336
Consumer Foodservice 240,277 7,054 247,331
Source: Euromonitor International, 2011
PAGE 7
RESTAURANTS (CONTINUED)
Table 3
Market Sizes - Historic/ Forecast - Foodservice Value RSP - US$ mn - Current Prices
- Fixed 2009 Exchange Rates
Spain 2004 2006 2008 2010 2012 2014
Consumer Foodservice (CFS) by Type 131,167 139,288 147,887 138,594 135,062 137,177
Chained CFS 5,053 6,077 7,365 7,318 7,652 8,264
Independent CFS 126,115 133,211 140,522 131,275 127,410 128,913
100% Home Delivery/Takeaway 763 885 1,116 1,177 1,239 1,330
Cafés/Bars 63,736 66,248 70,413 64,421 61,790 62,674
Full-Service Restaurants 62,724 67,780 71,453 68,031 66,808 67,480
Fast Food 3,446 3,799 4,260 4,307 4,536 4,952
Self-Service Cafeterias 142 197 237 252 274 303
Street Stalls/Kiosks 357 380 407 406 416 438
Pizza CFS 840 969 1,220 1,198 1,256 1,353
Consumer Foodservice by Location 131,167 139,288 147,887 138,594 135,062 137,177
CFS Through Standalone 108,949 115,386 122,010 113,962 110,779 112,198
CFS Through Leisure 4,900 5,197 5,586 5,300 5,253 5,400
CFS Through Retail 6,141 6,696 7,502 7,319 7,249 7,595
CFS Through Lodging 7,928 8,502 9,122 8,561 8,441 8,568
CFS Through Travel 3,250 3,507 3,667 3,453 3,340 3,416
Source: Euromonitor International, 2011
The café/bars segment saw robust expansion throughout the last decade until 2008, which confirms that drinking coffee out
of the home is an established part of Spanish everyday life. Market leaders include Jamaica Coffee shop and Café & Te, as
well as American chains Starbucks and Dunkin‟ Donuts. Together, the full service restaurant and café/bars represented
almost 97% of all consumer foodservice outlets in Spain in 2009. However, both full-service restaurants and café/bars were
heavily affected by the recession dropping both in terms of sales and number of outlets.
The diversification of the Spanish restaurant market follows the demographic trend and is represented by the increased
emergence of ethnic restaurants, especially Asian, Italian, American and Mexican, with a growing number of outlets
appearing throughout the country. The fast food sector includes hamburger chains, pizza/pasta, sandwiches (also known
as bocadillos) and street stalls/kiosks. The hamburger market is dominated by McDonald‟s and Burger King, which continue
to battle for market leadership as they open new outlets every year, while the pizza/pasta sector is dominated by Telepizza,
as well as by Yum! Brand‟s Pizza Hut and Pizza Movil. With more and more Spaniards looking for cheaper restaurant
solutions, the fast food sector performed well during the economic downturn. A similar trend was followed by smaller
foodservice segments such as street stalls and kiosks, and self-service cafeterias. According to Euromonitor, over the
period of 2010 to 2014 all these segments are expected to increase both in terms of value and number of outlets, while
full-service restaurants and cafés/bars will experience modest growth after 2012 (Table 3 and 4).
PAGE 8
RESTAURANTS (CONTINUED)
Table 4
Market Sizes - Historic/ Forecast - Foodservice Value RSP - US$ mn - Current Prices - Fixed 2009 Exchange Rates -
Year-on-Year Growth (%)
Spain 2006 2007 2008 2009 2010 2011 2012 2013 2014
100% Home Delivery/
Takeaway 8.8 14.8 9.9 2.3 3.1 2.5 2.7 3.4 3.9
Cafés/Bars 3.6 3.1 3.1 -5.2 -3.5 -2.9 -1.2 0.1 1.4
Full-Service Restaurants 4.2 4.2 1.1 -3.6 -1.3 -1.2 -0.6 0.1 0.9
Fast Food 5.7 6.0 5.8 -0.3 1.4 2.2 3.1 4.2 4.8
Self-Service Cafeterias 15.2 15.1 4.8 2.5 3.8 3.9 4.4 5.1 5.5
Street Stalls/Kiosks 5.4 4.9 2.1 -1.0 0.6 0.9 1.6 2.4 2.8
Pizza Consumer Foodservice 9.8 15.3 9.2 -3.5 1.8 2.1 2.7 3.6 4.0
Source: Euromonitor International, 2011
Full-Service Restaurant Segment
According to Euromonitor, value sales of the full-service restaurant sector declined by 3.6%, while the number of outlets
dropped by 3% in 2009, due to shrinking disposable income and consumer expenditure. Independent operators dominate
full-service restaurants, accounting for around 98% of both total outlets and value sales. The bulk of full-service restaurants
in Spain offer European food, and in most cases, Spanish cuisine. European restaurants accounted for 91% of total
full-service restaurant outlets in 2009 and performed well, due mostly to Italian restaurants, which offered good meal deals
with competitive prices. North American restaurants have also performed relatively well, with value sales only dropping by
1% and the number of outlets actually growing by almost 2%. This positive growth was the result of divergent performance
by chained and independent North American outlets, with the former recording solid performance in terms of both new
openings and sales.
One of the key factors behind the development of chained restaurants is the success and popularity of franchising in Spain.
Operators such as Zena Group, Comess Group and from 2009, Vips Group expanded their brands mainly through franchise
agreements, which provide fast development with low levels of risk. Franchising also allows operators to focus on brand
development and new launches, rather than on investing large amounts of money into expansion. According to
Euromonitor, the performance of the Spanish full-service restaurant sector will be defined by the poor economic situation.
While chained restaurants are expected to record a stronger performance, with value sales growing 2.9%, independent
outlets will experience a decrease of 7.6% (Eurominitor, 2011).
PAGE 9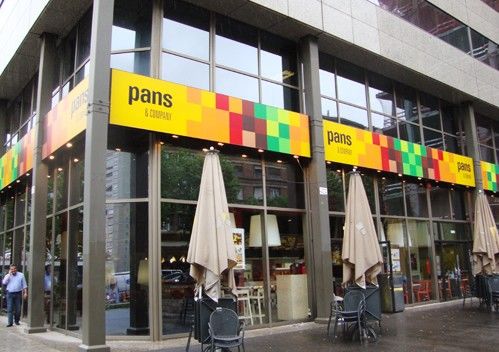
RESTAURANTS (CONTINUED)
Cafés and Bars Segment
This is a very competitive segment, operated by individual proprietors, companies or large corporations,
and represented almost 70% of all consumer food service outlets in 2009. Although Spain is well known for its coffee
houses, overall poor economic conditions affected the sector‟s performance, which experienced a decline in 2009 in both
sales value (-5.2%) and number of outlets (-4.7%). Independent operators dominate cafés/bars, comprising nearly 99% of
total outlets in 2009. However, chained cafés/bars are slowly taking share and it is expected that chained outlets will
account for nearly 2% of the cafés/bars total in 2014. Chained café/bars and specialist coffee shops are becoming
increasingly present in the centres of main cities, slowly eroding traditional cafés. Most of specialist coffee shop chains,
such as Jamaica Coffee Shop and Café y Té also offer food and lunch menus (which include pastries and sandwiches).
This strategy has proven successful and the latest chain to incorporate salads and sandwiches in its menu was Starbucks
which, in order to compete with other outlets, now includes a whole range of bocadillos in its menu. Other companies
operating in the café/bars market are Heineken NV, Cia del Tropico, Comess Group and Rodilla Sanchez. Furthermore, in
2008 and 2009, McDonald‟s opened three McCafé outlets in Madrid and Barcelona.
This segment has largely benefited from consumers‟ sensitivity to expenditure, increasing demand from younger
consumers, and the emergence of a busier lifestyle, including shorter lunch hours. Overall, the performance of fast-food
outlets has been divergent. While burger fast-food and Middle Eastern fast-food outlets have seen their sales grow, bakery
products fast-food did not follow a similar trend and sales declined dramatically. In 2009, Middle Eastern fast-food recorded
the fastest value growth (over 6%), benefiting from the rising numbers of immigrants from North Africa living in Spain.
Independent outlets offering kebabs and other Middle Eastern food opened in major towns, driving the growth of the sector.
Chained fast-food outlets accounted for 48% of the sector total and 74% of the sales value share in 2009. The level of
concentration also continued to grow in Spain (Table 5). Within chained fast-food, three companies, McDonald‟s Corp,
Burger King Holdings Inc and Agrolimen SA, accounted for around 52% of outlets and 73% of value sales in 2009.
According to Euromonitor, the growth of the sector is expected to continue, with value sales increasing by 10% in constant
terms over the next five years.
Table 5
Chained Consumer Foodservice Company Shares 2005-2009 (% value)
Company 2005 2006 2007 2008 2009
McDonald's Corp 20.3 19.6 17.6 17.8 19.3
TelePizza SA 8.6 8.6 8.8 9.2 9.8
Burger King Holdings Inc 8 7.7 7.4 7.5 7.7
Heineken NV 4.7 5.2 5.4 5.6 5.4
Agrolimen SA 7 6.3 6.3 6.3 5.2
Zena Group 4.4 4.6 4.9 5.1 5
Comess Group SL 2.3 2.3 2.5 5 4.9
Vips Group 3 3 4.4 4.5 4.4
Rodilla Sanchez SL 1.8 1.8 2.2 3.1 3.2
Yum! Brands Inc 3 3.2 3.5 3.7 1.9
Restauravia Food SL - - 1.4 1.7 1.8
Cía del Trópico de Café y Te SL 0.7 0.7 1.1 1.5 1.6
Domino's Pizza Inc - - - - 1.3
Euromontadito SL 0.3 1.1 1.1 1.2 1.2
Grupo Cafento - - - 0.8 0.9
Areas SA (GRUPO) 0.8 0.8 0.8 0.8 0.8
Eat Out Group SL, The - - 0.5 0.6 0.8
Starbucks Corp 0.6 0.7 0.7 0.8 0.7
El Corte Inglés SA 0.8 0.8 0.8 0.7 0.7
Ibersol SGPS SA 0.6 0.6 0.5 0.7 0.7
Others 33.1 33 30 23.3 22.9
Source: Euromonitor International, 2011
PAGE 10RESTAURANTS (CONTINUED)
100% Home Delivery/Takeaway Segment
Spaniards are changing their socializing habits as a result of the economic crisis. As going out is more
expensive, Spaniards tend to stay at home more often. This fact has negatively affected full-service restaurants, to the
benefit of 100% home delivery/takeaway, which experienced a growth in sales of 2% in 2009. Chained units dominate the
sector, representing 76% of total outlet numbers in 2009. The majority of chained outlets in this sector are pizza delivery,
which is a result of an aggressive expansion of delivery pizza chains in recent years. TelePizza SA is the sector leader,
accounting for 71% of chained outlets and 76% of chained value sales in 2009. Zena Group is the largest franchisee of
Domino‟s Pizza in Spain with 100 outlets in 2009. Independent outlets dominate other 100% home delivery/takeaway
sectors, such as Chinese, which was characterised by the absence of any chained operator. However, the opening of the
chain Takeawok means that new options are available in this sector.
As the economy continues to under-perform, more Spaniards will opt for cheaper meal options such as 100% home
delivery/takeaway. According to Euromonitor, sales are expected to grow by 10% in constant value terms over 2010-2014,
supported by an increasing number of chained outlets and aggressive promotional campaigns.
Self-Service Cafeterias Segment
This segment is one of the most dynamic in the consumer foodservice market, with a growth of 3% in value terms and a 7%
increase in the number of outlets in 2009. This growth was mostly driven by the strong public investment in infrastructures
such as roads and train stations. Chained outlets dominate the segment, accounting for 90% of the total number of outlets
and 88% of total value sales in 2009. Areas SA is the leading player in self-service cafeterias in terms of outlet numbers in
2009 with 36% of the total. Its main brands are Ars, Medas and La Pausa. Zena Group, with 47 outlets across Spain,
accounted for almost 20% of sales, ranking the company second in value terms in 2009.
According to Euromonitor, value sales are expected to increase by 18% in constant terms over 2010-2014, while the
number of outlets is expected to grow by 10%. However, due to the high level of public deficit, the Spanish government has
decided to cut back on public expenditure, especially the construction of new transport networks, which could impact the
opening of new self-service cafeterias and therefore sector performance.
TOURISM
Spain has a very well developed tourism industry, as the country is the second-most visited destination in the world, after
France. According to Euromonitor, the country received 51.7 million tourists in 2009, spending a total of US$154.2 billion
(Table 6). The tourism sector contributes nearly 11% to the country's GDP, and employs about 2 million of the total labor
force.
Spain offers numerous types of tourism such as summer resorts and beaches, as well as cultural, business, religious and
winter tourism. There are many world famous festivals across the country as well as a very active night life. The vast
majority of tourists visiting Spain are from Western Europe, especially the United Kingdom (16.2 million), Germany (10.1
million) and France (9.2 million), followed by Italy and the Nordic countries. The most frequented region is Catalonia with 15
million visitors, followed by the Balearic Islands (10.2 million), Canary Islands (9.6 million), and Andalusia (8.6 million)
(Euromonitor 2010). According to Euromonitor, 2009 was the worst performing year on record for the Spanish travel and
tourism industry. The number of incoming tourists tumbled, driven by the sharp decline of the European economy. With
unemployment hitting 19% of the Spanish working population, nearly 40% of Spaniards did not enjoy a holiday.
The top three European countries accounted for 61% of the visitors Spain received in 2009, which makes the Spanish
tourism industry over-dependent on just three source markets, with the U.K. alone accounting for more than a quarter of all
incoming visitors (27.8%). As a result, the Spanish tourism industry remained dependent not only on the condition of the
British economy, but also on sudden fluctuations in the exchange rate of the Euro. The weakening of the British Pound
against the Euro throughout 2008 meant that holidays in Spain for British tourists in 2009, were suddenly much more
expensive than two years earlier.
The Spanish economy is expected to remain stagnant, with very high unemployment around 18% of the working population
in 2011 and above 15% until 2012. Furthermore, the slow economic recovery in Europe will prevent Spain from receiving as
many tourists as it did before the crisis (Table 6). However, the economic situation in major source markets will improve,
which will positively affect the Spanish tourism industry.
PAGE 11TOURISM (CONTINUED)
Table 6
Market Sizes - Historic/Forecast Retail Value RSP - US$ millions - Current Prices - Fixed 2009 Exchange Rates
Spain 2005 2006 2007 2008 2009 2010 2011 2012 2013 2014
Arrivals - Number
of People - '000
people 55,914 58,005 58,666 57,316 51,708 50,716 50,958 52,473 53,460 53,807
Balance of
Payments 50,714 53,459 56,601 57,172 51,740 51,671 52,806 55,360 57428 58,999
Outgoing Tourist
Expenditure 12,470 12,797 14,136 14,114 14,268 14,540 15,201 15,687 16012 16,225
Tourism
Expenditure 142,205 152,243 162,236 160,670 154,266 152,882 153,427 157,079 159,134 161,635
Source: Euromonitor International, 2011
HOTELS
According to Spanish National Statistics, in 2006 there were over 13,000 hotel establishments in Spain; 63% of them
classified as four-star hotels, 21% as five-star hotels, and only 12% as three-star establishments. More then 40% of
Spanish hotels were independently operated and did not belong to a chain (Planet Retail 2010).
Given the importance of the tourism industry, resort hotels dominate. As the leading hotel operator in Spain, Sol Melia owns
more than 300 establishments (a mixture of three, four and five-star hotels) with more than 77,300 hotel beds and has about
5% market share. Riu Hotels is second with over 100 hotels and more than 50,000 beds. In third place in terms of revenue
is NH Hotels with over 260 establishments and more than 37,500 beds Other major chains are Barcelo Hotels, Iberostar
Hotels, Group H 10 Hotels, Fiesta Hotel group, Husa Hotels, Princess Hotels and AC Hotels. Together these 10 chains
operated 650 hotels and offered 112,600 beds in 2009 (Planet Retail 2010).
Regarding food and beverage trends, Sol Melia has established room service with the delivery chain Telepizza and has
announced the development of a new cafeteria concept that will soon be available to the company‟s clientele (in three and
four-star hotels). For four and five-star hotels, the company offers an extensive range of Mediterranean, Asian, and South
American culinary experiences (Planet Retail 2010).
Euromonitor estimates that due to the slow recovery of the Spanish economy over the period 2010-2014, the tourism and
hotel industries will experience modest growth. However, as the other European economies recover, an increasing number
of foreign tourists are expected to arrive in Spain, driving the country‟s economic upturn (Table 7).
Table 7
Market Sizes – Historic/ Forecast – Number of Hotel Outlets, and Retail Value RSP
(Current Prices, Fixed 2009 Exchange Rate)
Spain 2005 2006 2007 2008 2009 2010 2011 2012 2013 2014
Hotels – Retail Value RSP
22,554 23,203 23,910 24,180 21,512 20,934 20,697 21,010 21,538 21,957
in US$ mn
Hotels – Sites/outlets 15,821 15,924 16,125 16,471 16,706 16,430 16,288 16,224 16,246 16,290
Source: Euromonitor International, 2011
PAGE 12DISTRIBUTION SYSTEMS
The Spanish foodservice market is highly fragmented and very diverse. Hypermarkets, supermarkets,
convenience stores, as well as restaurant and hotel chains coexist with the traditional corner grocery
stores, independent restaurants and hotels, and open-air markets. However the trend is toward centralization as the total
number of retail outlets has decreased significantly in the last decade.
In Spain, hyper and supermarkets account for 60% of total food sales and the retail market is gradually becoming similar to
other E.U. countries. Following the E.U. trend, there is an increasing level of concentration and growing competition in the
scope and range of products. These include ready-to-eat and/or ready-to-cook foods, take-away meals, and home delivery.
The presence of foreign retailers, especially in the hypermarket and discount sectors, with French and German groups
noticeably present, is also contributing to standardization in terms of product demand and distribution structure (USDA,
2010).
Although still very popular in Spain, small chain and independent restaurants were most affected by the economic
recession, while large chains managed to increase their market share. Independent hotel operators account for more than
half of the industry in Spain and it appears that the trend towards centralization is less obvious as compared with the retail
and restaurant industries.
The traditional Spanish foodservice distribution system operates on an importer and wholesaler model (Figure 1). In this
system wholesalers import the goods and resell them in the domestic market to regional distributors or directly to
foodservice and grocer retailers. However, in an attempt to cut costs, large operators (supermarket chains) have been trying
to alter the distribution model by eliminating the wholesalers and establishing their own import channels. Furthermore, an
increasing supply of imported products has intensified competition among suppliers and retailers and increased the
concentration in food distribution sectors. As a result, it is expected that the trend towards cutting out the wholesaler will
continue into the future.
Figure 1: Foodservice Distribution Structure
Exporter
Importer / Wholesaler
Distributor /Broker
Regional Distributor Small
Wholesaler Distributor
Retailers Foodservice
Source: United States Department of Agriculture, 2011.
Derived from ‘Spain Exporter Guide’- GAIN Report Number SP1003, 03/15/2010
PAGE 13MAJOR COMPANY PROFILES
Restaurants
Vips Group is the leading company in value terms, with a 22% share of chained
full-service restaurants. The company has decided to use franchises as its new way
of expanding, and the first brand to follow this new strategy was Ginos. In 2009, the
company also opened The Wok, an Asian full-service restaurant chain which further
consolidated the company‟s position in the market.
Zena Group ranked second in value terms (16%) and third by number of outlets in
the chained full-service restaurant segment. Its brands include Foster‟s Hollywood, Il
Tempietto, Nostrus, and Don Capri. The company saw its market share grow due
mainly to the acquisition of the Latin American full-service restaurant chain La Vaca
Argentina in 2008 as well as the strong performance of North American full-service
restaurant Foster‟s Hollywood.
Comess Group SL ranks third in chained full-service restaurants and manages
chains such as Cantina Mariachi (Mexican food) and Pasta City (Italian food). The
company is also active within North American full-service restaurants through the
brand Rock&Ribs, and within Asian restaurants with the newly opened China Boom
chain. Comess Group operates outlets typically located in shopping centres and in
2009 suffered from the slowed development of new shopping centres. The company
now focuses on managing franchises rather than owning full-service restaurants
McDonald’s is the largest fast food corporation in the world and has a global supply
chain that provides all of its foodservice industry needs. In Spain, 2009 was
McDonald‟s best performing year in both volume and value terms, maintaining the
company‟s leadership with a 32% share of chained burger fast food sales. In order to
satisfy local tastes, McDonald‟s has been very active in developing new products
using local ingredients, such as traditional Spanish bread and sauces. The company
also opened the first 24-hour McCafés.
Telepizza is the country‟s largest pizza chain, with more than 600 outlets in Spain
alone, and places second in terms of value sales. The company‟s strength remains in
home delivery pizza, which has resulted in its share being eroded by strong
competition from food retailers such as supermarkets, hypermarkets and other food
operators offering much wider options in terms of product.
Burger King is the second largest fast food operator in Spain in terms of sales value,
after McDonald‟s. In 2009, the company focused on expanding its presence in the
Spanish market by developing new concepts of restaurants, such as the Whopper
Bar. Burger King does not employ a universal supply structure outside of North
America, and operations are subject to the recommendations and management of
franchise operators within international markets.
Eat Out Group concentrates the bulk of its business within bakery products fast food.
The company‟s main goal is to continue expanding its activity to other sectors of the
Spanish consumer foodservice market. This strategy explains the latest acquisition of
the kebab chain Abbasid Döner Kebab, and the agreement with the Latin American
chain Pollo Pampero – a chicken fast food business – to help expand its operation in
Spain. Moreover, in 2008 the company acquired Ribs La Casa de las Costillas, a From top to bottom:
North American restaurant chain located in Madrid. - Grupo Zena Foster‟s Hollywood in
Madrid
- McDonald‟s location in Barcelona
Jamaica Coffee Shop is the leader in the coffee shop market in Spain, where it
- Telepizza location in Bilbao
operates more than 100 outlets. The company also operates restaurants in Portugal, - Eat Out Group Pans in Barcelona
Andorra and China.
Source for all: Planet Retail, 2011
PAGE 14MAJOR COMPANY PROFILES (CONTINUED)
Supermarkets
Mercadona is the largest grocery retailer in Spain, which operates a network of
approximately 1,300 supermarkets. Its sales have almost doubled over the period of
2005-2010, with the opening of around 100 new supermarkets per year over the
period of 1999-2008, until the recession forced the retailer to slow down expansion.
Pricing is based on a competitive everyday low price strategy which is positioned at
around 3% below its competitors. It also has a wide range of private labels (38% of
total sales in 2009). With relatively large stores measuring between 1,000-1,500 m²,
located in town centres, Mercadona has managed to effectively fill a gap between
hypermarkets and discounters for competitively priced and convenient grocery
shopping.
El Corte Inglés is Spain's largest retailer, operating a wide range of formats, from
department stores to travel agencies and supermarkets. In 2000, it launched the
Supercor supermarket and Opencor convenience store formats, which the retailer is
also using as part of its aim to be present in every city across the country.
Carrefour is the leading operator in both the hypermarket and discount store sector
and trades under three key grocery formats: Carrefour hypermarkets, Dia discount
stores and Carrefour Express supermarkets. It also has the largest number of outlets
(over 3100).
Eroski covers a wide range of food, non-food, wholesaling and travel formats. In June
2007, Eroski strengthened its position in the market by acquiring a 75% stake in
supermarket chain Caprabo. However, the economic crisis has taken its toll on the
retailer, which posted negative sales in 2009 and has been forced to go ahead with a
sell-and-lease store plan in order to reduce debt.
Auchan (Alcampo) occupies the fifth position in the national grocery market. The
retailer's approach in Spain over the last few years has been somewhat more cautious
than the strategies of its competitors. As the grocery sector is already very
competitive, Auchan is faced with powerful opponents in the hypermarket and
supermarket segments, its two traditional areas of business in the country.
Hotels
Sol Melia is the largest hotel operator in Spain. With more than 300 hotels and more
than 77,300 beds, it currently carries 55% of the market share in the country. The Topmost: Mercadona Supermarket
in Madrid
group has established a room service delivery system with Telepizza and offers a wide
range of Mediterranean, Asian, and South American menus. Centre: Carrefour Supermarket in
Madrid
Riu Hotels is the second largest hotel operator in Spain with more than 100 hotels Source for both: Planet Retail, 2011
and a total number of more than 50,000 beds. Almost half of all hotels are located in
Spain with the rest operating in North America, the Caribbean, Europe and North Above: Sol Melia Hotel in
Africa. Barcelona
Source: www.melia-hotels.com
NH Hotels is a hotel chain based in Madrid and has over 260 establishments with
more than 37,500 beds, located in Europe, Latin America and Africa. NH Hotels ranks
third in the European ranking for business hotels.
PAGE 15GLOBAL COMPETITORS
Agri-food
Spain‟s total agri-food imports in 2010 were valued at US$28.1 billion remaining virtually unchanged
from 2009 level (US$27.9), but a decrease from US$$33.1 billion in 2008 (Global Trade Information Service [GTIS],
2011). Of this, Canada was the 27th largest supplier of agri-food products to Spain, with a total value of US$151.4 million,
a 14.7% decrease from UD$177.5 million in 2009. Although Canada‟s agri-food exports to Spain increased in the years
2008 to 2010, they are still bellow the level reached in 2005 when Canadian agri-food products supplied to Spain totalled
almost US$190 million. Canada‟s main competitors within the Spanish agri-food market are European Union countries as
well as Brazil, Argentina and the United States (Table 8).
Table 8
Spain Import Statistics - Agri-food products, by Country
US millions
Partner Country
2005 2006 2007 2008 2009 2010
World 22,158.40 22,563.98 28,551.23 33,114.74 27,902.52 28,106.57
France 4,138.36 4,215.30 5,159.49 5,741.47 4,990.84 4,999.99
Germany 2,866.11 2,817.78 2,916.96 3,274.99 2,989.85 3,028.46
Netherlands 1,817.85 1,861.57 2,482.78 2,740.55 2,524.70 2,493.50
Portugal 819.15 886.72 1,219.89 1,807.67 1,582.77 1,777.99
Brazil 1,047.93 1,067.25 2,154.91 2,088.17 1,721.33 1,757.54
United Kingdom 1,626.71 1,577.49 1,754.23 1,826.49 1,586.08 1,599.48
United States 955.65 813.83 1,409.76 1,679.23 878.00 1,289.04
Italy 1,043.01 1,057.97 1,299.14 1,352.69 1,296.18 1,238.89
Argentina 1,136.69 1,095.98 1,750.73 2,644.59 1,078.39 1,029.07
Belgium 610.42 661.61 816.74 956.82 848.43 882.64
Canada (27) 189.38 157.25 82.82 102.35 177.53 151.42
Source: GTIS, 2011
Fish and Seafood
Spanish seafood imports from the world were valued at US$6.4 billion in
2010, marking a 7.8% increase from the previous year (US$5.9 billion),
which is still under the pre-recession level of US$7.1 recorded in 2008
(GTIS, 2010). Canada is not a major supplier of seafood to Spain, retaining
the 46th position with a total value of US$21.3 million in 2010 (Table 9). The
top five competitors in the country are Argentina, Morocco, China, France
and Ecuador. Spanish seafood imports have been constantly increasing in
value since 2000 due to robust economic growth. However, the current
economic downturn caused a decline in consumer expenditure, which is
expected to remain at a lower lever over the year 2011. Despite this, the
Spanish fish and seafood market remains an extensive one and offers very
good opportunities for Canadian exporters. Source: Shutterstock
PAGE 16GLOBAL COMPETITORS (CONTINUED)
Table 9
Spain Import Statistics - Fish and Seafood products, by Country
US millions
Partner Country
2005 2006 2007 2008 2009 2010
World 5,637.17 6,404.80 7,049.00 7,126.04 5,927.01 6,432.22
Argentina 294.10 516.44 440.52 451.08 381.73 500.89
Morocco 482.83 540.78 601.97 703.57 539.56 491.62
China 242.34 307.00 323.11 315.65 311.11 407.15
France 381.24 388.97 469.67 435.18 329.57 335.73
Ecuador 181.08 252.10 265.97 409.48 302.01 326.59
Portugal 241.69 255.98 296.42 350.20 259.59 303.68
United Kingdom 325.22 334.20 429.19 351.25 302.24 301.35
Netherlands 214.15 239.27 273.45 228.47 232.70 259.38
Italy 244.91 288.88 266.00 252.28 207.05 210.88
Canada (46) 35.24 38.41 40.52 40.11 30.48 21.34
Source: GTIS, 2011
CANADIAN EXPORTS TO SPAIN
Agri-food
Canada‟s top six exports to Spain in 2010 were oilseeds, cereals, vegetables and roots, residues from food industries,
products of animal origin and dairy products. An interesting trend to note in 2010 exports is that, Canada‟s total exports to
Spain (USD$210 million) remained at the high level reached in 2009. Although oilseeds and cereal exports decreased
slightly in 2010, they remained the top products exported to Spain (Table 10 and 11). At the same time, the exports of
vegetables almost doubled to reach US$47.5 million while dairy products increased ten fold to US$1.3 million, albeit from
a very low level. Since Spain is a market that has traditionally demanded high quality products, opportunities may exist for
other Canadian commodities.
Table 10
Top 6 Canadian Agri-food Exports to Spain
US Dollars
Export
2006 2007 2008 2009 2010
Total 125,558,482 68,195,368 86,603,576 209,668,471 210,773,221
Oilseeds And Oleaginous Fruit 6,339,394 2,087,674 3,026,448 118,644,072 101,220,642
Cereals 23,199,748 22,289,520 47,778,425 54,973,893 47,494,813
Edible Vegetables And Certain Roots
And Tubers 88,072,937 34,566,052 26,140,761 25,529,376 47,433,166
Food Industry Residues & Waste; Prep
Animal Feed 996,497 1,039,903 1,675,379 2,477,910 3,924,630
Products Of Animal Origin, Nesoi 3,750,365 3,398,129 3,418,464 2,811,277 3,856,164
Dairy Prods; Birds Eggs; Honey; Ed
Animal Pr Nesoi 3,249 0 0 114,100 1,371,473
Source: GTIS, 2011
PAGE 17GLOBAL COMPETITORS (CONTINUED)
Table 11
Top 6 Canadian Agri-food exports to Spain
Volume
Export
2006 2007 2008 2009 2010 Unit
Oil Seeds And Oleaginous Fruits 21,573 3,439 3,407 300,317 212,793 T
Cereals 117,388 74,189 123,726 202,108 135,407 T
Edible Vegetables And Certain Roots And
536,292 91,404 31,917 48,676 86,007 T
Tubers
Food Industry Residues & Waste; Prep
2,535 769 1,104 1,494 1,934 T
Animal Feed
Products Of Animal Origin, Nesoi 444 198 208 202 39 T
Dairy Prods; Birds Eggs; Honey; Ed
2 - - 32 180 T
Animal Pr Nesoi
Source: GTIS, 2011
Seafood
Canada‟s seafood exports to Spain decreased over the last few years both in terms of value and volume (Tables 12 and
13). In 2010 the total value was US$12.8 million, which represents a decrease of 30% from US$18.1 million in 2009, and
about a third the value of exports in 2007. This trend can be explained by the decrease in demand during the economic
recession, but also indicates the real potential for exporting high quality Canadian seafood products to Spain.
Table 12
Canadian Fish and Seafood Exports to Spain
US Dollars
Description 2005 2006 2007 2008 2009 2010
Total Fish and Seafood 22,968,435 35,005,638 36,355,334 28,678,601 18,125,136 12,789,642
Fish, Crustaceans & Aquatic
Invertebrates 22,906,814 34,841,316 36,236,147 28,413,343 18,106,133 12,777,886
Prep Or Pres Fish; Caviar &
Caviar Substitutes 49,415 115,251 89,482 56,901 - 11,756
Crustaceans, Molluscs Etc.
Prepared Or Preserved 12,207 49,071 29,705 208,357 19,003 -
Source: GTIS, 2011
Table 13
Canadian Fish and Seafood Export to Spain (Volume Tonnes)
Description 2005 2006 2007 2008 2009 2010
Total Fish and Seafood 7,043 9,495 7,303 6,190 3,583 2,279
Fish, Crustaceans & Aquatic
Invertebrates 7,025 9,488 7,286 6,160 3,580 2,278
Prep Or Pres Fish; Caviar &
Caviar Substitutes 18 6 16 11 - 1
Crustaceans, Molluscs Etc.
Prepared Or Preserved - 1 1 18 3 -
Source: GTIS, 2011
PAGE 18CONCLUSION - OPPORTUNITIES FOR CANADIAN EXPORTERS
The Spanish foodservice industry is an important market for Canadian exporters. Despite the
economic crisis, it is still one of the largest food markets in Europe and has the potential for growth in
the future as highly educated Spanish consumers are oriented towards high quality products.
Furthermore, due to immigration, the market is becoming more diverse, which will increase the demand for ethnic and
foreign foods.
Spain is already facing issues such as high rates of obesity and an aging population and Spanish consumers are
becoming more aware of the benefits of a healthy, balanced diet. As the demand for better-for-you, health and wellness
and organic products is growing, there is a good opportunity for high quality Canadian products.
The Spanish retail food market has become highly diversified. As consumers are looking for cheaper options and the
competition between foodservice retailers increases, many independent companies are being replaced by chained
outlets. There is also the tendency to eliminate regional wholesalers and small distributors as the major chains try to
create their own supply structures. For Canadian exporters the advantage of doing business with chained outlets is that it
can reduce overall costs and allow for large scale exporting.
Spain has a highly developed and specialized restaurant industry and Spaniards allocate an important part of their
budgets to eating out. This offers opportunities for a wide range of Canadian products to be exported to Spain, from high
quality fish, seafood, beverages and spirits to basics such as cereals and dairy products. While not set for an impressive
growth, the restaurant sector is expected to perform better than the rest of the Spanish economy.
Spain is one of the most visited countries in the world, and has a highly developed tourism infrastructure. Although the
tourism sector was most affected during the recession, the number of both domestic and foreign tourists is expected to
remain high. The rate of economic growth is expected to follow the European trend, although at a slower rate. As
European economies recover, a rising number of affluent tourists will continue to visit the country. Together with the
restaurant and services industries, the Spanish tourism sector will outperform the rest of the economy, leading the
recovery and offering good opportunities for Canadian agribusiness.
BIBLIOGRAPHY
Central Intelligence Agency (CIA) “Spain World Factbook.” 2010
Euromonitor International. “100% Delivery/Takeaway – Spain.” August 2010
Euromonitor International. “Cafes/Bars – Spain.” August 2010
Euromonitor International. “Consumer lifestyle Spain.” March 2009
Euromonitor International. “Consumer foodservice Spain.” August 2010
Euromonitor International. “Fast Food – Spain.” August 2010
Euromonitor International. “Full-service Restaurants – Spain.” August 2010
Euromonitor International. “Self-service Cafeterias – Spain.” August 2010
Euromonitor International. “Spain - Country Factfile.” January 2010
Euromonitor International. “Street stalls/ Kiosks – Spain.” August 2010
Euromonitor International. “Tourism and Travel – Spain.” April 2010
Euromonitor International. “Retailing – Spain.” January 2010
Planet Retail, Data 2004-2010
Spanish National Statistics, Data 2004-2010
Spanish Touristic Institute, “Spanish Tourism in Figures.” 2006
United States Department of Agriculture, 2010
PAGE 19You can also read