Aggregate Modeling and Equilibrium Analysis of the Crowdsourcing Market for Autonomous Vehicles
←
→
Page content transcription
If your browser does not render page correctly, please read the page content below
Aggregate Modeling and Equilibrium Analysis of the
                                                   Crowdsourcing Market for Autonomous Vehicles

                                                                             Xiaoyan Wanga          Xi Lina        Meng Lia,b, *
arXiv:2102.07147v1 [econ.GN] 14 Feb 2021

                                                            a Department   of Civil Engineering, Tsinghua University, Beijing 100084, P.R. China

                                            b Center   for Intelligent Connected Vehicles and Transportation, Tsinghua University, Beijing 100084, P.R. China

                                                                                                  Abstract
                                                  Autonomous vehicles (AVs) have the potential of reshaping the human mobility in a wide va-
                                                  riety of aspects. This paper focuses on a new possibility that the AV owners have the option of
                                                  ”renting” their AVs to a company, which can use these collected AVs to provide on-demand
                                                  ride services without any drivers. We call such a mobility market with AV renting options
                                                  the ”AV crowdsourcing market”. This paper establishes an aggregate equilibrium model with
                                                  multiple transport modes to analyze the AV crowdsourcing market. The modeling framework
                                                  can capture the customers’ mode choices and AV owners’ rental decisions with the presence of
                                                  traffic congestion. Then, we explore different scenarios that either maximize the crowdsourc-
                                                  ing platform’s profit or maximize social welfare. Gradient-based optimization algorithms are
                                                  designed for solving the problems. The results obtained by numerical examples reveal the
                                                  welfare enhancement and the strong profitability of the AV crowdsourcing service. However,
                                                  when the crowdsourcing scale is small, the crowdsourcing platform might not be profitable.
                                                  A second-best pricing scheme is able to avoid such undesirable cases. The insights generated
                                                  from the analyses provide guidance for regulators, service providers and citizens to make
                                                  future decisions regarding the utilization of the AV crowdsourcing markets for serving the
                                                  good of the society.

                                                  Keywords: Crowdsourcing; Autonomous vehicles; Mobility market; Equilibrium; Pricing

                                           1     Introduction

                                           With the rapid development of artificial intelligence and communication technology in recent
                                           years, autonomous vehicles (AVs) are undergoing rapid development. There has been an intense
                                           effort by researchers and manufactures to enable AVs to handle a wide range of driving condi-
                                           tions that can be encountered during the road travel. In 2018, public road tests for AVs to provide
                                           on-demand ride service were performed, and in 2020, some major transportation network com-
                                           panies (TNCs) such as Lyft, Waymo and Baidu have launched commercialized AV on-demand
                                           ride service programs in certain areas around the globe. It is predicted that approximately 40%
                                           of vehicle travel could be autonomous in the 2040s and traveling by AV may become the predom-
                                           inant transport mode in the future. It is widely believed that due to the increased mobility and
                                               * Corresponding   author. E-mail address: mengli@tsinghua.edu.cn.

                                                                                                      1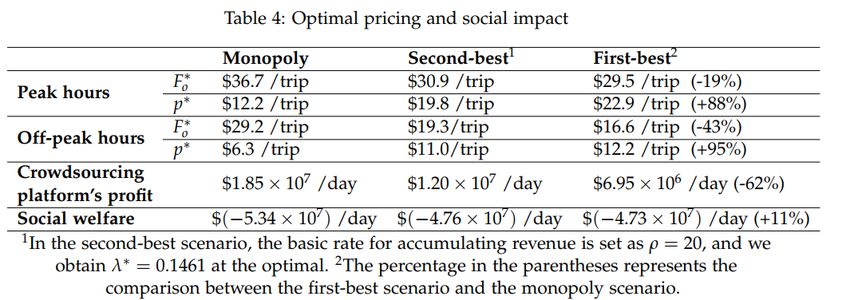
safety, reduced congestion, emissions and travel costs, AVs have the potential to reshape future
human transport.
     High-tech AVs can perform tasks that cannot be performed by manually driven vehicles
(MVs). One of the most distinct differences between AVs and MVs is that AVs owned by a
person can be used for other tasks when not used by the owner such as traveling to other places
without drivers to complete certain tasks. One potential use is to serve other riders (Figure 1 for
illustration). This would provide opportunities for people who do not own AVs to utilize the
service.

                    Figure 1: One day’s task chain of an autonomous vehicle

     When a large number of AV owners are able to share their AVs to provide ride services
to others, a platform is required to aggregate the information of those AVs with that of the
customer demands, and act as a bridge connecting the AV owners with the customers. Similar
to the current TNCs such as Uber and Lyft, the platform identifies the dynamically-updated
supply from AV owners, and then matches the available AVs with the customers generated
within the region in a real-time fashion. The platform needs to pay these AV owners a certain
amount of money to encourage them to share their AVs, and meanwhile the platform charges
the customers a certain fee for their trips; the difference between the platform gain from travelers
and the platform payment to AV owners is the revenue that should be equal to a considerable
amount so that people have the incentive to establish and operate such a service.
      The aforementioned new type of mobility market with AV renting options is called ”the AV
crowdsourcing market” in this study. The concept of crowdsourcing, first introduced by Brab-
ham in 2008 and later perfected by other researchers using case studies, refers to the act of a
company handing over a part of its tasks, particularly needs-based problems, such as hatching
ideas, designing algorithms and public supervision to the public crowd who have the poten-
tial to finish the job better than employees. Developed communication technologies enable such
business model to be realized, through which a wide range of the public including but not lim-
ited to social experts are attracted and involved to produce a better outcome for the companies.
For the AV crowdsourcing market, our primary interest is to answer two key questions: 1) can
AV crowdsourcing benefit society? and 2) can the operating agency gain from operating the
crowdsourcing platform? The first question relates to the utilitarian objective of such business
model that tells social managers whether they should allow or regulate the market, and the sec-
ond question is related to the spontaneity problem whether people have the incentive to run
such a business. To answer these questions, we establish an aggregate equilibrium modeling
framework in this study. The model considers three market subjects: travelers, AV owners and
the crowdsourcing platform, where AV owners and travelers may have some coincidence within
a time period. The platform determines the payment to the AV owners and the charge to the
travelers, and the travelers and AV owners determine their mode choices and rental choices. Un-

                                                 2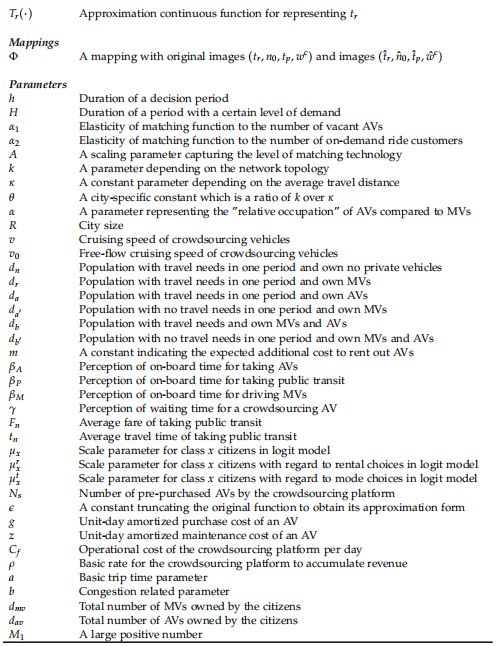
der a user’s utility-maximization framework, we can capture the equilibrated state of the whole
system. Then, based on the equilibrium state, the platform can adjust the payment and pricing
strategies to achieve different goals, including profit maximization, social welfare maximization
(first-best), and constrained social welfare maximization (second-best). Numerical experiments
and sensitivity analyses are conducted to draw a variety of insights on the AV crowdsourcing
market.
     The rest of this paper is organized as follows. Section 2 reviews related literature on AVs,
ride-providing services and crowdsourcing. In Section 3, we develop the static equilibrium model
for the AV crowdsourcing market, and investigate some properties of the model. Section 4
formulates the platform’s decision framework across different market scenarios with various
transport modes, and then propose a gradient-based algorithm to solve the problem. In Section
5, we use numerical examples to illustrate key points and insights of our model, and then present
some discussions. Finally, Section 6 concludes the paper.

2   Related literature

The body of literature on AVs has been continuously growing in recent years. Control of fully
AVs may be the best investigated topic (Wu et al., 2020), including route planning (Wang et al.,
2019; Bang and Ahn, 2018), longitudinal control, i.e. Cooperative Adaptive Cruise Control (Wang
et al., 2014; Gong and Du, 2018), and lateral control of autonomous vehicles (Luo et al., 2016; Yang
et al., 2018). As a sophisticated scenario in transportation field, control of an isolated intersection
has been studied with ”signal-free” schemes (Lee and Park, 2012; Xu et al., 2018) and ”signalized”
schemes (Li et al., 2014; Yu et al., 2018) where the aim is to increase intersection capacity and
reduce delay on the basis of driving safety. Recently, Chen et al. (2020) proposed a rhythmic
control scheme where CAVs pass through an intersection with a preset rhythm, and Lin et al.
(2021), further expended the rhythmic control to a grid network. Meanwhile, studies found that
AVs with communication technologies that can smooth oscillations and reduce crash probability,
will greatly improve the capacity of a highway (Michael et al., 1998; Tientrakool et al., 2011; Bian
et al., 2019) and reduce road congestion (Fagnant and Kockelman, 2015; Sun et al., 2020). AVs
are highly advantageous for providing high-level transport experience so that they will change
or even reshape future travel modes. One change will revolutionize the taxi industry. Literature
on AV on-demand ride service mainly focuses on its operation. For example, Vosooghi et al.
(2019), considering multi-modal dynamic demand, investigated SAV operations including the
fleet size, vehicle capacities, ridesharing and rebalancing strategies through simulations. Tang
et al. (2020) proposed an advisor-student reinforcement learning framework to organize the
autonomous electric taxi fleet in an online manner.
     Although there is scarcely any literature on AV on-demand ride service, a wide range of
studies on the traditional taxi market and on-demand ride service market have been performed
that provide great inspiration for our study. Yang and Wong (1998) used a network model to
establish the equilibrium of the cruising taxi market and offered some policy-relevant results in-
cluding average taxi utilization and average customer waiting time for decision making. Daganzo
and Ouyang (2019) presented a general analytic framework to model transit systems that provide
door-to-door service, including non-shared taxi and shared taxi service. Studies pointed out that
both the traditional taxi market and on-demand ride market has similar economic rules. Arnott
(1996) performed an economic analysis of the dispatch taxi market and found that the first-best
taxi pricing entails operation at a loss under economies of density. Zha et al. (2016) using an

                                                  3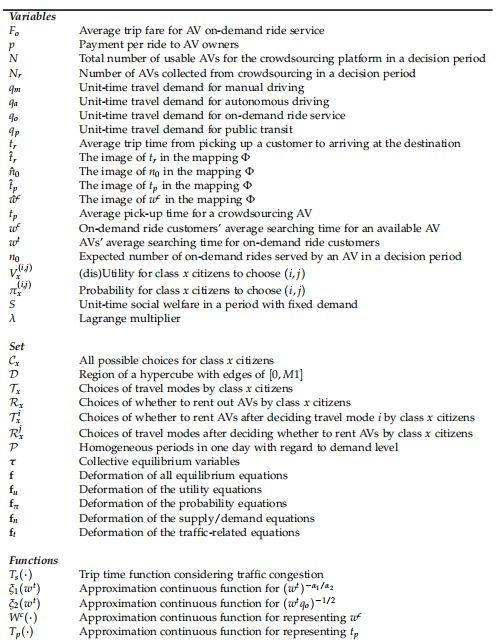
aggregate model of the on-demand ride market, pointed out that under economies of scale, the
company will suffer a deficit in the first-best scenario. Vignon and Yin (2020) considered the
dual modes of ride-sourcing and ride-sharing and also pointed out that when congestion is low,
the service provider must be subsidized to achieve the first-best scenario. Vignon and Yin (2020)
developed several concrete approaches to achieve the second-best scenario, including regulation
of prices, vehicles’ vacant duration and the number of drivers. In this paper, we will show that in
some circumstances, the AV crowdsourcing platform can be profitable in the first-best scenario.
Other influential works on the regulation of the MV on-demand ride market include Yu et al.
(2017) that analyzed the regulation of a market with both traditional taxis and on-demand ride
service, and further proved that on-demand ride service is competitive with the traditional taxi
service. He et al. (2018) modeled the effects of the customers’ reservation cancellation behaviors
on the network and designed the pricing and penalty strategy. Wang and Yang (2019) have made
a comprehensive review of the literature on on-demand ride services. However, none of the
above works considered the future transport modes in which AVs can drive autonomously and
can serve customers on their own (Zmud et al., 2018; Stocker and Shaheen, 2018; Narayanan et
al., 2020). The potential AV crowdsourcing market enabled by the driverless feature of AVs has
been seldom investigated in the existing literature.
     Crowdsourcing has boomed in various industries in recent years (Brabham, 2008). It can
be applied to collect ideas to improve products or services (Bayus, 2010; Poetz and Schreier,
2012; Bayus, 2013), city inspection (Kang et al., 2013; Glaeser et al., 2016) and other applications.
Platforms such as Threadless and IStockPhoto collect and share designer’s talents around the
world; Kaggle and TunedIT gather studies and solutions to difficult problems; other companies
such as PeoplePerHour, Crowdspirit, Editzen and MusikPitch are examples of crowdsourcing
(Zhao and Zhu, 2014). A business model in the hotel industry similar to AV crowdsourcing
is shared lodging where one of the typical companies is Airbnb (Zervas et al., 2017). The AV
crowdsourcing that we propose in this paper has been referred to in Stocker and Shaheen (2018)
and described as hybrid AV ownership with the same entity operating. Stocker and Shaheen
(2018) preliminary listed potential shared autonomous vehicle business models but did not make
a detailed analysis of them; to bridge this gap, such models are investigated in the present paper.

3   Equilibrium Model

This section introduces the equilibrium model of the AV crowdsourcing market. We consider a
time period with duration h (e.g., 2 hours) for which the market conditions are time invariant,
and therefore we can treat it as a stationary state. In this hypothetical market, there exists a
crowdsourcing platform; the AV owners have the option to rent their AVs to this crowdsourcing
platform, and the crowdsourcing platform collects these AVs to provide on-demand ride services
for other riders. In addition to the collected AVs, the crowdsourcing platform can also buy some
AVs from external markets to provide the services. On the other hand, travelers can choose to
use the on-demand ride services, to drive private (manual or autonomous) vehicles or to take
public transit to fulfill their travel needs (the average trip distances of taking different modes are
identical); meanwhile, AV owners can choose to rent their cars to this crowdsourcing platform.
Traffic congestion induced by these trips is considered in the framework. A schematic illustration
is provided in Figure 2.
      In the following, we will introduce the details of the equilibrium model establishment. We
first describe the equilibrium state of the on-demand ride service; and then, we model the travel-

                                                  4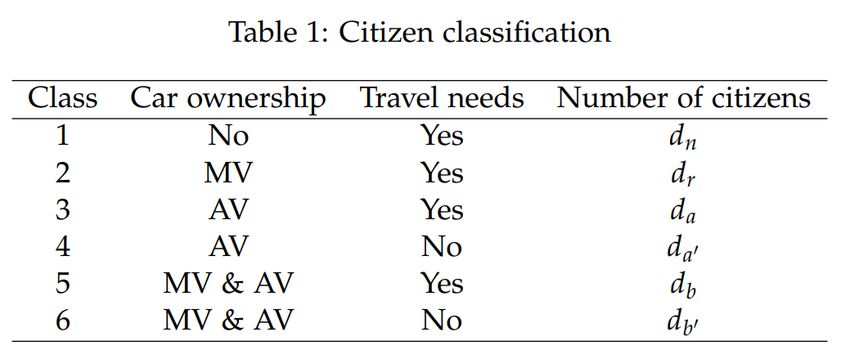
Figure 2: Conceptual design of an AV crowdsourcing market

ers’ mode choices as well as the AV owners’ rental choices based on the utilities associated with
these selections; and finally, we describe the equilibration of supply and demand in a steady-state
mobility market with AV renting options.

3.1   Ride services and traffic congestion

We separate one-day time into several periods and use piece-wise fixed level of demand to ap-
proximate the time-variant demand. In this section, we focus on a single period where the
platform set prices to equilibrate the supply and demand of on-demand rides. On-demand ride
services are composed of matching, pick-up and on-travel processes. The matching is assumed
to be a bilateral process where both the available AVs and the customers actively search for each
other. Since this process does not display distinctive differences from the existing on-demand
ride services, we can adopt Zha’s formula to describe the relation between the customers’ aver-
age searching time wc and the AVs’ average searching time wt . Derived from the Cobb-Douglas
matching function, the customers’ average searching time function at the equilibrium can be
formulated as follows:

             (1−α1 −α2 )/α2                       −α1 /α2
      wc = qo                      A−1/α2 (wt )                                                    (1)

     Upon being matched, the AV drives itself to the customized location to pick up the cus-
tomer. We assume that the matching algorithm assigns to every request one of the closest (wt qo )
                                                                                           −1/2 √
available vehicles. Given the size of the city R, the average pick-up time t p ≈ k(wt qo )        R/v,
where k is a parameter depending on the network topology and k ≈ 0.63 for networks that re-
semble rectangular grids and v is the cruising speed.
                                                   √
                                                          The average trip time from picking up a
                                                     R
customer to arriving at the destination is tr = κ v , where κ is a constant reflecting the average
travel distance. Then, we obtain the following equation between the average pick-up time t p and
the average trip time from picking up a customer to the arrival at the destination tr :

                      − 21
      t p = θ wt qo           tr                                                                   (2)

where θ = k/κ is a city-specific constant.

                                                            5
Next, we discuss the modeling of traffic congestion. Since we have constructed the relation
between the average pick-up time t p and the average trip time tr , in the following we focus on
the effect of traffic congestion on the average trip time tr . The functional form is given by the
following equation:
h 1
i
tr = Ts qm + α (q a − qo ) + αqo (1 + θ (wt qo )− 2 ); R, v0 (3)
In the above equation, Ts (·) is a continuously differentiable, monotonically increasing and
convex function; qm , q a , qo are unit-time travel demands for manual driving, autonomous driv-
ing (including both private vehicles and crowdsourcing vehicles) and on-demand ride service,
respectively; α ∈ (0, 1) is a parameter representing the ”relative occupation” of AVs compared
to MVs (because the AV technology can reduce the vehicle headway in traffic flows). The equa-
tion states that the average trip time tr is a function related to city size R and free-flow cruis-
ing speed v0 , and it is a monotonically increasing and convex function with regards to the term
1
qm + α(q a − qo ) + αqo (1 + θ (wt qo )− 2 ). In this term, qm represents the MVs’ contribution to conges-
1
tion, α(q a − qo ) represents privately-used AVs’ contribution to congestion, and αqo (1 + θ (wt qo )− 2 )
represents the crowdsourcing AVs’ contribution to traffic congestion; the latter has a factor of
1 1
(1 + θ (wt qo )− 2 ) because it includes both the pick-up trips and delivery trips, where θ (wt qo )− 2 is
associated with Eq. (2). The functional form of Ts (·) can be obtained from realistic data.
Despite their analytical formulation, there are some mathematical difficulties associated with
1
Eqs. (1)-(3). The main difficulties lie in the terms (wt )−α1 /α2 in Eq. (1) and (wt qo )− 2 in Eqs. (2)
and (3), where there are negative powers associated with these variables; this gives rise to dis-
continuity and possibly results in imaginary numbers in the process of solving the equilibrium.
To address this issue, we introduce some continuous counterparts to replace the above discon-
tinuous functions. The idea is as follows (taking (wt )−α1 /α2 as example). We first choose a very
small positive number e. Then, when wt ≥ e, the counterpart takes exactly the same form as
(wt )−α1 /α2 ; and when wt < e, the counterpart is a linear function such that the whole function is
1
continuous and smooth at e. The same approximation is used for (wt qo )− 2 . This approximation
is reasonable because wt and wt qo only have physical meaning when they are positive, and a suf-
ficiently small e can ensure that the approximations are almost the same as the original values on
the positive horizon. In the following, we denote the two approximations as ξ 1 (wt ) and ξ 2 (wt qo ).
The graphical illustration of the approximation is shown in Figure 3.
With the above-mentioned function approximation scheme, we can express the approxi-
mated counterparts of Eqs. (1)-(3) as described below. These expressions will be used in the
model analysis and algorithmic development.
wc = W c (qo , wt ; A, α1 , α2 ) (4)
t p = Tp (wt , qo , tr ; θ ) (5)
t
tr = Tr (qm , q a , qo , w ; R, v0 , θ ) (6)
3.2 Choice modeling
AV owners have the incentive to rent their cars to the crowdsourcing platform only if this
action can earn profit. Suppose that the rental depends on the serving rates, i.e., for a period
6Figure 3: Illustration of function approximation
with duration h, the rental revenue for the AV owners is given by ( pn0 ), where p is the payment
per ride and n0 is the expected number of on-demand rides served by an AV in this period.
The rental revenue can be viewed as the ”commission fee” for the vehicle providers. Then, the
utility of a citizen renting his/her private AV to the crowdsourcing platform for each period with
duration h is given by ( pn0 − m), where m is a constant indicating the expected additional cost
of sharing the private vehicle for public use, including energy consumption, vehicle depreciation
and psychological costs. The AV owners who choose not to rent their cars will receive zero rental
utility.
Next, we discuss the mode choices for citizens with travel needs in this period. The travel
(dis)utility includes time costs and monetary costs. We respectively specify the perception of
on-board time for AVs, public transit and MVs as β A , β P and β M , and the relation among them
is β A < β P < β M ; this is because driving a car costs the most human effort, and taking public
transit should be generally less comfortable than taking an AV. The perception of waiting for
a crowdsourcing AV is specified as γ (The waiting time is composed of matching and pick-up
time). On the other hand, it is assumed that the average travel time tn and fare Fn of taking
public transit are constant, i.e., unaffected by traffic congestion (e.g., BRT vehicles or subway).
Given the average fare Fo for each trip on a crowdsourcing AV, the utility of taking on-demand
7ride service can be stated as (− Fo − β A tr − γ(wc + t p )). The utilities of other transport modes
can be similarly expressed. The utilities for all choices are shown in Table 2, and the (dis)utility
(i,j)
Vx can be calculated by adding up the rental utility and travel utility in each choice (i, j) for
the citizens of class x.
In the AV crowdsourcing market, we assume that sensitivity to travel utility and rental utility
for one class of people are identical; and the random variables are identically distributed with a
Gumbel density function. Then, the probability for the choice (i, j) by people of class x can be
captured by the following logit model:
(i,j)
(i,j) eµx Vx
πx = (i,j)
∀(i, j) ∈ C x , x ∈ {1, 2, . . . , 6} (7)
∑(i,j)∈Cx eµx Vx
where µ x is a nonnegative parameter representing the degree of uncertainty for the choices from
8the perspective of people of class x. A larger parameter µ x means that people have more knowl-
edge about the AV crowdsourcing market and thus can be more certain about their utilities, i.e.,
(i,j)
an increasing number of class x citizens would give up the choice (i, j) when Vx decreases by
a unit. In modeling customer choices, however, it is currently unknown that whether the sensi-
tivity coefficients associated with travel and rental choices are similar. If they are not identical,
we need a nested logit model to capture the choice probabilities. The detailed discussions of the
nested logit models are presented in Appendix B.
3.3 Supply and demand
This section establishes the equilibration between supply and demand. For crowdsourcing AVs,
the supply equation can be written as:
N = Ns + Nr (8)
where N is the total number of usable AVs for the crowdsourcing platform in this period; Ns is
the number of pre-purchased AVs by the crowdsourcing platform; and Nr is the number of AVs
collected from crowdsourcing in this period. The number of AVs crowdsourced from the society
can be expressed by the following equation:
−,R
Nr = d a π aP,R + πO,R
a + d 0
a aπ 0 + d b π P,R
b + π M,R
b + π O,R
b + db0 πb−0 ,R (9)
where the first to last terms of the RHS represent the number of AVs from citizens belonging to
classes 3-6, respectively.
Similarly, on the demand side, the equilibration can be expressed as:
qo h = dn πnO,− + dr πrO,− + d a πO,N
a + π O,R
a + d b π O,N
b + π O,R
b (10)
q a h = qo h + d a π aA,N + db πbA,N (11)
qm h = dr πrM,− + db πbM,N + πbM,R (12)
P,− P,− P,N P,R P,N P,R
q p h = d n π n + dr πr + d a π a + π a + db πb + πb (13)
In Eq. (10), the LHS is the total number of customers using the on-demand ride services in
this period, and the RHS is the sum of the travelers choosing the associated mode. Eqs. (11)-(13)
express similar equilibria for the AV riders (including privately used ones and crowdsourcing
ones), for manually driving, and for taking public transit, respectively.
According to the stability requirement, the number of trips of the on-demand rides should
be equal to the total number of crowdsourcing AV riders during a period with duration h:
Nn0 = qo h (14)
9where N is the total number of crowdsourcing AVs and n0 is the expected number of the on-
demand rides served by an AV in this period.
Lastly, the sum of searching time, pick-up time and on-board time for all AVs put into use
should be equal to their total service time. Therefore, the service time constraint in view of unit
time is modeled as follows:
N = q o · w t + t p + tr
(15)
where qo is the number of crowdsourcing trips and wt + t p + tr is the service time for a single
trip by a crowdsourcing AV.
Aggregating Eqs. (4)-(15) yields the equilibrium model of the AV crowdsourcing market.
The following subsection will specify some basic properties of the model.
3.4 Existence of equilibrium solution
For the platform, on the demand side, the trip fare of on-demand ride service Fo is treated as
the decision variable; on the supply side, the commission fee per ride p is treated as the decision
variable. When fixing these two decision variables, the utility equations along with Eqs. (4)-(15)
together constitute a system of nonlinear equations that can be used to obtain the equilibrium
state of the AV crowdsourcing market, i.e., the intermediate variables including choice splits of
different travel modes, on-demand ride service rate and total travel costs.
We examine the existence of the equilibrium solution in this subsection. The statement is
presented as follows.
Proposition 1. The system of nonlinear equations (4)-(15) has at least one solution when fixing Fo and p.
Proof. We apply the fixed point theorem to prove the existence. The proof is based on Schauder’s
fixed-point theorem: let C be a closed convex subset of the Banach space and suppose f : C 7→ C
and f are compact (i.e., bounded sets in C are mapped into relatively compact sets), and then f
has a fixed point in C .
Let the constant parameters dmv and d av respectively denote the total number of MVs and
AVs owned by the citizens. We focus on four variables (tr , n0 , t p , wc ), and the system (4)-(15) can
be treated as a mapping Φ such that (t̂r , n̂0 , t̂ p , ŵc ) = Φ(tr , n0 , t p , wc ), and the equilibrium requires
(t̂r , n̂0 , t̂ p , ŵc ) = (tr , n0 , t p , wc ). The mapping works as follows: it first computes all choice splits
with the logit model Eq. (7), and obtain n̂0 by Eq. (14), obtain wt by Eq. (15); and then with wt
we obtain t̂r , t̂ p and ŵc by Eqs. (4)-(6). Clearly, the mapping Φ is continuous. To proceed, we first
prove the following result.
Claim: when max(tr , t p ) → +∞, t̂r , t̂ p are upper bounded by constants.
To prove this claim, we note a simple fact that when tr or t p approaches infinity, qo will
approach zero with an exponential rate due to the presence of constant-utility public transit, so
that qo (tr + t p ) will also approach zero. Therefore, by Eq. (15), qo wt ≈ N. Meanwhile, N is
lower bounded by a positive constant due to the presence of citizens with types 4 and 6 and the
fact that n0 ≥ 0. Thus, qo wt is lower bounded by a constant. Meanwhile, qm and q a are upper
bounded by dmv and d av , respectively. Combining the above facts, based on Eqs. (5) and (6), we
know that t̂r , t̂ p are upper bounded by constants. The claim is proved.
10On the other hand, n̂0 is always upper bounded by a constant because N is lower bounded
by a positive constant, and with Eq. (14), we can easily identify the bounded nature of n̂0 .
Now, we define the ranges of tr , t p and n0 to be within [0, M1 ], where M1 is a large positive
number. We show that ŵc is upper bounded by a constant; with Eq. (4), this is equivalent to
showing that wt is lower bounded by a constant. By Eq. (15), we obtain:
N
wt = − t p − tr ≥ −t p − tr ≥ −2M1
qo
and with which the upper boundedness of ŵc is confirmed.
Finally, we define the feasible ranges of tr , t p , wc and n0 to be all within [0, M1 ], and this
region is denoted as D . When M1 is sufficiently large, by the above reasoning we know that ŵc
and n̂0 are upper bounded by constants smaller than M1 , and based on the claim stated above
as well as the continuity of Φ, we know that t̂r , t̂ p are also upper bounded by constants smaller
than M1 . Therefore, Φ(tr , n0 , t p , wc ) ∈ D , and by Schauder’s fixed-point theorem the existence is
guaranteed. The proof is completed.
4 Scenario Analysis
Using the equilibrium model proposed in the previous section, we can then proceed to analyze
several scenarios with different objectives for decisions regarding the platform payment p and the
platform charge Fo . The scenarios of interest include a monopoly scenario, a first-best scenario
and a second-best scenario. The first intends to maximize the crowdsourcing platform’s profit;
the second intends to maximize social welfare; and the third intends to maximize social welfare
under the constraints that the crowdsourcing platform’s profit is guaranteed to be no less than
a preset threshold. For practical consideration, in this section we assume that the time-of-day
can be divided into several heterogeneous periods according to the levels of demands. In the
following, we use P to denote the set of all homogeneous periods, and Hk represents the duration
of the kth period, ∀k ∈ P . Below, we first present the optimization models in the above-mentioned
three scenarios, and then develop the algorithms for solving these models.
In this section, we use a tuple τ to collectively denote all of the equilibrium variables defined
in the last section; these are treated as intermediate variables in the established optimization
models.
4.1 Monopoly scenario
In the monopoly scenario, the crowdsourcing platform decides some key variables to maximize
its daily profit. The decision variables include the period-specific average fare for the on-demand
ride service Fo,k and the period-specific payment to AV owners per customer pk . The total number
of purchased AVs, i.e., Ns , is a parameter that is not considered as a decision variable. Let
qo,k denote the period-specific unit-time customer demand for the on-demand ride service; Nr,k
denote the period-specific number of rented AVs; and n0,k denote the period-specific number of
customers served by a crowdsourcing AV per period of duration h. The optimization model for
the profit maximization problem is then stated as:
11( )
Hk
max
Fo ,p,τ
∑ h
( Fo,k qo,k h − Nr,k pk n0,k ) − Ns ( g + z) − C f (16)
k ∈P
s.t. (4) − (15) ∀k ∈ P
Fo,k , pk ≥ 0 ∀k ∈ P (17)
where g and z are the unit-day amortized purchase cost and maintenance cost of an AV respec-
tively; and C f represents the basic operational cost of the crowdsourcing platform per day.
In the objective function (16), Hk Fo,k qo,k represents the revenue of the platform in the kth
period, and Hhk Nr,k pk n0,k is the total payment to the AV owners in the kth period. Eq. (17) states
that the fares and payments should be nonnegative. It should be noted that the constraints (4)-
(15) are period-specific; i.e., for each period k, there is a corresponding constraint set stating the
equilibration of the AV crowdsourcing market.
4.2 First-best scenario
Now we consider the case that a government agency is operating the crowdsourcing platform,
and its goal is to maximize social welfare. This scenario is called the first-best scenario. By
deciding the period-specific fare Fo,k and payment pk , the optimization model for the operating
agency can be written as:
Hk
max
F ,p,τ
o
∑ h k
S (18)
k ∈P
s.t. (4) − (15), (17) ∀k ∈ P
where Sk represents the unit-time social welfare in the kth period, and the length of such time
duration is h. The constraints are the same as in the monopoly scenario. The social welfare is
composed of the total time cost by various transport modes and an additional cost of sharing
private AVs with other people; its detailed form is given by:
1 (i,j) H
Sk = ∑ µx dx,k ln ∑ eµx Vx,k + hk ( Fo,k qo,k h − Nr,k pk n0,k ) k∈P (19)
x ∈{1,2,...,6} (i,j)∈C x
(i,j)
1 µ x Vx,k
In Eq. (19), µ x d x,k (ln ∑(i,j)∈C x e ) is the total utility of class x citizens, where µ x is the corre-
(i,j)
sponding scale parameter; d x,k is the period-specific population of class x citizens; and Vx,k is the
period-specific (dis)utility of choice (i, j) by class x citizens. The social welfare should exclude
monetary utility, and therefore we compensate by adding Hhk ( Fo,k qo,k h − Nr,k pk n0,k ) in calculating
the welfare terms.
4.3 Second-best scenario
From the platform’s perspective, the on-demand ride service can produce a deficit under the
first-best case, and a similar phenomenon is identified in the traditional taxi and ride-sourcing
12markets. Specifically, in the early stage of AV adoption, it is likely that only a few citizens own
AVs, and there will be a shortage of AVs that can be rented. In this case, if the crowdsourc-
ing platform lacks start-up fund to purchase AVs, the on-demand ride service provided by the
crowdsourcing AVs will be of little attraction since it requires excessively long pick-up distances,
cutting down the platform’s profit. To guarantee a certain level of profitability for the service
provider, in this subsection we propose a second-best operational strategy that maximizes social
welfare under the constraint of a lower bound on the platform profit. The model formulation is
illustrated as follows:
Hk
max
F ,p,τ
o
∑ h k
S (20)
k ∈P
s.t. (4) − (15), (17) ∀k ∈ P
H
∑ hk ( Fo,k qo,k h − Nr,k pk n0,k ) ≥ ρ Ns ( g + z) + C f
∀k ∈ P (21)
k∈P
where ρ ≥ 0 represents the basic rate for revenue accumulation. The second-best formulation
shows some differences with the previous two models in that it contains an additional nonlinear
constraint with inequalities, i.e., Eq. (21). The next subsection will show how to deal with this
constraint.
4.4 Solution algorithms
The optimization models presented above are all nonlinear programs with complicated nonlinear
constraints. To efficiently solve these models, we treat them as bi-level forms containing an
equilibrium problem in the lower level, and then incorporate them into a gradient projection
algorithmic framework. In detail, we first obtain the equilibrium given the fare Fo,k and payment
pk ; and then we calculate the gradient of the objective functions to Fo,k and pk in the current
equilibrium state, according to which we update the decision variables and project them to the
feasible domain when they are to cross the boundary. Thus, the process is carried out iteratively
until the termination criterion is met (Figure 4).
We use the implicit function theorem to compute the gradient of equilibrium state ∇f with
regard to Fo,k and payment pk . Applying the chain rule, we have:
∂τ ∂τ ∂f ∂f ∂f
J( , ) = −JT( , ) · J −1 ( ) (22)
∂Fo ∂p ∂Fo ∂p ∂τ
Here, fu are the choice utility functions; fπ are the choice probability functions for which
the original forms are given by Eq. (7); fn are the supply/demand functions for which the
original forms are given by Eqs. (8)-(15); and ft are the traffic-related functions for which the
original
forms are given by Eqs. (4)-(6). Then, the equilibrium can be compactly expressed as
fu
fπ
f= fn = 0.
ft
13Figure 4: Solution algorithms
∂f ∂f
The Jacobian matrix J ( ∂F , ) can be obtained as follows. With the exception of fu that is
o ∂p
linearly related with Fo and p, all other functions in f have zero partial derivatives with regard to
∂f
Fo and p. To obtain the Jacobian matrix J ( ∂τ ), we observe that fu and fn are linearly related with
τ. For probability functions, fπ , we have
(i,j) (m,n)
(m,n)
∑ eµx Vx − eµx Vx
∂ f π,x (m,n) (i,j)∈H x
(m,n)
= µ x eµx Vx 2 (23)
∂Vx (i,j)
∑ e µ x Vx
(i,j)∈H x
(m,n) (w,z)
∂ f π,x (m,n)
µ x Vx eµx Vx
(w,z)
= −µ x e 2 (24)
∂Vx (i,j)
∑ eµx Vx
(i,j)∈H x
where (w, z) ∈ C x , (m, n) ∈ C x and (w, z) 6= (m, n). The traffic-related functions ft are piece-wise
functions consisting of a linear function and a power function. ∂f ∂τ can be obtained using the
t
derivative rule for complex functions.
In the second-best scenario, there exists a nonlinear constraint Eq. (21) that can make the
gradient projection method proposed above ineffective. To handle this issue, we introduce a
Lagrange multiplier λ to transfer the constraint into a term in the objective function. Specifically,
the altered objective function can be written as:
(" # )
Hk Hk
∑ ∑
max S +λ ( F q h − Nr,k pk n0,k ) − ρ Ns ( g + z) + C f (25)
Fo ,p,τ
k ∈P
h k k ∈P
h o,k o,k
14Since the Lagrange multiplier λ is unknown prior to solving the problem, in the solution
process we must adjust its value accordingly in order to obtain a maximum objective function
value while ensuring the feasibility of the constraint. In most cases, the optimal solution is
identified at the points where ∑k∈P Hhk ( Fo,k qo,k h − Nr,k pk n0,k ) = ρ Ns ( g + z) + C f .
5 Numerical Examples
We report the equilibrium results under different scenarios in this section.
5.1 Test settings
We consider a city with the area of approximately 400 km2 . The population density of this city
is 5, 000 persons per square kilometer, and 30% of the residents of the city own MVs or AVs. We
set the AV ownership as approximately 3%; i.e., the number of AVs owned by citizens is equal
to 3% of the population. The time of a day can be divided into two periods according to travel
demand: peak and off-peak hours that last 4 h and 20 h, respectively. In the peak-hours, the trip
generation per hour equals 15% of total population; in the off-peak hours, the trip generation
per hour equals 5% of total population. The model input data for the population of six types of
citizens are shown in Table 3.
AV technological maturity index α is set to 0.7. The matching function of the AV crowdsourc-
ing is captured by A = 1.5 and α1 = α2 = 0.7. The decision period is 1 hour. An AV purchased by
the crowdsourcing platform costs $100, 000 with 10 years’ service life and its maintenance fee is
$5, 000 per year. The pre-purchased number of AVs by the crowdsourcing platform is Ns = 0; i.e.,
all supplied AVs are crowdsourced from the AV owners. The cost incurred by the crowdsourcing
platform is set to $6 × 10⁵ per day. The additional cost of AV owners is set as m = $20. Public
transit is captured by the average travel time tn = 1 h and the average fare Fn = $6. For simplic-
ity, we consider µ x = µ for all classes of citizens. Traveler’s VOTs are β A = $20/h, β P = $30/h,
β M = $40/h,γ = $30/h.
Setting κ = 1, the average trip time with free-flow speed by private vehicle is 30 min. Without
loss of generality, the trip time function considering congestion Ts (·) is set as a quadratic function,
i.e., Ts (·) = a + b[qm + α(q a − qo ) + αqo (1 + θ (wt qo )−1/2 )]2 , and the approximation takes similar
form. The basic trip time term is a = 0.5 h, and the congestion related parameter is b = 2.67 ×
10−12 h, indicating that traffic congestion can lead to a delay of at most 1 h.
5.2 Results
The first-best scenario reduces people’s travel cost and increases the AV owners’ revenue sig-
nificantly (Table 4) illustrating that the first-best scenario encourages AV owners to share the
15private AVs with others and encourages citizens to travel by on-demand ride service. Payment
in the first-best scenario is high: considering an AV owner renting out their private AV in off-
peak hours every day, it requires approximately 1.12 years for the owner to recoup the purchase
cost of the vehicle. This suggests that AV crowdsourcing may be a worthwhile investment for
some citizens; in turn, this will promote AV acceptance by the public. Different from the cur-
rent manual driving on-demand ride providers, we find the AV crowdsourcing platform can still
greatly benefit from the first-best scenarios (Table 4). However, the results show that the crowd-
sourcing platform must cut approximately 62% of its profits to achieve the first-best scenario.
To balance the crowdsourcing platform’s profits and the overall social welfare, we explore the
second-best scenario and find a trade-off pricing strategy in which the social welfare is close to
that of the first-best scenario while the crowdsourcing platform only loses approximately 35%
of its monopoly profits. By applying this second-best pricing strategy, it is easier to obtain the
agreement of the crowdsourcing platform to achieve a relatively high social welfare. We note that
µ = 0.1 is set in the tests.
To examine the mode split in the equilibrium, one notable finding is that in the first-best sce-
nario, the number of AV crowdsourcing services is increased by roughly 90% during peak hours
and by 70% in the off-peak hours compared with the monopoly scenario (Figure 5) as a result
of higher payment and lower fare. This illustrates that AV crowdsourcing service has an overall
beneficial effect on the society, outweighing the congestion externality caused by deadheading.
Additionally, in the first-best scenario, roughly 87.8% and 76.0% of the AV owners in the peak
and off-peak hours who have no travel needs choose to rent AVs to the crowdsourcing platform,
respectively; roughly 57.2% and 42.3% of the AV owners in peak and off-peak hours who have
travel needs choose to rent AVs to the crowdsourcing platform, respectively. We find the payment
so attractive that most people choose to rent their AVs to the crowdsourcing platform rather than
drive them themselves. Other findings include that AV crowdsourcing plays a more important
role in the off-peak hours, i.e., serving up to 45% of the total trips for the first-best scenario; while
in other cases, public transit is the most utilized transport mode. It is important to note that in
the first-best scenario, people will shift to other modes from public transit due to its high time
cost.
16Figure 5: Trip number per day of different modes.
5.3 Sensitivity analysis
In this section, we examine the influence of a series of model parameters on the equilibrium
results, including people’s recognition of utility uncertainties (i.e., the scale parameter in the
logit model), population density, AV market penetration rate, AV technology maturity and the
additional cost for sharing one’s AVs with the society (i.e., m).
5.3.1 Scale parameter in the logit model
Without loss of generality, we assume that all classes of citizens are characterized by the
same degree of uncertainty with regard to choices, i.e., µ x = µ (∀ x ∈ {1, 2, ..., 6}). As shown
in Figures 6(a) and 6(b), when people are more sensitive to utilities, it will be harder for the
crowdsourcing platform to attract citizens, and thus the trip fare decreases, and the payment
increases. It is observed from Figures 6(c) and 6(d) that the crowdsourcing platform’s profit and
the social welfare decline overall. Trips by public transit decrease, implying that the shortcoming
of its high time cost is amplified with increasing µ, and trips by other three transport modes
increase (Figure 7). One noticeable deviation is that the payment during the peak hours for
the first-best scenarios decreases (Figure 6(b)), leading to slightly fewer crowdsourcing trips and
slightly greater platform profit. This indicates that more crowdsourcing trips during the peak
hours are discouraged with increasing µ, most likely due to the amplification of the congestion
externality. Another deviation is the minor increase of the platform profits for the monopoly
scenario for µ ≥ 0.3 (Figure 6(c)) due to an increasing number of crowdsourcing trips with a small
amount of price changes. In short, these experiments show that parameter µ has a great effect
on price setting and the equilibrium, and thus it is important for the crowdsourcing platform to
17(a) (b)
(c) (d)
Figure 6: Influence of people’s sensitivity to utilities.
investigate this parameter prior to setting the optimal prices in order to maximize its profits; µ
also influences the urban planner’s decision whether to regulate the AV crowdsourcing market,
because the first-best scenarios present a more limited improvement with a higher µ, i.e., 11.4%
for µ = 0.1 and only 1.5% for µ = 0.5; thus, regulation will have a limited effect when people are
highly sensitive to utilities. We assume µ = 0.5 in the following experiments, i.e., approximately
92.4% of people make a choice with $5 higher utility.
5.3.2 Population density of the city
Figures 8(a) and 8(b) show that the population density generally has little impact on prices
with exceptions for a few cases, namely the payment during peak-hours declines for the first-best
scenarios, and the fare during the off-peak hours increases quickly when the population density
grows beyond 5000 persons per km2 . This discourages people to rent AVs or take crowdsourcing
service and thus alleviate the congestion externality that grows with the population density. This
18(a) (b)
(c) (d)
Figure 7: Influence of people’s sensitivity to utilities on mode split.
implies that main impact of the population density on the equilibrium is the congestion exter-
nality. Figure 8(c) shows that the crowdsourcing platform’s profits increase, indicating that the
crowdsourcing platform must expect to be launched in more densely populated areas, such as a
metropolis. Figure 8(d) shows that individual welfare first increases slightly and then decreases,
most likely because a low population density induces insufficient number of crowdsourcing AVs,
increasing the individual travel cost. The highest individual welfare is obtained when the popu-
lation density is approximately 2500 persons per km2 .
5.3.3 AV market penetration rate
We denote the autonomous vehicle market penetration rate as the ratio of the population who
own AVs to the population who own AVs or MVs. A greater market penetration rate means
a larger pool for AV crowdsourcing. As shown in Figures 9(a) and 9(b), fare and payment
decline due to a more sufficient supply and the rate of decline decreases with growing AV market
19(a) (b)
(c) (d)
Figure 8: Influence of population density.
penetration rate. As observed from Figure 9(c), the crowdsourcing platform’s profits increase
with AV popularization, demonstrating the economy of scale. Figure 9(d) demonstrates that
social welfare increase significantly, suggesting that the urban planner should have a supportive
attitude toward AV popularization. Moreover, the wider gap in the social welfare between the
first-best and monopoly scenarios suggests that regulation will become increasingly beneficial
with increasing AV market penetration.
5.3.4 AV technology maturity
The maturity of AV technology (1 − α) represents the degree of improvement on road capacity,
where α represents the ”relative occupation” of AVs compared to MVs. As Figures 10(a) and
10(b) show, AV technology maturity’s impact on prices is ignorable except that the platform raises
payment in peak hours for the first-best scenarios to encourage more crowdsourcing trips, which
results from higher road capacity. Figure 10(c) shows the crowdsourcing platform’s profits are
20(a) (b)
(c) (d)
Figure 9: Influence of the autonomous vehicle market penetration rate.
improved in the monopoly scenario, but are deteriorated under regulation. Figure 10(d) points
out that the advances of AV technology help improve the social welfare. However, the maturity
of AV technology has limited impact on price setting and the equilibrium state.
5.3.5 Number of AVs pre-purchased by the crowdsourcing platform
As shown by Figures 11(a) and 11(b), the optimal fare and payment remain almost unchanged.
The results presented in Figure 11(c) indicate that the crowdsourcing platform should purchase
as many AVs as possible to obtain a higher daily profit. An examination of Figure 11(d) shows
that social welfare improves with greater number of purchased AVs. Nevertheless, the impact
of the number of vehicles pre-purchased is much smaller than the impact of the AV market
penetration rate on the equilibrium state.
21(a) (b)
(c) (d)
Figure 10: Influence of autonomous vehicle technology maturity.
5.3.6 Owners’ additional costs for sharing AVs
Figures 12(a) and 12(b) present the rise of fare and payment with increasing additional cost. The
crowdsourcing platform is more difficult to collect AVs and thus must provide greater compen-
sation to the AV owners. The decline of supply leads to a decreasing number of crowdsourcing
trips. One noticeable difference is that the payment during the peak hours for the first-best sce-
nario first decreases and then increases. In our model, travel time and additional cost are two
components of social welfare. When additional cost is low, the payment in peak hours decreases
to discourage crowdsourcing trips for less congestion; however, when additional cost continues to
grow, additional cost becomes more dominant for social welfare and thus, the payment increases
to compensate the AV owners. An examination of the results presented in Figure 12(c) shows
that although the monopoly profits decrease monotonically with additional cost m, profits in the
first-best scenario first increase and then decrease after m exceeds $30. The first half of the curve
suggests that under the first-best case, a higher m means a higher profit for the crowdsourcing
22(a) (b)
(c) (d)
Figure 11: Influence of the number of autonomous vehicle purchased.
platform. However, when m is quite high, the first-best scenario and the monopoly show little
difference in social welfare and platform’s profits. These tests suggest that it is important for the
crowdsourcing platform to investigate the AV owners’ additional cost prior to setting prices; it
may also be important for the urban planner to determine m when deciding whether to impose
regulations because a small m means that regulation has a more beneficial effect on the society,
as shown in Figure 12(d).
6 Conclusions
This paper investigates the AV crowdsourcing market that may emerge in the future. We first
proposed an equilibrium model with multiple transport modes: AV on-demand ride service,
private AV, private MV and public transit, and proved the existence of the equilibrium solution.
Then, several scenarios, namely, the monopoly scenario, the first-best case and the trade-off
23(a) (b)
(c) (d)
(e)
Figure 12: Influence of the additional cost to rent out private autonomous vehicles.
24second-best case were explored.
We use numerical examples to illustrate some insightful findings concerning the AV crowd-
sourcing market, including the comparison of optimal pricing for trip fare and payment during
the peak and off-peak hours, the crowdsourcing platform’s profits, the social welfare and trans-
port modes in each scenario. Sensitivity analysis of the optimal pricing and the equilibrium state
with regard to different parameters in the model are presented in a thorough manner. The main
findings from the numerical examples are summarized below.
1. AV crowdsourcing service is beneficial for the society overall. This provides guidance for
urban planners to have a supportive attitude toward AV development and popularization.
2. Renting out private AVs to the crowdsourcing platform provides high return, encouraging
people to rent their cars instead of driving them themselves. This verifies a new opportunity for
adventurous investors such as the wealthy to invest into AVs.
3. Regulation may be easier for the crowdsourcing platform to accept in some second-best sce-
nario where the social welfare is close to that of the first-best scenario. Regulation is particularly
necessary when people are not sensitive to utilities, or the AV owners are more inclined to rent
out their AVs to gain profits.
4. It is important for the crowdsourcing platform to know about the people’s sensitivity to
utilities and AV owners’ additional cost prior to setting prices, because these two factors signifi-
cantly affect the optimal pricing. Additionally, the crowdsourcing platform should expect to be
launched in areas with high population density and should purchase as many AVs in advance
as possible to obtain higher profits. Nevertheless, even without pre-purchased vehicles, the plat-
form is highly likely to gain profits under the premise that the market penetration rate of AVs is
sufficiently high (above 10%).
This paper could be further advanced by considering competition between MV and AV on-
demand ride service in the mobility market, as is closer to the reality before the society is fully
accustomed to AV technologies. Additionally, as shared autonomous vehicles will probably be
operated together with public transit, the joint planning and operation of two modes to form
an integrated mobility-as-a-service (MaaS) system should be explored in the future. In terms of
wider implications, our results suggest that with the presence of AV crowdsourcing business,
even when most AVs are owned privately, these AVs will be mostly used for serving other
customers in the society, which motivates the discussion of AV ownership in the future, including
where it will converge and how it will evolve. On the other hand, for these AV owners, AVs will
not be purchased merely for personal usage, but also for investment (buying vehicles to earn
money from day to day), and the capital value of AVs merits careful investigation.
Acknowledgements
The research is supported in part by Tsinghua-Daimler Joint Research Center for Sustainable
Transportation.
25References
Arnott, R. (1996). Taxi travel should be subsidized. Journal of Urban Economics,
40(3):316–333.
Bang, S. and Ahn, S. (2018). Control of connected and autonomous vehicles with cut-in
movement using spring mass damper system. Transportation Research Record: Journal of the
Transportation Research Board, 2672:036119811879692.
Bayus, B. (2010). Crowdsourcing and individual creativity over time: The detrimental effects
of past success. SSRN Electronic Journal.
Bayus, B. L. (2013). Crowdsourcing new product ideas over time: An analysis of the dell
ideastorm community. Manage. Sci., 59(1):226–244.
Ben-Akiva, M. E. and Lerman, S. R. (1985). Discrete Choice Analysis: Theory and Applica-
tion to Travel Demand.
Bian, Y., Zheng, Y., Ren, W., Li, S. E., Wang, J., and Li, K. (2019). Reducing time headway
for platooning of connected vehicles via v2v communication. Transportation Research Part C:
Emerging Technologies, 102:87 – 105.
Brabham, D. C. (2008). Crowdsourcing as a model for problem solving: An introduction and
cases. Convergence, 14(1):75–90.
Chen, X.-D., Li, M., Lin, X., Yin, Y., and He, F. (2020). Rhythmic control of automated traffic
– part i: Concept and properties at isolated intersections. arXiv: Optimization and Control.
Daganzo, C. F. and Ouyang, Y. (2019). A general model of demand-responsive transportation
services: From taxi to ridesharing to dial-a-ride. Transportation Research Part B: Methodological,
126:213–224.
Estelle´s-Arolas, E. and Gonza´lez-Ladro´n-De-Guevara, F. (2012). Towards an integrated
crowdsourcing definition. J. Inf. Sci., 38(2):189–200.
Fagnant, D. J. and Kockelman, K. (2015). Preparing a nation for autonomous vehicles: op-
portunities, barriers and policy recommendations. Transportation Research Part A: Policy and
Practice, 77:167 – 181.
Glaeser, E. L., Hillis, A., Kominers, S. D., and Luca, M. (2016). Crowdsourcing city gov-
ernment: Using tournaments to improve inspection accuracy. American Economic Review,
106(5):114–18.
Gong, S. and Du, L. (2018). Cooperative platoon control for a mixed traffic flow including
human drive vehicles and connected and autonomous vehicles. Transportation Research Part B:
Methodological, 116:25 – 61.
Gray, J. (2015). Implicit Functions, pages 259–269.
He, F., Wang, X., and Tang, X. (2018). Pricing and penalty/compensation strategies of a
taxi-hailing platform. Transportation Research Part C Emerging Technologies, 86:263–279.
Kang, J., Kuznetsova, P., Luca, M., and Yejin, C. (2013). Where not to eat? improving public
policy by predicting hygiene inspections using online reviews.
Lee, J. and Park, B. (2012). Development and evaluation of a cooperative vehicle intersection
control algorithm under the connected vehicles environment. IEEE Transactions on Intelligent
Transportation Systems, 13(1):81–90.
26Li, Z., Elefteriadou, L., and Ranka, S. (2014). Signal control optimization for automated vehi-
cles at isolated signalized intersections. Transportation Research Part C: Emerging Technologies,
49:1 – 18.
Lin, X., Li, M., Shen, Z., Yin, Y., and He, F. (2021). Rhythmic control of automated traffic –
part ii: Grid network rhythm and online routing. Transportation Science, forthcoming.
Litman, T. (2015). Autonomous vehicle implementation predictions: Implications for trans-
port planning.
Luo, Y., Xiang, Y., Cao, K., and Li, K. (2016). A dynamic automated lane change maneuver
based on vehicle-to-vehicle communication. Transportation Research Part C: Emerging Technolo-
gies, 62:87– 102.
Michael, J. B., Godbole, D. N., Lygeros, J., and Sengupta, R. (1998). Capacity analysis of
traffic flow over a single-lane automated highway system. Journal of Intelligent Transportation
System, 4(1-2):49–80.
Narayanan, S., Chaniotakis, E., and Antoniou, C. (2020). Shared autonomous vehicle ser-
vices: A comprehensive review. Transportation Research Part C: Emerging Technologies, 111:255
– 293.
Poetz, M. K. and Schreier, M. (2012). The value of crowdsourcing: Can users really compete
with professionals in generating new product ideas? Journal of Product Innovation Management,
29(2):245–256.
Schroeter, J. R. (1983). A model of taxi service under fare structure and fleet size regulation.
The Bell Journal of Economics, pages 81–96.
Stocker, A. and Shaheen, S. (2018). Shared automated mobility: Early exploration and po-
tential impacts. In Meyer, G. and Beiker, S., editors, Road Vehicle Automation 4, pages 125–139,
Cham. Springer International Publishing.
Sun, J., Zheng, Z., and Sun, J. (2020). The relationship between car following string instability
and traffic oscillations in finite-sized platoons and its use in easing congestion via connected and
automated vehicles with idm based controller. Transportation Research Part B: Methodological,
142:58 – 83.
Tang, X., Li, M., Lin, X., and He, F. (2020). Online operations of automated electric taxi
fleets: An advisor-student reinforcement learning framework. Transportation Research Part C:
Emerging Technologies, 121:102844.
Tientrakool, P., Ho, Y.-C., and Maxemchuk, N. F. (2011). Highway capacity benefits from us-
ing vehicle-to-vehicle communication and sensors for collision avoidance. In 2011 IEEE Vehicular
Technology Conference (VTC Fall), pages 1–5. IEEE.
Vander Schee, B. (2009). Crowdsourcing: Why the power of the crowd is driving the future
of business [book review] 2009 jeff howe. new york, ny: Crown business. Journal of Consumer
Marketing, 26:305–306.
Vignon, D. and Yin, Y. (2020). Regulating ride-sourcing services with product differentiation
and congestion externality. Available at SSRN 3531372.
Vosooghi, R., Puchinger, J., Jankovic, M., and Vouillon, A. (2019). Shared autonomous vehicle
simulation and service design. Transportation Research Part C: Emerging Technologies, 107:15 –
33.
Wang, C., Gong, S., Zhou, A., Li, T., and Peeta, S. (2019). Cooperative adaptive cruise control
27You can also read