COVID-19 sentiment analysis via deep learning during the rise of novel cases
←
→
Page content transcription
If your browser does not render page correctly, please read the page content below
COVID-19 sentiment analysis via deep learning during the
                                                    rise of novel cases
                                                                       1 ‡*                     2‡
                                                    Rohitash Chandra          , Aswin Krishna

                                                    1 School of Mathematics and Statistics, UNSW Sydney, NSW 2006, Australia
                                                    2 Indian Institute of Technology Guwahati, Assam, India

                                                    ‡Authors contributed equally
arXiv:2104.10662v1 [cs.CL] 5 Apr 2021

                                                    * rohitash.chandra@unsw.edu.au

                                                    Abstract
                                                    Social scientists and psychologists take interest in understanding how people express
                                                    emotions or sentiments when dealing with catastrophic events such as natural disasters,
                                                    political unrest, and terrorism. The COVID-19 pandemic is a catastrophic event that
                                                    has raised a number of psychological issues such as depression given abrupt social
                                                    changes and lack of employment. Advancements of deep learning based language models
                                                    have been promising for sentiment analysis with data from social networks such as
                                                    Twitter. Given the situation with COVID-19 pandemic, different countries had different
                                                    peaks where rise and fall of new cases affected lock-downs which directly affected the
                                                    economy and employment. During the rise of COVID-19 cases with stricter lock downs,
                                                    people have been expressing their sentiments in social media which can provide a deep
                                                    understanding of how people physiologically react to catastrophic events. In this paper,
                                                    we use deep learning based language models via long short-term memory (LSTM)
                                                    recurrent neural networks for sentiment analysis on Twitter with a focus of rise of novel
                                                    cases in India. We use the LSTM model with a global vector (GloVe) for word
                                                    representation in building a language model. We review the sentiments expressed for
                                                    selective months covering the major peak of new cases in 2020. We present a framework
                                                    that focuses on multi-label sentiment classification using LSTM model and GloVe
                                                    embedding, where more than one sentiment can be expressed at once. Our results show
                                                    that the majority of the tweets have been positive with high levels of optimism during
                                                    the rise of the COVID-19 cases in India. We find that the number of tweets significantly
                                                    lowered towards the peak of new cases. We find that the optimistic and joking tweets
                                                    mostly dominated the monthly tweets and there was a much lower number of negative
                                                    sentiments expressed. This could imply that the majority were generally positive and
                                                    some annoyed towards the way the pandemic was handled by the authorities as their
                                                    peak was reached.

                                                    1    Introduction
                                                    There has been unprecedented growth of information via social media which has been of
                                                    interest to social scientists and psychologists in a better understanding of the human
                                                    condition, psychology [1–4] and mental health [5]. Social media platforms such as
                                                    Twitter has been used as a medium for conducting research and seen important source
                                                    data to study human psychological [6]. It has also been used as a tool for predicting
                                                    personality type [1, 2], and understanding trends and backgrounds of users online [7, 8].

                                   April 22, 2021                                                                                       1/25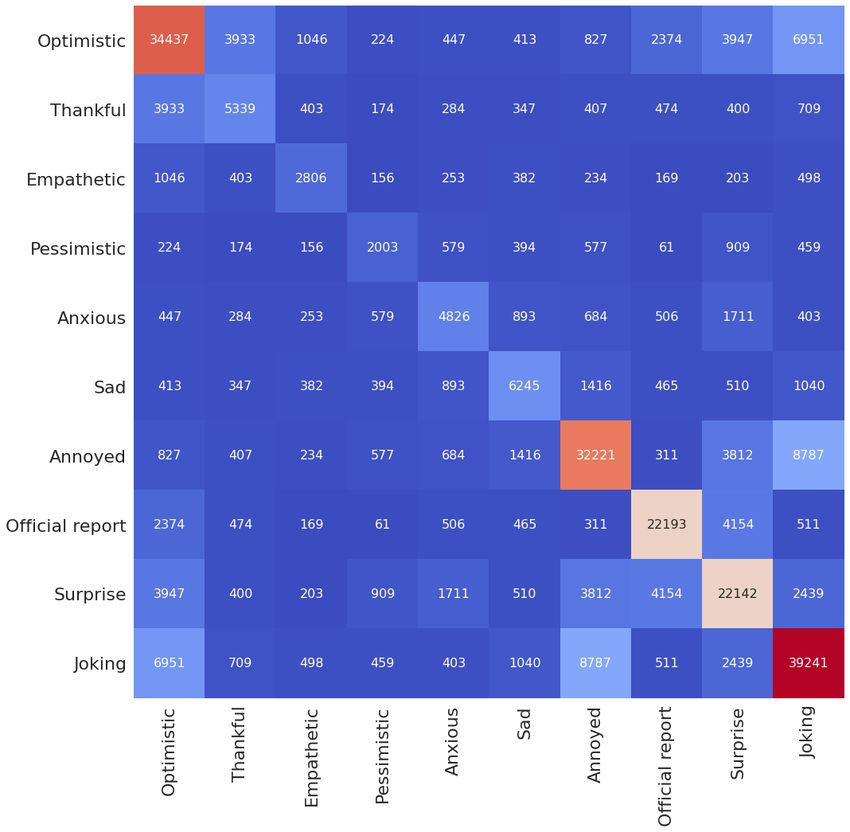
There has also been interest regarding how people express sentiments when dealing with
                 catastrophic events such as natural disasters, extreme political viewpoints [9], and
                 terrorism [10]. For instance, in a case of terror attack in Kenya, Twitter became a
                 crucial channel of communication between the government, emergency response team
                 and the public.
                     Sentiment analysis involved the use of natural language processing (NLP) [11]
                 methods to systematically study affective states and emotion understanding of
                 individuals or social groups [12–14]. Apart from research in psychology, sentiment
                 analysis has a number of usefulness particularly in understanding customer
                 behaviour [15], clinical medicine [16], building better prediction model for trading
                 stocks [17], and elections such as the US Presidential campaign in 2012 [18]. Deep
                 learning [19] and Twitter has been a powerful tool in sentiment analysis with language
                 models [20, 21]. One of the earliest works began using NLP methods such as n-grams
                 with hash tags for building training data and machine learning methods such as
                 Adaboost for sentiment classification [20]. Deep learning methods such as convolutional
                 neural networks have been used for sentiment analysis on Twitter [22].
                     The coronavirus disease 2019 (COVID-19) [23–26] global pandemic has been
                 catastrophic event with major impact to the economy and created high rise in terms of
                 unemployment and lead psychological issues and depression. The abrupt social,
                 economic and travel changes has motivated research from various fields [?, 27–29], of
                 which computational and mathematical modelling with machine learning has been
                 prominent [30], but had a number of limitations and challenges due to reporting of
                 cases [31]. Deep learning models have played a significant role in forecasting COVID-19
                 infection treads and impact for various parts of the world [32–34].
                     During rise of COVID-19 cases, and stricter lock downs, people have been expressing
                 different sentiments in social media such as Twitter. Social media has played a
                 significant role during COVID-19 which has driven researchers for analysis with NLP
                 and machine learning methods. Sentiment analysis via deep learning found that World
                 Health Organisation Tweets have been unsuccessful in providing public guidance [35].
                 Sentiment analysis to study the effect of nationwide lockdown due to COVID-19
                 outbreak in India and found that people took the fight against COVID19 positively and
                 majority were in agreement with the government for announcing the lockdown to flatten
                 the curve [36]. The thematic area of tweets brings another level of understanding when
                 combined with sentiment analysis. An example of topic modelling examined tweets
                 during the COVID-19 pandemic identified themes such as ’origin of the virus’, and ’the
                 economy’ [37]. Topic modelling has been used with Twitter based sentiment analysis
                 during early stages of COVID-19 and sentiments such as fear was dominant [38]. In
                 region specific studies, Twitter sentiments from the United States to determine the
                 network of dominant topics and sentiments [39]. Further work was done in case of
                 China via bidirectional encoder representations from transformers (BERT) language
                 model for trend, topic, and sentiment analysis [40]. Further region specific studies
                 include community sentiment analysis in Australia [41] and sentiment analysis in
                 Nepal [42] where majority positive sentiments were found with elements of fear. In
                 Spain, sentiment analysis reviewed how digital platforms created an impact during
                 COVID-19 [43]. A study of cross-language sentiment analysis of European Twitter
                 messages during the first few months of the COVID-19 pandemic found that the
                 lockdown announcements correlate with a deterioration of moods, which recovers within
                 a short time span [44].
                     The sentiment analysis examples from Europe and India show how social media can
                 play a powerful role in understanding the psychology and human condition n during a
                 pandemic and has motivated this paper. Recent advancements of deep learning models
                 as a tool for building robust language models have provided further motivation in

April 22, 2021                                                                                     2/25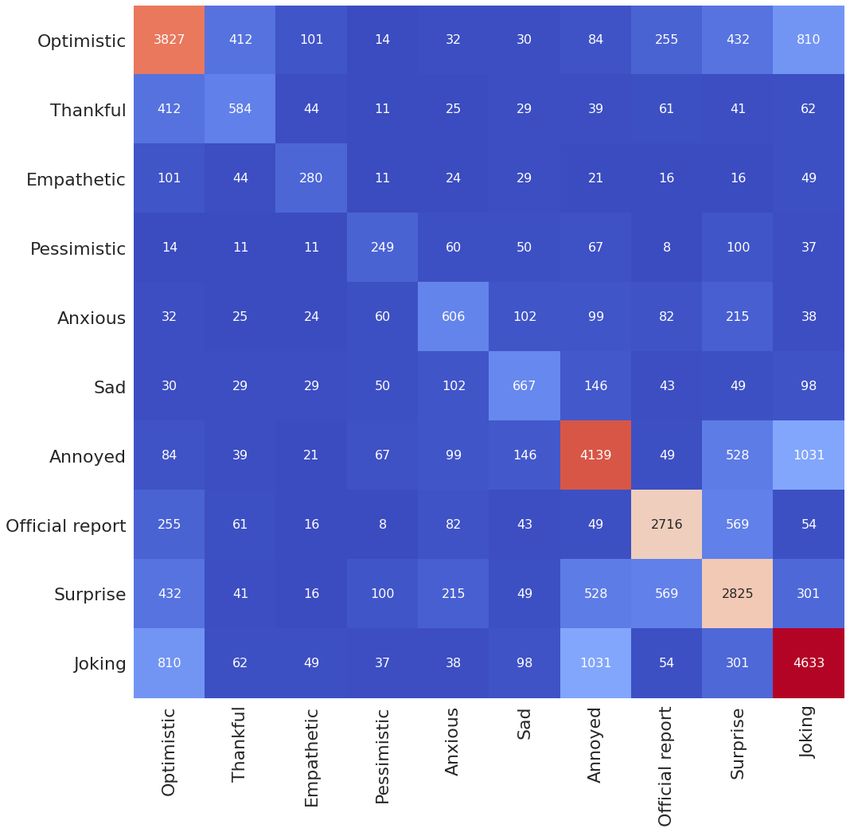
understanding the temporal nature of the sentiments during and after the peak of
                 COVID-19 has been reached in case of India. Given the situation with COVID-19
                 pandemic, different countries had different peaks where rise and fall of new cases
                 affected lock-downs which directly affected the economy and employment. India is
                 special in this way (until February 2021), where a single peak was seen and only in
                 certain states (Delhi and Maharashtra), multiple peak was shown [33].
                     In this paper, we use deep learning based language models via long short-term
                 memory (LSTM) recurrent neural networks for sentiment analysis on Twitter with a
                 focus of rise of novel cases in India. We use LSTM model with global vector (GloVe) for
                 word representation in building a language model. We use three datasets, which include
                 India, along with the state of Maharashtra (includes Mumbai) and Delhi. We compare
                 the monthly sentiments expressed covering the major peak of new cases in 2020. We
                 present a framework that focuses on multi-label sentiment classification, where more
                 than one sentiment can be expressed at once. We use Senwave COVID-19 sentiment
                 dataset which features 10,000 tweets collected worldwide and hand-labelled by 50
                 experts [45] for training LSTM models.
                     The rest of the paper is organised as follows: Section 2 presents a background of
                 related work, and Section 3 presents the proposed methodology with data analysis.
                 Section 4 presents experiments and results. Section 5 provides a discussion and Section
                 6 concludes the paper with discussion of future work.

                 2    Related Work
                 Word embedding is the process of feature extraction from text for NLP tasks such as
                 sentiment analysis [46–48]. Word embedding can be obtained using methods where
                 words or phrases from the vocabulary are mapped to vectors of real numbers. The
                 process generally involves a mathematical embedding from a large corpus with many
                 dimensions per word to a vector space with a lower dimension that is useful for machine
                 learning or deep learning models for text classification tasks [46]. Basic word embedding
                 methods such as bag of words [49] and term frequency inverse document frequency [50]
                 do not have context awareness and semantic information in embedding. This is also a
                 problem for skip-grams [51] that use n-grams (such as bigrams and tri-grams) to
                 develop word embedding, and in addition allow adjacent sequences of words tokens to
                 be “skipped” [52].
                     Over the last decade, there has been phenomenal progress in the area of world
                 embedding and language models which we shall discuss next. Mikolov et al. [53]
                 introduced word2vec embedding which uses a feedforward neural network model to
                 learn word associations from a text dataset which can detect synonymous words or
                 suggest additional words given a partial sentence. It uses continuous bag-of-words
                 (CBOW) or continuous skip-gram model architectures to produce a distributed
                 representation of words. The method is used to create a large vector which represent
                 each unique word in the corpus where semantic information and relation between the
                 words are preserved. For instance, it has been shown that for two sentences that do not
                 have much words in common, their semantic similarity can be captured using word2vec.
                 The limitation of word2vec is that it does not well represent the context of a word.
                 Global vectors (GloVe) by Pennington et al. [54] for word embedding is an unsupervised
                 learning algorithm for obtaining vector representations for words by mapping words into
                 a meaningful space where the distance between words is related to semantic similarity .
                 GloVe uses matrix factorization to constructs a large matrix of co-occurrence
                 information to obtain representation that showcase linear substructures of the word
                 vector space. The embedding feature vectors with top list words that match with
                 certain distance measures. GloVe can be applied to find relations between words such as

April 22, 2021                                                                                      3/25
synonyms, company-product relations. Recently, due to the awareness in ethics in
                 machine learning, there has been a focus on ethical issues in NLP. A recent study
                 showed that GloVe can have gender biased information and gender neutral GloVe
                 method has been proposed [55].
                    There are some studies that review the effectiveness of word embedding methods.
                 Ghannay et al. [?] provided a evaluation of word embeddings for linguistic tasks such as
                 GloVe [54], continuous space language models (CSLM) [56] where skip-gram and GloVe
                 outperformed CSLM on all tasks. Wang et al. [57] evaluated word embedding methods
                 such as GloVe for applications of biomedical text analysis where it was found that word
                 embedding trained from clinical notes and literature better capture word semantics.

                 3     Methodology
                 3.1    LSTM network models
                 Recurrent neural networks (RNN) in general feature a context memory layer to
                 incorporate previous state and current inputs for propagating information to the next
                 state, and eventually the output layer for decision making. Canonical RNNs are known
                 as simple RNNs and several different architectures were developed, besides the Elman
                 RNN [58, 59] for modelling temporal sequences and dynamical systems [60–62]. One of
                 the major challenges was in training simple RNNs due to architectures properties of
                 unfolding in time depending on the dataset. Backpropagation through time (BPTT)
                 which is an extension of the backpropagation has been a prominent for training simple
                 RNNs [63] using gradient descent. Due to problem of learning long-term dependencies
                 with given vanishing and exploding gradients [64], it was a major challenge in training
                 simple RNNs and hence, long short-term memory (LSTM) recurrent neural networks
                 were developed [65] which have better capabilities using memory cells and gates for
                 learning long-term dependencies in temporal data.
                     In the last decade, with the deep learning revolution, several LSTM architectures
                 have been developed which includes bidirectional LSTM models [66] that can process
                 information in two directions rather than making use of only previous context state for
                 determining the next states. They are based on bidirectional RNNs [67] that process
                 information in two directions with two separate hidden layers. In this way, we can place
                 two independent RNNs together to allow both backward and forward information about
                 the sequence at every time step. This enables better access to long range state
                 information using bi-directional LSTM networks (BD-LSTM) that were initially used
                 for word embedding [66] and have been used in several other sequence processing
                 problems [66, 68, 69]. In our proposed sentiment analysis framework, we use LSTM and
                 BD-LSTM models and evaluate them based on scores for multi-label classification
                 during training.

                 3.2    Twitter-based Sentiment Analysis Framework for
                        COVID-19
                 Our framework for sentiment analysis with deep learning follows a series of steps with
                 major components that involve, 1.) Tweet processing, 2.) GloVe based word
                 embedding [54] from Tweets, 3.) LSTM model development and training, and 4.)
                 prediction using selected COVID-19 data. Figure 1 shows the framework diagram where
                 we highlight the major components. We note that the framework features multi-label
                 classification which has two outcomes at once, i.e the tweet can be optimistic and joking
                 at the same time.

April 22, 2021                                                                                       4/25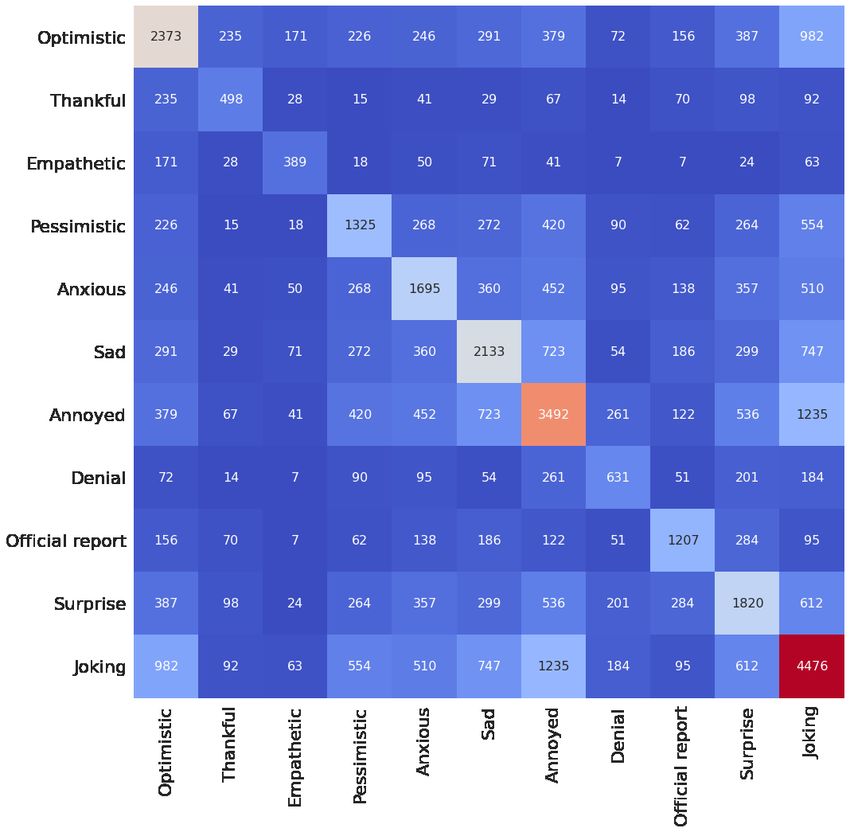
Fig 1. Framework: Twitter-based Sentiment Analysis for COVID-19. Note that the
                 framework features multi-label classification which has the ability to provide two
                 outcomes at once, i.e the tweet can be optimistic and joking at the same time.

                     The first step involves processing on COVID-19 dataset from a selected region where
                 we choose India, and two states which have been among the highest states of COVID-19
                 cases in 2020 (Maharashtra and Delhi). We process Twitter data obtained for India and
                 related state as follows. We note that special phrases, emotion symbols (emoji’s) and
                 abbreviations are used in tweets and social media has a evolving language style. Hence,
                 we had to transform them for building the language model. Table ?? shows other words
                 and emotions that were transformed. We note that since this is a case of India, where
                 English is used in combination with some key indigenous languages (such as Hind), we
                 had to transform certain words and emotions and character symbols expressed in other
                 languages as well. Note that we use hand-labelled sentiment dataset (Senwave
                 COVID-19 dataset) [45] which has 11 different sentiments labelled by a group of 50
                 experts for 10,000 tweets worldwide during COVID-19 pandemic in 2020. In this
                 dataset, ”official report” is classified as a sentiment although it is a topic.

                  Original Phrase/Emoji   Transformed Word
                  omg                     oh my god
                  btw                     by the way
                  socialdistancing        social distancing
                  ,                       smiling face
                  /                       sad face
                                          bed
                                          fire
                                          wink
                                          laugh
                 Table 1. Examples of word transformation that features changing symbols and emoji’s
                 to words that can have semantic representation.

                     The next step involves converting each word into its corresponding GLoVe
                 embedding vector where each word is converted into a vector of 300 dimensions. We
                 select this embedding since it has shown good results for language models with
                 sentiment analysis in the literature [54]. The aforementioned vector from each word
                 thus obtained is passed on to the respective LSTM models for training once the model
                 architecture has been defined as shown in Figure 1. We first evaluate our trained LSTM

April 22, 2021                                                                                     5/25
model and then use it for COVID-19 sentiment analysis using test data (India,
Maharashtra, and Delhi). As shown in Figure 1, the trained model is used to classify 11
sentiments such as “anxious”, “sad”, and “joking”.
It is essential to have the right metric to evaluate the model for the given application.
The outcome of a misclassification in a multi-label classification is no longer a correct or
an incorrect instance as opposed to binary classification or multi-class classification [70].
In multi-label classification, a prediction that features a subset of the actual classes are
considered better than a prediction that contains none of the actual classes, hence this
needs to be captured by the metric that captures the loss or gives a score. As given in
the literature [70], multi-label classification evaluation is typically based on binary
cross-entropy (BCE) loss [71] is a softmax activation combined with a cross-entropy loss,
Hamming loss [70] which calculates loss generated in the bit string of class labels using
exclusive or (XOR) operation between the actual and predicted labels and then
computes the average over the instances of the dataset. The Jaccard coefficient
score [72] Jaccard provides a measure of the overlap between actual and predicted labels
with their attributes capturing similarity and diversity. Furthermore, label ranking
average precision (LRAP) score [73] finds the percentage of the higher-ranked labels
that resemble true labels for each of the given samples. F-score is F1 score conveys the
balance between the precision and the recall which and has been prominent for
understanding class imbalance problems [74]. In application to multi-label classification,
F1 macro score is computed using the F1-score per class/label and then averaging them,
whereas and F1 micro is calculated directly from the precision and recall values [75]. We
will use these scores to evaluate our model results for the first phase of the framework
where respective LSTM models will be trained with human-labelled sentiment dataset.
3.3 Model Training
We present an experimental study that compares multi-label classification using LSTM
and BD-LSTM models as shown in the framework (Figure 1). We use 85% of the
dataset for training and 15% for testing. We use the respective LSTM models and train
them using the Senwave COVID-19 dataset which is publicly available but restricted
and needs permission from the authors for usage [45]. Therefore, we cannot provide the
processed dataset but provide the trained LSTM models via Github repository 1 . The
Senwave dataset features 10,000 Tweets collected from March to May 2020. We note
that our GloVe embedding used a 300 size word vector to to provide data representation
which is standard representation in the literature [54]. We use a dropout regularisation
probability 0.65 for both LSTM models which feature: 300 input units, two layers with
128 and 64 hidden units, and finally an output layer with 11 units for classifying the
sentiments.
Table 2 shows the model training results (mean and standard deviation) for 10
experiments with different initial weights and biases of the respective LSTM model from
different performance metrics. Generally, we find that using LSTM is better than
BD-LSTM model across the different performance metrics shown in Table 2, and hence
we proceed with LSTM model for further visualizations and outputs. We note that the
best LSTM model out of 10 experimental runs is used hereafter.
3.4 Application to COVID-19 pandemic in India
India COVID-19 pandemic management had major challenges given large population
with a large number of densely populated cities [76]. India reported first COVID-19
1 https://github.com/sydney-machine-learning/COVID19_sentinentanalysis
April 22, 2021 6/25Metric BD-LSTM(mean,std) LSTM(mean,std)
BCE Loss 0.281 (0.0067) 0.255 (0.0068)
Hamming Loss 0.163 (0.0027) 0.157 (0.0030)
Jaccard Score 0.417 (0.0078) 0.418 (0.0106)
LRAP Score 0.503 (0.0057) 0.511 (0.0091)
F1 Macro 0.434 (0.0141) 0.430 (0.0076)
F1 Micro 0.495 (0.0094) 0.493 (0.0106)
Table 2. Training performance for BD-LSTM and LSTM model using Senwave
COVID-19 training dataset. Note that except for the BCE and Hamming loss, higher
scores shows better performance.
case on 30 January 2020 and entered a lock-down afterwards which was gradually
changed. India currently (22-nd March, 2021) has more than 11.6 million confirmed
cases with more than 160 thousand deaths which makes India the third highest
confirmed cases in the world after the United States and Brazil and 8th in world with
more than 300 thousand active cases. India has a single major peak around middle of
September in 2020 with close to 100 thousand cases daily, which gradually decreased to
around 11 thousand cases daily end of January 2021, and since then gradually raising.
In March 2021, the cases began rising faster and by 22nd March, India had 47 thousand
daily new cases which was moving towards a second peak 2 .
In the first six months, the states of Maharashtra (population of about 124 million),
Delhi (population of 19 million), and Tamil Nadu (population of about 8 million) were
the top states with COVID-19 infections [77]. Note that the city of Mumbai is in the
state of Maharashtra that can be compared to some highly populated countries. Later
half of the year, the Delhi cases reduced but still remained in top 8 states [33]. In 2021,
Maharashtra continued as state of highest infections and in March, it was featuring
more than half of new cases weekly basis and Delhi somewhat contained the situation
with less than a thousand daily cases. Hence, our focus to study whole of India with
two states of interest that includes Maharashtra where the cases have not been
contained and Delhi, where the cases have somewhat have been contained 3 .
We note that the proposed framework can be applied to any part of the world;
however, we are choosing the case of India to show the effectiveness of the framework.
The final step is in applying the different datasets from COVID-19 in India which
include, nationwide COVID-19 sentiments, and who major states with COVID-19 cases
that include Maharashtra and Delhi. The trend in the cases shows that both states had
a major peak followed by minor ones whereas India as a whole had a single major peak
which was around mid September 2020 with close to 97,000 novel cases per day during
the peak as shown in the next section (Figure 2).
4 Results
In this section, we provide results of the implementation of our proposed framework
using Twitter dataset for COVID-19 in India.
4.1 COVID-19 Data Visualisation
Our test dataset features COVID-19 India which features tweets associated with
COVID-19 from March to September 2020.
2 https://www.worldometers.info/coronavirus/country/india/
3 https://www.nytimes.com/interactive/2020/world/asia/india-coronavirus-cases.html
April 22, 2021 7/25We first provide visualisation of the dataset and report features of interest to
language models such as bi-grams, and tri-grams and distribution of monthly tweets.
Figure 2 shows the distribution of number of tweets for selected months along with the
number of cases for the respective datasets.
We notice that the number of tweets in case of India follows the same trend as the
number of novel COVID-19 cases until July, afterwards the number of tweets decline
(Panel a, Figure 2). There is a similar pattern for case of Maharashtra (Panel b). The
case of Delhi (Panel c) was slightly different as the first peak was reached in July with
increasing tweets that declined afterwards and did not keep up with the second peak of
cases in September. This show that as more cases were observed in the early months,
there was much concern which eased before the major peak was reached, as the number
of tweets were drastically decreased. There could be elements of fear, depression and
anxiety as the tweets decreased drastically after July with increasing cases, which we
will analyse in the following section.
Figure 3 shows a visualisation of the number of bi-grams and tri-grams for the case
of India. In case of bi-grams (Panel a), we see the terms “corona - virus” mostly used
followed by “covid - 19” which are essentially the same. Next, it is interesting that the
terms “folded - hand” are mostly used followed by “positive - case” and “social -
distancing”. The term “folded - hand” shows Indian social and religious symbol that
denotes keeping the faith, giving respect and also a sign of acknowledgement and
appreciation. We note that the “folded hand” is an emotion icon (emoji) used
predominantly in social media and hence been processed as a text during prepossessing
(Table 1), which is actually is not a bi-gram from a semantic viewpoint. In order to
provide better understanding of the context of the tweets, we give examples in Table 3.
In the case of tri-grams (Panel b), we fine more information in tweets such as
”backhand - index - pointing” which is an emoji, hence we provide some of the tweets
that fall in this category in Table 4.
Figure 4 shows number of occurrence of a given sentiment in relation to the rest of
the sentiments for 10,000 tweets which had hand-labelled sentiments in Senwave
dataset [45] used for training.
Month Tweet Bi-gram (Emoji)
March “releasing today at 6:00 pm on my youtube channel! “folded hand”
let’s fight this together folded hands i need your support guys”
July “that’s really shameful and heinous folded hands” “folded hand”
August “please applaud this corona economy warrior. folded hands kudos.” “folded hand”
March “india this backhand index pointing down” “index pointing”
May “corona : to everyone backhand index pointing down” “index pointing”
July “backhand index pointing right. ........lockdown time..... “index pointing”
#picture #instagood #instadaily #insta”
Table 3. Selected example of Tweets that are captured in most prominent bi-grams.
Month Tweet Tri-gram (Emoji)
May “google doc of resources for amphan and covid. “backhand - index - pointing”
backhand index pointing down.
retweet for greater reach.”
August ”#covid tips backhand index pointing down” “backhand - index - pointing”
September ”backhand index pointing right registers “backhand - index - pointing”
highest single-day cases in the world - 95,529”
Table 4. Selected example of Tweets that are captured in most prominent tri-grams.
April 22, 2021 8/25(a) India
(b) Maharashtra
(c) Delhi
Fig 2. Novel COVID-19 tweets and cases in India, Maharashtra, and Delhi.
April 22, 2021 9/25(a) Bi-grams
(b) Tri-grams
Fig 3. Bi-grams and tri-grams for case of India. Note that a combination of emoji’s
such as “backhand - index - pointing” and “smiling - face” and words have been used.
April 22, 2021 10/25Fig 4. Heatmap showing number of occurrence of a given sentiment in relation to the
rest of the sentiments for 10,000 tweets which had human labelled sentiments in
Senwave dataset [45] used for training.
4.2 Sentiment Predictions
In this section, we present results of the predictions of the COVID-19 tweets in India,
Maharashtra, and Delhi treated a separate datasets. We note that in our Senwave
dataset visualised and analysed in previous section has been used for training. In the
dataset, “official report” which is not a sentiment has been labelled and hence we also
use it as a sentiment which is predicted. Figure 5 presents distribution of sentiments
predicted by the trained LSTM model for the respective datasets for the entire duration
(March to September 2020). In the case of India (Panel a), we notice that the
”optimistic” and ”joking” sentiments are the most expressed which also follows in the
case of Maharashtra and Delhi (Panel b and c). In case of India, we find that negative
sentiments such as “pessimistic”, “anxious” and “sad” least expressed. We find
”optimistic” sentiment as the second most prominent sentiment after “joking”. It is
simpler to label ”optimistic” and ”thankful” as a positive sentiment, but it becomes
increasing difficult when it comes to the sentiments “joking” and “surprise”, when
context information is not available. It would be helpful to look at the sentiments such
as “joking” and “surprise” in relation to other sentiments expressed. We see a similar
trend in the case of Delhi and Maharashtra (Panel b and c) which are subsets of data
from India (Panel a), the only major difference is the number of tweets which is
significantly lower due to their respective population.
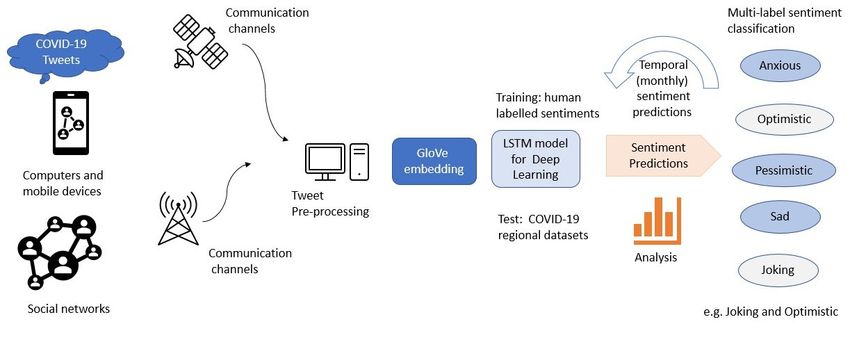
Next, we analyse the sentiments predicted using a heatmap to examine number of
occurrence of a given sentiment in relation to the rest of the sentiments (Figure 6). This
heatmap fills the gap in understanding the context behind the negative and positive
sentiments given in Figure 5 where we found that the most prominent sentiment was
“joking”, but were not sure if it was positive of negative sentiment. As shown in Figure 6,
April 22, 2021 11/25(a) India
(b) Maharashtra
(c) Delhi
Fig 5. Distribution of sentiments predicted for the respective datasets by trained
LSTM model.
April 22, 2021 12/25Fig 6. Heatmap showing number of occurrence of a given sentiment in relation to the
rest of the sentiments for India dataset.
Fig 7. Heatmap showing number of occurrence of a given sentiment in relation to the
rest of the sentiments for Maharashtra dataset.
April 22, 2021 13/25Fig 8. Heatmap showing number of occurrence of a given sentiment in relation to the
rest of the sentiments for Delhi dataset.
we find that most tweets that were associated with “joking” were either “optimistic”
(6951) or “annoyed” (8787), and some were also “thankful” (709). A much lower portion
(below 500) were either “empathetic”, “pessimistic”, “anxious” or “sad” while “joking”.
Next, we review the sentiment “optimistic” and find that majority were either
“thankful” (3933) or “joking” (6951) and minority ”optimistic” tweets were having
negative sentiments such as “pessimistic” (224), “anxious” (447), and “sad” (413).
Furthermore, a significant portion were also “empathetic” (1043). It is not common for
one to make a statement that is optimistic and pessimistic at the same time, hence this
could be a limitation or wrong prediction by the model. However, it seems the model is
making the right prediction when we look at the heatmap for the hand-labelled training
datasets (Figure 4) where such combinations of sentiments were labelled by experts. We
show examples of tweets of this case and compare with case with those that are
optimistic and thankful in Table 5.
Figures 8 and Figure 7 shows number of occurrence of a given sentiment in relation
to the rest of the sentiments for the case of Maharashtra and Delhi, which follows a
similar pattern when compared to case of India (Figure 8)). We note that the Senwave
dataset which shows tweets worldwide (Figure 4) follow a similar pattern than the case
in Indian datasets when it comes to sentiments such as “joking” and being “optimistic”
or “joking” and “annoyed”. Senwave dataset also has cases of being optimistic and
pessimistic at the case time (226 cases) (Figure 4) which are all human labelled (from
10,000 tweets worldwide); and hence, we can conclude since such patterns were part of
the training data, it cannot be a error in predictions when looking at the Indian
datasets.
Figure 9 provides a visualisation of the distribution of tweets with number of
combination sentiments. We find that around 60% of the tweets had a singular
April 22, 2021 14/25Month Tweet Sentiment combination
May “don’t care china only care indian covid19 news” “optimistic - pessimistic”
August “dear uddhav ji other than covid problem, “optimistic - pessimistic”
what ever wrong is happening is not good
for your government”
September “sir, plz look in have benefits to sr citizen.” “optimistic - pessimistic”
April “thank you switzerland smiling face with smiling “optimistic - thankful”
eyes especially zermatt for showing ”
solidarity for india flag”
May “big thanks to the cfpc....thoroughly enjoyed it!” ”optimistic - thankful”
June “doctors, activists urge pm to promote plant-based diet “optimistic - thankful”
— india news - times of india”
Table 5. Selected example that show cases of tweets that are “optimistic” and also
“pessimistic” and “optimistic” and also “thankful”.
(a) Senwave hand-labelled sentiments (Worldwide)
(b) Predicted (India)
Fig 9. Distribution of tweets with number of combination of sentiment types (labels).
April 22, 2021 15/25sentiment. Moreover, about 25% of the tweets had two sentiment attached them and
14% had no sentiment attached to them. Furthermore, a small number of tweets had 3
or more emotions attached to them which indicates that the human do not show
multiple emotions at the same time, often.
Finally, we present results that visualises the trend of sentiments expressed over time
in the three datasets. This is one of the key findings which can enable a understanding
of the reaction in terms of emotions expressed by the population given rise and fall of
COVID-19 novel cases as shown in Figure 2. Figures 10, 11 and 12 presents
visualisation of the monthly sentiments of India, Maharashtra and Delhi, respectively.
Fig 10. Monthly COVID-19 sentiments in India
5 Discussion
Humans can express more than one sentiment at a time; however, there variations in
the number of sentiments that can be expressed by facial expressions [78], versus spoken
emotions or written emotions such as in tweets. As shown in Figure 9, majority of the
tweets had one sentiment, both in human labelled (Panel a) and predicted datasets
(Panel b). This was followed by two sentiments and a minority had 3 sentiments. We
note that there was a significant portion of tweets with no sentiments and there were no
tweets of more than three sentiments at a time. The study of emotions with technology
has gained much interested in last decade which gave much progress in understanding
sentiments. Trampe et al. [79] presented a study of everyday emotional experiences
through an experience sampling smartphone application that monitored real-time
emotions of an more than 11,000 participants and found the group experienced at least
one emotion 90% of the time with joy as the the most frequent emotion, followed by
love and anxiety. The type of emotion would be highly dependent on the study region
which featured Europeans with majority French participants. Cowen and Keltner
reported [80] 27 distinct categories of emotion bridged by continuous gradients by
April 22, 2021 16/25Fig 11. Monthly COVID-19 sentiments in Maharashtra
Fig 12. Monthly COVID-19 sentiments in Delhi
April 22, 2021 17/25reviewed data from emotionally evocative short videos with varying situational content.
These studies have contributed to better understanding of emotions given historical
viewpoints about context and definitions of emotions and associations between
them [81–84]. However, we could not find much studies that show number of emotions
that can be expressed at a number in relation to catastrophic events and concerns such
as continuity and adverse effects of a pandemic such as raise of COVID-19 cases.
We revisit the case of Indian dataset (Figure 10), where the monthly tweets did not
sharply increase with number of novel cases (Figure 2) with a nationwide peak of novel
cases (Figure 2, Panel a). The number of tweets gradually increases with peak of tweets
in July (Figure 2, Panel a). When India had a peak of novel cases, we find that the
number of tweets significantly lowered. Hence, people have been alarmed by rising cases
but a month before the peak of novel cases was seen, people reduced tweets. Moreover
we see that the optimistic and joking tweets were mostly dominating the monthly tweets
for India (Figure 10) and Maharashtra (Figure 11), with a mix of annoyed sentiments in
case of Delhi (Figure 12). There was significantly lower number of negative sentiments
for the respective datasets (Figure 10-12). This could imply that people were generally
positive and also annoyed towards the way the pandemic was handled by the
government as they peak was reached.
One of the major sentiments, that is difficult for language models to predict in
unsupervised manner is ”joking”. We took advantage of the Senwave dataset with
10,000 human labeled sentiments and trained a model that could very well predict if
someone is joking in a tweet. Due to the multi-label classification system, we could
predict more than one sentiment expressed and found that people have been joking
mostly when (eg.Figure 6) optimistic or annoyed. A relatively small portion have been
joking when given the official report. We also find that given the official report, the
major sentiments were optimistic and surprised.
We note that a limitation of the framework is in the Senwave training data which
considered tweets worldwide during COVID-19 and were hand labelled; however, there
could be limitations on how people perceive humour in different regions. Humour is
expressed differently in different cultural groups, i.e a tweet that may be humorous or
expressed a joke in USA may not be seen as humour for India due to cultural biases in
understanding humour. There are several studies about the effect of humour in
changing cultural or regional settings [85–87]. A good example is that in orthodox
Chinese literature, humour was not expressed due to religious taboo in ancient
Buddhism which later eased with Zen Buddhism [88, 89]; however, Indian literature had
a different or eased attitude towards humour as expressed in ancient Hindu texts [90].
Although historic textual composition cannot be related to how tweets are expressed in
India, it is important to note that humour has cultural dimensions.
We note that there has not been much work in uncertainty quantification for the
predictions and there are different level of uncertainty that can be captured here,
particularly uncertainly in model parameters, and data. We note that since the data is
human labelled, and at times two or three sentiments are expressed at once, this could
be something open to interpretation as it is hard to formally detect more than one
sentiment from a tweet of barley thirty words. The human labelled trained dataset adds
to uncertainty in model predictions. Bayesian inference with Bayesian deep learning can
provide a way to address uncertainty in model predictions [?, 91].
6 Conclusions
We presented a study where we used novel methods for sentimental analysis via deep
learning for understanding sentiments during the over a COVID-19 peak. We chose
India as our case study and reviewed selected states that also included Mumbai and
April 22, 2021 18/25Delhi and took advantage of COVID-19 dataset of more than 10,000 human labelled
tweets that was used for training respective deep learning models. The results show that
majority of the tweets have been positive with high level of optimism during the rise of
the COVID-19 cases in India. It has been surprising that the most expressed sentiment
was “joking” and our analysis found that majority have been “joking” by either being
“optimistic” or “annoyed”. A relatively small group of people were joking given the
official report and negative sentiments such as “sadness”, “anxiousness” and
“pessimism”.
Future work can use the framework for different regions, countries, ethnic and social
groups to understand how they psychologically dealt with rise of COVID-19 cases and
multiple peaks of novel cases. The framework can be extended to understand reactions
towards vaccinations with the rise of anti-vaccine sentiments and advocates give fear,
insecurity and unpredictability of COVID-19. Moreover, the framework can be
improved using more advanced language models such as Transformers and BERT.
Finally, the framework can incorporate topic modelling with sentimental analysis, this
will enable more detailed overview about type of sentiments expressed for emerging
topics during the development of COVID-19 and various government protocols such as
different levels of local downs and vaccination plans and efforts taken for community
awareness and mental health.
Data and Code
Python-based open source code and data can be found here 4 .
References
1. Golbeck J, Robles C, Edmondson M, Turner K. Predicting personality from
twitter. In: 2011 IEEE third international conference on privacy, security, risk
and trust and 2011 IEEE third international conference on social computing.
IEEE; 2011. p. 149–156.
2. Quercia D, Kosinski M, Stillwell D, Crowcroft J. Our twitter profiles, our selves:
Predicting personality with twitter. In: 2011 IEEE third international conference
on privacy, security, risk and trust and 2011 IEEE third international conference
on social computing. IEEE; 2011. p. 180–185.
3. Bittermann A, Batzdorfer V, Müller SM, Steinmetz H. Mining Twitter to detect
hotspots in psychology. Zeitschrift für Psychologie. 2021;.
4. Lin J. On building better mousetraps and understanding the human condition:
Reflections on big data in the social sciences. The ANNALS of the American
Academy of Political and Social Science. 2015;659(1):33–47.
5. Coppersmith G, Dredze M, Harman C. Quantifying mental health signals in
Twitter. In: Proceedings of the workshop on computational linguistics and
clinical psychology: From linguistic signal to clinical reality; 2014. p. 51–60.
6. Murphy SC. A hands-on guide to conducting psychological research on Twitter.
Social Psychological and Personality Science. 2017;8(4):396–412.
7. Zhou Y, Na JC. A comparative analysis of Twitter users who Tweeted on
psychology and political science journal articles. Online Information Review.
2019;.
4 https://github.com/sydney-machine-learning/COVID19_sentinentanalysis
April 22, 2021 19/258. Wang W, Hernandez I, Newman DA, He J, Bian J. Twitter analysis: Studying
US weekly trends in work stress and emotion. Applied Psychology.
2016;65(2):355–378.
9. Alizadeh M, Weber I, Cioffi-Revilla C, Fortunato S, Macy M. Psychology and
morality of political extremists: evidence from Twitter language analysis of
alt-right and Antifa. EPJ Data Science. 2019;8(1):17.
10. Garg P, Garg H, Ranga V. Sentiment analysis of the Uri terror attack using
Twitter. In: 2017 International conference on computing, communication and
automation (ICCCA). IEEE; 2017. p. 17–20.
11. Manning C, Schutze H. Foundations of statistical natural language processing.
MIT press; 1999.
12. Liu B, Zhang L. A survey of opinion mining and sentiment analysis. In: Mining
text data. Springer; 2012. p. 415–463.
13. Medhat W, Hassan A, Korashy H. Sentiment analysis algorithms and
applications: A survey. Ain Shams engineering journal. 2014;5(4):1093–1113.
14. Hussein DMEDM. A survey on sentiment analysis challenges. Journal of King
Saud University-Engineering Sciences. 2018;30(4):330–338.
15. Ordenes FV, Theodoulidis B, Burton J, Gruber T, Zaki M. Analyzing customer
experience feedback using text mining: A linguistics-based approach. Journal of
Service Research. 2014;17(3):278–295.
16. Greaves F, Ramirez-Cano D, Millett C, Darzi A, Donaldson L. Use of sentiment
analysis for capturing patient experience from free-text comments posted online.
Journal of medical Internet research. 2013;15(11):e239.
17. Mittal A, Goel A. Stock prediction using twitter sentiment analysis. Standford
University, CS229 (2011 http://cs229 stanford edu/proj2011/GoelMittal-
StockMarketPredictionUsingTwitterSentimentAnalysis pdf).
2012;15.
18. Wang H, Can D, Kazemzadeh A, Bar F, Narayanan S. A system for real-time
twitter sentiment analysis of 2012 us presidential election cycle. In: Proceedings
of the ACL 2012 system demonstrations; 2012. p. 115–120.
19. Zhang L, Wang S, Liu B. Deep learning for sentiment analysis: A survey. Wiley
Interdisciplinary Reviews: Data Mining and Knowledge Discovery.
2018;8(4):e1253.
20. Kouloumpis E, Wilson T, Moore J. Twitter sentiment analysis: The good the
bad and the omg! In: Proceedings of the International AAAI Conference on Web
and Social Media. vol. 5; 2011.
21. Giachanou A, Crestani F. Like it or not: A survey of twitter sentiment analysis
methods. ACM Computing Surveys (CSUR). 2016;49(2):1–41.
22. Severyn A, Moschitti A. Twitter sentiment analysis with deep convolutional
neural networks. In: Proceedings of the 38th international ACM SIGIR
conference on research and development in information retrieval; 2015. p.
959–962.
April 22, 2021 20/2523. Gorbalenya AE, Baker SC, Baric RS, de Groot RJ, Drosten C, Gulyaeva AA,
et al. The species Severe acute respiratory syndrome-related coronavirus:
classifying 2019-nCoV and naming it SARS-CoV-2. Nature Microbiology.
2020;5(4):536.
24. Monteil V, Kwon H, Prado P, Hagelkrüys A, Wimmer RA, Stahl M, et al.
Inhibition of SARS-CoV-2 infections in engineered human tissues using
clinical-grade soluble human ACE2. Cell. 2020;.
25. Organization WH, et al.. Coronavirus disease 2019 (COVID-19): situation report,
72; 2020. Available from: https://apps.who.int/iris/handle/10665/331685.
26. Cucinotta D, Vanelli M. WHO declares COVID-19 a pandemic. Acta bio-medica:
Atenei Parmensis. 2020;91(1):157–160.
27. Siche R. What is the impact of COVID-19 disease on agriculture? Scientia
Agropecuaria. 2020;11(1):3–6.
28. Richards M, Anderson M, Carter P, Ebert BL, Mossialos E. The impact of the
COVID-19 pandemic on cancer care. Nature Cancer. 2020;1(6):565–567.
29. Tiwari A, Gupta R, Chandra R. Delhi air quality prediction using LSTM deep
learning models with a focus on COVID-19 lockdown. arXiv preprint
arXiv:210210551. 2021;.
30. Shinde GR, Kalamkar AB, Mahalle PN, Dey N, Chaki J, Hassanien AE.
Forecasting models for coronavirus disease (COVID-19): a survey of the
state-of-the-art. SN Computer Science. 2020;1(4):1–15.
31. Rahimi I, Chen F, Gandomi AH. A review on COVID-19 forecasting models.
Neural Computing and Applications. 2021; p. 1–11.
32. Zeroual A, Harrou F, Dairi A, Sun Y. Deep learning methods for forecasting
COVID-19 time-Series data: A Comparative study. Chaos, Solitons & Fractals.
2020;140:110121.
33. Chandra R, Jain A, Chauhan DS. Deep learning via LSTM models for COVID-19
infection forecasting in India. CoRR. 2021;abs/2101.11881.
34. Tiwari A, Gupta R, Chandra R. Delhi air quality prediction using LSTM deep
learning models with a focus on COVID-19 lockdown. CoRR.
2021;abs/2102.10551.
35. Chakraborty K, Bhatia S, Bhattacharyya S, Platos J, Bag R, Hassanien AE.
Sentiment Analysis of COVID-19 tweets by Deep Learning Classifiers—A study
to show how popularity is affecting accuracy in social media. Applied Soft
Computing. 2020;97:106754.
36. Barkur G, Vibha GBK. Sentiment analysis of nationwide lockdown due to
COVID 19 outbreak: Evidence from India. Asian journal of psychiatry.
2020;51:102089.
37. Abd-Alrazaq A, Alhuwail D, Househ M, Hamdi M, Shah Z. Top concerns of
tweeters during the COVID-19 pandemic: infoveillance study. Journal of medical
Internet research. 2020;22(4):e19016.
38. Xue J, Chen J, Chen C, Zheng C, Li S, Zhu T. Public discourse and sentiment
during the COVID 19 pandemic: Using Latent Dirichlet Allocation for topic
modeling on Twitter. PloS one. 2020;15(9):e0239441.
April 22, 2021 21/2539. Hung M, Lauren E, Hon ES, Birmingham WC, Xu J, Su S, et al. Social network
analysis of COVID-19 Sentiments: application of artificial intelligence. Journal of
medical Internet research. 2020;22(8):e22590.
40. Wang T, Lu K, Chow KP, Zhu Q. COVID-19 Sensing: Negative sentiment
analysis on social media in China via Bert Model. Ieee Access.
2020;8:138162–138169.
41. Zhou J, Yang S, Xiao C, Chen F. Examination of community sentiment dynamics
due to Covid-19 pandemic: A case study from australia. arXiv preprint
arXiv:200612185. 2020;.
42. Pokharel BP. Twitter sentiment analysis during covid-19 outbreak in nepal.
Available at SSRN 3624719. 2020;.
43. de Las Heras-Pedrosa C, Sánchez-Núñez P, Peláez JI. Sentiment analysis and
emotion understanding during the covid-19 pandemic in spain and its impact on
digital ecosystems. International Journal of Environmental Research and Public
Health. 2020;17(15):5542.
44. Kruspe A, Häberle M, Kuhn I, Zhu XX. Cross-language sentiment analysis of
European Twitter messages duringthe COVID-19 pandemic. arXiv preprint
arXiv:200812172. 2020;.
45. Yang Q, Alamro H, Albaradei S, Salhi A, Lv X, Ma C, et al. SenWave:
Monitoring the Global Sentiments under the COVID-19 Pandemic. arXiv
preprint arXiv:200610842. 2020;.
46. Li Y, Yang T. Word embedding for understanding natural language: a survey. In:
Guide to big data applications. Springer; 2018. p. 83–104.
47. Kutuzov A, Øvrelid L, Szymanski T, Velldal E. Diachronic word embeddings and
semantic shifts: a survey. arXiv preprint arXiv:180603537. 2018;.
48. Ruder S, Vulić I, Søgaard A. A survey of cross-lingual word embedding models.
Journal of Artificial Intelligence Research. 2019;65:569–631.
49. Zhang Y, Jin R, Zhou ZH. Understanding bag-of-words model: a statistical
framework. International Journal of Machine Learning and Cybernetics.
2010;1(1-4):43–52.
50. Ramos J, et al. Using tf-idf to determine word relevance in document queries. In:
Proceedings of the first instructional conference on machine learning. vol. 242.
Citeseer; 2003. p. 29–48.
51. Goodman JT. A bit of progress in language modeling. Computer Speech &
Language. 2001;15(4):403–434.
52. Guthrie D, Allison B, Liu W, Guthrie L, Wilks Y. A closer look at skip-gram
modelling. In: LREC. vol. 6. Citeseer; 2006. p. 1222–1225.
53. Mikolov T, Sutskever I, Chen K, Corrado G, Dean J. Distributed representations
of words and phrases and their compositionality. arXiv preprint arXiv:13104546.
2013;.
54. Pennington J, Socher R, Manning CD. GloVe: Global Vectors for Word
Representation. In: Empirical Methods in Natural Language Processing
(EMNLP); 2014. p. 1532–1543. Available from:
http://www.aclweb.org/anthology/D14-1162.
April 22, 2021 22/2555. Zhao J, Zhou Y, Li Z, Wang W, Chang KW. Learning gender-neutral word
embeddings. arXiv preprint arXiv:180901496. 2018;.
56. Schwenk H. Continuous space language models. Computer Speech & Language.
2007;21(3):492–518.
57. Wang Y, Liu S, Afzal N, Rastegar-Mojarad M, Wang L, Shen F, et al. A
comparison of word embeddings for the biomedical natural language processing.
Journal of biomedical informatics. 2018;87:12–20.
58. Elman JL, Zipser D. Learning the hidden structure of speech. The Journal of the
Acoustical Society of America. 1988;83(4):1615–1626. doi:10.1121/1.395916.
59. Elman JL. Finding structure in time. Cognitive Science. 1990;14:179–211.
60. Omlin CW, Giles CL. Constructing deterministic finite-state automata in
recurrent neural networks. J ACM. 1996;43(6):937–972.
doi:http://doi.acm.org/10.1145/235809.235811.
61. Omlin CW, Giles CL. Training second-order recurrent neural networks using
hints. In: Proceedings of the Ninth International Conference on Machine
Learning. Morgan Kaufmann; 1992. p. 363–368.
62. Chandra R, Omlin CW. The Comparison and Combination of Genetic and
Gradient Descent Learning in Recurrent Neural Networks: An Application to
Speech Phoneme Classification. In: Proc. of International Conference on
Artificial Intelligence and Pattern Recognition; 2007. p. 286–293.
63. Werbos PJ. Backpropagation through time: what it does and how to do it.
Proceedings of the IEEE. 1990;78(10):1550–1560.
64. Hochreiter S. The vanishing gradient problem during learning recurrent neural
nets and problem solutions. Int J Uncertain Fuzziness Knowl-Based Syst.
1998;6(2):107–116. doi:http://dx.doi.org/10.1142/S0218488598000094.
65. Hochreiter S, Schmidhuber J. Long short-term memory. Neural computation.
1997;9(8):1735–1780.
66. Graves A, Schmidhuber J. Framewise phoneme classification with bidirectional
LSTM and other neural network architectures. Neural networks : the official
journal of the International Neural Network Society. 2005;18:602–10.
doi:10.1016/j.neunet.2005.06.042.
67. Schuster M, Paliwal K. Bidirectional recurrent neural networks. Signal
Processing, IEEE Transactions on. 1997;45:2673 – 2681. doi:10.1109/78.650093.
68. Fan Y, Qian Y, Xie FL, Soong FK. TTS synthesis with bidirectional LSTM
based recurrent neural networks. In: INTERSPEECH; 2014.
69. Graves A, Jaitly N, Mohamed Ar. Hybrid speech recognition with deep
bidirectional LSTM. In: 2013 IEEE workshop on automatic speech recognition
and understanding. IEEE; 2013. p. 273–278.
70. Dembczyński K, Waegeman W, Cheng W, Hüllermeier E. On label dependence
and loss minimization in multi-label classification. Machine Learning.
2012;88(1-2):5–45.
71. Zhang Z, Sabuncu MR. Generalized cross entropy loss for training deep neural
networks with noisy labels. arXiv preprint arXiv:180507836. 2018;.
April 22, 2021 23/2572. Hamers L, et al. Similarity measures in scientometric research: The Jaccard
index versus Salton’s cosine formula. Information Processing and Management.
1989;25(3):315–18.
73. Fürnkranz J, Hüllermeier E, Mencı́a EL, Brinker K. Multilabel classification via
calibrated label ranking. Machine learning. 2008;73(2):133–153.
74. Jeni LA, Cohn JF, De La Torre F. Facing imbalanced data–recommendations for
the use of performance metrics. In: 2013 Humaine association conference on
affective computing and intelligent interaction. IEEE; 2013. p. 245–251.
75. Lewis DD, Schapire RE, Callan JP, Papka R. Training algorithms for linear text
classifiers. In: Proceedings of the 19th annual international ACM SIGIR
conference on Research and development in information retrieval; 1996. p.
298–306.
76. Lancet T. India under COVID-19 lockdown. Lancet (London, England).
2020;395(10233):1315.
77. Unique identification authority of India; 2020. Available from:
https://uidai.gov.in/images/state-wise-aadhaar-saturation.pdf.
78. Jack RE, Garrod OG, Schyns PG. Dynamic facial expressions of emotion transmit
an evolving hierarchy of signals over time. Current biology. 2014;24(2):187–192.
79. Trampe D, Quoidbach J, Taquet M. Emotions in everyday life. PloS one.
2015;10(12):e0145450.
80. Cowen AS, Keltner D. Self-report captures 27 distinct categories of emotion
bridged by continuous gradients. Proceedings of the National Academy of
Sciences. 2017;114(38):E7900–E7909.
81. Wintre MG, Vallance DD. A developmental sequence in the comprehension of
emotions: Intensity, multiple emotions, and valence. Developmental psychology.
1994;30(4):509.
82. Kemper TD. How many emotions are there? Wedding the social and the
autonomic components. American journal of Sociology. 1987;93(2):263–289.
83. Ekman P. An argument for basic emotions. Cognition & emotion.
1992;6(3-4):169–200.
84. Lucas RE, Diener E, Larsen RJ. Measuring positive emotions; 2003.
85. Friedman S. Comedy and distinction: The cultural currency of a ‘Good’sense of
humour. Routledge; 2014.
86. Rossato L, Chiaro D. Audiences and translated humour: An empirical study.
Translation, humour and the media. 2010; p. 121–137.
87. Kuipers G. The politics of humour in the public sphere: Cartoons, power and
modernity in the first transnational humour scandal. European Journal of
Cultural Studies. 2011;14(1):63–80.
88. Chey J. Youmo and the Chinese sense of humour. Humour in Chinese life and
letters: Classical and traditional approaches. 2011;1:1.
89. Clasquin M. Real Buddhas don’t laugh: Attitudes towards humour and laughter
in ancient India and China. Social Identities. 2001;7(1):97–116.
April 22, 2021 24/25You can also read