Atmospheric aerosol, gases, and meteorological parameters measured during the LAPSE-RATE campaign by the Finnish Meteorological Institute and ...
←
→
Page content transcription
If your browser does not render page correctly, please read the page content below
Earth Syst. Sci. Data, 13, 2909–2922, 2021
https://doi.org/10.5194/essd-13-2909-2021
© Author(s) 2021. This work is distributed under
the Creative Commons Attribution 4.0 License.

           Atmospheric aerosol, gases, and meteorological
       parameters measured during the LAPSE-RATE campaign
             by the Finnish Meteorological Institute and
                       Kansas State University
                David Brus1 , Jani Gustafsson1 , Osku Kemppinen2,a , Gijs de Boer3,4 , and Anne Hirsikko1
              1 Finnish  Meteorological Institute, Erik Palménin aukio 1, P.O. Box 503, 00100 Helsinki, Finland
        2 Department   of Physics, Kansas State University, 1228 N. 17th St., 66506, Manhattan, KS 66506-2601, USA
                   3 Cooperative Institute for Research in Environmental Sciences, University of Colorado,

                                          216 UCB, 80309, Boulder, CO 80309, USA
                      4 Physical Sciences Laboratory, National Oceanic and Atmospheric Administration,

                                     325 Broadway, 80305, Boulder, CO 80305-3328, USA
           a currently at: Earth Systems Science Interdisciplinary Center, University of Maryland, 5825 University

                                     Research Ct suite 4001, College Park, MD 20740, USA
                                     Correspondence: David Brus (david.brus@fmi.fi)

                                  Received: 26 August 2020 – Discussion started: 8 October 2020
                             Revised: 12 May 2021 – Accepted: 24 May 2021 – Published: 17 June 2021

       Abstract. Small unmanned aerial systems (sUASs) are becoming very popular as affordable and reliable obser-
       vation platforms. The Lower Atmospheric Process Studies at Elevation – a Remotely-piloted Aircraft Team
       Experiment (LAPSE-RATE), conducted in the San Luis Valley (SLV) of Colorado (USA) between 14 and
       20 July 2018, gathered together numerous sUASs, remote-sensing equipment, and ground-based instrumen-
       tation. Flight teams from the Finnish Meteorological Institute (FMI) and the Kansas State University (KSU)
       co-operated during LAPSE-RATE to measure and investigate the properties of aerosol particles and gases at the
       surface and in the lower atmosphere. During LAPSE-RATE the deployed instrumentation operated reliably, re-
       sulting in an observational dataset described below in detail. Our observations included aerosol particle number
       concentrations and size distributions, concentrations of CO2 and water vapor, and meteorological parameters.
          All datasets have been uploaded to the Zenodo LAPSE-RATE community archive (https://zenodo.org/
       communities/lapse-rate/, last access: 21 August 2020). The dataset DOIs for FMI airborne measurements and
       surface measurements are available here: https://doi.org/10.5281/zenodo.3993996, Brus et al. (2020a), and those
       for KSU airborne measurements and surface measurements are available here: https://doi.org/10.5281/zenodo.
       3736772, Brus et al. (2020b).

1   Introduction                                                  energy and terrain inhomogeneity; Carbone et al., 2010). Re-
                                                                  moval of aerosol particles and gases from the atmosphere
The concentration of aerosol particles released from pri-         depends mostly on dispersion rates, transport, deposition,
mary sources or formed by gas–liquid conversion and vari-         and other atmospheric dynamical properties (Tunved et al.,
ous trace gases characterize the air quality worldwide. At the    2013). To understand the formation and removal of particles
same time, planetary boundary layer (PBL) mixing height           and gases, it is therefore necessary to measure their proper-
and lower atmospheric wind speed and direction are influ-         ties and the atmospheric conditions supporting those proper-
enced by a variety of factors (e.g., solar and surface stored     ties throughout the vertical profile. In situ observation of PBL

Published by Copernicus Publications.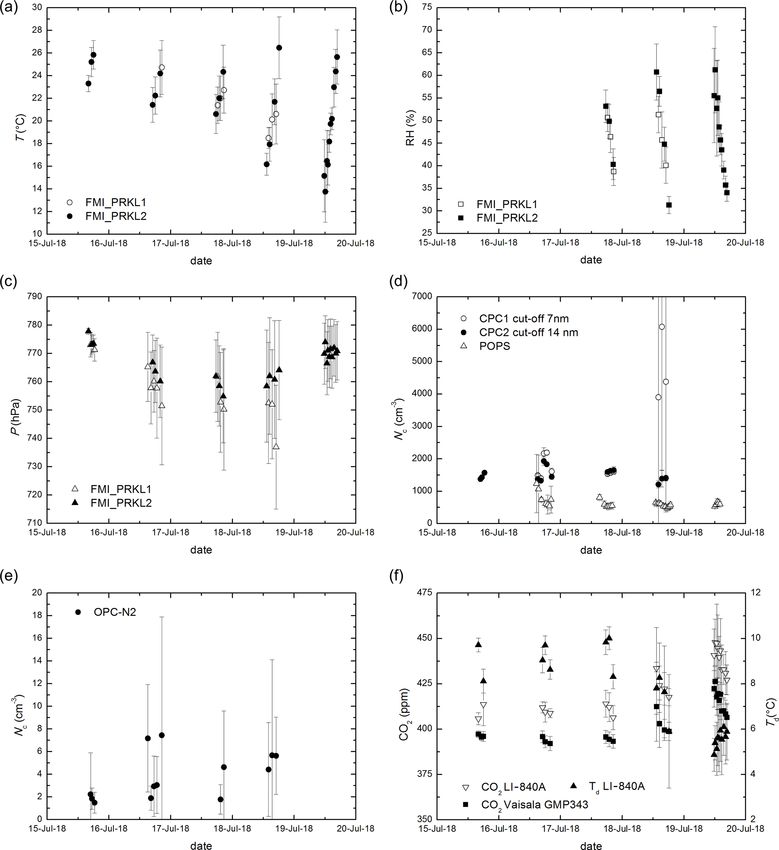
2910                          D. Brus et al.: Aerosol, gases, and meteorological parameters measured during LAPSE-RATE

properties are obtained through various techniques, includ-          in Brus et al. (2021). Routine lower-atmospheric profiling
ing balloon soundings, tethersondes, dropsondes and hot-air          allowed our team to document particle sizes and concen-
balloons (e.g., Laakso et al., 2007; Greenberg et al., 2009;         trations, including the occurrence of new particle formation
Nygård et al., 2017), towers (e.g., Heintzenberg et al., 2011;       (NPF) events, and the connection of these phenomena to
Andreae et al., 2015), and recently by unmanned aerial sys-          boundary layer and synoptic wind regimes.
tems (UASs) (e.g., Ramanathan et al., 2007; Jonassen et al.,
2015; Kral et al., 2018; Nolan et al., 2018; Barbieri et al.,
2019; de Boer et al., 2020a; Girdwood et al., 2020; Harrison         2   Description of platforms, modules, and sensors
et al., 2021; Jensen et al., 2021; Pinto et al., 2021; Wenta et
al., 2021).                                                          The FMI team deployed two rotorcraft (FMI-PRKL1 and
   Land–air interactions, including influences of continen-          FMI-PRKL2) during LAPSE-RATE. Both rotorcraft were
tal, inhomogeneous terrain on lower atmospheric thermo-              custom-built around the Tarot X6 hexacopter frame, which
dynamic and kinematic states and the vertical distribution           was 960 mm in diameter (rotor-to-rotor). The maximum en-
of aerosol and gas properties, were investigated during the          durance of these rotorcraft was about 15 min using 22.2 V,
LAPSE-RATE field campaign. LAPSE-RATE took place in                  16000 mAh rechargeable lithium polymer (LiPo) batteries.
the greater San Luis Valley (SLV), Colorado, between 14 and          The maximum take-off weight for these rotorcraft was 11 kg.
20 July 2018. The campaign was organized in conjunction              Flights were carried out using a 3DR Pixhawk PX4 flight
with the Sixth Conference of the International Society for           controller with the Ardupilot software, in a manual (stabi-
Atmospheric Research using Remotely piloted Aircraft (IS-            lized) mode for FMI-PRK1 and loiter (GPS position fix)
ARRA; de Boer et al., 2020a). Daily operational plans were           mode for FMI-PRKL2. The same propulsion system, consist-
developed and executed to observe several atmospheric phe-           ing of 340 kV brushless motors, 40A electronic speed con-
nomena, including boundary layer evolution during morning            trollers, and 18 in. (0.46 m) (5.5 in. – 0.14 m – pitch) carbon
hours, the diurnal cycle of valley flows, convective initiation,     fiber propellers, was used for both rotorcraft. The rotorcraft’s
and the properties of gases and aerosol particles (de Boer et        setup allowed for lifting approximately 2 kg of active payload
al., 2020b). LAPSE-RATE flights were conducted under both            (i.e., scientific instrumentation). The overview of FMI-KSU
Federal Aviation Administration (FAA) Certificates of Au-            team instrumentation and their operational characteristics are
thorization (COAs) and FAA Part 107, with the COAs allow-            summarized in Table 1.
ing maximum flight altitudes of 914 m above the ground level            The first rotorcraft (FMI-PRKL1) was equipped with a
(a.g.l.). In addition to the airborne assets, a variety of ground-   particle measurement module consisting of two condensa-
based observational assets were deployed (see de Boer et al.,        tional particle counters (CPCs; model 3007, TSI Corp.), a
2020b, 2021; Bell et al., 2021, for details). The FMI-KSU            factory-calibrated optical particle counter (OPC; model N2,
(Finnish Meteorological Institute and Kansas State Univer-           Alphasense), and a meteorological Arduino breakout (Bosch
sity) flight team consisted of two operators from the FMI and        BME280, P , T , and RH – pressure, hPa, temperature, ◦ C,
one operator from the KSU. The main objective of the FMI-            and relative humidity, %, respectively). Each CPC sampled
KSU team during LAPSE-RATE was to provide the physical               at a frequency of 1 Hz and was adjusted at FMI to a dif-
characterization of aerosol properties in vertical column, ex-       ferent cut-off diameter: 7 and 14 nm. Such a configuration
cept on 19 July when the team joined the common effort to            allows for the observation of freshly nucleated particles in
focus on cold-air drainage flows that are set up during the          a diameter range of 7 to 14 nm (see, e.g., Altstädter et al.,
nighttime.                                                           2015, 2018). The voltage applied to a thermal electric de-
   In general, there was very little known about the back-           vice (TED) of the CPC corresponds directly to the tempera-
ground aerosol concentrations within the SLV from the lit-           ture difference between the saturator and condenser and de-
erature. The aerosol and generally any air quality measure-          termines how fast particles grow to CPC-detectable sizes.
ments are very sparse in Colorado and are mostly con-                The TED values of 2000 and 1000 mV were used for CPC1
centrated around larger cities. However, a variety of pri-           and CPC2, respectively, during the campaign. Each of the
mary and secondary aerosol particle sources in the SLV, in-          CPCs used a 30 cm inlet made of conductive tubing, led from
cluding agriculture, the Great Sand Dunes National Park,             the sides upwards to the top center of the rotorcraft where
wildfires, biogenic emissions, and large-scale advection of          both lines were merged to an additional 10 cm piece of con-
particles from the deserts and mountainous regions of the            ductive inlet tubing, also facing upwards and ending about
western United States, made this an interesting location to          10 cm above propeller’s plane. Penetration for such an in-
characterize aerosol properties and their variability. Coupled       let was estimated to be between 90 % and 99 % for particles
with the substantial summer diurnal cycles in atmospheric            with a diameter between 7 and 100 nm and 99 % for parti-
temperature, humidity, turbulence, and thermodynamic mix-            cles with a diameter between 100 nm and 1 µm. The OPC-N2
ing, as well as the frequent occurrence of thunderstorms in          was sampling with 0.5 Hz in 16 size bins with mid-bin diam-
the mountains surrounding the SLV, aerosol properties were           eters of 0.46, 0.66, 0.92, 1.19, 1.47, 1.83, 2.54, 3.5, 4.5, 5.75,
found to vary over the course of the week, as documented             7.25, 9, 11, 13, 15, and 16.75 µm. The particle module was

Earth Syst. Sci. Data, 13, 2909–2922, 2021                                            https://doi.org/10.5194/essd-13-2909-2021
D. Brus et al.: Aerosol, gases, and meteorological parameters measured during LAPSE-RATE                                           2911

Table 1. An overview of sensors and their operational characteristics provided by manufacturer. The sensor use in airborne and/or ground-
based measurements is specified in the sensor name column as mission: a – airborne and/or g – ground-based.

                                                                                                                             Response
   Sensor                     Resolution             Accuracy                    Range                           Flow rate       time
   CPC, TSI 3007
   Particle conc. (cm−3 )                                                        0–105 cm−3 ,                  0.7 L min−1         1s
   Mission: a and g                                                              Diameter: 0.01– > 1 µm
   OPC, Alphasense N2
   Particle conc. (cm−3 )                                                        0–104 part s−1 ,              1.2 L min−1         1s
   Mission: a and g                                                              Diameter: 0.38–17 µm
                                                                                 at 16 bins
   BME280
   T (◦ C)                    0.01                   ±0.5 ◦ C                    −40–85 ◦ C                                        1s
   RH (%)                     < 0.01                 ±3 %                        0 %–100 %                                         1s
   Pressure (hPa)             0.18 Pa                ±1 hPa                      300–1100 hPa                                    6 ms
   Mission: a and g
   GMP343, Vaisala
   CO2 (ppm)                  14 bits                ±3 ppm +1 % of reading      0–1000 ppm                     0.6 L m−1          2s
   Mission: a
   LI-840A, LI-COR
   CO2 (ppm)                  14 bits across user-   < 1.5 % of reading          0–20 000 ppm                   0.6 L m−1          1s
                              specified range
   Td (◦ C)                   14 bits across user-   < 1.5 % of reading          −25–45 ◦ C,                    0.6 L m−1          1s
   Mission: a                 specified range                                    RH: 0 %–95 % RH
                                                                                 Non-condensing
   TriSonica mini weather station, Applied Tech.
   T (◦ C)                    0.1                    ±2 ◦ C                      −25–80 ◦ C                                        1s
   RH (%)                     0.1                    ±3 %                        0 %–100 %                                         1s
   Pressure (hPa)             1                      ±10 hPa                     500–1150 hPa                                      1s
   Wind speed (m s−1 )        0.1                    ±0.1 m s−1                  0–30 m s−1                                        1s
   Wind direction (◦ )        1                      ±1◦                         x/y: 0–360◦ ,                                     1s
   Mission: g                                                                    z: ±30◦
   Portable optical particle spectrometer, Handix Sci.
   Particle conc. (cm−3 )                            ±10 % < 1000 cm−3           0–1250 cm−3 ,                0.18 L min−1         1s
   Mission: a and g                                  at 0.1 L m−1                Diameter: 0.13–3 µm
                                                                                 at 16 bins

covered from all sides except the bottom with a polylactide                 The second rotorcraft (FMI-PRKL2) was equipped with a
(PLA) foam cover (2.5 cm thick) to shade the sensors from                 gas module, consisting of a flow-through CO2 concentration
direct sun and keep the particle module thermally stable. The             sensor (CARBOCAP® model GMP343, Vaisala Inc.), a
BME280 sensor sampled with 1 Hz, and it was located below                 CO2 and water vapor analyzer (model LI-840A, LI-COR
the particle module and was shielded from solar radiation but             Environmental), and a sensor for measuring concentrations
not forcefully aspirated.                                                 of CO, NO2 , SO2 , and O3 (model AQT400, Vaisala Inc.).
                                                                          A meteorological Arduino breakout (Bosch BME280) was

https://doi.org/10.5194/essd-13-2909-2021                                                Earth Syst. Sci. Data, 13, 2909–2922, 2021
2912 D. Brus et al.: Aerosol, gases, and meteorological parameters measured during LAPSE-RATE
used to measure P , T , and RH. The BME280 sensor was data to an onboard micro SD card with a frequency of 1 Hz.
mounted identically to the BME280 on the FMI-PRKL1. POPS was attached to the top surface of the rotorcraft body
Unfortunately, we were not able to acquire vertical profiles with Velcro tape. It was not shielded from direct sunlight dur-
nor the ground level concentrations of gases with the Vaisala ing the flights but was kept in shade while on the ground. A
AQT400 sensor during LAPSE-RATE. All recorded concen- duplicate POPS instrument was operated as a ground refer-
trations of gases (NO2 , O3 , CO, and SO2 ) were far below ence, and it was located approximately 1.8 m a.g.l. and used
the manufacturer-declared detection limits, which is why a vertically oriented tube inlet approximately 45 cm (18 in.)
no dataset for the Vaisala AQT400 sensor is provided. long with an inner diameter of 3.175 mm (0.125 in.). The
Both CO2 sensors were forcefully aspirated using penetration through the inlet was estimated to be 92 % for
micro-blowers configured as air pumps (Murata, model particles with diameters of 3 µm and better for smaller ones.
MZB1001T02) connected to the exhaust of the sensors
with a flow rate of 0.6 L min−1 . A Gelman filter (1 µm
filter assembly, LI-COR Environmental) was placed in the 3 Description of measurement location, flight
sample airstream in front of both CO2 sensors to avoid strategies, and completed sampling
contamination of the optical path. The sampling frequencies
of GMP343, Li-804A, and BME280 were 0.5, 1, and 1 Hz, As mentioned above, the San Luis Valley (SLV) provided
respectively. a variety of aerosol particle sources, sinks, and processing
A third FMI module was operated on the ground. It con- modes. In combination, the variability resulting from this
sisted of a condensational particle counter (CPC; model processing made the San Luis Valley an interesting place to
3007, TSI Corp.), an optical particle counter (OPC; model study aerosol properties and their spatial and temporal vari-
N2, Alphasense), and a TriSonica mini weather station (Ap- ability. One of the main sources of income for San Luis Val-
plied Technologies, Inc.). Both OPC-N2s, in the particle and ley inhabitants comes from farming and ranching. The pri-
ground modules, were used with no additional inlet, as those mary crops grown here include potatoes, alfalfa, native hay,
OPCs were not meant to be used with any kind of inlet due to barley, wheat, quinoa, and vegetables like lettuce, spinach,
the use of a fan for aerosol intake. The surface sensor module and carrots. Crops are irrigated by surface flooding water but
was covered from all sides with PLA foam (2.5 cm thick) to mainly by center pivot sprinklers. Uncultivated land is of-
shade the sensors from direct sun and keep the particle mod- ten covered with low brush such as rabbitbrush, greasewood,
ule thermally stable. The surface module was placed on the and other woody species. The land is also heavily used for
roof top of a car at about 2 m from the ground, the TriSonica grazing (U.S. Fish and Wildlife Service, 2015, and references
mini weather station was mounted on a 45 cm long carbon therein). The soils of the SLV are generally coarse, gravelly,
fiber tube on top of the surface sensor module, i.e., about or sandy soils or loam, and they are derived mainly from vol-
2.75 m from the ground. The data of all sensors included in canic rocks (Lapham, 1912).
the surface module were saved at 1 min resolution. The FMI-KSU team operated from one location through-
Data of both FMI rotorcraft and the FMI surface sen- out the entire LAPSE-RATE campaign. This location was
sor module were logged separately to embedded Rasp- situated along County Road 53, approximately 15 km
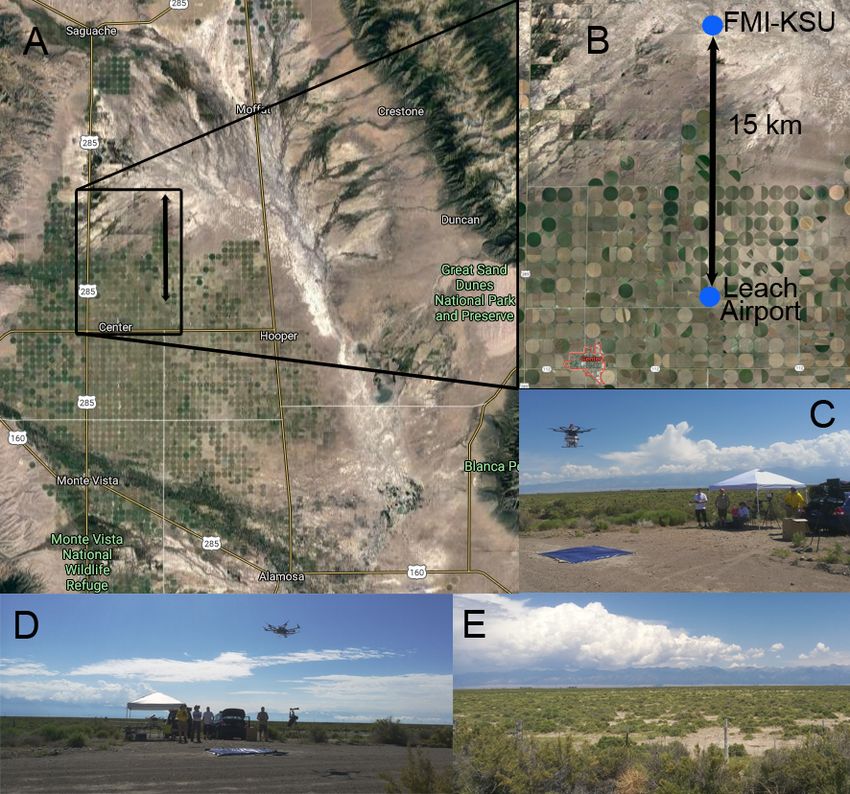
berry Pi 3+ minicomputers using Python scripts to produce N of Leach Airport (37◦ 540 32.9400 N, 106◦ 20 6.8300 W;
ASCII comma-separated files, which were later converted to 2291 m m.s.l., above mean sea level; see Fig. 1). The loca-
NetCDF format. tion was flat and treeless, surrounded by grazing farmlands
The KSU used a DJI Matrice 600 Pro rotorcraft with- and generally very quiet. Occasionally the site experienced
out any modifications beyond the payload attachments, with emissions and aerosol production from the operation of lo-
the aircraft controlled with the Matrice 600 Pro remote con- cal farm trucks. The FMI team was permitted to operate to a
troller. Both DJI TB47S (6 × 4500 mAh, 22.2 V) and DJI maximum altitude of 914 m a.g.l. under an FAA COA; how-
TB48S (6×5700 mAh, 22.8 V) rechargeable lithium polymer ever the aircraft was only flown to a maximum altitude of
batteries were used, alternating between flights. The maxi- 893 m a.g.l. All flights operated by the KSU team were con-
mum gross take-off weight recommended by the manufac- ducted up to a maximum altitude of 121 m a.g.l., the maxi-
turer is 15.5 kg, resulting in a maximum payload capacity of mum altitude permitted under FAA Part 107.
roughly 5.5 kg. The Matrice 600 Pro of KSU was equipped During 15–18 July the FMI-KSU team conducted mis-
with a portable optical particle spectrometer (POPS; Handix sions focusing on the profiling of aerosol particle and gas
Scientific, LLC) measuring in the diameter size range of properties. In total, the FMI team completed 38 vertical pro-
0.13–3 µm in 16 size bins with mid-bin diameters of 0.138, file flights: 14 flights with the particle module and 24 flights
0.151, 0.166, 0.183, 0.200, 0.219, 0.250, 0.297, 0.399, 0.534, with the gas module (see Table 2). The KSU team completed
0.802, 1.15, 1.47, 1.893, 2.506, and 3.26 µm. During LAPSE- a total of 33 flights with their payload, including 40 individ-
RATE the POPS used a horizontally oriented naked inlet ap- ual vertical profiles. It should be noted that some of these
proximately 9 cm (3.5 in.) long with an inner diameter of KSU profiles were redundant, made within a few minutes of
1.7 mm (0.069 in.). POPS included electronics, and logged each other, and repeated in the exact same location as another
Earth Syst. Sci. Data, 13, 2909–2922, 2021 https://doi.org/10.5194/essd-13-2909-2021D. Brus et al.: Aerosol, gases, and meteorological parameters measured during LAPSE-RATE 2913 Figure 1. (a) Map of the wider San Luis Valley, CO, and (b) map cutout of FMI-KSU team location – 15 km N of Leach airport, located approximately 3.2 km ENE of the commercial district of Center, Colorado, and 32 km NNW of Alamosa, Colorado. © Google Maps (c) FMI- KSU team operation spot NE view, (d) FMI-KSU team operation spot view towards E, (e) view of typical surroundings of FMI-KSU team spot. profile. These redundant flights were completed to test the in- on timing, frequency, and achieved altitude of all flights). The strument consistency. It was found that POPS was counting FMI surface module and KSU surface POPS were logging consistently during vertical sampling, but during the horizon- continuously during the time periods of flight operations (see tal transects, when the POPS inlet was facing the direction of Table 3 for details). flight, we found fluctuations in POPS-measured sample flow On the last day of FMI-KSU operations during LAPSE- rate. Only vertical profile data are included in the dataset. The RATE (19 July), the team joined the common effort to eval- FMI flight strategy was to conduct only vertical flights and uate cold-air drainage from local valleys during the morning reach as high an altitude as possible in a very short time. FMI hours. The operation started about 11:45 UTC (05:45 local ascent rates were between 5 and 8 and 3–5 m s−1 and descent time) with vertical profiles every 30 min lasting about 5 h. rates were about 2–5 and 2–3 m s−1 for flights with the par- Only the FMI-PRKL2 and KSU rotorcraft took part in these ticle module (FMI-PRKL1) and gas module (FMI-PRKL2), cold-air drainage flights in an alternating fashion. For these respectively. Vertical profiling was performed in cycles by flights ascent and descent rates were reduced to about 2 m s−1 alternating flights with the aircraft carrying the FMI particle given that the target maximum altitude during these flights module, the FMI gas module, and the KSU platform, with only extended to 350 m a.g.l. about 30 min in between flights (please see Table 2 for details https://doi.org/10.5194/essd-13-2909-2021 Earth Syst. Sci. Data, 13, 2909–2922, 2021
2914                          D. Brus et al.: Aerosol, gases, and meteorological parameters measured during LAPSE-RATE

Table 2. UAS vertical profile measurements – an overview of platforms, missions, flight times, and achieved altitudes.

    Platform        Mission            Date            Start time (UTC)     End time (UTC)     Altitude (m m.s.l.)   Altitude (m a.g.l.)
    FMI-PRKL1       Aerosols/meteo     15 July 2018    16:51:49             16:56:55                     2483.49                175.49
                                                       17:24:40             17:32:00                     2436.60                128.60
                                                       18:24:54             18:33:12                     2449.68                141.68
                                       16 July 2018    15:06:47             15:14:55                     2819.67                511.67
                                                       16:20:53             16:29:21                     2823.44                515.44
                                                       17:30:33             17:41:14                     2730.81                422.81
                                                       18:37:31             17:47:36                     2949.73                641.73
                                                       20:33:20             20:42:56                     2994.55                686.55
                                       17 July 2018    18:17:18             18:26:03                     2924.22                616.22
                                                       19:24:35             19:35:13                     2992.33                684.33
                                                       20:41:37             20:53:53                     3119.02                811.02
                                       18 July 2018    14:03:55             14:14:33                     3155.00                847.00
                                                       15:26:03             15:36:27                     3028.59                720.59
                                                       16:59:06             17:05:55                     3201.53                893.53
    FMI-PRKL2       Gases/meteo        15 July 2018    16:02:28             16:06:28                     2356.88                 48.88
                                                       17:12:39             17:17:13                     2441.78                133.78
                                                       17:59:24             18:05:11                     2409.02                101.02
                                       16 July 2018    17:00:44             17:08:28                     2675.27                367.27
                                                       18:00:08             18:08:55                     2703.60                395.60
                                                       19:57:24             20:06:33                     2781.37                473.37
                                       17 July 2018    17:37:19             17:46:52                     2773.00                465.00
                                                       18:53:43             19:02:34                     2814.49                506.49
                                                       20:27:20             20:36:53                     2910.11                602.11
                                       18 July 2018    13:19:00             13:31:21                     2971.37                663.37
                                                       14:29:00             14:44:16                     3004.27                696.27
                                                       16:25:00             16:40:26                     3013.40                705.40
                                                       18:10:00             18:24:36                     2912.85                604.85
                                       19 July 2018    11:44:33             11:53:42                     2669.10                361.10
                                                       12:07:00             12:24:09                     2658.34                350.34
                                                       12:46:00             12:53:43                     2667.16                359.16
                                                       13:08:00             13:19:10                     2666.06                358.06
                                                       13:41:00             13:49:25                     2667.75                359.75
                                                       14:11:00             14:22:36                     2669.65                361.65
                                                       14:42:00             14:55:43                     2664.22                356.22
                                                       15:30:00             15:45:19                     2657.98                349.98
                                                       16:12:00             16:22:25                     2658.15                350.15
                                                       16:42:00             16:53:32                     2663.10                355.10

4   Data processing and quality control                                 (hPa), and relative humidity (%). Finally, these files include
                                                                        the total particle concentration measured by the pair of CPCs
                                                                        (model 3007, TSI Inc.). As a reminder, these two CPCs had
Data files generated by the FMI particle module (FMI-
                                                                        different cut-off diameters (D50 ) at 7 and 14 nm (the lower
PRKL1) were formatted in NetCDF format and were named
                                                                        size boundaries), with the upper boundary particle size more
according to the general naming convention for the LAPSE-
                                                                        than 1 µm. The CPC calibration was done in the same way
RATE files (FMI.PRKL1.a1.yyyy.mm.dd.hh.mm.ss.cdf), as
                                                                        as described in Hämeri et al. (2002); the uncertainty of D50
outlined in de Boer et al. (2020b). Missing data in the dataset
                                                                        values was determined to be ±0.8 nm. The total count was
are marked as −9999.9. These files include the Raspberry
                                                                        compared to a desktop, full-sized, more precise CPC (model
Pi real-time clock (RTC) time stamp, aircraft location (GPS
                                                                        3772, TSI Corp.) with an accuracy of about 20 % when the
latitude and longitude in degrees and altitude in m m.s.l.),
                                                                        ambient air was sampled.
and basic meteorology including temperature (◦ C), pressure

Earth Syst. Sci. Data, 13, 2909–2922, 2021                                               https://doi.org/10.5194/essd-13-2909-2021
D. Brus et al.: Aerosol, gases, and meteorological parameters measured during LAPSE-RATE 2915
Table 2. Continued.
Platform Mission Date Start time (UTC) End time (UTC) Altitude (m m.s.l.) Altitude (m a.g.l.)
KSU POPS Aerosols 16 July 2018 14:40:46 14:49:51 2401.3 125.4
15:23:44 15:37:17 2419.4 142.4
16:32:25 16:41:06 2410.6 126.6
18:17:44 18:24:58 2416.7 126.4
19:01:43 19:09:54 2333.0 39.4
19:43:41 19:47:18 2354.6 52.1
20:17:20 20:22:46 2429.7 126.8
17 July 2018 15:10:38 15:24:49 2401.3 125.7
17:02:14 17:09:42 2401.6 129.0
17:58:12 18:04:40 2403.5 127.5
18:29:15 18:40:16 2379.9 100.0
19:15:14 19:26:11 2417.7 131.3
20:03:59 20:09:49 2424.7 127.4
18 July 2018 12:59:49 13:04:27 2397.5 127.4
13:31:21 13:42:29 2398.4 127.2
14:16:06 14:22:23 2400.8 131.3
14:58:05 15:02:03 2394.9 126.2
15:59:52 16:08:59 2402.2 127.2
16:44:06 16:46:37 2408.2 128.2
17:30:21 17:38:37 2408.4 126.4
17:59:11 18:03:40 2415.5 128.6
18:29:37 18:33:06 2417.9 126.5
18:45:25 18:49:16 2419.4 126.1
19 July 2018 12:01:01 12:05:05 2433.6 138.8
12:28:54 12:31:35 2435.9 142.8
12:59:42 13:02:06 2429.7 139.1
13:29:40 13:32:18 2427.4 139.0
13:59:47 14:02:37 2425.1 137.4
Table 3. Surface measurements at altitude 2291 m m.s.l. – overview of platform and data coverage.
Platform Date Start time (UTC) End time (UTC)
FMI surface module 15 July 2018 15:34:35 19:36:35
16 July 2018 14:45:29 22:10:47
17 July 2018 17:01:53 21:08:15
18 July 2018 13:03:29 19:05:08
19 July 2018 11:37:20 16:56:36
KSU POPS surface 16 July 2018 15:52:34 16:16:44
17 July 2018 18:17:46 20:31:13
18 July 2018 13:30:39 18:13:44
NetCDF files created from the measurements of the OPC- in 16 size bins with mid-bin diameters of 0.46, 0.66, 0.92,
N2 particle counter were saved separately under the file 1.19, 1.47, 1.83, 2.54, 3.5, 4.5, 5.75, 7.25, 9, 11, 13, 15,
name FMI.PRKL1OPC-N2.a1.yyyy.mm.dd.hh.mm.ss.cdf. and 16.75 µm, the calculated dN/d log Dp (cm−3 ) values in
These files include the time stamp, aircraft location (GPS each size bin, and measured PM1 , PM2.5 , and PM10 mass
latitude and longitude in degrees and altitude in meters), concentrations (in µg m−3 ), respectively. The positioning
total aerosol number concentration (in cm−3 ), and total data were provided in the files as they were measured,
aerosol volumetric concentration (in µ m3 cm−3 ), both in a meteorological parameters were cleaned of outliers and
size range of 0.38–17 µm. Also included are particle number no corrections were applied, and particle concentrations
concentrations (cm−3 ) in each bin, including measurements
https://doi.org/10.5194/essd-13-2909-2021 Earth Syst. Sci. Data, 13, 2909–2922, 20212916 D. Brus et al.: Aerosol, gases, and meteorological parameters measured during LAPSE-RATE were cleaned of extremely high peaks caused by vehicle yyyymmdd.hhmmss.cdf) include the Raspberry Pi RTC emissions. time stamp, wind speed (m s−1 ), wind direction (deg), The FMI gas module dataset temperature (◦ C), relative humidity (%), and pressure (FMI.PRKL2.a1.yyyy.mm.dd.hh.mm.ss.cdf) includes (hPa) measured by the Trisonica mini weather sta- NetCDF files. Missing data in the dataset are marked as tion. Also saved is the total aerosol number concentra- −9999.9. These files include the Raspberry Pi RTC time tion (cm−3 ) measured by CPC (model 3007, TSI Inc.). stamp, aircraft location (GPS latitude and longitude in de- The second ground module dataset (FMI.GROUNDOPC- grees and aircraft altitude in m m.s.l.), and basic meteorology N2.a1.yyyymmdd.hhmmss.cdf) includes the Raspberry Pi including temperature (in ◦ C), pressure (in hPa), and relative RTC time stamp, total aerosol number concentration (cm−3 ), humidity (in %). Additionally, for both aircraft FMI-PRKL1 and total aerosol volumetric concentration (µm3 cm−3 ) in and FMI-PRKL2 identically, aircraft attitude data (pitch, a size range of 0.38–17 µm. Also included are the particle roll, yaw, and heading in degrees, GPS ground speed in number concentrations in each bin (16 size bins), calculated m s−1 , and vertical ascent rate also in m s−1 ) are included dN/d log Dp (cm−3 ) values in each bin (16 size bins), and in these data files. The attitude data are published as they the measured PM1 , PM2.5 , and PM10 mass concentrations were recorded without any corrections. Also included are the (µg m−3 ) respectively. Missing data in both of these datasets measured CO2 concentration in parts per million (ppm) and are marked as −9999.9. dew point temperature in (◦ C) as measured by the LI-COR The KSU airborne dataset LI-840A. The CO2 concentrations measured by the LI-COR (KSU.M600POPS.a1.yyyymmdd.hhmmss.cdf) includes LI-840A are internally compensated for in the cases of water the POPS internal RTC time stamp, aircraft location (GPS vapor concentration, pressure changes, and atmospheric altitude, m m.s.l., altitude, m a.g.l., latitude and longitude, temperature (for details please see the LI-COR LI-840A deg), total aerosol particle count, and total aerosol particle instruction manual). Data from the Vaisala GMP343 sensor concentration (cm−3 ) in the size range 0.13–3 µm. Also were compensated for pressure, temperature, RH (obtained included are atmospheric pressure (hPa), internal airflow from the BME280 sensor), and oxygen in post-processing (cm3 s−1 ), counts per bin (16 size bins), and calculated by using the proprietary compensation algorithm provided dN/d log Dp (cm−3 ) values in each bin (16 size bins). by Vaisala. Even though the BME280 sensor showed a bias Additionally, the KSU ground dataset of about +2 ◦ C in temperature, −12 % in RH, and +2 hPa (KSU.SURFACEPOPS.a1.yyyymmdd.hhmmss.cdf) in- in pressure during the LAPSE-RATE inter-comparison cludes POPS internal RTC time stamp, total aerosol particle measurements (Barbieri et al., 2019), the bias impact on count in the diameter size range 0.13–3 µm, total aerosol compensation was minimal, less than 1 %. Even when particle concentration (cm−3 ) in the diameter size range accounting for the maximum error in T , RH, and P , the 0.13–3 µm, pressure (hPa), internal airflow (cm3 s−1 ), counts resulting change (increase) in CO2 concentration was only per bin (16 size bins), and calculated dN/d log Dp (cm−3 ) 2 ppm. Furthermore, both CO2 sensors were calibrated in values in each bin (16 size bins with mid-bin diameters the laboratory before and after LAPSE-RATE and showed of 0.138, 0.151, 0.166, 0.183, 0.200, 0.219, 0.250, 0.297, no drift in calibration. The sensors were calibrated against 0.399, 0.534, 0.802, 1.15, 1.47, 1.893, 2.506, and 3.26 µm). standard carbon dioxide gases (traceable to World Meteoro- The datasets were cleaned of the outliers and extremely logical Organization, WMO, CO2 scale X2007 at the FMI) high particle concentrations caused by vehicle emissions; no at several concentrations (zero gas and 436 ppm before the additional corrections were applied to data. campaign and 370, 405.4, and 440.2 ppm after the cam- paign). The following, laboratory-derived calibration con- Dataset remarks stants were applied to the datasets collected by both sensors: Licornew = 0.95785× Licormeasured + 8.66055 with R 2 = Throughout the collected dataset, there were occasional 0.9999 and GMPnew = 0.99878× GMPcompensated + 8.77014 peaks in detected aerosol number concentration caused by with R 2 = 0.99999. Please note that GMPcompensated used in farm vehicles passing our sampling location. Some of these the equation above and the Vaisala compensation algorithm peaks resulted in particle counts up to 40 000 cm−3 from the are confidential. Also, both sensors were tested in the FMI CPC and up to 16 000 cm−3 from the POPS. These peaks typ- lab at sea level pressure against a calibrated, high-precision ically lasted approximately 3 min and were removed from the gas concentration analyzer (Picarro model G2401, Picarro, datasets. Also, a short inter-comparison (about 5 min) was Inc.) at ambient CO2 concentration. The GMP343 data were performed before each flight among the surface and airborne biased on average −3.4 (±1.3) ppm and the LI-COR 0.3 particle counters to check their performance. Based on data (±1.1) ppm. The dew point measurement from the LI-COR post-processing, the CPCs of particle and surface modules LI-840A was calibrated against a DewMaster chilled mirror compared well within the article-stated uncertainty of 10 %, hygrometer (Edgetech Instruments Inc.). except for 16 July when NPF at the surface level took place. Measurements collected by the FMI ground module This is due to different calibrated cut-off diameters of each (NetCDF file names FMI.GROUNDTRISONICA-CPC.a1. CPC. The OPCs compared within factor of 2; however it has Earth Syst. Sci. Data, 13, 2909–2922, 2021 https://doi.org/10.5194/essd-13-2909-2021
D. Brus et al.: Aerosol, gases, and meteorological parameters measured during LAPSE-RATE                                             2917

Figure 2. Overview of data collected in vertical profile: mean values with standard deviations as error-bars: (a) temperature, (b) relative
humidity, (c) pressure, (d) total aerosol number concentration by CPCs and POPS (0.13–3 µm) – note the elevated concentration measured
by CPC1 characterizing the NPF event – (e) aerosol number concentration by OPC-N2 (0.3–18 µm), and (f) CO2 concentration by LI-COR
LI-840A and Vaisala GMP343 and dew point temperature by LI-COR LI-840A.

to be considered that very low particle concentrations were                Data from the Vaisala GMP343 probe suffer from an inac-
measured, about 2 cm−3 in the OPCs size range. There were               curate pressure compensation algorithm provided by Vaisala.
no inter-comparison measurements made for POPS instru-                  As mentioned above, the GMP343 performed well at the sea
ments. For more details please see Supplement of Brus et al.            level; however the bias increased with elevation. Therefore,
(2021), where the detailed analysis was provided.                       we recommend the use of LI-COR LI-840A data over those
   Since hysteresis in T and RH profiles collected by both              from the Vaisala GMP343 probe.
FMI aircraft was noticeable, we recommend to use only data                 The merged datasets on meteorology, aerosol, and gas con-
from the ascending portion of the flown profiles. The ascent            centrations are presented in Figs. 2 and 3 for airborne and
data copied quite well the T and RH slopes compared to bal-             surface measurements respectively.
loon sounding profiles made from Leach Airport. The de-
scent data were found to be rather flat.

https://doi.org/10.5194/essd-13-2909-2021                                               Earth Syst. Sci. Data, 13, 2909–2922, 2021
2918 D. Brus et al.: Aerosol, gases, and meteorological parameters measured during LAPSE-RATE
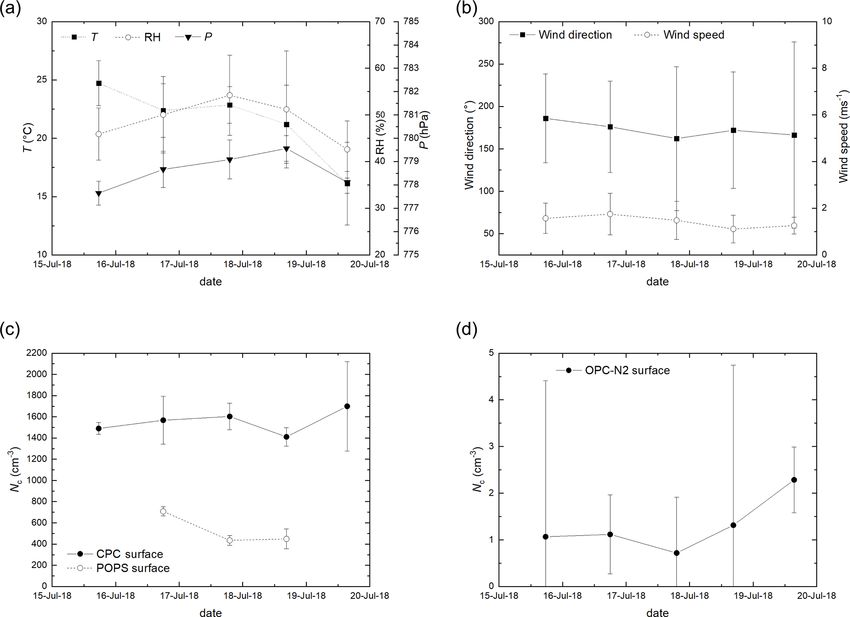
Figure 3. Overview of data collected with the FMI surface module placed on car roof about 2.75 m a.g.l.: mean values with standard
deviations as error-bars: (a) temperature, relative humidity, and pressure, (b) wind direction and speed by Trisonica mini weather station,
(c) total aerosol number concentration by CPC and POPS (0.13–3 µm, placed about 1.8 m a.g.l.), and (d) aerosol number concentration by
OPC-N2 (0.3–18 µm).
5 Data availability 6 Code availability
Datasets collected by the FMI and the KSU during LAPSE- Software developed to process and display the data from
RATE were published together under the LAPSE-RATE these aircraft is not publicly available and leverages licensed
community at Zenodo open data repository. For data col- data analysis software (MATLAB). This software contains
lected using the platforms outlined in this paper, the air- intellectual property that is not meant for public dissemina-
borne datasets of FMI-PRKL1, FMI-PRKL2, and the FMI tion.
surface module datasets can be all found here: https://doi.org/
10.5281/zenodo.3993996 (Brus et al., 2020a). The airborne
datasets of KSU M600 and KSU surface datasets can both be 7 Summary
found here: https://doi.org/10.5281/zenodo.3736772 (Brus et
al., 2020b). This publication summarizes measurements collected and
All datasets have undergone quality control, and false datasets generated by the FMI and KSU teams during
readings were eliminated. All files are available in netCDF LAPSE-RATE. LAPSE-RATE took place in the San Luis
format for each individual UAS flight, and the surface Valley of Colorado during the summer of 2018. In Sect. 2,
datasets are available as separate daily files. we provided an overview of the rotorcraft deployed by these
teams during this campaign and offered insight into the types
of payloads that were deployed. In Sect. 3 we described the
teams’ scientific goals and flight strategies, while Sect. 4 pro-
vided a glimpse at the datasets obtained, including a descrip-
tion of the measurement validation techniques applied. Sec-
Earth Syst. Sci. Data, 13, 2909–2922, 2021 https://doi.org/10.5194/essd-13-2909-2021D. Brus et al.: Aerosol, gases, and meteorological parameters measured during LAPSE-RATE 2919 tion 5 provided information on the datasets’ availability. The dataset was divided into two parts: FMI dataset containing 60 files (21 MB) and KSU dataset containing 31 files (11.3 MB); all files are available in netCDF format. To our knowledge, the data collected by these flights represent some of the only known profiles of aerosol properties collected over the San Luis Valley. While the overall dataset is limited in temporal and spa- tial coverage, these measurements offer unique insight into the vertical structure of and diurnal variability in atmo- spheric thermodynamic, aerosol, and gas parameters in a new location. Such observations would be difficult to obtain with other profiling methods (such as ground-based remote- sensing instrumentation). The temporal frequency and spa- tial extent covered by these profiles is unique to data col- lected using unmanned aircraft systems. This dataset offers a nice example of how these systems can help to inform our general understanding of these parameters, which can be very important to understanding weather and climate. A description of the vertical structure of key parameters as observed during LAPSE-RATE was provided in Brus et al. (2021); e.g., it includes analysis and discussion on acquired parameters and provides insight, however limited, on new particle formation events occurring over the San Luis Valley. https://doi.org/10.5194/essd-13-2909-2021 Earth Syst. Sci. Data, 13, 2909–2922, 2021
2920                     D. Brus et al.: Aerosol, gases, and meteorological parameters measured during LAPSE-RATE

Appendix A: Abbreviations

 a.g.l.          Above ground level
 CPC             Condensation particle counter
 FMI             Finnish Meteorological Institute
 LAPSE-RATE      The Lower Atmospheric Process Studies at Elevation – a Remotely-piloted Aircraft Team Experiment
 KSU             Kansas State University
 m.s.l.          Above mean sea level
 NPF             New particle formation
 OPC             Optical particle counter
 PBL             Planetary boundary layer
 POPS            Portable optical particle spectrometer
 SLV             San Luis Valley
 sUAS            Small unmanned aerial system

Earth Syst. Sci. Data, 13, 2909–2922, 2021                                 https://doi.org/10.5194/essd-13-2909-2021
D. Brus et al.: Aerosol, gases, and meteorological parameters measured during LAPSE-RATE                                                 2921

Author contributions. DB and GdB planned and coordinated the              the atmospheric boundary layer, Atmos. Meas. Tech., 8, 1627–
FMI missions during LAPSE-RATE campaign, and DB conducted                 1639, https://doi.org/10.5194/amt-8-1627-2015, 2015.
particle module measurements, processed, analyzed, and quality          Altstädter, B., Platis, A., Jähn, M., Baars, H., Lückerath, J., Held,
controlled FMI dataset, and wrote the manuscript. JG provided tech-       A., Lampert, A., Bange, J., Hermann, M., and Wehner, B.: Air-
nical support during the campaign and conducted measurements              borne observations of newly formed boundary layer aerosol par-
with the gas module. AH wrote the manuscript and quality con-             ticles under cloudy conditions, Atmos. Chem. Phys., 18, 8249–
trolled the FMI dataset. OK conducted all KSU flights. GdB and            8264, https://doi.org/10.5194/acp-18-8249-2018, 2018.
DB prepared and quality controlled KSU dataset. All authors edited      Andreae, M. O., Acevedo, O. C., Araùjo, A., Artaxo, P., Barbosa, C.
the manuscript.                                                           G. G., Barbosa, H. M. J., Brito, J., Carbone, S., Chi, X., Cintra,
                                                                          B. B. L., da Silva, N. F., Dias, N. L., Dias-Júnior, C. Q., Ditas, F.,
                                                                          Ditz, R., Godoi, A. F. L., Godoi, R. H. M., Heimann, M., Hoff-
Competing interests. The authors declare that they have no con-           mann, T., Kesselmeier, J., Könemann, T., Krüger, M. L., Lavric,
flict of interest.                                                        J. V., Manzi, A. O., Lopes, A. P., Martins, D. L., Mikhailov, E.
                                                                          F., Moran-Zuloaga, D., Nelson, B. W., Nölscher, A. C., Santos
                                                                          Nogueira, D., Piedade, M. T. F., Pöhlker, C., Pöschl, U., Que-
Special issue statement. This article is part of the special issue        sada, C. A., Rizzo, L. V., Ro, C.-U., Ruckteschler, N., Sá, L. D.
“Observational and model data from the 2018 Lower Atmospheric             A., de Oliveira Sá, M., Sales, C. B., dos Santos, R. M. N., Sat-
Process Studies at Elevation – a Remotely-piloted Aircraft Team           urno, J., Schöngart, J., Sörgel, M., de Souza, C. M., de Souza,
Experiment (LAPSE-RATE) campaign”. It is not associated with a            R. A. F., Su, H., Targhetta, N., Tóta, J., Trebs, I., Trumbore,
conference.                                                               S., van Eijck, A., Walter, D., Wang, Z., Weber, B., Williams,
                                                                          J., Winderlich, J., Wittmann, F., Wolff, S., and Yáñez-Serrano,
                                                                          A. M.: The Amazon Tall Tower Observatory (ATTO): overview
                                                                          of pilot measurements on ecosystem ecology, meteorology, trace
Acknowledgements. The authors would like to acknowledge
                                                                          gases, and aerosols, Atmos. Chem. Phys., 15, 10723–10776,
limited general support for LAPSE-RATE provided by the US Na-
                                                                          https://doi.org/10.5194/acp-15-10723-2015, 2015.
tional Science Foundation (AGS 1807199) and the US Department
                                                                        Barbieri, L., Kral, S. T., Bailey, S. C. C., Frazier, A. E., Jacob, J.
of Energy (DE-SC0018985) in the form of travel support for early
                                                                          D., Reuder, J., Brus, D., Chilson, P. B., Crick, C., Detweiler, C.,
career participants. Support for the planning and execution of the
                                                                          Doddi, A., Elston, J., Foroutan, H., González-Rocha, J., Greene,
campaign was provided by the NOAA Physical Sciences Labo-
                                                                          B. R., Guzman, M. I., Houston, A. L., Islam, A., Kemppinen,
ratory and NOAA UAS program office. Finally, the support of
                                                                          O., Lawrence, D., Pillar-Little, E. A., Ross, S. D., Sama, M.
UAS Colorado and local government agencies (Alamosa County,
                                                                          P., Schmale, D. G., Schuyler, T. J., Shankar, A., Smith, S. W.,
Saguache County) was critical in securing site permissions and
                                                                          Waugh, S., Dixon, C., Borenstein, S., and de Boer, G.: Intercom-
other local logistics. David Brus and Jani Gustafsson would like to
                                                                          parison of Small Unmanned Aircraft System (sUAS) Measure-
especially acknowledge Dave L. Coach for acting as a pilot in com-
                                                                          ments for Atmospheric Science during the LAPSE-RATE Cam-
mand for the FMI team. Handix Scientific, LLC, is acknowledged
                                                                          paign, Sensors, 19, 2179, 2019.
for providing their POPS instruments for the campaign at no cost.
                                                                        Bell, T. M., Klein, P. M., Lundquist, J. K., and Waugh, S.: Remote-
                                                                          sensing and radiosonde datasets collected in the San Luis Valley
                                                                          during the LAPSE-RATE campaign, Earth Syst. Sci. Data, 13,
Financial support. This research has been supported by the                1041–1051, https://doi.org/10.5194/essd-13-1041-2021, 2021.
ACTRIS-2 – the European Union’s Horizon 2020 research and               Brus, D., Gustafsson, J., Kemppinen, O., de Boer, G., and
innovation program under grant agreement (grant agreement no.             Hirsikko, A.: Atmospheric aerosol, gases and meteorological
654109), ACTRIS PPP – the European Commission under the                   parameters measured during the LAPSE-RATE campaign –
Horizon 2020 Framework Programme for Research and Innova-                 Finnish Meteorological Institute data sets [Data set], Zenodo,
tion, H2020-INFRADEV-2016-2017 (grant agreement no. 739530),              https://doi.org/10.5281/zenodo.3993996, 2020a.
Academy of Finland Center of Excellence program (grant agree-           Brus, D., Gustafsson, J., Kemppinen, O., de Boer, G., and
ment no. 307331), and the US National Science Foundation CA-              Hirsikko, A.: Atmospheric aerosol, gases and meteorologi-
REER program (grant agreement no. 1665456).                               cal parameters measured during the LAPSE-RATE campaign
                                                                          – Kansas State University data sets [Data set], Zenodo,
                                                                          https://doi.org/10.5281/zenodo.3736772, 2020b.
Review statement. This paper was edited by Suzanne Smith and            Brus, D., Gustafsson, J., Vakkari, V., Kemppinen, O., de Boer, G.,
reviewed by three anonymous referees.                                     and Hirsikko, A.: Measurement report: Properties of aerosol and
                                                                          gases in the vertical profile during the LAPSE-RATE campaign,
                                                                          Atmos. Chem. Phys., 21, 517–533, https://doi.org/10.5194/acp-
                                                                          21-517-2021, 2021.
References                                                              Carbone, C., Decesari, S., Mircea, M., Giulianelli, L., Finessi, E.,
                                                                          Rinaldi, M., S. Fuzzi, Marinoni, A., Duchi, R., Perrino, C., Sar-
Altstädter, B., Platis, A., Wehner, B., Scholtz, A., Wildmann, N.,        golini, T., Vardè, M., Sprovieri, F., Gobbi, G. P., Angelini, F.,
  Hermann, M., Käthner, R., Baars, H., Bange, J., and Lampert,            and Facchini, M. C.: Size-resolved aerosol chemical composi-
  A.: ALADINA – an unmanned research aircraft for observing
  vertical and horizontal distributions of ultrafine particles within

https://doi.org/10.5194/essd-13-2909-2021                                                Earth Syst. Sci. Data, 13, 2909–2922, 2021
2922 D. Brus et al.: Aerosol, gases, and meteorological parameters measured during LAPSE-RATE tion over the Italian Peninsula during typical summer and winter Jonassen, M. O., Tisler, P., Altstädter, B., Scholtz, A., Vihma, T., conditions, Atmos. Environ., 44, 5269–5278, 2010. Lampert, A., König-Langlo, G., and Lüpkes, C.: Application of de Boer, G., Diehl, C., Jacob, J., Houston, A., Smith, S. W., Chil- remotely piloted aircraft systems in observing the atmospheric son, P., Schmale III, D. G., Intrieri, J., Pinto, J., Elston, J., Brus, boundary layer over Antarctic sea ice in winter, Polar Res., 34, D., Kemppinen, O., Clark, A., Lawrence, D., Bailey, S. C. C., 25651, https://doi.org/10.3402/polar.v34.25651, 2015. Sama, M. P., Frazier, A., Crick, C., Natalie, V., Pillar-Little, E., Kral, S. T., Reuder, J., Vihma, T., Suomi, I., O’Connor, E., Klein, P., Waugh, S., Lundquist, J. K., Barbieri, L., Kral, S. T., Kouznetsov, R., Wrenger, B., Rautenberg, A., Urbancic, G., Jensen, A. A., Dixon, C., Borenstein, S., Hesselius, D., Human, Jonassen, M. O., Båserud, L., Maronga, B., Mayer, S., Lorenz, K., Hall, P., Argrow, B., Thornberry, T., Wright, R., and Kelly, T., Holtslag, A. A. M., Steeneveld, G.-J., Seidl, A., Müller, M., J. T.: Development of community, capabilities and understand- Lindenberg, C., Langohr, C., Voss, H., Bange, J., Hundhausen, ing through unmanned aircraft-based atmospheric research: The M., Hilsheimer, P., and Schygulla, M.: Innovative Strategies for LAPSE-RATE campaign, B. Am. Meteorol. Soc., 101, E684– Observations in the Arctic Atmospheric Boundary Layer (ISO- E699, https://doi.org/10.1175/BAMS-D-19-0050.1., 2020a. BAR) – The Hailuoto 2017 Campaign, Atmosphere, 9, 268, de Boer, G., Houston, A., Jacob, J., Chilson, P. B., Smith, S. W., https://doi.org/10.3390/atmos9070268, 2018. Argrow, B., Lawrence, D., Elston, J., Brus, D., Kemppinen, O., Laakso, L., Grönholm, T., Kulmala, L., Haapanala, S., Hirsikko, A., Klein, P., Lundquist, J. K., Waugh, S., Bailey, S. C. C., Frazier, Lovejoy, E. R., Kazil, J., Kurtén, T., Boy, M., Nilsson, E. D., So- A., Sama, M. P., Crick, C., Schmale III, D., Pinto, J., Pillar-Little, gachev, A., Riipinen, I., Stratmann, F., and Kulmala, M.: Hot-air E. A., Natalie, V., and Jensen, A.: Data generated during the 2018 balloon as a platform for boundary layer profile measurements LAPSE-RATE campaign: an introduction and overview, Earth during particle formation, Boreal Environ. Res., 12, 279–294, Syst. Sci. Data, 12, 3357–3366, https://doi.org/10.5194/essd-12- 2007. 3357-2020, 2020b. Lapham, M. H.: Soils of the San Luis Valley, US Department of de Boer, G., Waugh, S., Erwin, A., Borenstein, S., Dixon, C., Agriculture, Bureau of Soil Circular No. 52, 1912. Shanti, W., Houston, A., and Argrow, B.: Measurements from Nolan, P. J., Pinto, J., González-Rocha, J., Jensen, A., Vezzi, mobile surface vehicles during the Lower Atmospheric Profil- C. N., Bailey, S. C. C., De Boer, G., Diehl, C., Lau- ing Studies at Elevation – a Remotely-piloted Aircraft Team Ex- rence III, R., Powers, C. W., Foroutan, H., Ross, S. D., and periment (LAPSE-RATE) , Earth Syst. Sci. Data, 13, 155–169, Schmale III, D. G.: Coordinated Unmanned Aircraft System https://doi.org/10.5194/essd-13-155-2021, 2021. (UAS) and Ground-Based Weather Measurements to Predict Girdwood, J., Smith, H., Stanley, W., Ulanowski, Z., Stopford, Lagrangian Coherent Structures (LCSs), Sensors, 18, 4448, C., Chemel, C., Doulgeris, K.-M., Brus, D., Campbell, D., and https://doi.org/10.3390/s18124448, 2018. Mackenzie, R.: Design and field campaign validation of a multi- Nygård, T., Tisler, P., Vihma, T., Pirazzini, R., Palo, T., rotor unmanned aerial vehicle and optical particle counter, At- and Kouznetsov, R.: Properties and temporal variability of mos. Meas. Tech., 13, 6613–6630, https://doi.org/10.5194/amt- summertime temperature inversions over Dronning Maud 13-6613-2020, 2020. Land, Antarctica, Q. J. Roy. Meteor. Soc., 143, 582–595, Greenberg, J. P., Guenther, A. B., and Turnipseed, A.: Tethered https://doi.org/10.1002/qj.2951, 2017. balloon-based soundings of ozone, aerosols, and solar radiation Pinto, J. O., Jensen, A. A., Jiménez, P. A., Hertneky, T., Muñoz- near Mexico City during MIRAGE-MEX, Atmos. Environ., 43, Esparza, D., Dumont, A., and Steiner, M.: Real-time WRF large- 2672, https://doi.org/10.1016/j.atmosenv.2009.02.019., 2009. eddy simulations to support uncrewed aircraft system (UAS) Hämeri, K., Koponen, I. K., Aalto, P. P., and Kulmala, M: The flight planning and operations during 2018 LAPSE-RATE, Earth particle detection efficiency of the TSI-3007 condensation par- Syst. Sci. Data, 13, 697–711, https://doi.org/10.5194/essd-13- ticle counter, J. Aer. Sci., 33, 10, https://doi.org/10.1016/S0021- 697-2021, 2021. 8502(02)00090-3, 2002. Ramanathan, V., Ramana, M. V., Roberts, G., Kim, D., Corrigan, C., Harrison, R. G., Nicoll, K. A., Tilley, D. J., Marlton, G. J., Chin- Chung, C., and Winker, D.: Warming trends in Asia amplified by dea, S., Dingley, G. P., Iravani, P., Cleaver, D. J., du Bois, J. L., brown cloud solar absorption, Nature, 448, 575–578, 2007. and Brus, D.: Demonstration of a Remotely Piloted Atmospheric Tunved, P., Ström, J., and Krejci, R.: Arctic aerosol life cycle: link- Measurement and Charge Release Platform for Geoengineering, ing aerosol size distributions observed between 2000 and 2010 J. Atmos. Ocean. Tech., 38, 63–75, 2021. with air mass transport and precipitation at Zeppelin station, Heintzenberg, J., Birmili, W., Otto, R., Andreae, M. O., Mayer, J.- Ny-Ålesund, Svalbard, Atmos. Chem. Phys., 13, 3643–3660, C., Chi, X., and Panov, A.: Aerosol particle number size dis- https://doi.org/10.5194/acp-13-3643-2013, 2013. tributions and particulate light absorption at the ZOTTO tall U.S. Fish and Wildlife Service: Land protection plan for the San tower (Siberia), 2006–2009, Atmos. Chem. Phys., 11, 8703– Luis Valley Conservation Area, Lakewood, CO, U.S. Department 8719, https://doi.org/10.5194/acp-11-8703-2011, 2011. of the Interior, U.S. Fish and Wildlife Service, 151 pp., 2015. Jensen, A. A., Pinto, J. O., Bailey, S. C. C., Sobash, R. A., de Wenta, M., Brus, D., Doulgeris, K., Vakkari, V., and Herman, A.: Boer, G., Houston, A. L., Chilson, P. B., Bell, T., Romine, Winter atmospheric boundary layer observations over sea ice in G., Smith, S. W., Lawrence, D. A., Dixon, C., Lundquist, J. the coastal zone of the Bay of Bothnia (Baltic Sea), Earth Syst. K., Jacob, J. D., Elston, J., Waugh, S., and Steiner, M.: As- Sci. Data, 13, 33–42, https://doi.org/10.5194/essd-13-33-2021, similation of a Coordinated Fleet of Uncrewed Aircraft Sys- 2021. tem Observations in Complex Terrain: EnKF System Design and Preliminary Assessment, Mon. Weather Rev., 149, 1459–1480, https://doi.org/10.1175/MWR-D-20-0359.1, 2021. Earth Syst. Sci. Data, 13, 2909–2922, 2021 https://doi.org/10.5194/essd-13-2909-2021
You can also read