High Definition Sounding System (HDSS) for atmospheric profiling - Semantic Scholar
←
→
Page content transcription
If your browser does not render page correctly, please read the page content below
High Definition Sounding System (HDSS) for atmospheric profiling
Peter Black1, Lee Harrison2, Mark Beaubien3, William Jeffries3, Robert Bluth4, Haflidi
                   Jonsson4, Andrew Penny5 and Robert W. Smith6
                                    1
                                        Naval Research Laboratory
                                      Marine Meteorology Division
                                                SAIC, Inc
                       Surveillance and Reconnaissance Solutions Division
  2
    University at Albany, State University of New York Atmospheric Sciences Research Center
                                             Albany, NY
                               3
                                 Yankee Environmental Systems, Inc.
                                     4
                                       Naval Postgraduate School
                   Center for Interdisciplinary Remotely Piloted Aircraft Studies
                                     5
                                       Naval Postgraduate School
                      Meteorology and Physical Oceanography Department
                                   6
                                     NASA/ Johnson Space Center
                              WB-57 Program Office, Ellington Field

Introduction

Widely-used Tropical Cyclone (TC) models include regional air-sea coupled dynamical models
such as COAMPS-TC (Hao, et al, 2013), HWRF (Tallapragada, et al., 2014; Kim, et al., 2014)
and GFDL (Bender et al., 2007; Gall, et al., 2011), global dynamical models such as GFS and
ECMWF, and statistical-dynamical intensity-prediction models such as SHIPS, STIPS, L-GEM,
RII (DeMaria and Kaplan, 1999; DeMaria, et al., 2005; Knaff et al., 2005; Jones, et al., 2006;
DeMaria, 2009; DeMaria, 2010; Kaplan, et al., 2010). All of these models benefit from improved
3-D spatial observational plus enhanced temporal resolution, i.e. better 4-D capability. The need
for enhanced 4-D profile observations is driven by the need for enhanced model resolution of the
physics of small-scale processes such as convective events, boundary layer air-sea transfer
processes and upper troposphere outflow jets. These requirements demand a concurrent
enhancement in 4-D profile observational capability at finer spatial and temporal scales.
Observations and observational strategies for initial condition specification and forecast
validation within and around TCs require continual improvement to match these model demands
while providing a basis for improvements in process understanding and parameterization on
increasingly smaller scales.

The advent of in-situ dropsonde atmospheric profiling (Hock and Franklin, 1999; Franklin, et al.,
2003) has played a key role in contributing to this need and demonstrating improved model track
prediction performance (Burpee et al., 1996; Aberson and Franklin, 1999; Weissman, et al.,
2011; Aberson, 2011; Kun-Hsuan, et al., 2011; Wu, et al., 2007). The use of dropsonde
observations has also become the ‘reference standard’ by which enumerable satellite and airborne
remote sensors have been validated. These advances have, in turn, resulted in TC track
improvements (Uhlhorn et al, 2003; Uhlhorn et al, 2007). Use of 3D winds from TC airborne
Doppler radar observations in numerical prediction models such as WRF-ARW using an
Ensemble Kalman Filtering (EnKF) scheme (Weng and Zhang, 2012) have also shown promise.

                                                                                               1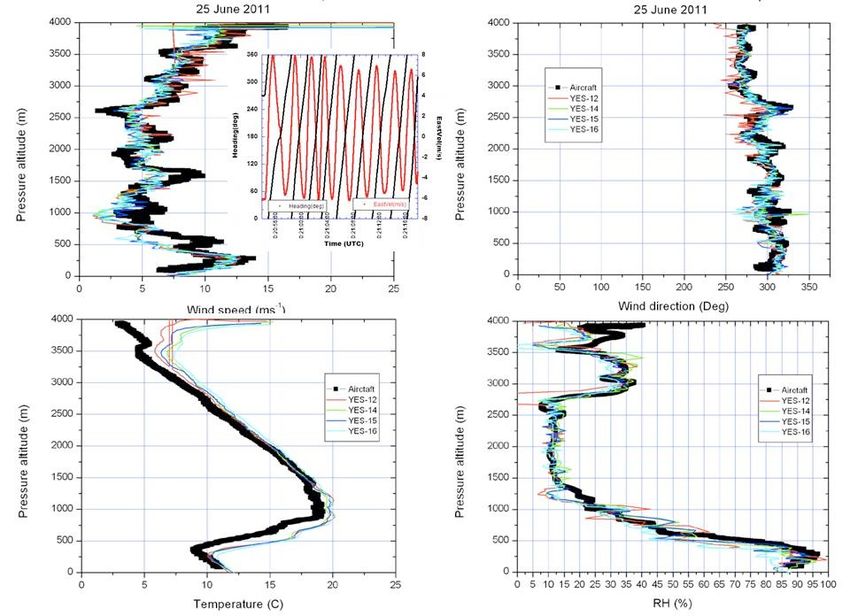
However, despite advanced observational technology and model advancement, there has been
little improvement in official predictions of TC intensity, either in the Atlantic or Pacific basins
(DeMaria, et al, 2014).

The HDSS has been developed by Yankee Environmental Systems, Inc. (YES, Inc.) to meet the
needs of Naval Research Laboratory field programs. The HDSS consists of eXpendable Digital
Dropsondes (XDDs), and the Automated Dropsonde Dispensers (ADD). The design allows
rapid-deployment, multi-sonde sampling strategies over the TC inner core as well as detailed
observation of TC outflow and inflow layer mesoscale features. The goal is to improve
understanding and prediction of TC intensity, especially Rapid Intensification (RI) and Rapid
Decay (RD) events.

A predecessor of the XDD known as the XDR was demonstrated on the NASA DC-8 during the
Arctic Mechanisms of Interaction between the Surface and Atmosphere (AMISA 2008) project
in which 36 XDRs were deployed over 6 days, including several showing excellent
intercomparisons with radiosonde ascents from the Swedish icebreaker Oden (Gasiewski, 2009;
Persson, 2010).

The HDSS has been validated during a series of collaborative test flights with 1) Naval
Postgraduate School, Center for Interdisciplinary Remotely-Piloted Aircraft Studies (CIRPAS),
using their Twin Otter aircraft, 2) NASA Wallops Flight Facility (WFF), using their P-3 aircraft,
3) NASA Dryden Flight Research Center (DFRC), using their DC-8 Airborne Science
Laboratory, and 4) NASA Johnson Space Center- Ellington Field (JSC-EF), using their WB-57
aircraft. Results presented are based on two Twin Otter flights with XDD deployments from 4
km altitude, one DC-8 flight with XDDs deployed from 12 km altitude and three WB-57 flights
with deployments from 18 km altitude. These tests were conducted, respectively, 1) from the
CIRPAS facility in Marina, CA over National Data Buoy Center (NDBC) buoys off shore from
the California coast, 2) from DFRC at Edwards, CA over the Eastern Pacific east of TC Cosme
and southwest of Cabo San Lucas, Mexico and 3) from JSC-Ellington Field, TX over the
western Gulf of Mexico offshore from the Texas coast adjacent to NWS radiosonde stations at
Brownsville (BRO) and Corpus Christi (CRP) and NDBC buoys.

The objectives achieved from each of these flights were, respectively: 1) successful
demonstration in 2011 of observational repeatability (same profile measurements from repeated
deployments in similar environments) as well as good agreement between XDD profile
observations and concurrent and collocated independent observations, 2) successful
demonstration and certification in 2012 of ADD launch capability in pressurized aircraft, 3)
successful demonstration in 2013 of high-speed (240 m/s TAS), high-altitude (12 km) XDD
deployments and data recovery from extreme range (120 km) using fast- and slow-fall modes of
descent and 4) successful approval for flight from Technical Readiness Review in 2013,
successful demonstration of HDSS transition from prototype to the operational Mark B,
successful demonstration of moderate-speed (120 m/s TAS), extreme altitude (20 km) XDD
deployments, data recovery from extreme ranges (160 km) and good agreement between XDD
profile observations and concurrent, near environment independent observations. In the following
sections the HDSS technology is described as well as each of the three aircraft flight
experiments. The extent of this effort requires supplementary material; some figures and

                                                                                                  2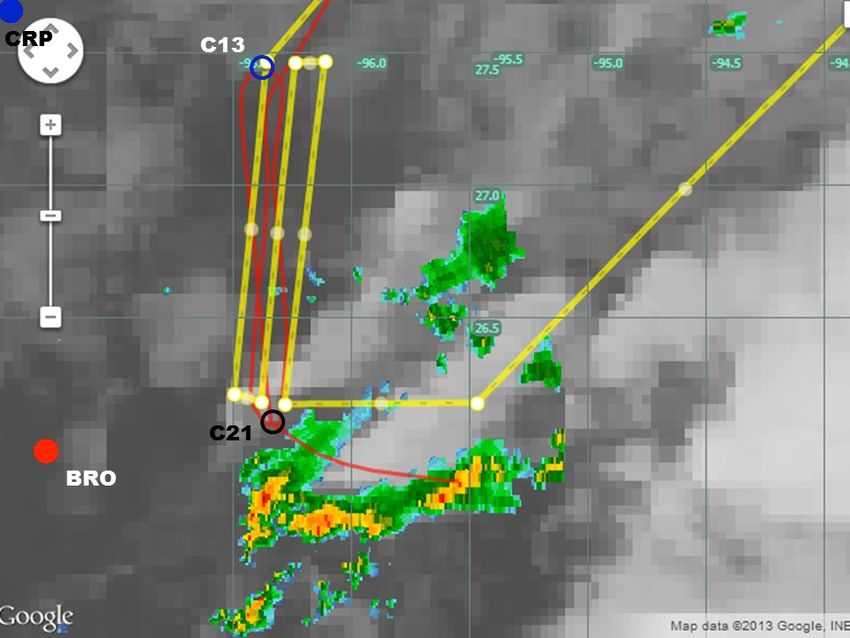
associated notes therein are referenced here as “S.”

XDD/HDSS Description

The XDD measures GPS location and altitude and vertical profiles of Pressure, Temperature,
hUmidity (PTU), horizontal and vertical velocity (horizontal velocities are taken to be the wind),
as well as Sea Surface Temperature (SST). The XDD weighs 58 g and is 17.8 cm long and 6.6
cm in diameter. Sondes are activated and programmed before launch via a non-contact optical
interface to select communication parameters prior to release. The XDD board layout with
component parts labeled and current packaging is shown in figure 1.

The XDD contains no parachute and its center of gravity can be adjusted to select either a
ballistic fast-fall or spiral-dive slow-fall mode of descent. Sea-level descent rates are
approximately 18 m/s for the fast-fall and 10 m/s for the slow; the latter is more variable.
Descent time from 18 km to the surface is approximately 11 minutes for the fast and 17-18
minutes for the latter. All sondes deployed at CIRPAS were slow-fall sondes, with the goal of
matching RD-94 descent rates; this turned out to be disadvantageous for the XDDs, as will be
shown. While subsequent test flights deployed both modes we expect further use to primarily be
fast-mode, for reasons shown later.

Figure 1. At left is the earlier XDD v e r s i o n u s e d i n the CIRPAS Twin-Otter experiment. Its
outer sleeve was clear plastic showing the i n ner foam inner body within. The printed circuit
board ( PCB) is shown below, with uncoiled telemetry and GPS antennae and sensor locations.
At right is today’s XDD with b i o d e g r a d e a b l e cardboard cylinder coated black inside and
white outside to minimize radiation effects, and are a revised electronic design. Weight is 58 g
and size is 17.8 cm long by 6.6 cm in diameter.

The later XDD versions deployed by the WB-57 measured vertical profiles of PTU at 2-Hz,
GPS-derived velocities at 4-Hz and Sea Surface Temperature (SST) at a 1 Hz. Longitude and
Latitude and “housekeeping” data are reported at lower rates. (Earlier version XDDs used at
CIRPAS reported all variables at 1 Hz.)

The configuration of HDSS evolved for each of the four aircraft installations discussed here as
various components were developed and improved. For the Twin Otter installation, the HDSS v.1
prototype had a single dispenser with a 48-sonde magazine and one receiver. The system evolved

                                                                                                       3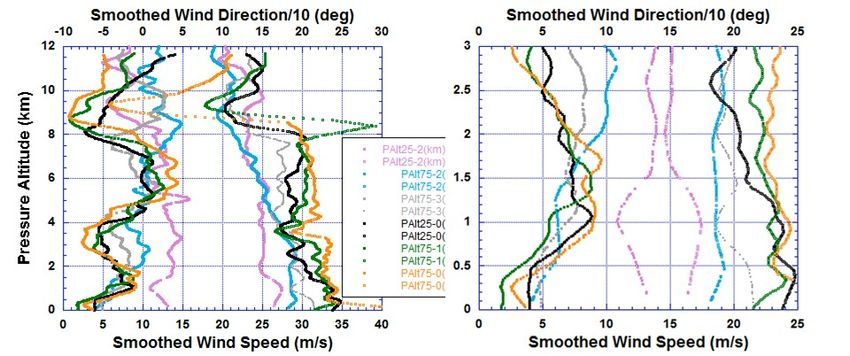
to HDSS v.2 with both improvements to the XDDs and hardening of the dispenser for
pressurized aircraft. Certification of v.2 for flight in pressurized aircraft was awarded for the P-3
installation by NASA WFF (see S1-S3).
The moderate-altitude DC-8 deployments were done with manual release to demonstrate
survival of the XDDs with high IAS deployment, and operation of forward error correction on two
receivers to enable a long 160 km link range.
The Mark-B HDSS system flown on the WB-57 consists of two dispensers (S3). Dual paired
dispensers allow launch rates faster than once every 5 seconds if needed, provide redundancy
to enhance reliability and use available aircraft space better than a long single magazine. The
Mark B dispensers have a magazine fore-body that holds 12 sondes on each side, with an
optional magazine extender to accommodate 48 on each side. There was no need for the
extenders on this flight given the number of sondes to be deployed and the paired units. Each
dispenser has a full receiver and control-computer; this provides system redundancy. Both of the
receivers in the dispensers were fed from a single antenna and pre-amp mounted on the
underbelly of the WB-57 pallet. Each receiver can handle all the channel capacity, tracking up to
48 in flight simultaneously with error correcting telemetry.
The system demonstrated on the WB-57 also carried two additional receivers, one each for
antennas mounted near the wingtips of the aircraft. The purpose of the two other receivers was to
take advantage of antenna diversity; to allow signals to be received when the aircraft was turning
when otherwise the wing and bank-angle would result in shadowing the belly antenna. The
HDSS also carries two cameras to record dropsonde ejection: one aft of the drop-tubes facing
forward, one forward of the drop-tubes facing aftward. These cameras also documented cloud
structures ahead of and behind the aircraft. The mission monitor display for the WB-57, used to
maintain situational awareness of XDD status in the dispensers as well as post-launch status and
parameter display, is shown in S?. The configuration flown on the WB-57 weighs 104 kg.
Twin Otter HDSS/ XDD evaluation experiment
The first experiment used the NPS CIRPAS Twin Otter aircraft (S1) operating from Marina, CA.
XDD data are compared with the instrumented research aircraft, Vaisala RD-94 dropsondes, and
NDBC surface buoys. The locale provided nearby NDBC moored buoys, and an atmosphere
with large changes in temperature and humidity across the top of the offshore marine layer in
order to test instrument response in strong gradients. Twin Otter flights were conducted on 24
and 25 June, 2011, when only minimal low-level cloud cover was present at the top of the
marine layer near the buoy locations as shown by GMS west visible satellite cloud images for
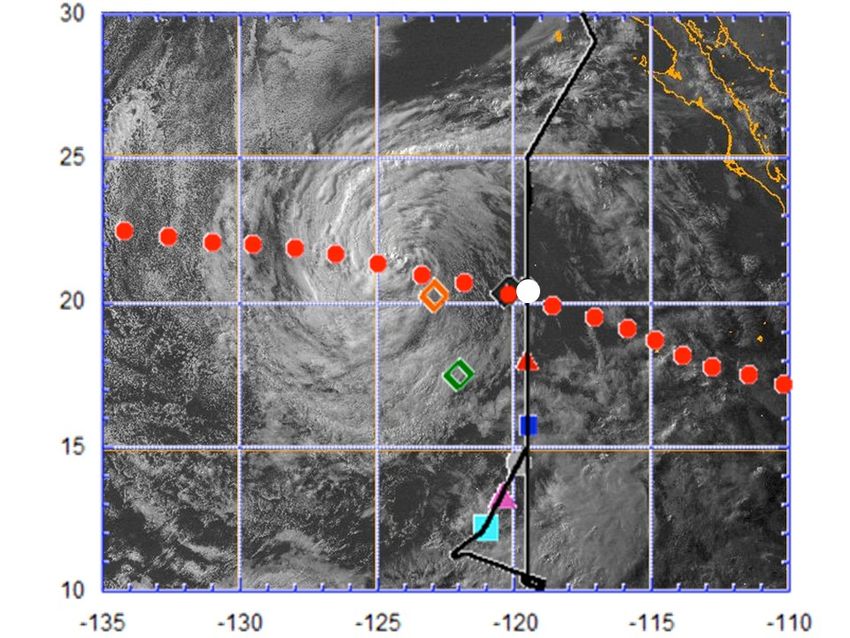
overflight times on these two days shown in figure 2.
4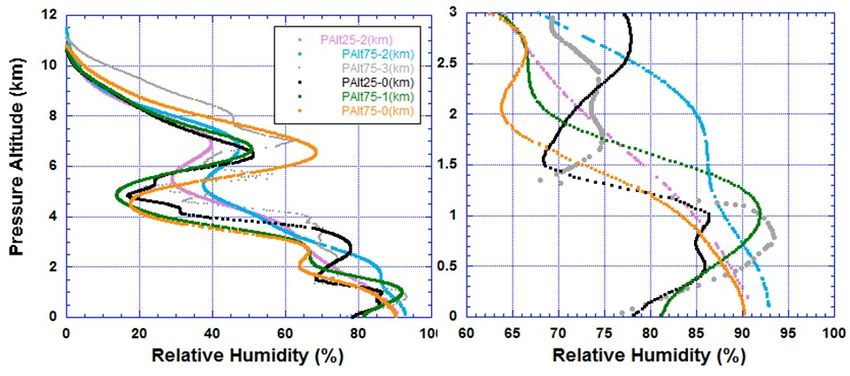
Figure 2. Visible satellite image showing stratus cloud cover and NDBC buoy 46042 location at the time
of the Twin Otter dropsonde intercomparison flight on 24 June (left) and NDBC buoy 46026 location at
the time of the Twin Otter dropsonde intercomparison flight on 25 June (right). Courtesy NRL satellite
image archive: http://www.nrlmry.navy.mil/sat-bin/epac_westcoast.cgi

The Twin Otter standard meteorological instrumentation package (Jonsson, personal
communication) was utilized with aircraft spiral descents/ascent at the same rate as the dropsonde
fall rates to act as ‘an impartial reference.’ A standard NCAR Atmospheric Vertical Atmospheric
Profiling System (AVAPS) system, part of the Twin Otter instrumentation suite, was used
together with two deployment tubes, one designed to launch standard dropsondes and another for
AXBT sonobuoy deployment. The latter was sleeved for the XDD dropsondes so that
simultaneous deployment of RD-94 and XDD dropsondes was possible.

All analysis of RD-94 data was done on the “D-files.” All analysis of XDD data was done on the
data as telemetered directly by the detectors. The goal of this was to compare measurement to
measurement. Telemetry errors for both systems were artificially low in these flights because
the aircraft was never more than a few km away from the sondes during descent.

Two NDBC moored buoys were chosen as a second ‘reference standard’ for comparison of
surface meteorological variables. The tests consisted of dual launches of the RD-94 and XDD
sondes from 4 km altitude over NDBC buoy 46042 off Monterey Bay on the 24th and from 4 km
altitude over NDBC buoy 46026 off San Francisco Bay on the 24th. The dual launches were
followed immediately by the spiral descent of the aircraft at a rate close to that of the sondes.
Sonde fall rates for the 25th are shown in S?. XDD slow-mode fall rates without a parachute are
similar to RD-94 fall rates with a parachute.

Aircraft flight patterns were designed so that pairs of RD-94 and XDD sondes were deployed
from 4 km altitude followed immediately by aircraft spiral descents to 60 m at approximately the
fall rate of the sondes, which were nearly equal to each other, at 10-12 m/s. This was
accomplished on both days followed by a slower ascent back to 4 km altitude with two-minute
straight and level legs upwind and downwind at 6 levels during the ascent. This latter maneuver
determined aircraft true airspeed and wind errors. Corrections were applied resulting in aircraft

                                                                                                         5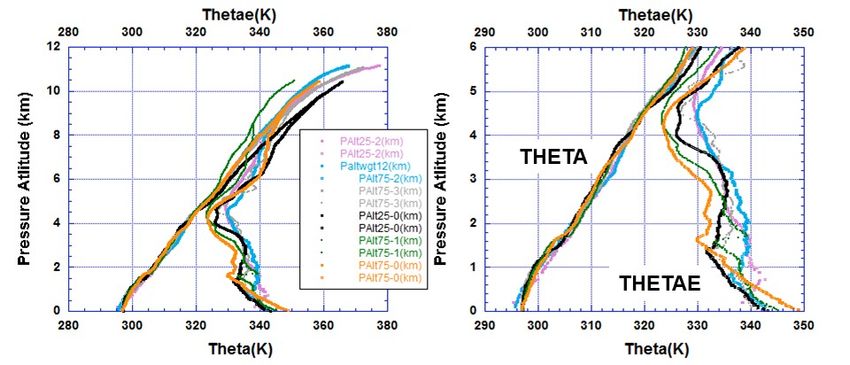
winds independent of heading during spiral descents.

   a. Comparison between XDD and RD-94 dropsondes and NDBC Buoy data

Figure 3 shows the three point weighted smoothed air temperature and humidity profiles for
24 June over buoy 46042 as a function of geopotential altitude (GA) for Vaisala (V) RD-94
sonde and YES (Y). A nine point smoother was used for pressure winds and SST. Figure 4 shows
the data for the second flight on 25 June. XDD sondes indicate a small warm bias for XDD
relative to RD-94 of 0.5–1.0°C throughout the profile with larger biases of 1-2°C in the upper
levels between 3-4 km (seen best in the linear height plot on the left). Both sondes required
about 15 s, or about 200 m vertically, to acclimate to the outside environmental temperature just
after release from the aircraft. Slightly larger than average warm XDD biases relative to RD-94
were also observed within the marine layer, best seen in the right panel. Extrapolation to the
1-m elevation buoy air-temperature observation yields RD-94 air temperature about 0.5°C cooler
than the buoy temperature of 11°C, with the XDD about 0.5°C warmer. The 20°C air temperature
maximum at the top of the inversion and the 10°C minimum and the base of the inversion are
well resolved by both sondes.

The RD-94 and XDD sondes also observed interesting wind features associated with the features
described above in the temperature profile (figures 5, 6). The RD-94 and XDD wind speeds and
directions are almost identical to each other with no significant differences. They observe
interesting oscillations of the wind with height, most prominent of which are: 1) the upper level
wind maximum (3.8 km) at the top of the upper inversion (3.5-3.7 km), 2) the strong wind shear
below throughout the upper half of the adiabatic layer (3.5-2.6 km) down to the top of the very
dry layer at 2.5 km, 3) the nearly constant wind with height layer throughout the dry layer (2.7-
1.25 m), 4) followed by another strong wind shear layer to a wind minimum at the top of the
marine inversion (1 km), 5) a third strong wind shear layer throughout the inversion, likely
associated with a near-critical Richardson number of 0.8 (less than 1, but more than the critical
value of 0.25) and associated Kelvin-Helmholtz instability, extending to a strong wind maximum
(6) at the top of the marine layer. It is interesting to note that in the satellite images for both the
24th and 25th, wave-like features with a constant wavelength of 2.3 km can be observed in the
stratus clouds, the constant wavelength being typical of Kelvin-Helmholtz instability as opposed
to dispersive gravity waves. And finally, the sondes observe 7) frictional shear throughout the
adiabatic marine layer following the log law to 35 m, below which a constant wind with height
layer (8) is observed. Both RD-94 and XDD slow-sondes observe these features well.

                                                                                                     6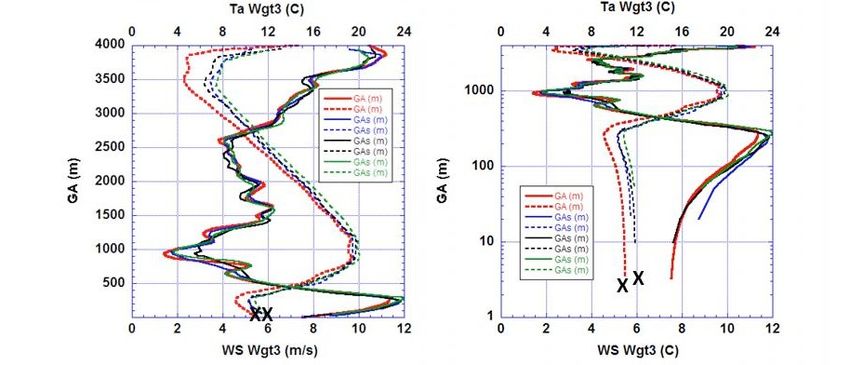
Figure 3.   Comparison between YES XDD and Vaisala RD94 dropsonde profiles of air temperature, Ta,
deployed from CIRPAS Twin Otter aircraft on 24 June 2011: linear geopotential height coordinates on the
left, log coordinates, emphasizing boundary layer detail, on the right. Also shown is the XDD ‘effective’ SST
profile as well as observed buoy SST at the surface. Vaisala Ta is in solid red , YES Ta is in dashed blue and
black. XDD infrared-derived SST is plotted for comparison (solid green), X is SST from NDBC buoy 46042.

Corresponding to the wind speed features in Fig. 5, there is little directional shear of the wind
within the upper wind maximum and the upper inversion layer (1). However, strong directional
shear accompanies the wind speed shear within the upper adiabatic layer extending to the top of
the dry layer at 2.5 km (2). Then, in contrast to the constant wind with height in the dry layer, the
wind direction oscillates through two cycles of 30° direction changes reaching a minimum just at
the top of the marine layer inversion. Strong direction shear accompanies the strong wind shear
throughout the inversion extending to the wind max at the top of the marine adiabatic layer.

Within the marine layer the wind rotates cyclonically with height due to near-surface frictional
effects. Therefore, not only are the observations repeatable and consistent between sonde types,
the observations are also consistent with typical meteorological features observed above and
below the marine layer off the coast of northern California.

The humidity sensor used in the XDDs at the CIRPAS intercomparison is slower than the
sensor used in the RD-94s. Nonetheless comparison of humidity profiles in figure 3, 4 between
RD-94 and XDD sondes show consistent features in the humidity measurements: 1) upper moist
layer at the base of a temperature inversion (3-3.5 km, left panel),

2) dry, adiabatic layer from the top of the marine layer inversion (1.25 km) to the base of the
upper moist layer 2.7 km), 3) strong moisture gradient from the top of the marine layer inversion
to the top of the adiabatic marine layer (250 m) and 4) the cool, moist adiabatic marine layer at
constant humidity (250m to the surface, right panel). The prime difference between the RD-94
and XDD humidity profiles is that the XDD profiles are about 5% wetter than the RD-94 in the
upper levels (left panel) and about 10% drier within the marine layer below 500m (right panel);
this latter difference is not explained by time-constants.

                                                                                                             7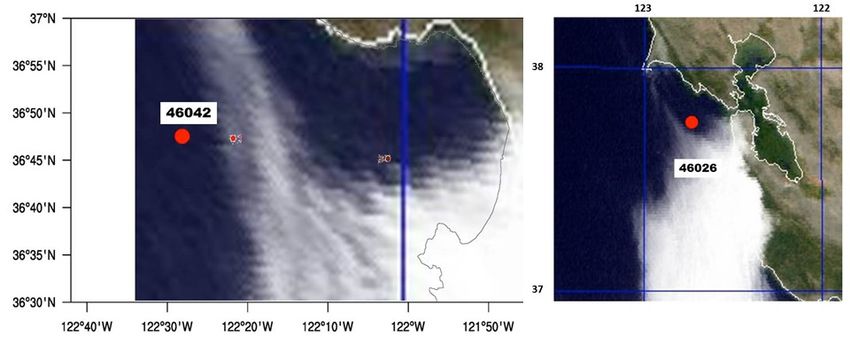
Figure 4. Comparison between YES XDD and Vaisala RD94 dropsonde observations from CIRPAS Twin
Otter aircraft of Ta, air temperature (solid) and RH, relative humidity (dashed) during Flight 2, 25 June
2011vs a) linear geopotential height (left) and b) log geopotential height (right), designed to emphasize
boundary layer detail. RD-94 data is in red, XDD data in blue, black and green. X is data from NDBC buoy
46026.

Figure 5.     Comparison from CIRPAS Twin Otter aircraft between YES XDD and Vaisala RD94
dropsonde observations of wind speed (solid), WS and air temperature (dashed), Ta – Flight 2, 25 June 2011:
linear geopotential height coordinates on the left, log coordinates, emphasizing boundary layer detail, on
the right. Vaisala data is in red , YES data in Blue, black and green. X is data from NDBC buoy 46042.

                                                                                                              8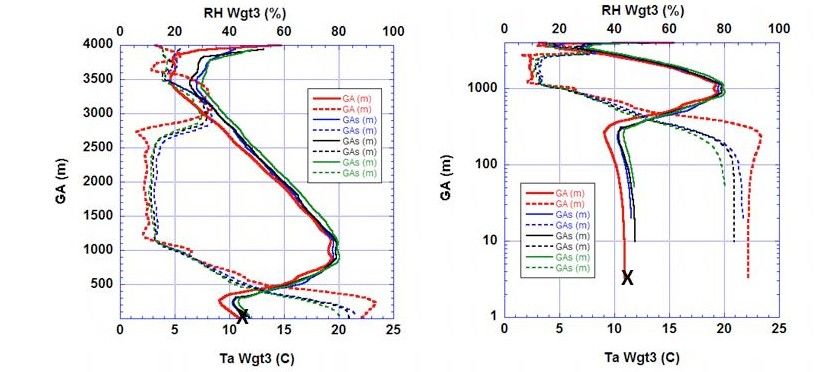
Figure 6.    Comparison from CIRPAS Twin Otter aircraft between YES XDD and Vaisala RD94
dropsonde observations of wind direction WD– Flight 2, 25 June 2011: linear geopotential height
coordinates on the left, log coordinates, emphasizing boundary layer detail, on the right. Vaisala data is
in red, YES data in blue, black and green. X is data from NDBC buoy 46026.

The performance of the XDDs at the CIRPAS intercomparison was hindered by using the slow-
mode to attempt to match fall-rates. Independent testing after the CIRPAS experiment made the
impacts clear to us, which we show using data from the DC-8 flight. For this reason discussion
of flight variances of slow-mode and fast-mode sondes are shown together later.

   b. Comparison of XDD and Twin Otter SST observations

Figure 7 shows comparison profiles between XDD sondes and the Twin Otter wind speed (upper
left), wind direction (upper right), air temperature (bottom left) and humidity (bottom right)
profiles. Agreement is evident between both wind speed and wind direction profiles, with
vertical spatial scales on the order of 500 m or less being well resolved.

The SST measurement provided by the XDD is obtained from an infrared detector in the 8-12
um ‘water-vapor window’ infrared band. This window is not entirely transparent to atmospheric
water vapor and oxygen, the two main atmospheric emission sources in this band. The SST is
simply taken from the lowest sonde reporting level, where column water vapor contributions are
negligible. Flight profiles of the SST measurements are shown in S?.

DC-8 XDD observations

The DC-8 XDD deployments were a piggy-back mission on a NASA flight to monitor a satellite
launch from Vandenberg AF Base, CA. The sonde deployments were made on the return leg
from 12-21°N approximately along 119°W, directly along a dry air intrusion to the east of
former Tropical Storm Cosme, as shown in figure 8. Three fast-fall sondes (magenta, pink and
gray symbols) with sea-level fall speeds of 18 m/s were deployed from 0300-0330, 28 June,
2013 followed by 3 slow-fall sondes from 0330-0400 GMT, 28 June (blue, red and white
symbols).

                                                                                                             9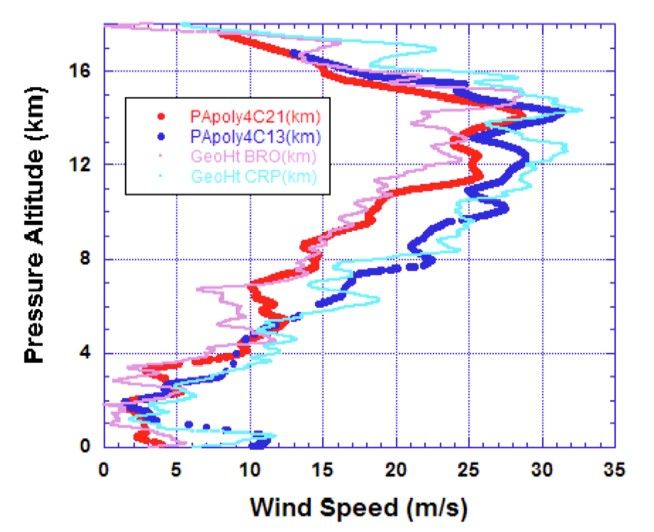
Figure 7.     Comparison of XDD sonde profiles with Twin Otter aircraft vertical profiles during spiral
    descent on 25 June over buoy 46026of a) wind speed (upper left), b) pressure (upper right), c) temperature
    (lower left) and d) relative humidity (lower right). Inset shows the the aircraft heading and east-west
    component of the wind as a function of time.

    The sonde locations relative to Cosme’s center ranged from 1000 km SSE for the first sonde to
    450 km ESE for the last sonde, was at the DC-8 point of closest approach to Cosme’s center.
    Figure 8 also shows the location of three SST drifting buoys, one of which was located only 20
    km from the last sonde drop. The SST pattern from a combined IR and microwave SST product
    is shown in S? 1 Ground truth estimates of SST from this product as well as from the drift buoy
    observations showed agreement with the sonde SST to within 0.5°C. S? provides estimates of
    surface winds from AMSU and ASCAT satellite sensors near 00 UTC, 25 June, about 3 hr prior

1
    Remote Sensing Systems, http://images.remss.com/hurricane/2013/sst/nep/

                                                                                                           10
to the sonde deployments. These observations 2 indicate that surface winds along the DC-8 flight
track were between 7-10 m/s.
Sonde trajectories are computed relative to the sonde location at the time of launch and shown in
S? The fast-fall sondes traveled only 3.5 to 4.0 km to the north and northeast, consistent with
upper SE winds shifting to lower SW winds. The slow-fall sondes however, travelled 9-12 km
before splash; they travelled almost as far horizontally and they did vertically (13 km). This
would be true of RD-94s under these conditions also. For slow-fall sondes care must be taken
when interpreting profile parameters as vertical.
Compared with the fast-fall sondes, which lost less than 1% of observations, the slow-fall XDDs
lost upwards of 20% of potential observations as a consequence of the varying transmit antenna
orientation.
Inspection of the air temperature and SST in S? and the humidity in figure 9 show that sharp
changes measured by these sensors in the vicinity of an inversion layer at 1.5 km (see right
panels for detail) suggest adequate instrument response to resolve important small-scale
atmospheric features. Of particular interest is the behavior of the SST for fast fall sonde #75-1.
The measured infrared SST increases as it passes through the inversion, while all the other
sondes transition to a constant SST vs. height across the inversion. This suggests that sonde #75-1
descended through a cloud layer measuring cold cloud top temperatures until it fell through the
layer and again could see the surface. This behavior shows time response adequate to observe
realistic features without acceleration. The decrease of humidity to near zero above 10 km is
discussed below.
In Fig 10, the derived parameters of θ and θe show remarkable similarity from sonde-to-sonde
with little difference between fast fall and slow fall. Similar small features seen in the θe profiles
(right panel) especially suggest that realistic features are being resolved and that the
measurements are repeatable. This conclusion is further enhanced in Fig 19 showing the wind
speed and direction profiles. One can observe boundary layer double wind maxima, with vertical
scales on the order of 200 m, above the top of a constant wind layer that are resolved by several
sondes.
Flight Variances
The statistics of high-frequency variances are shown from the DC-8 flight in figure 12; data
from three fast- or three slow-mode XDDs are combined in each histogram. The histograms of
variance shown are the absolute value of the variance in the reported data passed through a 6-
2
Courtesy Cooperative Institute for Research in the Atmosphere, Colorado State/NOAA,
http://rammb.cira.colostate.edu/products/tc_realtime/storm.asp?storm_identifier=EP032013
11point high-pass binomial filter 3, for the sounding data from 10 seconds after launch to an altitude
100 m above the boundary layer transition.
Figure 8. Visible GOES visible satellite image of Tropical Depression Cosme for 0130 UTC, 28 June. Cosme’s
NHC-derived Best Track 6-hourly positions from 1200 UTC, 25 June to 0000 UTC, 30 June are shown by the
solid red circles. The NASA DC-8 flight track is in black with outbound and return legs overlapping north of
15N. During the return leg, three fast-fall eXpendable Digital Dropsondes (XDDs) were deployed along the
diagonal flight leg from 13-15N, indicated by the sky-blue square, magenta triangle and grey circle from 0301-
0321 UTC. These were followed by the deployment of three slow-fall XDDs indicated by the solid navy-blue
square, red triangle and white circle from 0331-0407 UTC. In addition, the location of three SST drifting buoys
are indicated by open black diamond (WMO #46911), open orange diamond (WMO #46910) and open green
diamond (WMO #46916).
3
The high-pass binomial filter is constructed by subtracting the original data from that which has been filtered by a
six-point binomial FIR filter.
12Figure 9. Smoothed Relative Humidity (%) profiles for entire sounding (left) and air-sea boundary layer
(right). Colors for slow- and fast-fall sondes are as in Fig. 10.
Figure 10. Theta and Thetae (K) profiles for entire sounding (left) and mid- and lower-troposphere (right).
For simplicity we identify this as the “flight variance:” clearly it is the combined effects of real
profile variance, instrument noise, and the effects of perturbations in sonde velocity on the
measurements.
These data show in hindsight that the choice to deploy only slow-mode sondes at CIRPAS as
part of the intercomparison protocol in an attempt to match the descent rate of the parachute-
equipped RD-94s (on the belief that this was critical to a “fair” intercomparison) was very
harsh to the XDDs; the erratic spiral-dive and descent rate of the slow-mode aliases into all
measured parameters. The horizontal winds are most affected, y e t none of the measurements
are improved. Seeing these results, it is remarkable how well the XDDs did in resolving the
profiles as described.
13For comparison the RD-94 data taken from CIRPAS effort are shown in these plots. Rigorously
they are “apples to oranges,” but they are the only co-located RD-94/XDD data we have. The
slow-mode variances seen in the XDDs at CIRPAS are nearly identical to those from the DC-8
tests, differing in both RMS variance and mean(abs(variance)) by less than 20% with the
slow-mode data shown here, for all parameters except temperature. The slow-mode
temperature variance in the DC-8 soundings was almost twice that of the CIRPAS soundings; not
surprising considering the meteorologies. We believe that some conclusions can be drawn,
because the observed differences of the variances in several variables are large, and consistent
with sonde physics. Small differences should not be interpreted as significant.
Due to apparent higher atmospheric variability of temperature in the DC-8 data the comparison
of fast XDD (from DC-8) to RD-94 (from CIRPAS) yields inconclusive results. The thermistors
are very similar, we expect their intrinsic responses to be similar. In the Reynold's number limit
the heat flux scales as approximately ρV; the thermistor’s measurement length constant will be
nearly invariant with sonde fall-velocity if it is the velocity which ventilates the thermistor.
The RH variances cannot be taken at face value due to the differences in the detector time-
constants; the RD-94’s polymer sensor is faster and we expect it to respond to atmospheric
variances to a greater degree, which cannot be understood without independent high-spatial-
frequency data of the atmospheric humidity profile we do not have. However in all of these
histograms the last bin contains all more-extreme outliers in the variance. We do not believe the
population of outliers seen in the RD-94 humidity data is physically plausible even with faster
frequency response; we have no explanation for these.
In contrast the GPS data presented here are identical GPS chipsets on both the RD-94s at
CIRPAS, and the XDDs at CIRPAS and on the DC-8 flight. These data show a simple result:
the fast-mode XDDs do not experience the parachute flutter and "pendulum dynamics" of the
RD-94. The data they measure are thus less affected by variable drag force perturbations of their
velocity. (Interacting as V * grad(S)) The wind and fall-speed data from fast XDDs show far
less 1-Hz variance than the RD-94s.
A final point is the outliers in all graphs. The data show that the fast-mode XDDs do not exhibit
outliers beyond the ranges shown, and neither do the RD-94s for any variable except RH. The
slow-mode XDDs do show substantial outliers, which we are sure are not detector or telemetry
“noise”; we conclude they are due to the erratic flight of the slow-mode descent sondes.
Drag coefficient of the fast sonde vs. Reynold’s number is presented in S?, together with an
argument that XDD fast sondes can measure vertical air motion much more accurately than
existing RD-94 dropsondes that use a parachute.
XDD deployment from WB-57
The HDSS unmanned “Mark-B” system was tested on NASA’s WB-57 operating from
Ellington Field, Texas. During the period 13-19 November, 2013, three flights were conducted
along a racetrack pattern from just offshore from Corpus Christi (CRP) to Brownsville, (BRO).
Flights were approximately 2.5 hr each, spanning the time from 1100-1330 GMT, timed to
14overlap early morning 1200Z NWS radiosonde ascents from CRP and BRO. The first two
shakedown flights identified several integration problems on the new aircraft platform;
improvised solutions allowed the third flight (the 19th) to be successful. In addition to
establishing the Technology Readiness Level at 8, a number of operational experiments
explored performance at high altitudes. Among these, Ku band satcom was operated
continuously to explore potential XDD telemetry interference. No interference was found.
Planned (yellow) and actual (red) flight tracks for the third flight on 19 Nov are shown in figure
11, superimposed upon a BRO radar image and GOES IR satellite image using NASA’s Mission
Tool Suite (MTS) flight monitoring system. The latency on the weather radar was about 5 min,
but closer to 1 hour for the satellite. For this reason the radar and IR cloud features do not
align perfectly. Twenty three XDD dropsondes were successfully launched with no jams, and a
series of eight deployed in less than one minute, as the WB-57 flew over the mini-squall line
just east of the south end of the track, shown from the forward looking HDSS camera in S?. To
verify safe fuselage separation during ejection the back seat observer monitored the HDSS’ aft
and forward-looking cameras. Camera imagery showed conclusively that each XDD fell away
from the aircraft immediately, posing no threat to the aircraft. These cameras also proved
extremely useful in enhancing situational awareness regarding flight progress relative to cloud
features and rain areas for the science team on the ground via the Ku satcom link.
Figure 11. Wind speed (m/s) and wind direction (divided by 10) profiles for entire sounding (left) and air-
sea boundary layer (right). Colors for slow- and fast-fall sondes are as in Fig. 9. Wind speeds are on left side
of each panel and wind direction (divided by 10) on right side of panel.
In addition to the first availability of the WB-57 on the MTS, the ground science team was able
to monitor aircraft track, weather system evolution and HDSS function during the aircraft flight
via a web-based interface. This display (S?) shows the status of XDD dropsondes not yet
released in each of the two redundant ADDs, telemetry status of deployed XDDs, trajectory/PTU
15data plots, views from forward/aft cameras, status of the Ku-band communication link, and an
iChat window for text communication between the mission scientist and the on- board WB-57
mission manager.
Fig. 12 shows excellent agreement between the two XDD’s and corresponding NWS radiosonde-
derived wind profiles. These profiles illustrate the vertical structure of a subtropical jet with
different structures at CRP and BRO. This upper-level feature was just behind a cold front that
had passed off the Texas coast the day before the flight. Of particular interest is the capability
shown by this plot that the XDDs resolve all the fine scale detail measured by the radiosondes
including fluctuations on the scale of 200-300m. Both the XDD and CRP radiosonde observed a
low-level wind maximum (from the northeast) at the north end of the WB-57 racetrack, consistent
with its position further behind the cold front and more well-established northeasterly flow.
Figure 12. Comparison of wind speeds from slow-fall sonde, C13 (dark blue) located due east of Corpus
Christi (CRP) and fast-fall sonde C21 (red) located due east of Brownsville (BRO) with radiosonde wind speed
profiles from CRP (light blue) and BRO (magenta).
Fig. 13 illustrates the comparison of the temperature and humidity profiles observed from XDD
dropsonde “C21” and the BRO radiosonde, which was excellent. The C21 upper level
temperatures from 13-16 km are warmer than the radiosonde by about 10°C. We believe this
difference is real as the XDD was dropped through the trailing edge of the thunderstorm anvil
from the cells just east of the WB-57 drop point. The humidities near the surface observed by
the BRO radiosonde over land are almost 100%, about 15% higher than observed by the XDD
over the ocean. This again appears real as fog was reported at BRO at the time of the radiosonde
launch; there was no fog over the ocean. The moisture maxima at 1 km, 3km, 5-6 km are well
resolved by the XDD.
16Figure 13. Temperature and humidity profile observed by sonde C21 (red and dark blue, respectively)
located east of BRO with the BRO temperature and humidity (black and light blue, respectively).
Humidity at High Altitudes
The WB-57 flights were the first XDD deployments above 10 km and by design they do not
report RH below -40°C; comparisons show that observed relative humidity is not reasonable
at temperatures below -30°C. Upper air measurements by balloon-borne sondes have been a very
difficult issue that is well covered in the literature, and it is made considerably more difficult from
a dropsonde due to the relatively faster transit times and larger disequilibration at launch.
Similar behavior was noted by Revercomb, et al. (2013) showing the difference between AVAPS
dropsonde relative humidities (deployed by Global Hawk) and S-HIS humidities using ECMWF
model fields as a first guess in profile retrievals. They showed a consistent dry bias of 40%
above 400 mb between AVAPS and S-HIS for 14 intercomparisons for 2012.
17Figure 14. WB-57 test flight track planned (yellow) and actual (red) as flown on 19 Nov, 2013. The location of
the Brownsville (BRO) and Corpus Christi (CRP) radiosonde stations are shown in red and blue, respectively.
The locations are also shown of the two sample XDDs, the slow-fall sonde, C13 deployed off shore from CRP,
and the fast-fall sonde, C21 deployed off shore from BRO. BRO radar display is overlaid on GOES
geostationary satellite IR image
Summary and Conclusions
In this paper we describe the first field tests of the automated HDSS/XDD system developed to
obtain more synoptic sampling of “high impact” weather systems with better spatial resolution.
The HDSS system is the first autonomous drop-sonde system suitable for both pressurized and
unpressurized aircraft. The XDD sondes deliver an accurate measurement of the sea-surface
“skin temperature:” a new measurement for radiosondes.
We have shown that this new system has the capability for atmospheric profile measurements
comparable to the widely-used Vaisala RD-94 unit; fast-mode XDDs have better resolution for
winds and vertical velocities, similar performance for pressure and temperature, lesser resolution
for RH profile.
Comparison of the mean XDD profiles with the RD-94 and Twin Otter spiral descent
observations showed that the XDD’s were warmer by about 1°C and drier by about 5% than the
RD-94 and Twin Otter values. The twin Otter winds had to be heavily filtered due to oscillation
associated with continuous heading changes during descent. However, the XDD and RD-94
winds were virtually identical during even small-scale fluctuations in the vertical. The winds
measured by the aircraft were also in good agreement although small scale fluctuations could not
be resolved due to the necessary filtering.
Two separate of cases (and buoys) showed that the mini-radiometer measured skin SST to within
0.5°C of in-situ moored buoy bulk SST at 1-m depth. Two XDD sondes floated on the surface
18for tens of seconds and report temperature observations matched mini-radiometer SST values
comparably.
During the DC-8 XDD test flight conducted in the Eastern Tropical Pacific just east of decaying
Tropical Storm Cosme and west of the Baja Penninsula, a total of 6 sondes were deployed: 3 in
spiral dive mode (slow-fall) and 3 in ballistic mode (fast-fall). The slow-mode exhibited larger
‘flight noise’ amplitudes and greater numbers of data drop-outs than did the fast ballistic mode,
especially in the fall velocity and horizontal winds. We expect that most future deployments will
use XDDs built for “fast mode.”
The WB-57 campaign demonstrated the HDSS system from high-altitude, operating
autonomously, and dropping XDD sondes into a precipitating convective storm.
To date the development effort for the XDDs has been driven by the goals of developing a
capability to launch sondes at much higher rates, so that sampling densities can be improved, and
demonstrating the improvements in system reliability and data returned so that more-extensive
observations are feasible. We believe substantial progress on these goals is demonstrated: we
acknowledge further improvement is desirable in several areas.
NASA has embarked on a program of refurbishment and modernization of the WB-57 and ER-2,
making them valuable platforms for high altitude testing of various new technologies as well as
development of atmospheric observational capability from the new generation of High Altitude
Long endurance (HALE) Unmanned Aerial Vehicles (UAVs), such as the Global Hawk. HDSS
offers the potential to extend existing profiling strategies, combining new deployment schemes
with these aircraft. While the impact of dropsonde observations has been shown to improve TC
track forecast by 20% (Burpee, et al., 1996), the e-folding time of this impact is estimated to be
about 12 hours (Aberson, 2010). Use of NOAA GIV flights for 12-hourly repeat observations
has been shown to provide additional improvement in TC forecasting by allowing for daily time
changes in initial conditions to be more accurately resolved (Aberson, 2010). The use of the
Global Hawk UAV provides for the potential of 24-hour duration flights and the deployment of
dropsondes on a continuous basis. Improvements to COAMPS-TC forecasts using this new
observational strategy in Nadine from 2012 has been suggested (Doyle, et al., 2014).
The HDSS offers improvements to airborne atmospheric profiling at a time of improvements in
TC aircraft observing capability, even as TC satellite observing capability is declining (Hawkins,
et al, 2013). Air Force Reserve Command (AFRC) WC-130J and NOAA WP-3D aircraft, used
in operational hurricane reconnaissance missions for the National Hurricane Center (NHC),
utilize surface wind sensing capability via the Stepped Frequency Microwave Radiometer
(SFMR), technological improvements to existing dropsonde profiling, and use of operational
airborne Doppler radar from NOAA G-IV and WP-3D aircraft all contribute new capability for
TC numerical and statistic intensity prediction models. HDSS data can bridge the gap between 3-
D Doppler sampling of winds only and the widely-spaced measurements of PTU and winds
provided by existing dropsonde sampling strategies. It also adds IR remote sensing of SST.
Future Directions
Additional improvements to the HDSS system and XDD dropsonde are planned that will further
enhance the capability of this system. From the work here one can see that improved time-
19response would be desirable, particularly by comparison with the RD-94 and NCAR
minisonde. This is a goal and we believe improvement can be made, but we do not expect that
we could match these sondes at RH resolution without copying features of their design that
degrade performance goals for the XDDs. Thus we expect these two systems will have
overlapping but complementary strengths. The XDDs deliver better resolution of horizontal
winds and we plan to demonstrate accurate air-motion vertical-velocity measurements. The goals
for short-term XDD improvements are further improvements to telemetry and operational
capability to enable much higher spatial density sounding data. To be useful this demands
substantially better operational reliability and telemetry performance than has been the norm for
dropsondes.
Additional flights are planned for 2014 as part of the ONR-sponsored Tropical Cyclone Intensity
(TCI) experiment, for 2015 in collaboration with TCI and NOAA’s UAV demonstration project:
Sensing Hazards with Operational Unmanned Technology (SHOUT) and for 2016-17 in
collaboration with TCI and, pending favorable project funding, NASA’s OUTFLOW experiment,
planned for the Western Pacific. The latter also depends upon support for HDSS integration
on one of the NASA Global Hawks.
201. Acknowledgements
The authors gratefully acknowledge the support of the Office of Naval Research for providing
Twin Otter and WB-57 flight hour support and manpower support for P. Black and R. E. Lee
under contract numbers N00014010-C-028. Mark Beaubien and Yankee Environmental Systems,
Inc. were supported through SBIR award N08-145. We express our thanks to Robert E. Lee,
CMSgt Ret., for his assistance in the Twin Otter mission planning, equipment installation and
resourceful sonde deployment, without whose help the project would not have been a success.
The authors wish to thank the technical staff at CIRPAS, especially Roy Woods, as well as the
Twin Otter pilots who flew the two missions. Without their help in system integration and flight
planning, these flights would have been impossible. We thank the CIRPAS staff for providing
assistance in tracking and monitoring the flights in real time and for processing the Twin Otter
flight level data. We would like to thank the Air Force Reserve, 53rd.
Weather Squadron NOAA Aircraft Operations Center for providing consultation on integration
of AVAPS system on the Twin Otter. Sincere appreciation is also extended to NASA Ames,
Dryden Research Center and Johnson Space Center, WB-57 Program Operations. We are
especially thankful to NASA Ames and DRC for permission to fly piggy-back on the flight over
the East Pacific. Special thanks is extended to the WB-57 program managers James Alexander
and Tim Propp, WB-57 flight crew and the entire engineering and IT staff of the NASA WB-57
Program Office. We also wish to thank Patrick Finch and Aaron Duley, NASA Ames, for last
minute help in arranging for display of WB-57 flight track on the NASA Mission Tools Suite,
greatly improving situational awareness. Thanks is also extended to NWS Brownsville
Meteorologist-In-Charge, Steve Drillette, and Jim Campbell as well as NWS Corpus Christi
personnel Lara Keys and Ian Blaylock for providing radiosonde data.
2. References
Aberson, S. D., and J. L. Franklin, 1999: Impact on hurricane track and intensity forecasts of
GPS dropwindsonde observations from the first-season flights of the NOAA
Gulfstream-IV jet aircraft. Bull. Amer. Meteor. Soc., 80, 421-427.
Aberson, S. D., 2010: 10 Years of Hurricane Synoptic Surveillance (1997–2006). Mon. Wea.
Rev.,138, 1536-1549
Aberson, S. D., 2011: The Impact of Dropwindsonde Data from the THORPEX Pacific Area
Regional Campaign and the NOAA Hurricane Field Program on Tropical Cyclone
Forecasts in the Global Forecast System. Mon. Wea. Rev.,139, 2689-2703
Ancell, B., G. J. Hakim, 2007: Comparing Adjoint- and ensemble-sensitivity analysis with
applications to observation targeting. Mon. Wea. Rev.,135, 4117–4134.
Bender, M. A., I. Ginis, R. Tuleya, B. Thomas and T. Marchok, 2007: The Operational GFDL
21Coupled Hurricane–Ocean Prediction System and a Summary of Its Performance. Mon.
Wea. Rev.,135, 3965-3989
Black, P. G., E. D’Asaro, W. Drennan and J. R. French, P.P. Niiler, T. B. Sanford, E. J. Terrill,
E. J. Walsh and J. Zhang, 2007: Air-Sea Exchange in Hurricane Winds: Synthesis of
Observations from the Coupled Boundary Layer Air-Sea Transfer Experiment. Bull.
Amer. Meteorol. Soc., 88, 357-374.
Black, P. G., 2012: Tropical Cyclone Unusual Intensity and Structure Change in the Western
North Pacific Observed by Reconnaissance Aircraft During TPARC/TCS08 and
ITOP/TCS10, J. Tropical Cyclone Res. and Rev., 1, 75-88.
Burpee, R. W., S. D. Aberson, J. L. Franklin, S. J. Lord, R. E. Tuleya, 1996: The Impact of Omega
Dropwindsondes on Operational Hurricane Track Forecast Models. Bull. Amer. Meteor.
Soc., 77, 925-933
Chou, K-H., C-C. Wu, P-H. Lin, S. D. Aberson, M. Weissmann, F. Harnisch, T. Nakazawa, 2011:
The Impact of Dropwindsonde Observations on Typhoon Track Forecasts in DOTSTAR
and T-PARC. Mon. Wea. Rev., 139, 1728-1743
DeMaria, M., and J. Kaplan, 1999: An updated statistical hurricane intensity prediction scheme
(SHIPS) for the Atlantic and eastern north Pacific basins. Wea. Forecasting, 14, 326-337.
DeMaria, M., M. Mainelli, L.K. Shay, J.A. Knaff and J. Kaplan, 2005: Further Improvements in
the Statistical Hurricane Intensity Prediction Scheme (SHIPS). Wea. Forecasting, 20, 531-
543. DeMaria, M., 2009: A simplified dynamical system for tropical cyclone intensity
prediction. Mon. Wea. Rev., 137, 68-82.
DeMaria, M., 2010: Tropical cyclone intensity change predictability estimates using a statistical-
dynamical model. Extended Abstract, AMS 29th Conference on Hurricanes and Tropical
Meteorology, May 10-14, 2010, Tucson, AZ.
https://ams.confex.com/ams/29Hurricanes/techprogram/paper_167916.htm
DeMaria, M., C. R. Sampson, J. A. Knaff and K. D. Musgrave, 2014: Is Tropical Cyclone
Intensity Guidance Improving? Bull. Amer. Meteor. Soc., 14, early release.
Doyle, J.D., C.A. Reynolds, C. Amerault, 2011: Diagnosing tropical cyclone sensitivity.
Computing in Science and Engineering, 13, 31-39.
Doyle, J. D., J. Moskaitus, P. Black, E. Hendricks and P. A. Reinecke, 2014: Upper level
outflow, predictability and HS3 observational impact. AMS 31st Conference on
Hurricanes and Tropical Meteorology, San Diego, CA, 31 Mar- 4 Apr, 2014.
Franklin, J. L., M. L. Black, and K. Valde, 2003: GPS dropwindsonde wind profiles in
hurricanes and their operational implications. Wea. Forecasting, 18, 32-44.
22Gall, J. S., I. Ginis, S-J. Lin, T. P. Marchok and J-H. Chen, 2011: Experimental Tropical Cyclone
Prediction Using the GFDL 25-km-Resolution Global Atmospheric Model. Wea. and
Forecasting, 26, 1008-1019
Gasiewski, A., A. Chaturvedi, E. McIntyre, D. M. Kraft, P. O. G. Persson, M. Tjernstrom, M.
Beaubien and W. Jeffries, 2009: Use of a new generation of dropsondes during the 2008
Arctic Mechanisms for the Interaction of the Surface and Atmosphere (AMISA)
campaign. 10th Conf. on Polar Meteor. And Oceanography, 18-21 May, 2009, Madison,
WI https://ams.confex.com/ams/10POLAR/webprogram/Paper152908.html
Hawkins, J., T. Lee, K. Richardson, M. Surratt, C. Sampson, and J. Kent, 2013: The history of
tropical cyclone remote sensing via satellite microwave imagers, AMS 94th Annual
Meeting, History Symposium, Austin, TX, 6-10 Jan, 2013.
https://ams.confex.com/ams/93Annual/webprogram/Paper223439.html
Hendricks, Eric A., Melinda S. Peng, Xuyang Ge, Tim Li, 2011: Performance of a Dynamic
Initialization Scheme in the Coupled Ocean-Atmosphere Mesoscale Prediction
System for Tropical Cyclones (COAMPS-TC). Wea. Forecasting, 26, 650-663.
Hock, T. F., and J. L. Franklin, 1999: The NCAR GPS dropwindsonde. Bull. Amer. Meteor.
Soc., 80, 407-420.
Jin, H., M. S. Peng, Y. Jin and J. D. Doyle, 2014: An Evaluation of the Impact of Horizontal
Resolution on Tropical Cyclone Predictions using COAMPS-TC. Wea. and
Forecasting, early release
Jones, T. A., D. J. Cecil, and M. DeMaria, 2006: Passive Microwave-Enhanced Statistical
Hurricane Intensity Prediction Scheme. Wea. and Forecasting, 21, 613-635.
Kaplan, J., M. DeMaria, and J.A. Knaff, 2010: A Revised Tropical Cyclone Rapid Intensification
Index for the Atlantic and Eastern North Pacific Basins. Wea. and Forecasting, 25, 220-
241.
Kepert, J. D., 2006: Observed Boundary Layer Wind Structure and Balance in the Hurricane Core.
Part I: Hurricane Georges. J. Atmos. Sci., 63, 2169-2193.
Knaff, J.A., C.R. Sampson, and M. DeMaria, 2005: An Operational Statistical Typhoon Intensity
Prediction Scheme for the Western North Pacific. Wea. Forecasting, 20, 688-699.
Miloshevich, L. M., H. Vömel, A. Paukkunen, A. J. Heymsfield, and S. J. Oltmans, 2001:
Characterization and correction of relative humidity measurements from Vaisala
RS80-A radiosondes at cold temperatures. J. Atmos. Oceanic Tech.,18, 135–156.
Persson, P. O. G., 2010: Summary of meteorological conditions during the Arctic Mechanisms
for the Interaction of the Surface and Atmosphere (AMISA) intensive observation
periods. NOAA Tech. Memo PSD-314, NOAA-OAR-ESRL, Boulder, CO, 57pp.
23Rivercombe, H., J. Taylor, F. Best, D. Tobin, R. Knuteson, W. Smith, E. Weisz, D. Deslover, R.
Garcia, D. Hoese and P. Antonelli, 2013: Scanning HIS: Advance IR Sounder for HS3.
HS3. Science Team meeting, NASA Ames Research Center, 7-8 May, 2013.
https://espo.nasa.gov/missions/hs3/content/HS3_Science_Presentations
Tallapragada, V., C. Kieu, Y. Kwon, S. Trahan, Q-F. Liu, Z. Zhang and I-H. Kwon, 2014:
Evaluation of Storm Structure from the Operational HWRF Model during 2012
Implementation. Mon. Wea. Rev., early release
Verver, GÉ, M. Fujiwara, P. Dolmans, C. Becker, P.L Fortuin L. Milosevitch, (2006)
Performance of the Vaisala RS80A/H and RS90 Humicap Sensors and the Meteolabor
“Snow White” Chilled-Mirror Hygrometer in Paramaribo, Suriname J. Atmos. Oceanic
Tech., 23, 1506–1517.
Vomel,H., H. Selkirk, L. Milosevitch, J. Valverde-Canossa, J. Valdes, E. Kyro,& R. Kivi, W.
Stolz, G. Peng, J. A. Diaz, (2006) Radiation Dry Bias of the Vaisala RS92 Humidity
Sensor, J. Atmos. Ocean Tech. 24: 953 – 963
http://journals.ametsoc.org/doi/pdf/10.1175/JTECH2019.1
Weissmann, M., F. Harnisch, C-C. Wu, P-H. Lin, Y. Ohta, K. Yamashita, Y-H. Kim, E-H. Jeon,
T. Nakazawa and S. D. Aberson, 2011: The Influence of Assimilating Dropsonde Data on
Typhoon Track and Midlatitude Forecasts. Mon. Wea. Rev., 139, 908-920
Weng, Y-H. and F-Q. Zhang, 2012: Assimilating Airborne Doppler Radar Observations with an
Ensemble Kalman Filter for Convection-Permitting Hurricane Initialization and
Prediction: Katrina (2005). Mon. Wea. Rev., 140, 841-859
Wu, C-C., K-H. Chou, P-H. Lin, S. D. Aberson, M. S. Peng and T. Nakazawa, 2007: The Impact
of Dropwindsonde Data on Typhoon Track Forecasts in DOTSTAR. Wea. and
Forecasting, 22, 1157-1176
24You can also read