FAVIPIRAVIR ANTIVIRAL EFFICACY AGAINST SARS-COV-2 IN A HAMSTER MODEL - NATURE
←
→
Page content transcription
If your browser does not render page correctly, please read the page content below
ARTICLE
                   https://doi.org/10.1038/s41467-021-21992-w                OPEN

                  Favipiravir antiviral efficacy against SARS-CoV-2
                  in a hamster model
                  Jean-Sélim Driouich 1,5, Maxime Cochin1,5, Guillaume Lingas2, Grégory Moureau1, Franck Touret 1,
                  Paul-Rémi Petit1, Géraldine Piorkowski1, Karine Barthélémy1, Caroline Laprie3, Bruno Coutard1, Jérémie Guedj                                         2,

                  Xavier de Lamballerie 1, Caroline Solas1,4 & Antoine Nougairède 1 ✉
1234567890():,;

                  Despite no or limited pre-clinical evidence, repurposed drugs are massively evaluated in
                  clinical trials to palliate the lack of antiviral molecules against SARS-CoV-2. Here we use a
                  Syrian hamster model to assess the antiviral efficacy of favipiravir, understand its mechanism
                  of action and determine its pharmacokinetics. When treatment is initiated before or simul-
                  taneously to infection, favipiravir has a strong dose effect, leading to reduction of infectious
                  titers in lungs and clinical alleviation of the disease. Antiviral effect of favipiravir correlates
                  with incorporation of a large number of mutations into viral genomes and decrease of viral
                  infectivity. Antiviral efficacy is achieved with plasma drug exposure comparable with those
                  previously found during human clinical trials. Notably, the highest dose of favipiravir tested is
                  associated with signs of toxicity in animals. Thereby, pharmacokinetic and tolerance studies
                  are required to determine whether similar effects can be safely achieved in humans.

                  1 Unitédes Virus Émergents, UVE: Aix Marseille Univ, IRD 190, INSERM 1207, Marseille, France. 2 Université de Paris, IAME, INSERM, Paris, France.
                  3 LaboratoireVet-Histo, Marseille, France. 4 Laboratoire de Pharmacocinétique et Toxicologie, Hôpital La Timone, APHM, Marseille, France. 5These authors
                  contributed equally: Jean-Sélim Driouich, Maxime Cochin. ✉email: antoine.nougairede@univ-amu.fr

                  NATURE COMMUNICATIONS | (2021)12:1735 | https://doi.org/10.1038/s41467-021-21992-w | www.nature.com/naturecommunications                              1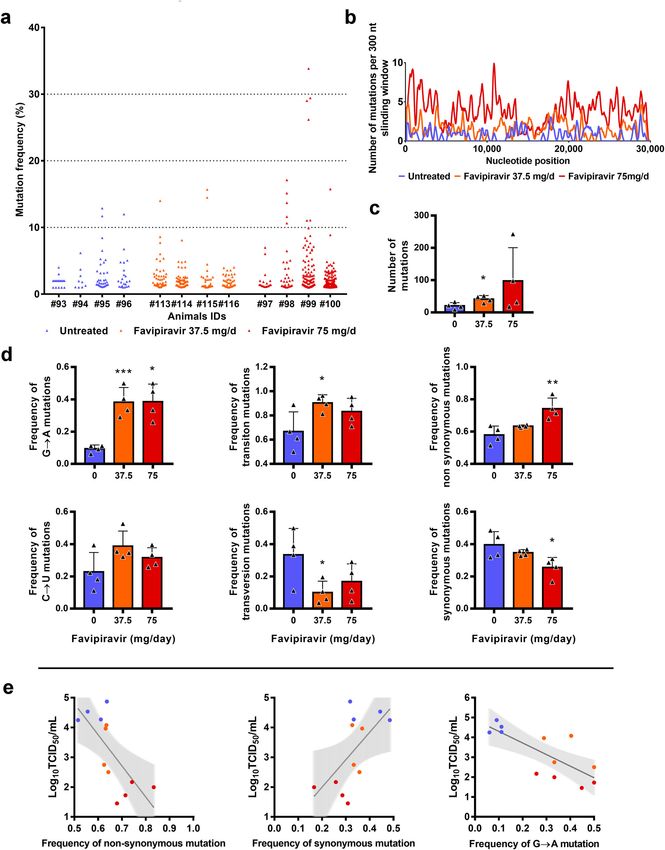
ARTICLE                                                                 NATURE COMMUNICATIONS | https://doi.org/10.1038/s41467-021-21992-w

I
    n March 2020, the World Health Organization declared cor-                favipiravir and ranged between 144 and 7721 with 500 µM of the
    onavirus disease 2019 (COVID-19) a pandemic1. The                        drug. 50% cytotoxic concentrations (CC50) in VeroE6 and Caco-2
    COVID-19 outbreak was originally identified in Wuhan,                     cells were > 500 µM.
China, in December 2019 and spread rapidly around the world
within a few months. The severe acute respiratory syndrome
                                                                             Infection of Syrian hamsters with SARS-CoV-2. Following
coronavirus 2 (SARS-CoV-2), the causative agent of COVID-19,
                                                                             Chan et al., we implemented a hamster model to study the effi-
belongs to the Coronaviridae family and is closely related to the
                                                                             cacy of antiviral compounds7. Firstly, we intranasally infected 4-
SARS-CoV, which emerged in China in 20022. After an incuba-
                                                                             week-old female Syrian hamsters with 106 TCID50 of virus.
tion period of about 5 days, disease onset usually begins with an
                                                                             Groups of two animals were sacrificed 2, 3, 4, and 7 days post-
influenza-like syndrome associated with high virus replication in
                                                                             infection (dpi). Viral replication was quantified in sacrificed
respiratory tracts3,4. In some patients, a late acute respiratory
                                                                             animals by RT-qPCR in organs (lungs, brain, liver, small/large
distress syndrome, associated with high levels of inflammatory
                                                                             bowel, kidney, spleen, and heart) and plasma. Viral loads in lungs
proteins, occurs within one to two weeks3. As of 11 November
                                                                             peaked at 2 dpi, remained elevated until 4 dpi and dramatically
2020, more than 90 million cases of COVID-19 have resulted in
                                                                             decreased at 7 dpi (Supplementary 2). Viral loads in plasma
more than 1,936,000 deaths5. In the face of this ongoing pan-
                                                                             peaked at 3 dpi and viral replication was detected in the large
demic and its unprecedented repercussions, not only on human
                                                                             bowel at 2 dpi (Supplementary Fig. 2 and Supplementary Data 1).
health but also on society, ecology and economy, there is an
                                                                             No viral RNA was detected in almost all the other samples tested
urgent need for effective infection prevention and control
                                                                             (Supplementary Data 1). Subsequently, we infected animals with
measures.
                                                                             two lower virus inocula (105 and 104 TCID50). Viral RNA was
   Whilst host-directed and immune-based therapies could prove
                                                                             quantified in lungs, large bowel, and plasma from sacrificed
useful for the clinical management of critically ill patients, the
                                                                             animals 2, 3, 4, and 7 dpi (Supplementary Fig. 2 and Supple-
availability of safe and effective antiviral molecules would repre-
                                                                             mentary Data 1). Viral loads in lungs peaked at 2 and 3 dpi with
sent an important step toward fighting the current pandemic. As
                                                                             inocula of 105 and 104 TCID50, respectively. Maximum viral loads
conventional drug development is a slow process, repurposing of
                                                                             in lungs of animals infected with each virus inoculum were
drugs already approved for any indication was extensively
                                                                             comparable. Viral RNA yields in plasma and large bowel followed
explored and led to the implementation of many clinical trials for
                                                                             a similar trend but with more variability, with this two lower
the treatment of COVID-196. However, the development of
                                                                             inocula. In addition, clinical monitoring of animals showed no
effective antiviral drugs for the treatment of COVID-19, should,
                                                                             marked symptoms of infection but normalized weights (i.e., % of
as much as possible, rely on robust pre-clinical in vivo data, not
                                                                             initial weights) significantly lower from 3 dpi when compared to
only on efficacy generated in vitro. Accordingly, rapid imple-
                                                                             animals intranasally inoculated with sodium chloride 0.9%
mentation of rodent and non-human primate animal models
                                                                             (Supplementary Fig. 2).
should help to assess more finely the potential safety and efficacy
of drug candidates and to determine appropriated dose regimens
in humans7,8.                                                                In vivo efficacy of favipiravir. To assess the efficacy of favipir-
   Favipiravir (6-fluoro-3-hydroxypyrazine-2-carboxamine) is an               avir, hamsters received the drug, intraperitoneally, three times a
anti‐influenza drug approved in Japan that has shown broad-                   day (TID). We used three doses of favipiravir: 18.75, 37.5, and
spectrum antiviral activity against a variety of other RNA                   75 mg/day (corresponding to 340 ± 36, 670 ± 42 and 1390 ±
viruses9–15. Favipiravir is a prodrug that is metabolized intra-             126 mg/kg/day, respectively).
cellularly into its active ribonucleoside 5′-triphosphate form that             In a first set of experiments, treatment was initiated at the day
acts as a nucleotide analog to selectively inhibit RNA-dependent             of infection (preemptive antiviral therapy) and ended at 2 dpi. We
RNA polymerase and induce lethal mutagenesis16,17. Recently,                 infected groups of 6 animals intranasally with three virus inocula
several studies reported in vitro inhibitory activity of favipiravir         (106, 105, and 104 TCID50) and viral replication was measured in
against SARS-CoV-2 with 50% effective concentrations (EC50)                  lungs and plasma at 3 dpi (Fig. 1a). Each virus inoculum was
ranging from 62 to > 500 µM (10 to > 78 µg/mL)18–20. Based on                assessed in an independent experiment. When analysis of virus
these results, more than 20 clinical trials on the management of             replication in clarified lung homogenates was based on infectious
COVID-19 by favipiravir are ongoing (https://clinicaltrials.gov/).           titers (as measured using TCID50 assay), the effect of favipiravir
   In the present study, we evaluate the efficacy of favipiravir              in reducing infectious titers was dose dependent, in particular
in vitro and using a Syrian hamster model (Mesocricetus auratus).            when low virus inocula were used to infect animals (Fig. 1b). At
Our results show that preventive or preemptive administration of             each virus inoculum, mean infectious titers for groups of animals
high doses favipiravir induce significant reduction of infectious             treated with 75 mg/day TID were significantly lower than those
titers and histopathological damages in lungs and clinical alle-             observed with untreated groups (p ≤ 0.0001): reduction of
viation of the disease. Analysis of genetic diversity of viral popu-         infectious titers ranged between 1.9 and 3.7 log10. For animals
lations in lungs also confirms the mutagenic effect of favipiravir.           infected with 105 or 104 TCID50, significant infectious titer
                                                                             reductions of around 0.8 log10 were also observed with the dose of
                                                                             37.5 mg/day TID (p ≤ 0.038). Drug 90 and 99% effective doses
Results                                                                      (ED90 and ED99) were estimated based on these results and
In vitro efficacy of favipiravir. Using VeroE6 cells and an anti-             ranged between 31–42 mg/day and 53–70 mg/day, respectively
viral assay based on reduction of cytopathic effect (CPE), we                (Table 2). When analysis of virus replication in clarified lung
recorded EC50 and EC90 of 204 and 334 µM using a multiplicity of             homogenates were assessed on viral RNA yields (as measured
infection (MOI) of 0.001, 446, and > 500 µM with an MOI of 0.01              using quantitative real-time RT-PCR assay), significant differ-
(Table 1 and Supplementary Fig. 1) in accordance with previous               ences with groups of untreated animals, ranging between 0.7 and
studies18–20. Infectious titer reductions (fold change in compar-            2.5 log10, were observed only with the higher dose of favipiravir
ison with untreated cells) were ≥ 2 with 125 µM of favipiravir and           (p ≤ 0.012). Once again, this difference was more noticeable with
ranged between 11 and 342 with 500 µM. Using Caco-2 cells,                   lower virus inocula (Fig. 1c). Since we found higher reductions of
which do not exhibit CPE with SARS-CoV-2 BavPat1 strain,                     infectious titers than those observed with viral RNA yields, we
infectious titer reductions were around 5 with 125 µM of                     estimated the relative infectivity of viral particle (i.e., the ratio of

2                NATURE COMMUNICATIONS | (2021)12:1735 | https://doi.org/10.1038/s41467-021-21992-w | www.nature.com/naturecommunications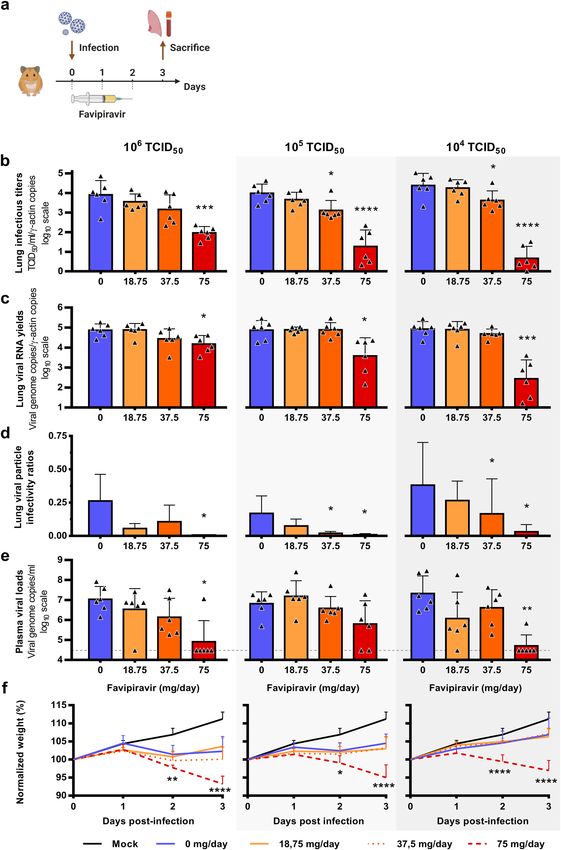
NATURE COMMUNICATIONS | https://doi.org/10.1038/s41467-021-21992-w                                                                                 ARTICLE

 Table 1 In vitro efficacy of favipiravir.

 Cell line                       MOI                         Drug effective concentrationa                   Infectious titer reductionb

                                                             EC50                     EC90                   125 µM                 250 µM               500 µM
 Vero E6                         0.001                       204 µM                   334 µM                 2.2                     13.2                 341.9
                                 0.01                        446 µM                   >500 µM                2.0                      5.7                  10.9
 Caco-2                          0.001                       na                       na                     5.6                    137.4                7720.8
                                 0.01                        na                       na                     4.0                      7.2                 144.0

 MOI multiplicity of infection, na not applicable.
 aEstimated from dose–response curves of antiviral activity (Supplementary Fig. 1).
 bCalculated using mean infectious titers without favipiravir (virus control).

the number of infectious particles over the number of viral RNA                              Estimated ED90 and ED99 were 35 and 47 mg/day, respectively
molecules). Decreased infectivity was observed in all treated                                (Table 2). Significant reductions of viral RNA yields of 0.9 and 3.3
groups of animals. These differences were always significant with                             log10, were observed with animals treated with 37.5 and 75 mg/
the higher dose of favipiravir (p ≤ 0.031) and were significant with                          day TID, respectively (p ≤ 0.023) (Fig. 3c). Resulting infectivity of
the dose of 37.5 mg/day TID for animals infected with 105 or 104                             viral particle was decreased, with a significant reduction only for
TCID50 of virus (p ≤ 0.041) (Fig. 1d). We then measured plasma                               the higher dose of favipiravir (p = 0.005) (Fig. 3e). Finally, we
viral loads using quantitative real-time RT-PCR assay and found,                             found significantly reduced plasma viral loads with animals
with the higher dose of favipiravir and the groups of animals                                treated with 37.5 and 75 mg/day TID (p ≤ 0.005) (Fig. 3f). Once
infected with 106 or 104 TCID50, significant reductions of 2.1 and                            again, signs of toxicity were observed with animal treated with the
2.62 log10, respectively (p ≤ 0.022) (Fig. 1e). Finally, signs of                            dose of 75 mg/day TID: normalized weights were significantly
toxicity were observed with animal treated with the dose of                                  lower than those of untreated animals (Fig. 3d).
75 mg/day TID: normalized weights were significantly lower than                                  In a last set of experiments, we assessed the impact of favipiravir
those of untreated animals (Fig. 1f).                                                        treatment on lung pathological changes induced by SARS-CoV-2.
   In a second set of experiments, we assessed, over a period of                             Animals were intranasally infected with 104 TCID50 of virus.
7 days, the impact of the preemptive therapy on the clinical                                 Treatment with two doses of favipiravir (37.5 and 75 mg/day TID)
course of the disease using weight as the primary criterion                                  was initiated one day before infection (preventive antiviral
(Fig. 2a). Since signs of toxicity were noticed during the first set of                       therapy) or at day of infection (preemptive antiviral therapy)
experiments, we evaluated the toxicity of the three doses of                                 and ended at 3 dpi. For each therapeutic strategy and for each dose
favipiravir with groups of four non-infected animals treated                                 of favipiravir, a group of four animals was sacrificed at 3 and 5 dpi
during four days (Fig. 2b). Important toxicity was observed with                             (Fig. 4a and c). As a control, we used four vehicle-treated groups
the dose of 75 mg/day TID with, from the first day of treatment,                              of four animals (one at 3 dpi and one at 5 dpi for each therapeutic
normalized weights significantly lower than those of untreated                                strategy). Based on the severity of inflammation, alveolar
animals (Supplementary Data 5). We also found a constant, but                                hemorrhagic necrosis and vessel lesions, a cumulative score from
moderate, toxicity with the dose of 37.5 mg/day TID that was                                 0 to 10 was calculated and assigned to a grade of severity (0 =
significant at day 4, 5, and 6 only. No toxicity was detected with                            normal; 1 = mild; 2 = moderate; 3 = marked and 4 = severe;
the lower dose of favipiravir. To assess if the toxicity observed                            details in Supplementary Data 7). Overall, lungs of untreated
with the highest dose of favipiravir was exacerbated by the                                  animals displayed typical lesions of air-borne infection (i.e.,
infection, we compared normalized weights of infected and non-                               broncho-interstitial pneumonia), with a progression between 3 dpi
infected animals treated with the dose of 75 mg/day TID.                                     and 5 dpi that reflects the virus dissemination within the
Regardless of the virus inoculum, no significant difference was                               respiratory tree as previously demonstrated7,21. At 3 dpi, 7/8
observed at 1, 2, and 3 dpi (Supplementary Fig. 4). After this                               untreated animals displayed mild pulmonary pathological changes
evaluation of favipiravir toxicity, we intranasally infected groups                          (Fig. 4b and d) leading to difficulty to assess the efficacy of the
of 10 animals with two virus inocula (105 or 104 TCID50). Each                               treatment even if almost all mean cumulative scores of treated
virus inoculum was assessed in an independent experiment.                                    animals were significantly lower than those of untreated groups. In
Treatment with a dose of 37.5 mg/day TID was initiated on the                                contrast, at 5 dpi all untreated animals displayed severe pulmonary
day of infection (preemptive antiviral therapy) and ended at 3 dpi                           impairments and we observed a dose-dependent effect of
(Fig. 2a). With both virus inocula, treatment was associated with                            favipiravir (Fig. 4b and d). When using a preemptive antiviral
clinical alleviation of the disease (Fig. 2c, d). With the inoculum                          strategy, all animals treated with 37.5 mg/day TID had marked
of 105 TCID50, mean weights of treated animals were significantly                             histopathological damages in lungs and animals treated with
higher than those of untreated animals at 5 and 6 dpi (p ≤ 0.031).                           75 mg/day TID displayed mild or moderate histopathological
Similar observations were made with the inoculum of 104 TCID50                               damages (Supplementary Fig. 5). When using a preventive
at 5, 6, and 7 dpi (p < 0.0001).                                                             antiviral strategy, all animals treated with 37.5 mg/day TID had
   In a third set of experiments, treatment was started 1 day                                mild to marked damages in lung and animals treated with 75 mg/
before infection (preventive antiviral therapy) and ended at 2 dpi.                          day TID displayed no or mild histopathological damages
We intranasally infected groups of 6 animals with 104 TCID50 of                              (Fig. 4e–h). At 5 dpi, significant cumulative score reductions were
virus and viral replication was measured in lungs and plasma at                              observed with both doses of favipiravir regardless the therapeutic
3 dpi (Fig. 3a). Once again, an inverse relationship was observed                            strategy used (p = 0.0286, details in Supplementary Data 8).
between lung infectious titers and the dose of favipiravir (Fig. 3b).
Mean infectious titers for groups of animals treated with 37.5 and
75 mg/day TID were significantly lower than those observed with                               Favipiravir pharmacokinetics (PK) in a hamster model. We
untreated groups (p ≤ 0.002). Of note, undetectable infectious                               first assessed the PK and lung distribution of favipiravir in a
titers were found for all animals treated with the higher dose.                              subgroup of uninfected animals. Groups of animals were treated

NATURE COMMUNICATIONS | (2021)12:1735 | https://doi.org/10.1038/s41467-021-21992-w | www.nature.com/naturecommunications                                          3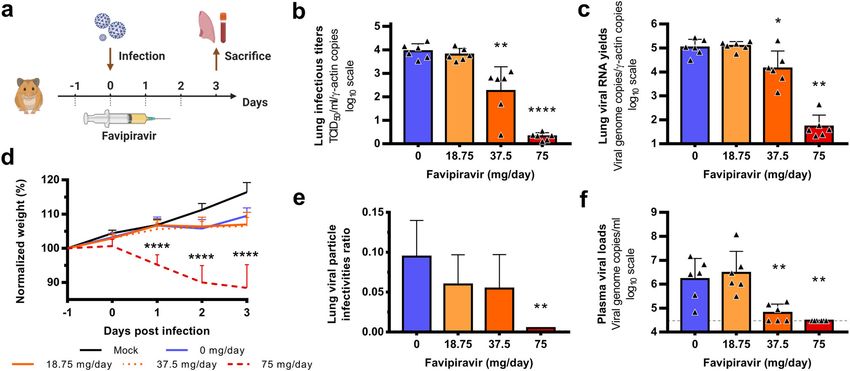
ARTICLE                                                                NATURE COMMUNICATIONS | https://doi.org/10.1038/s41467-021-21992-w

respectively with a single dose of favipiravir administrated                concentration after multiple dose in animals intranasally infected
intraperitoneally: 6.25 mg, 12.5 mg, and 25 mg. In each dose                with 105 TCID50 of virus. Groups of nine animals received the
group, we sacrificed three animals at specific time points post-              three doses evaluated for 3 days (Fig. 1): 18.75 mg/day, 37.5 mg/
treatment (0.5, 1, 5 or 8 h) for determination of favipiravir in            day or 75 mg/day TID and were sacrificed at 12-h after the last
plasma. Drug concentration in lung tissue was determined at 0.5             treatment dose. Favipiravir trough concentrations were quantified
and 5 h post-treatment. Subsequently, we assessed the favipiravir           in plasma (n = 9) and lung tissue (n = 3).

4               NATURE COMMUNICATIONS | (2021)12:1735 | https://doi.org/10.1038/s41467-021-21992-w | www.nature.com/naturecommunications
NATURE COMMUNICATIONS | https://doi.org/10.1038/s41467-021-21992-w ARTICLE
Fig. 1 Virological results with preemptive favipiravir therapy. a Experimental timeline. Groups of 6 hamsters were intranasally infected with 106, 105 or
104 TCID50 of virus. b Viral replication in lung based on infectious titers (measured using a TCID50 assay) expressed in TCID50/copy of ɣ-actine gene
(n = 6 animals/group). c Viral replication in lung based on viral RNA yields (measured using an RT-qPCR assay) expressed in viral genome copies/copy of
ɣ-actine gene (n = 6 animals/group). d Relative lung viral particle infectivities were calculated as follows: ratio of lung infectious titer over viral RNA yields
(n = 6 animals/group). e Plasma viral loads (measured using an RT-qPCR assay) are expressed in viral genome copies/mL of plasma (the dotted line
indicates the detection threshold of the assay) (n = 6 animals/group). f Clinical course of the disease (n = 6 animals/group). Normalized weight at day n
was calculated as follows: % of initial weight of the animal at day n. Data represent mean ± SD (details in Supplementary Data 2). Two-sided statistical
analysis were performed using Shapiro–Wilk normality test, Student t-test, Mann–Whitney test, Welch’s test, and two-way ANOVA with Post-hoc
Dunnett’s multiple comparisons test (details in Supplementary Data 3 and 4). ****, ***, ** and * symbols indicate that the average value for the group is
significantly lower than that of the untreated group with a p-value < 0.0001, ranging between 0.0001–0.001, 0.001–0.01, and 0.01–0.05, respectively.
Source data are provided as a Source data file.
Table 2 Drug effective doses (ED) on reducing viral titers 37,991 reads per genomic position and we subjected substitutions
according to the level of viral inoculum. with a frequency ≥ 1% to further analysis. The genetic variability
in virus stock was also analyzed: 14 nucleotide polymorphisms
Virus inoculum ED50 ED90 ED99 were detected of which 5 recorded a mutation frequency higher
mg/day (95% mg/day (95% mg/day (95% than 10% (Supplementary Data 10).
CIa) CIa) CIa) In order to study the mutagenic effect of favipiravir, we used
Preemptive therapy the consensus sequence from virus stock as reference and all the
104 TCID50 34 (30–37) 42 (38–46) 53 (48–58) mutations simultaneously detected in a lung sample and in virus
105 TCID50 26 (21–30) 37 (31–44) 56 (46–65) stock were not considered in the further analysis (1–4 mutations
106 TCID50 15 (10–20) 31 (21–41) 70 (48–93) per sample, see Supplementary Data 10). Overall, no majority
Preventive therapy mutations were detected (mutation frequency > 50%), and almost
104 TCID50 27 (25–29) 35 (32–38) 47 (44–51) all of the mutations occurred at a frequency lower than 10%
(Fig. 5a). In addition, mutations were distributed throughout the
Dose–response curves are presented in Supplementary Fig. 3.
a95% confidence interval. whole genome (Fig. 5b).
Results revealed a relationship between the number of
mutations detected per sample and the dose of favipiravir
Results are presented in Table 3 and Supplementary Fig. 7. The (Fig. 5c): the mean number of mutations increased by a factor 2
single dose PK analysis showed that the maximum concentration and 4.8 with groups of animals treated with 37.5 and 75 mg/day,
of favipiravir was observed at 0.5 h at all doses, then plasma drug TID respectively. The difference is significant only with a dose of
concentrations decreased exponentially to reach concentrations 37.5 mg/day TID (p = 0.029). This increase of the number of
below 10 µg/ml at 12 h. Favipiravir PK exhibited a non-linear mutations is mainly the consequence of the occurrence of a large
increase in concentration between the doses. After multiple doses, number of G → A substitutions and, to a lesser extent, C → U
trough concentrations (12 h) of favipiravir also exhibited a non- substitutions. Consequently, regardless of the dose of favipiravir,
linear increase between doses. The extrapolated 12 h post- mean frequency of G → A substitutions was significantly
treatment concentrations after a single dose were calculated in increased by a factor of 4.2 (p ≤ 0.009). This rise of these
order to determine the accumulation ratio. Accumulation ratios transition mutations led to increased frequency of all transition
were respectively 6, 16, and 21 at the three doses, confirming the mutations (significant only at dose of 37.5 mg/day TID;
non-proportional increase between doses. The average concen- p = 0.037) and increased frequency of non-synonymous muta-
tration after single dose administration over 0–12-h intervals was tions (significant only at dose of 75 mg/day TID; p = 0.009)
calculated and the respective values obtained were 10.1 µg/mL, (Fig. 5d). We investigated whether or not effectiveness in treated
38.7 µg/mL, and 100.5 µg/mL for the three favipiravir doses. animals was linked with the characteristics of the mutations
Favipiravir lung concentrations were 1.6–2.7-fold lower than in detected on viral populations and found that infectious titers in
plasma for both administration of single and multiple doses. After lungs were negatively associated with frequency of non-
a single dose, the mean lung to plasma ratio ranged from 0.37 to synonymous and G → A mutations, and positively associated
0.62 according to the time post-treatment and was similar with frequency of synonymous mutations (p < 0.03; Fig. 5e).
between the three doses of favipiravir at 0.5 h. A high ratio 5 h Finally, our experiments revealed some parallel evolution events;
post-treatment was observed at the highest dose (25 mg) with an 32 substitutions in viral sub-populations were detected in two
increase by a factor 1.6–1.8 compared with the lower doses. After independent animals. Notably, 18 of these shared mutations were
multiple doses, the lung penetration of favipiravir was confirmed detected only with treated animals, 14 of them being non-
with a mean lung to plasma ratio ranging from 0.35 to 0.44. synonymous (Supplementary Data 13). These mutations are
Favipiravir was not detected in the lungs at the lowest dose located in nsp2, 3, 4, 5, 6, 14, N protein, Matrix, ORF 3a and 8. At
(18.75 mg/day). this stage, one cannot conclude if these substitutions reflect the
adaptation to the hamster model or are the result of the antiviral
Mutagenic effect of favipiravir. To understand which genomic selection.
modifications accompanied favipiravir treatment, direct complete
genome sequencing of clarified lung homogenates from animals Discussion
intranasally infected with 106 TCID50 of virus and treated with In the current study, we used a hamster model to assess efficacy of
the two highest doses of drug (preemptive antiviral therapy; the favipiravir against SARS-CoV-2. Following infection, viral
Fig. 1) was performed. Data were generated by next-generation RNA was mainly detected in lungs, blood, and, to a lesser extent,
sequencing from lung samples of four animals per group in the large bowel. Peak of viral replication was observed at
(untreated, 37.5 mg/day TID and 75 mg/day TID). The mean 2–3 dpi, in line with recently reported investigations that involved
sequencing coverage for each sample ranged from 10,991 to 6–10-weeks-old hamsters7. Clinically, the main symptom was the
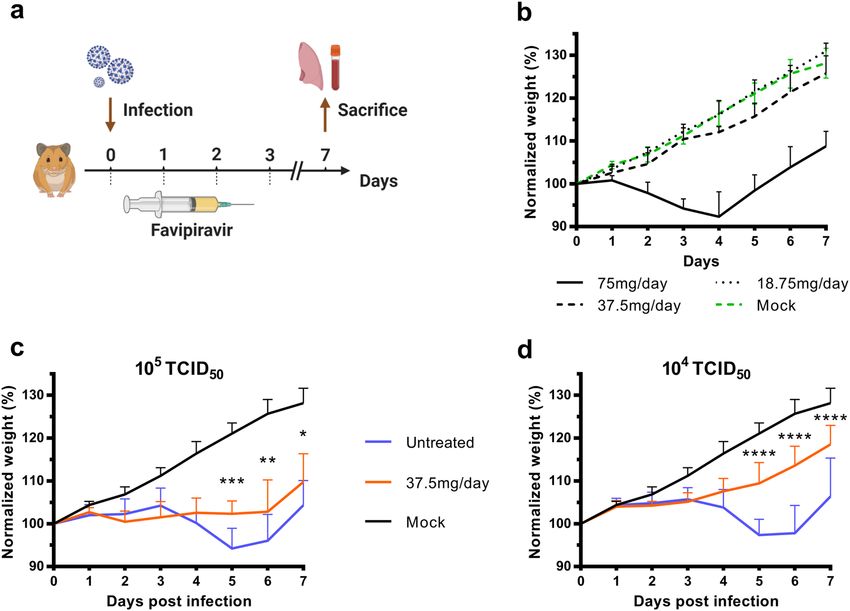
NATURE COMMUNICATIONS | (2021)12:1735 | https://doi.org/10.1038/s41467-021-21992-w | www.nature.com/naturecommunications 5ARTICLE NATURE COMMUNICATIONS | https://doi.org/10.1038/s41467-021-21992-w Fig. 2 Clinical follow-up of animals. a Experimental timeline. b Evaluation of the toxicity of the three doses of favipiravir (mg/day TID) with groups of four uninfected animals following the experimental timeline described in panel a but without infection. c, d Clinical follow-up with groups of 10 animals infected respectively with 105 and 104 TCID50 of virus and treated with a dose of favipiravir of 37.5 mg/day TID. Normalized weight at day n was calculated as follows: % of initial weight of the animal at day n. Data represent mean ± SD (details in Supplementary Data 2). Two-sided statistical analysis were performed using two-way ANOVA with Post-hoc Dunnett’s multiple comparisons test or Post-hoc Sidak’s multiple comparisons test (details in Supplementary Data 5). ****, ***, ** and * symbols indicate that the average value for the group is significantly lower than that of the untreated group with a p-value < 0.0001, ranging between 0.0001–0.001, 0.001–0.01, and 0.01–0.05, respectively Source data are provided as a Source data file. Fig. 3 Virological results with preventive favipiravir therapy. a Experimental timeline. Groups of 6 hamsters were intranasally infected with 104 TCID50 of virus. b Viral replication in lungs based on infectious titers (measured using a TCID50 assay) expressed in TCID50/copy of ɣ-actine gene (n = 6 animals/ group). c Viral replication in lungs based on viral RNA yields (measured using an RT-qPCR assay) expressed viral genome copies/copy of ɣ-actine gene (n = 6 animals/group). d Clinical course of the disease (n = 6 animals/group). Normalized weight at day n was calculated as follows: % of initial weight of the animal at day n. e Relative lung virus infectivities were calculated as follows: ratio of lung infectious titer over viral RNA yields (n = 6 animals/group). f Plasma viral loads (measured using an RT-qPCR assay) are expressed in viral genome copies/mL of plasma (the dotted line indicates the detection threshold of the assay) (n = 6 animals/group). Data represent mean ± SD (details in Supplementary Data 2). Statistical analysis were performed using Shapiro–Wilk normality test, Student t-test, Mann–Whitney test, One-sample t-test and two-way ANOVA with Post-hoc Dunnett’s multiple comparisons test (details in Supplementary Data 3 and 4). ****, ** and * symbols indicate that the average value for the group is significantly different from that of the untreated group with a p-value < 0.0001, ranging between 0.001–0.01 and 0.01–0.05, respectively. Source data are provided as a Source data file. 6 NATURE COMMUNICATIONS | (2021)12:1735 | https://doi.org/10.1038/s41467-021-21992-w | www.nature.com/naturecommunications
NATURE COMMUNICATIONS | https://doi.org/10.1038/s41467-021-21992-w                                                                 ARTICLE

lack of weight gain, observed from the first day of infection and                the in vivo model, with younger animals (4 weeks-old), is suitable
followed by recovery at 7 dpi. Histopathological changes are                    for preclinical evaluation of antiviral compounds against SARS-
comparable to those previously described7,21. Notably, our results              CoV-2.
revealed that all animals with marked or severe pulmonary                          Using a preemptive strategy, we demonstrated that doses of
impairments displayed vascular lesions (endothelitis, vasculitis) as            favipiravir of around 700–1400 mg/kg/day TID reduced viral
previously described in humans22. Overall, this confirmed that                   replication in the lungs of infected animals and allowed clinical

NATURE COMMUNICATIONS | (2021)12:1735 | https://doi.org/10.1038/s41467-021-21992-w | www.nature.com/naturecommunications                        7
ARTICLE                                                                                        NATURE COMMUNICATIONS | https://doi.org/10.1038/s41467-021-21992-w

Fig. 4 Lung histopathological changes with preemptive or preventive favipiravir therapy. Groups of four animals were intranasally infected with 104
TCID50 of virus and sacrificed at 3 and 5 dpi. Experimental timelines for preemptive (a) and preventive (c) favipiravir therapies. At day of sacrifice, lungs
were collected, fixed, and embedded in paraffin. Tissue sections were stained with hematoxylin-eosin (H&E). Based on severity of inflammation, alveolar
hemorrhagic necrosis, and vessel lesions, a cumulative score from 0 to 10 was calculated and assigned to a grade of severity (I, II, III, and IV). Scoring of
pathological changes for preemptive (b) and preventive (d) favipiravir therapies (n = 4 animals/group) (details in Supplementary Data 7). Two-sided
statistical analysis were performed using Shapiro–Wilk normality test, Student t-test, Mann–Whitney test, and two-way ANOVA with Post-hoc Dunnett’s
multiple comparisons test (details in Supplementary Data 7 and 8). * Symbol indicates that the average value for the group is significantly different from
that of the untreated group with a p-value ranging between 0.01 and 0.05. e Representative images of lung tissue (left lobe) (scale bar: 4 mm): multifocal
and extensive areas of inflammation for untreated animal, multifocal but limited areas of inflammation for 37.5 mg/day treated animal and normal lung for
75 mg/day treated animal (n = 4 samples/group). f Representative images of bronchial inflammation (scale bar: 100 µ): severe peribronchiolar
inflammation and bronchiole filled with neutrophilic exudates for untreated animal, mild peribronchiolar inflammation for 37.5 mg/day treated animal and
normal bronchi for 75 mg/day treated animal (n = 4 samples/group). g Representative images of alveolar inflammation (scale bar: 100 µ): severe
infiltration of alveolar walls, alveoli filled with neutrophils/macrophages for untreated animal, moderate infiltration of alveolar walls, some alveoli filled with
neutrophils/macrophages for 37.5 mg/day treated animal and normal alveoli for 75 mg/day treated animal. h Representative images of vessel
inflammation (scale bar: 50 µ): infiltration of vascular wall with neutrophils/cell debris and endothelial damage (arrow) for untreated animal, moderate
endothelial leukocytic accumulation for 37.5 mg/day treated animal and normal vessel for 75 mg/day treated animal (n = 4 samples/group). Clinical
courses of the disease are presented in Supplementary Fig. 6. Source data are provided as a Source data file.

 Table 3 Plasma and lung concentrations of favipiravir after administration of a single dose or multiple dose of favipiravir.

 Time post-treatment Single dose                                                                              Multiple dosea (Day 3)

                                Dose         Plasma (µg/mL) Lung (µg/g) L/p ratio                             Dose                       Plasma (µg/mL) Lung (µg/g)      L/p ratio
 0.5 h                          25 mg   372 ± 47.5                    216 ± 39            0.58 ± 0,04         75 mg/day TID
 1h                                     279 ± 49.9
 5h                                     135 ± 49.0                    81.3 ± 24           0.62 ± 0.10
 8h                                     5.77 ± 1.34
 12 h                                   1.43b                                                                                            29.9 ± 9.83       16.0 ± 4.87   0.44 ± 0,07
 0.5 h                          12.5 mg 166 ± 52.0                    90.7 ± 12.7         0.58 ± 0.14         37.5 mg/day TID
 1h                                     155 ± 20.6
 5h                                     10.7 ± 5.16                   3.84 ± 1.49         0.37 ± 0.052
 8h                                     1.94 ± 0.06
 12 h                                   0.16b                                                                                            2.57 ± 1.22       1.36 ± 0.14   0.35 ± 0,03
 0.5 h                          6.25 mg 86.3 ± 4.11                   50.2 ± 16.4         0.58 ± 0.17         18.75 mg/day TID
 1h                                     35.2 ± 27.8
 5h                                     2.90 ± 0.25                   1.09 ± 0.05         0.38 ± 0.05
 8h                                     0.56 ± 0.16
 12 h                                   0.05b                                                                                            0.31 ± 0.14       Not detected NA

 NA not applicable.
 Data represent mean ± SD; three animals for each condition except at multiple dose (n = 9 for plasma; n = 3 for lung); details in Supplementary Data 9.
 aPK realized after 3 days of favipiravir administered three times a day, at the end of the dosing interval (trough concentrations).
 bExtrapolated C .
                 12h

alleviation of the disease (Figs. 1 and 2). In the most favorable                                       In the present study, reduction of viral replication was corre-
situation, where high doses were used as a preventive therapy,                                       lated with the dose of favipiravir administrated and inversely
favipiravir led to undetectable viral replication in lung and plasma.                                correlated with the virus inoculum. In a recent study, the efficacy
These results showed that the use of high doses of favipiravir could                                 of favipiravir intraperitoneally or orally administrated twice daily
expand its in vivo spectrum against RNA viruses. Reduction of                                        (loading dose of 900 and 1200 mg/kg/day followed by 600 and
viral replication was greater when estimated on the basis of                                         1000 mg/kg/day, respectively) was assessed using a similar ham-
infectious titers than on total viral RNA as previously observed in                                  ster model (6–10 weeks old) with high virus inocula (2 × 10⁶
non-human primates treated with Remdesivir and in hamsters                                           TCID50)24. Treatment with the highest dose of favipiravir resulted
treated with favipiravir23,24. Furthermore, the analysis of pul-                                     in a moderate decrease of viral RNA yields in lung tissue and the
monary histopathological changes revealed that favipiravir played                                    lowest dose induced an even smaller inhibitory effect. However,
a protective role by reducing the severity of the lesions. However,                                  significant infectious titers reduction were observed in a dose-
the effective doses of favipiravir were higher than those usually                                    dependent manner in lungs. Both doses were also associated with
used in rodent models (≈100–400 mg/kg/day)10,12,25–28. This can                                      regression of pulmonary histopathological impairments. Overall,
be correlated with the high favipiravir EC50 found in vitro for                                      these results are in accordance with ours at the medium and the
SARS-CoV-2. Moreover, effective doses were associated with sig-                                      high doses of favipiravir (around 670 and 1390 mg/kg/day TID).
nificant toxicity in our hamster model (Fig. 2). This observed                                        However, in this other study, no signs of toxicity were associated
toxicity reflected only the adverse effects of favipiravir and was not                                with favipiravir treatment regardless the dosing regimen. This
exacerbated during SARS-CoV-2 infection. Indeed, similar                                             discrepancy could be due to the difference between (i) the highest
weights were measured among infected and non-infected animals                                        daily doses used (1000 mg/kg/day in regards to 1390 mg/kg/day
treated with the highest dose of favipiravir at 1, 2, and 3 dpi.                                     in our study), (ii) the dosing regimens (BID instead of TID in our

8                       NATURE COMMUNICATIONS | (2021)12:1735 | https://doi.org/10.1038/s41467-021-21992-w | www.nature.com/naturecommunications
NATURE COMMUNICATIONS | https://doi.org/10.1038/s41467-021-21992-w ARTICLE study), and/or (iii) the age of the hamsters at day of infection This inhibits RNA strand extension and induces abnormal levels (6–10 weeks old in comparison to 4 weeks old in our study). of mutation accumulation into the viral genome16,17. Recently, it With influenza viruses, favipiravir acts as a nucleotide analog was shown in vitro that favipiravir has a similar mechanism of since it is recognized as a purine nucleotide by the viral RNA- action with SARS-CoV-2 through a combination of chain ter- dependent RNA polymerase. It is metabolized intracellularly to its mination, reduced RNA synthesis and lethal mutagenesis20. Our active form and incorporated into nascent viral RNA strands. genomic analysis confirmed the mutagenic effect of favipiravir NATURE COMMUNICATIONS | (2021)12:1735 | https://doi.org/10.1038/s41467-021-21992-w | www.nature.com/naturecommunications 9
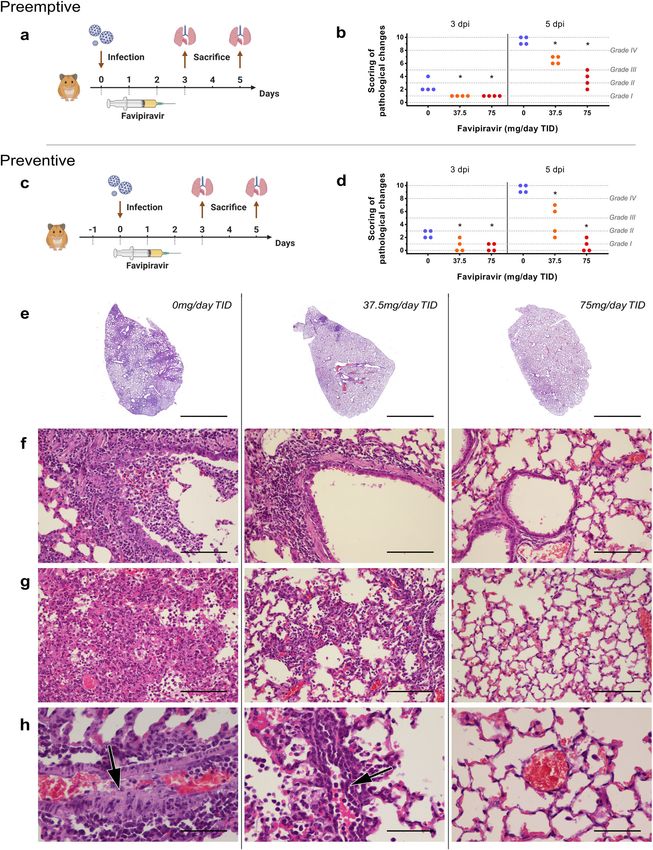
ARTICLE                                                                    NATURE COMMUNICATIONS | https://doi.org/10.1038/s41467-021-21992-w

Fig. 5 Mutagenic effect of favipiravir. a Viral genetic diversity in clarified lung homogenates. For each condition, four samples were analyzed. Each triangle
represents a mutation (only substitutions with a frequency ≥ 1% were considered). b Patterns of mutation distribution on complete viral genome. Each
variable nucleotide position was counted only once when found. The variability was represented using 75 nt sliding windows. For each condition, variable
nucleotide positions were determined and represented using a 300 nt sliding window. c Mean number of mutations (n = 4 samples/group). Data represent
mean ± SD. d Mutation characteristics (n = 4 samples/group). For each sample, the frequency of a given mutation was calculated as follows: number of
this kind of mutation detected in the sample divided by the total number of mutations detected in this sample. Data represent mean ± SD (details in details
in Supplementary Data 10 and 13). Two-sided statistical analysis were performed using Shapiro–Wilk normality test, Student t-test, Mann–Whitney test,
and Welch’s test (details in Supplementary Data 11 and 12). ***, ** and * symbols indicate that the average value for the group is significantly lower than
that of the untreated group with a p-value ranging between 0.0001–0.001, 0.001–0.01, and 0.01–0.05, respectively. e Association between lung infectious
titers (measured using a TCID50 assay) and frequency of non synonymous, synonymous and G → A mutations. Each dot represent data from a given
animal. Statistical analysis was performed using univariate linear regression. The error band (in gray) represent the 95% confidence interval of the
regression line. Source data are provided as a Source data file.

in vivo24. Indeed, we found that favipiravir treatment induced                     The medium dose of favipiravir used in this study (670 mg/kg/
appearance of a large number of G → A mutations into viral                      day TID) is within the range of the estimated doses required to
genomes (Fig. 5). This was associated to a decrease of viral                    reduce by 90% (ED90) the level of infectious titers in lungs
infectivity probably because alteration of the genomic RNA dis-                 (ranging between 31 and 42 mg/day corresponding to
turb the replication capacity. Similar findings were described                   570–780 mg/kg/day) (Table 2) and displayed limited drug-
in vitro and in vivo with other RNA viruses9,16,29,30. Of note, we              associated toxicity (Fig. 2b). Animals infected with 105 and 104
also observed a strong inverse association between infectious                   TCID50 of virus, and treated following a preemptive strategy with
titers in lungs and the proportion of non-synonymous mutations                  this dose displayed significant reduction of infectious titers and
detected in viral populations. Because random non-synonymous                    histopathological scores in lungs and clinical alleviation of the
mutations are more deleterious than synonymous mutations31,                     disease (Figs. 1, 2, and 4). Animal treated following a preventive
this suggests that they were randomly distributed over the three                strategy with this dose also displayed significant reduction of viral
positions of the codons and that no compensatory mechanism                      replication and histopathological scores in lungs (Figs. 3 and 4).
was triggered by the virus to eliminate them (i.e. negative selec-              Regarding the accumulation ratio after repeated doses and the
tion). Finally, the inverse correlation between lung infections                 good penetration of favipiravir in lungs, effective concentrations
titers and the frequency of G → A substitutions showed that an                  can be expected in lungs, throughout the course of treatment
increased proportion of these mutations beyond an error                         using this dose of 670 mg/kg/day TID.
threshold might be expected to cause lethal mutagenesis.                           How clinically realistic are these results? To address this
   Genomic analyses revealed that 18 mutations detected in viral                question we compared the drug concentrations obtained in the
sub-populations were shared only with treated animals. Two of                   hamster model with those obtained in patients. In 2016, a clinical
them were located in the nsp14 coding region involved in the                    trial evaluated the use of favipiravir in Ebola-infected patients41.
proof-reading activity of the viral RNA polymerisation32,33.                    The dose used in Ebola-infected patients was 6000 mg on day 0
However, they were located in the N7 MTase domain involved in                   followed by 1200 mg BID for 9 days. The median trough con-
viral RNA capping34,35. By comparison, resistance mutations                     centrations of favipiravir at day 2 and day 4 were 46.1 and
selected against Remdesivir in β-coronavirus murine hepatitis                   25.9 µg/mL, respectively. This is within the range observed here in
virus model were obtained in the RdRP (nsp12) coding                            hamsters treated with the highest dose (around 1400 mg/kg/day),
sequence36. Further investigations are needed to assess the impact              with a mean trough concentration of 29.9 µg/mL. However,
of these mutations on the antiviral effect of favipiravir.                      additional investigations are required to determine whether or
   Favipiravir PK in our hamster model displayed a non-linear                   not similar favipiravir plasma exposure in SARS-COV-2 infected
increase in plasma exposure between the doses as already                        patients are associated with antiviral activity. The major differ-
reported in non-human primates37. The observed favipiravir                      ences in PK between hamster and humans, and the toxicity
concentration versus time profiles were in agreement with pre-                   observed at the highest doses in our animal model limits the
vious results of a PK study performed in 7–8-week-old hamsters                  extrapolation of our results. Therefore, whether safe dosing
orally treated with a single dose of 100 mg/kg of favipiravir38. The            regimens in humans may achieve similar plasma exposure and
maximum plasma drug concentration occurred at 0.5 h after oral                  recapitulate the profound effect on viral replication is unknown.
administration, earlier than in humans, and then decreased                      Further, the intracellular concentration of the active metabolite
rapidly in agreement with its short half-life39. After repeated                 was not determined and which parameter of the drug pharma-
doses, plasma exposure confirmed non-linear PK over the entire                   cokinetics best drives the antiviral effect remains to be
range of doses, further emphasized by accumulation ratios. The                  established.
important accumulation observed at the highest dose could                          In summary, this study establishes that high doses of favipir-
explain in part the toxicity observed in hamsters at this dose.                 avir are associated with antiviral activity against SARS-CoV-2
Favipiravir undergoes an important hepatic metabolism mainly                    infection in a hamster model. The better antiviral efficacy was
by aldehyde oxidase producing an inactive M1 metabolite and                     observed using a preventive strategy, suggesting that favipiravir
inhibits aldehyde oxidase activity in a concentration- and time-                could be more appropriate for a prophylactic use. Our results
dependent manner. These properties explain the self-inhibition of               should be interpreted with caution because high doses of favi-
its own metabolism as observed in our study in which the highest                piravir were associated with signs of toxicity in our model. It is
dose of favipiravir led to a greater increase in favipiravir                    required to determine if a tolerable dosing regimen could gen-
concentrations40.                                                               erate similar exposure in non-human primates, associated with
   A good penetration of favipiravir in lungs was observed with                 significant antiviral activity, before testing a high dose regimen in
lung/plasma ratios ranging from 35 to 44% after repeated doses,                 COVID-19 patients. Furthermore, subsequent studies should
consistent with its physicochemical properties. Lung exposure                   determine if an increased antiviral efficacy can be reached using
was also in accordance with the previous studies38.                             favipiravir in association with other effective antiviral drugs, since

10                 NATURE COMMUNICATIONS | (2021)12:1735 | https://doi.org/10.1038/s41467-021-21992-w | www.nature.com/naturecommunications
NATURE COMMUNICATIONS | https://doi.org/10.1038/s41467-021-21992-w                                                                                             ARTICLE

this strategy may enable to reduce the dosing regimen of favi-                             Quantitative real-time RT-PCR (RT-qPCR) assays. To avoid contamination, all
piravir. Finally, this work reinforces the need for rapid develop-                         experiments were conducted in a molecular biology laboratory that is specifically
                                                                                           designed for clinical diagnosis using molecular techniques, and which includes
ment of animal models to confirm in vivo efficacy of antiviral                               separate laboratories dedicated to perform each step of the procedure. Prior to PCR
compounds and accordingly, to determine appropriate dose                                   amplification, RNA extraction was performed using the QIAamp 96 DNA kit, and
regimens in humans before starting clinical trials.                                        the Qiacube HT kit and the Qiacube HT (both from Qiagen) following the
                                                                                           manufacturer’s instructions. Shortly, 100 µl of organ clarified homogenates, spiked
                                                                                           with 10 µL of internal control (bacteriophage MS2)42, were transferred into an S-
Methods                                                                                    block containing the recommended volumes of VXL, proteinase K, and RNA
Cells. VeroE6 cells (ATCC CRL-1586) and Caco-2 cells (ATCC HTB-37) were                    carrier. RT-qPCR (SARS-CoV-2 and MS2 viral genome detection) were performed
grown at 37 °C with 5% CO2 in minimal essential medium (MEM) supplemented                  with the Express one step RT-qPCR Universal kit (ThermoFisher Scientific) using
with 7.5% heat-inactivated fetal bovine serum (FBS), 1% penicillin/streptomycin            3.5 µL of RNA and 6.5 µL of RT-qPCR mix that contains 250 nmol of each primer
and 1% non-essential amino acids (all from ThermoFisher Scientific).                        and 75 nmol of probe. Amplification was performed with the QuantStudio 12K
                                                                                           Flex Real-Time PCR System (ThermoFisher Scientific) using the following con-
                                                                                           ditions: 50 °C for 10 min, 95 °C for 20 s, followed by 40 cycles of 95 °C for 3 s, 60 °C
Virus. All experiments with infectious virus were conducted in biosafety level             for 30 s. qPCR (ɣ-actine gene detection) was perfomed under the same condition as
(BSL) 3 laboratory. SARS-CoV-2 strain BavPat1, supplied through European Virus             RT-qPCR with the following modifications: we used the Express one step qPCR
Archive GLOBAL (https://www.european-virus-archive.com/), was provided by                  Universal kit (ThermoFisher Scientific) and the 50 °C step of the amplification
Christian Drosten (Berlin, Germany). Virus stocks were prepared by inoculating at          cycle was removed. Data were collected using the QuantStudio 12K Flex Software
MOI of 0.001 a 25 cm 2 culture flask of confluent VeroE6 cells with MEM medium               v1.2.3. Primers and probes sequences used to detect SARS-CoV-2, MS2 and ɣ-
supplemented with 2.5% FBS. The cell supernatant medium was replaced each 24 h             actine are described in Supplementary Table 1.
and harvested at the peak of infection, supplemented with 25 mM HEPES (Sigma),
aliquoted and stored at −80 °C.
                                                                                           Tissue-culture infectious dose 50 (TCID50) assay. To determine infectious
                                                                                           titers, 96-well culture plates containing confluent VeroE6 cells were inoculated with
In vitro determination of EC50, EC90, CC50, and infectious titer reductions.               150 μL per well of serial dilutions of each sample (four-fold or ten-fold dilutions
One day prior to infection, 5 × 10⁴ VeroE6 cells were seeded in 96-well culture            when analyzing lung clarified homogenates or cell supernatant media, respectively).
plates (5 × 10⁴ cells/well in 100 µL of 2.5% FBS medium (assay medium). The next           Each dilution was performed in sextuplicate. Plates were incubated for 4 days and
day, seven 2-fold serial dilutions of favipiravir (Courtesy of Toyama-Chemical;            then read for the absence or presence of cytopathic effect in each well. Infectious
0.61 µg/mL to 78.5 µg/mL, in triplicate) were added (25 µL/well, in assay medium).         titers were estimated using the method described by Reed & Muench43.
Eight virus control wells were supplemented with 25 µL of assay medium and eight
cell controls were supplemented with 50 µL of assay medium. After 15 min, 25 µL of
virus suspension, diluted in assay medium, was added to the wells at an MOI of 0.01        Favipiravir pharmacokinetics. Animal handling, hamster infections, and favi-
or 0.001 (except for cell controls). Three days after infection, cell supernatant media    piravir administrations were performed as described above. A piece of left lung was
were collected to perform TCID50 assay (at concentration of 500, 250, and 125 µM),         first washed in 10 mL of sodium chloride 0.9% solution, blotted with filter paper,
as described below, in order to calculate infectious titer reductions and cell viability   weighed and then transferred to a 2 mL tube containing 1 mL of 0.9% sodium
was assessed using CellTiter-Blue reagent (Promega) following the manufacturer’s           chloride solution and 3 mm glass beads. It was crushed using the Tissue Lyser
intstructions. Fluorescence (560/590 nm) was recorded with a Tecan Infinite 200Pro          machine (Retsch MM400) during 10 min at 30 cycles/s and then centrifuged 5 min
machine (Tecan). The 50 and 90% effective concentrations (EC50, EC90) were                 at 16,200 × g. Supernatant media were transferred to 2 mL tubes, centrifuged
determined using logarithmic interpolation (% of inhibition were calculated as             10 min at 16,200 × g and stored at −80 °C. One milliliter of blood was harvested in
follows: (ODsample − ODvirus control)/(ODcell control − ODvirus control)). For the eva-    a 2 mL tube containing 100 µL of 0.5 M EDTA (ThermoFischer Scientific). Blood
luation of CC50 (the concentration that induced 50% cytoxicity), the same culture          was centrifuged for 10 min at 16,200 × g and stored at −80 °C.
conditions were set as for the determination of the EC50, without addition of the              Quantification of favipiravir in plasma and lung tissues was performed by a
virus, then cell viability was measured using CellTiter Blue (Promega). CC50 was           validated sensitive and selective validated high-performance liquid
determined using logarithmic interpolation.                                                chromatography coupled with tandem mass spectrometry method (UPLC-TQD,
                                                                                           Waters, USA) with a lower limit of quantification of 0.1 µg/mL. Precision and
                                                                                           accuracy of the three quality control samples (QCs) were within 15% over the
In vivo experiments                                                                        calibration range (0.5 µg/mL to 100 µg/mL) (Bekegnran et al., submitted).
Approval and authorization. In vivo experiments were approved by the local ethical         Favipiravir was extracted by a simple protein precipitation method, using
committee (C2EA—14) and the French ‘Ministère de l’Enseignement Supérieur, de              acetonitrile for plasma and ice-cold acetonitrile for clarified lung homogenates.
la Recherche et de l’Innovation’ (APAFIS#23975) and performed in accordance                Briefly, 50 µL of samples matrix was added to 500 µL of acetonitrile solution
with the French national guidelines and the European legislation covering the use          containing the internal standard (favipiravir-13C,15N, Alsachim), then vortexed
of animals for scientific purposes. All experiments were conducted in BSL 3                 for 2 min followed by centrifugation for 10 min at 4 °C. The supernatant medium
laboratory.                                                                                was evaporated and the dry residues were then transferred to 96-well plates and
                                                                                           50 µL was injected. To assess the selectivity and specificity of the method and
Animal handling. Three-week-old female Syrian hamsters were provided by Janvier            matrix effect, blank plasma and tissues homogenates from 2 control animals
Labs. Animals were maintained in ISOcage P - Bioexclusion System (Techniplast)             (uninfected and untreated) were processed at each run. Moreover, the same control
with unlimited access to water/food and 14 h/10 h light/dark cycle. Animals were           samples spiked with favipiravir concentration equivalent to the QCs (0.75, 50, and
weighed and monitored daily for the duration of the study to detect the appearance         80 µg/mL) were also processed and compared to the QCs samples. Data were
of any clinical signs of illness/suffering. Virus inoculation was performed under          collected using the MassLynx Mass Spectrometry Software 4.1.
general anesthesia (isoflurane). Organs and blood were collected after euthanasia               Noncompartemental analysis conducted using software Pkanalix2019R2 (www.
(cervical dislocation) which was also realized under general anesthesia (isoflurane).       lixoft.com). Areas under the plasma concentration time curve were computed using
                                                                                           medians of favipiravir concentrations at 0.5, 1, 5, and 8 h, and extrapolated until
Hamster Infection. Anesthetized animals (four-week-old) were intranasally infected         T = 12 h. Ctrough were extrapolated at T = 12 h using lambda-z loglinear regression
with 50 µL containing 106, 105 or 104 TCID50 of virus in 0.9% sodium chloride              on the decreasing slope of concentrations.
solution. The mock group was intranasally inoculated with 50 µL of 0.9% sodium
chloride solution.
                                                                                           Histology. Animal handling, hamster infections, and favipiravir administrations
                                                                                           were performed as described above. Lungs were collected after intratracheal
Favipiravir administration. Hamster were intraperitoneally inoculated with dif-            instillation of 4% (w/v) formaldehyde solution, fixed 72 h at room temperature
ferent doses of favipiravir. Control group were intraperitoneally inoculated with a        with a 4% (w/v) formaldehyde solution and embedded in paraffin. Tissue sections
0.9% sodium chloride solution.                                                             of 3.5 µm, obtained following guidelines from the “global open RENI” (The stan-
                                                                                           dard reference for nomenclature and diagnostic criteria in toxicologic pathology;
Organ collection. Organs were first washed in 10 mL of 0.9% sodium chloride                 https://www.goreni.org/), were stained with hematoxylin-eosin (H&E) and blindly
solution and then transferred to a 2 mL or 50 mL tube containing respectively 1 mL         analyzed by a certified veterinary pathologist. Microscopic examination was done
(small/large bowel pieces, kidney, spleen, and heart) or 10 mL (lungs, brain and           using a Nikon Eclipse E400 microscope. Different anatomic compartments were
liver) of 0.9% sodium chloride solution and 3 mm glass beads. They were crushed            examined (see Supplementary Table 2): (1) for bronchial and alveolar walls, a score
using a Tissue Lyser machine (Retsch MM400) for 5 min at 30 cycles/s and then              of 0 to 4 was assigned based on the severity of inflammation; (2) regarding alveoli, a
centrifuged 5 min at 16,200 × g. Supernatant media were transferred to a 2 mL tube,        score of 0 to 2 was assigned based on presence and severity of hemorrhagic
centrifuged 10 min at 16,200 × g, and stored at −80 °C. One milliliter of blood was        necrosis; (3) regarding vessel lesions (endothelitis/vasculitis), absence or presence
harvested in a 2 mL tube containing 100 µL of 0.5 M EDTA (ThermoFischer Sci-               was scored 0 or 1 respectively. A cumulative score was then calculated and assigned
entific). Blood was centrifuged for 10 min at 16,200 × g and stored at −80 °C.              to a grade of severity (see Supplementary Table 3).

NATURE COMMUNICATIONS | (2021)12:1735 | https://doi.org/10.1038/s41467-021-21992-w | www.nature.com/naturecommunications                                                       11
ARTICLE NATURE COMMUNICATIONS | https://doi.org/10.1038/s41467-021-21992-w
Sequence analysis of the full-length genome. 200 µL of lung clarified homo- 4. He, X. et al. Temporal dynamics in viral shedding and transmissibility of
genate or infectious cell supernatant (virus stock) was inactivated with an equal COVID-19. Nat. Med. 26, 672–675 (2020).
volume of VXL lysis buffer (Qiagen) and viral RNA was extracted using an EZ1 5. Dong, E., Du, H. & Gardner, L. An interactive web-based dashboard to track
Advanced XL robot with the EZ1 mini virus 2.0 kit (both from Qiagen) and linear COVID-19 in real time. Lancet Infect. Dis. 20, 533–534 (2020).
acrylamide (ThermoFisher Scientific) in place of carrier RNA. cDNA was generated 6. Mercorelli, B., Palu, G. & Loregian, A. Drug repurposing for viral infectious
in a final volume of 40 µL using 14 µL of nucleic acid extract, random hexamer and diseases: how far are we? Trends Microbiol 26, 865–876 (2018).
the Protoscript II First Strand cDNA Synthesis Kit (New England Biolabs). A 7. Chan, J. F. et al. Simulation of the clinical and pathological manifestations of
specific set of primers (Supplementary Table 4) was used to generate thirteen Coronavirus Disease 2019 (COVID-19) in golden Syrian hamster model:
amplicons covering the entire genome with the Q5 High-Fidelity DNA polymerase implications for disease pathogenesis and transmissibility. Clin. Infect. Dis.
(New England Biolabs). PCR mixes (final volume 25 µL) contained 2.5 µL of cDNA, https://doi.org/10.1093/cid/ciaa325 (2020).
2 µL of each primer (10 µM), and 12.5 µL of Q5 High-Fidelity 2X Master Mix. 8. Rockx, B. et al. Comparative pathogenesis of COVID-19, MERS, and SARS in
Amplification was performed with the following conditions: 30 s at 98 °C, then 45 a nonhuman primate model. Science 368, 1012–1015 (2020).
cycles of 15 s at 98 °C and 5 min at 65 °C. Size of PCR products was verified by gel 9. Guedj, J. et al. Antiviral efficacy of favipiravir against Ebola virus: a
electrophoresis. For each sample, an equimolar pool of all amplicons was prepared translational study in cynomolgus macaques. PLoS Med. 15, e1002535 (2018).
and purified using Monarch PCR & DNA Cleanup Kit (New England Biolabs). 10. Yamada, K. et al. Reevaluation of the efficacy of favipiravir against rabies virus
After DNA quantification using Qubit dsDNA HS Assay Kit and Qubit 2.0 fluo-
using in vivo imaging analysis. Antivir. Res 172, 104641 (2019).
rometer (ThermoFisher Scientific), amplicons were fragmented by sonication into
11. Segura Guerrero, N. A., Sharma, S., Neyts, J. & Kaptein, S. J. F. Favipiravir
fragments of around 200 bp long. Libraries were built by adding barcodes, for
inhibits in vitro Usutu virus replication and delays disease progression in an
sample identification, and primers using AB Library Builder System (ThermoFisher
infection model in mice. Antivir. Res 160, 137–142 (2018).
Scientific). To pool equimolarly the barcoded samples a quantification step by real-
time PCR using Ion Library TaqMan Quantitation Kit (ThermoFisher Scientific) 12. Tani, H. et al. Therapeutic effects of favipiravir against severe fever with
was performed. Then, emulsion PCR from pools and loading on 530 chip was thrombocytopenia syndrome virus infection in a lethal mouse model: dose-
performed using the automated Ion Chef instrument (ThermoFisher Scientific). efficacy studies upon oral administration. PLoS ONE 13, e0206416 (2018).
Sequencing was performed using the S5 Ion torrent technology v5.12 (Thermo- 13. Jochmans, D. et al. Antiviral activity of favipiravir (T-705) against a broad
Fisher Scientific) following the manufacturer’s instructions. Consensus sequence range of paramyxoviruses in vitro and against human metapneumovirus in
was obtained after trimming of reads (reads with quality score < 0.99, and length < hamsters. Antimicrob. Agents Chemother. 60, 4620–4629 (2016).
100 pb were removed and the 30 first and 30 last nucleotides were removed from the 14. Takahashi, K. et al. In vitro and in vivo activities of T-705 and oseltamivir
reads). Mapping of the reads on a reference (determine following blast of De Novo against influenza virus. Antivir. Chem. Chemother. 14, 235–241 (2003).
contigs) was done using CLC genomics workbench software v.20 (Qiagen). A de 15. Rosenke, K. et al. Use of favipiravir to treat lassa virus infection in macaques.
novo contig was also produced to ensure that the consensus sequence was not Emerg. Infect. Dis. 24, 1696–1699 (2018).
affected by the reference sequence. Mutation frequency for each position was cal- 16. Baranovich, T. et al. T-705 (favipiravir) induces lethal mutagenesis in
culated as the number of reads with a mutation compared to the reference divided influenza A H1N1 viruses in vitro. J. Virol. 87, 3741–3751 (2013).
by the total number of reads at that site. Only substitutions with a frequency of at 17. Sangawa, H. et al. Mechanism of action of T-705 ribosyl triphosphate against
least 1% were taken into account for the analysis (Supplementary Data 10). influenza virus RNA polymerase. Antimicrob. Agents Chemother. 57,
5202–5208 (2013).
18. Wang, M. et al. Remdesivir and chloroquine effectively inhibit the recently
ED50, ED90, and ED99 determination. We conducted a nonlinear regression of emerged novel coronavirus (2019-nCoV) in vitro. Cell Res. 30, 269–271 (2020).
infectious
load against dose, using an Emax model, giving VL ¼ VL0 ´
viral 19. Jeon, S. et al. Identification of antiviral drug candidates against SARS-CoV-2
Dγ
1 γ
Dγ þD50
with VL0 being infectious viral load of untreated animals. We from FDA-approved drugs. Antimicrob. Agents Chemother. https://doi.org/
10.1128/AAC.00819-20 (2020).
estimated D50 the dose required to decrease viral load by 50%, using a coeffi-
20. Shannon, A. et al. Rapid incorporation of Favipiravir by the fast and
cient γ to account for the high sigmoidicity of the relation between dose and
titers. γ coefficient was chosen as the one maximizing likelihood of p
theffiffiffiffiffiffiffiffiffiffiffiffiffiffiffiffi
model. permissive viral RNA polymerase complex results in SARS-CoV-2 lethal
pffiffiffiffiffiffiffiffiffiffiffiffiffiffi
γ γ mutagenesis. Nat. Commun. 11, 4682 (2020).
We extrapolated the D90 and D99 using D90 ¼ γ 9 ´ D50 and D99 ¼ γ 99 ´ D50 , 21. Sia, S. F. et al. Pathogenesis and transmission of SARS-CoV-2 in golden
as well as their 95% confidence interval using the delta method.
hamsters. Nature 583, 834–838 (2020).
22. Varga, Z. et al. Endothelial cell infection and endotheliitis in COVID-19.
Graphical representations and statistical analysis. Graphical representations Lancet 395, 1417–1418 (2020).
and statistical analyses were performed with Graphpad Prism 7 (Graphpad soft- 23. Williamson, B. N. et al. Clinical benefit of remdesivir in rhesus macaques
ware) except linear/nonlinear regressions and their corresponding graphical infected with SARS-CoV-2. Nature 585, 273–276 (2020).
representations that were performed using R statistical software (http://www.R- 24. Kaptein, S. J. F. et al. Favipiravir at high doses has potent antiviral activity in
project.org). Statistical details for each experiment are described in the figure SARS-CoV-2-infected hamsters, whereas hydroxychloroquine lacks activity.
legends and in corresponding Supplementary data. When relevant, two-sided Proc. Natl Acad. Sci. USA https://doi.org/10.1073/pnas.2014441117 (2020).
statistical tests were always used. P-values lower than 0.05 were considered sta- 25. Sidwell, R. W. et al. Efficacy of orally administered T-705 on lethal avian
tistically significant. Experimental timelines were created on biorender.com. influenza A (H5N1) virus infections in mice. Antimicrob. Agents Chemother.
51, 845–851 (2007).
Reporting summary. Further information on research design is available in the Nature 26. Smither, S. J. et al. Post-exposure efficacy of oral T-705 (Favipiravir) against
Research Reporting Summary linked to this article. inhalational Ebola virus infection in a mouse model. Antivir. Res. 104,
153–155 (2014).
27. Julander, J. G., Shafer, K., Smee, D. F., Morrey, J. D. & Furuta, Y. Activity of T-
Data availability 705 in a hamster model of yellow fever virus infection in comparison with that
Raw sequence reads of the virus genome analyzed in this study have been deposited in of a chemically related compound, T-1106. Antimicrob. Agents Chemother. 53,
the BioProject data bank (PRJNA648821). Authors can confirm that all other relevant 202–209 (2009).
data are included in the paper and/or its Supplementary information files. Source data 28. Oestereich, L. et al. Efficacy of favipiravir alone and in combination with
are provided with this paper. ribavirin in a lethal, immunocompetent mouse model of lassa fever. J. Infect.
Dis. 213, 934–938 (2016).
Received: 17 July 2020; Accepted: 28 January 2021; 29. Escribano-Romero, E., Jimenez de Oya, N., Domingo, E. & Saiz, J. C.
Extinction of West Nile virus by favipiravir through lethal mutagenesis.
Antimicrob. Agents Chemother. https://doi.org/10.1128/AAC.01400-17 (2017).
30. Arias, A., Thorne, L. & Goodfellow, I. Favipiravir elicits antiviral mutagenesis
during virus replication in vivo. Elife 3, e03679 (2014).
31. Cuevas, J. M., Domingo-Calap, P. & Sanjuan, R. The fitness effects of
References synonymous mutations in DNA and RNA viruses. Mol. Biol. Evol. 29, 17–20
1. WHO. World Health Organization. WHO Director-General’s opening (2012).
remarks at the media briefing on COVID-19—11 March 2020 (https://www. 32. Eckerle, L. D., Lu, X., Sperry, S. M., Choi, L. & Denison, M. R. High fidelity of
who.int) (2020). murine hepatitis virus replication is decreased in nsp14 exoribonuclease
2. Zhu, N. et al. A novel coronavirus from patients with pneumonia in China, mutants. J. Virol. 81, 12135–12144 (2007).
2019. N. Engl. J. Med. 382, 727–733 (2020). 33. Ferron, F. et al. Structural and molecular basis of mismatch correction and
3. Huang, C. et al. Clinical features of patients infected with 2019 novel ribavirin excision from coronavirus RNA. Proc. Natl Acad. Sci. USA 115,
coronavirus in Wuhan, China. Lancet 395, 497–506 (2020). E162–E171 (2018).
12 NATURE COMMUNICATIONS | (2021)12:1735 | https://doi.org/10.1038/s41467-021-21992-w | www.nature.com/naturecommunicationsYou can also read