Welbilt, Inc. 2019 Investor Day & Site Tour May 14 | New Port Richey, FL
←
→
Page content transcription
If your browser does not render page correctly, please read the page content below

Welbilt, Inc.
2019 Investor Day & Site Tour
May 14 | New Port Richey, FL

                                © Welbilt, Inc.
Safe Harbor Statement

Certain statements in this presentation constitute “forward-looking statements” within the meaning of the U.S.
Private Securities Litigation Reform Act of 1995. Statements contained in this presentation that are not historical
facts are forward-looking statements and include, for example, descriptions of the Company’s operating and
strategic plans, the Company’s growth objectives, and any assumptions on which those plans or objectives are
based. Such forward-looking statements involve known and unknown risks and uncertainties, and our actual results
could differ materially from future results expressed or implied in these forward-looking statements. The forward-
looking statements included in this presentation are based on our current beliefs and expectations and speak only
as of the date hereof. These statements are not guarantees or indicative of future performance. Important
assumptions, risks, uncertainties and factors that could cause actual results to differ materially from those forward-
looking statements are described in more detail under the caption "Risk Factors" in our most recent Annual Report
on Form 10-K, Quarterly Reports on Form 10-Q and in our other filings with the Securities and Exchange
Commission. We do not intend, and, except as required by law, we undertake no obligation, to update any of our
forward-looking statements after the date of this presentation to reflect any future events or circumstances. Given
these risks and uncertainties, readers are cautioned not to place undue reliance on such forward-looking
statements.

                                                                                                                                   2
                                                           Investor Day 2019                                             © Welbilt, Inc.
Today’s Agenda

8:30 am   Welcome & Opening Remarks                    10:10 am        Financial Overview
          Rich Sheffer                                                 Marty Agard
          VP IR, Risk Management & Treasurer                           EVP & Chief Financial Officer

          Company Overview & Strategic Direction                       Closing Remarks
          Bill Johnson                                                 Bill Johnson
          President & Chief Executive Officer                          President & Chief Executive Officer

          Innovation & R&D                                             Q&A
          Rick Caron
          EVP & Chief Innovation Officer                               BREAK

          Operations | Americas                       11:30 am         Site Tour
          Josef Matosevic
          EVP & Chief Operating Officer               12:30 pm         Leadership Luncheon

          Operations | EMEA & APAC
          Phil Dei Dolori
          SVP & GM, EMEA & APAC

          BREAK

                                                                                                                       3
                                                   Investor Day 2019                                         © Welbilt, Inc.
Welbilt at a Glance (NYSE: WBT)

March 2016                            Florida (US)                                            ~$2.3B                                    $1.6B                ~5,400               5,000+
  Spin-off Date                           Corporate HQ                                      Market-Cap1                            2018 Revenue         Global Employees      Distributors/Dealers

                                                                                           2018 REVENUE BREAKDOWN

                                                                                                  2%                                                              3%
      11%                                                                                   6%                                 Commercial Kitchen            9%
                                                                                     7%                                        Operators:
                                                                                                                                 Restaurants                                       Dealers, Distributors,
19%                                            Americas
                                                                               8%                                                Business & Industry                               Buying Groups
                                                                                            End
       Region                                  EMEA                                                                              Healthcare
                                                                                                                                                       29%   Channel3              Key Accounts 4
                                                                              8%           Market2                  60%
                                                                                                                                 Travel & Leisure                       59%        Other General Markets
                                               APAC                                                                              Retail                                            Other Chains
                        70%                                                       9%                                             Education
                                                                                                                                 Other

                                          Global Leader in Professional Foodservice Equipment and Systems
        1 As of 5/9/2019; 2 Estimate for WBT Americas; 3 Reflects gross sales for 2018. Includes all third-party product                                                                                   4
        sales. 4 Large end customers.                                                                                      Investor Day 2019                                                     © Welbilt, Inc.
Company Overview &
Strategic Direction
Bill Johnson | President & Chief Executive Officer

                                                               5
                                                     © Welbilt, Inc.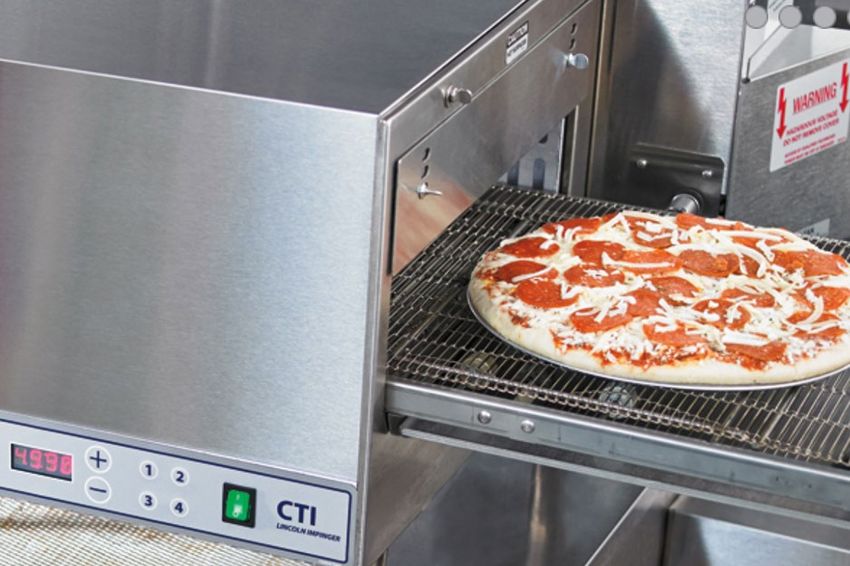
Key Strategic Messages

         01                       02                       03                             04                      05
 Leading brands that      Operational             Further improve the            Uniquely meet            Disciplined capital
 are preferred due to     excellence to deliver   customer's experience          customers' systems       allocation strategy
 innovation leadership,   even higher customer    by effectively going to        needs via investments    focused on de-levering
 enabled by deep          satisfaction at "best   market as a portfolio          in automated             the balance sheet and
 customer                 cost"                   of brands, making us           controls, system         driving higher margins
 relationships                                    easy to do business            solutions and cross-     and strong shareholder
                                                  with                           connectivity across      returns
                                                                                 our products
                                                                                 effectively leveraging
                                                                                 our broad line and
                                                                                 global footprint

Winning the Battle for Customer Preference and Creating a Better Customer Experience in a Cost Effective Manner
                                                                                                                                    6
                                                             Investor Day 2019                                            © Welbilt, Inc.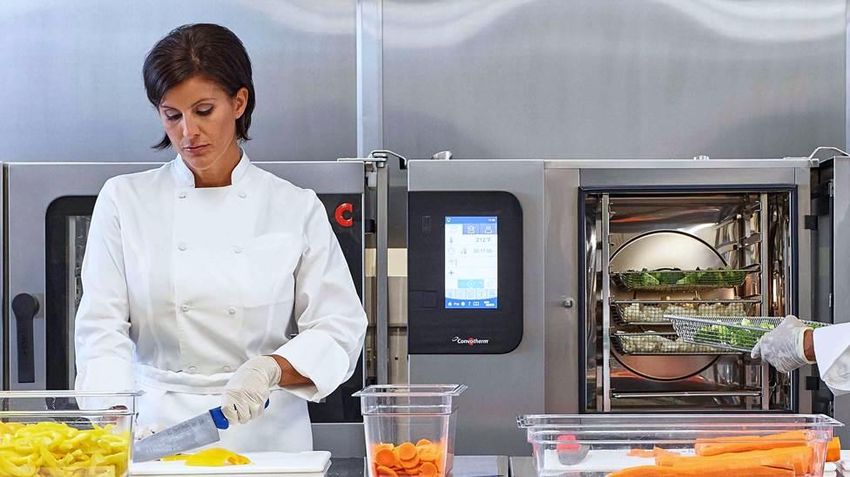
2021 Targets

      1-2%                                                                                                                      3.25x-3.75x
 Organic Revenue Growth                                                                                                                         Leverage
above End-Market Growth                                                                                                                          Ratio1

                                                                  ~500 bps
                                                                                                                                                           FCF Conversion

                                                              Margin Expansion                                                                               1.0x
                                                       (i.e., $75M Run-rate Savings)                                                                        Net Earnings
                                                                  by 2H21

         1 Long-term steady state ratio. Leverage ratio is defined as Net Debt (total debt less cash and cash equivalents

         and short term investments with cash and short term investments netting limited to $150M and adjustments                                                                     7
         included as permitted by our credit facility) divided by Adj. Operating EBITDA.                                    Investor Day 2019                               © Welbilt, Inc.
Our Transformation is Well Underway

                                      WHAT GOT US HERE                                                          WHERE WE ARE GOING

• 2015: ~15% Adj. Operating EBITDA Margin            • 2018: Entered into high growth hot beverage        • We have a strong foundation to deliver our
                                                       market through acquisition of Crem, a leading        strategies
• 2016: Following a history of strategic and           manufacturer of professional coffee machines
  transformative acquisitions, Manitowoc                                                                        • Expanded leading brands
  Foodservice spins-off from The Manitowoc           • 2018-2019: Appointed new President & CEO                 • Portfolio approach
  Company and launches a right sizing and              (Oct 2018) and new EVP & CFO (Apr 2019);
                                                                                                                • Technology foundation
  simplification program                               continue to attract and develop industry-leading
                                                       talent                                                   • Global footprint
• 2017: Begin to integrate digital strategy (e.g.,
  FitKitchen, KitchenConnect)                        • 2019: Completed operational review of              • With a clear path to profitable growth
                                                       businesses identifying ~500 bps run-rate                 • Ready to implement 500 bps plan
• 2017: Manitowoc Foodservice changes name to          improvement in Adj. Operating EBITDA Margin
  Welbilt                                                                                                       • Disciplined value pricing
                                                       by end of 2021
                                                                                                                • Target 1-2% organic growth above industry
                                                                                                                • Embedding operational excellence

  Strategic Review Identified Strong Foundation with Significant Opportunity for Enhanced Profitable Growth
                                                                                                                                                                   8
                                                                               Investor Day 2019                                                         © Welbilt, Inc.
Seasoned, Passionate Leadership Team Driving Industry Change

Bill Johnson            Josef Matosevic      Marty Agard        Rick Caron        Phil Dei Dolori         Joel Horn
President & CEO         EVP & COO            EVP & CFO          EVP & CIO         SVP & GM, EMEA & APAC   EVP & General Counsel
Joined: 2018            2012                 2019               2005              2007                    2004
Years in Industry: 11   7 Years              3 Years            27 Years          34 Years                15 Years

                                  Deep Industry Experience Combined with Fresh Perspectives
                                                                                                                                    9
                                                              Investor Day 2019                                           © Welbilt, Inc.
Customer-Driven Culture

OUR VISION                    OUR MISSION                        OUR VALUES
We are the global leader in   To create value for customers,     INTEGRITY
professional foodservice      employees and shareholders by
equipment and systems         integrating food technology        PASSION
                              and people to build and deliver
                              the highest quality, innovative    TEAMWORK
                              products and systems, offer
                              best-in-class global service and   ENTREPRENEURSHIP
                              enable healthy and safe food
                              experiences                        ACCOUNTABILITY

                                                                                            10
                                             Investor Day 2019                      © Welbilt, Inc.
Our Commitment to Protecting the Environment and Corporate Social Responsibility
ENVIORNMENTAL HEALTH
• Responsible manufacturing with industry
partners, communities and government EMPLOYEE & CONSUMER SAFETY
agencies to improve sustainability efforts
• Require suppliers to use reusable packaging • Safety-first culture
STRONG GOVERNANCE
• Received McDonald’s® Sustainability Award • Internal policies and procedures ensure we
comply with all regional and international
• Broadest offering of “green” products
policies • Seasoned and diverse board comprised of
• 1,800+ products support LEED® Green Building independent business leaders; 3 out of 8
Rating System™ • RoHS2 (Restriction of Hazardous
board members are female
• 1,000+ ENERGY STAR® compliant product Substances) compliant
options • Compensation of management and board
• Help customers recycle and dispose of
• EnerLogic® program helps maximize electric, aligned with shareholder interests
retired equipment
gas and water savings
• ENERGY STAR® Partner of the Year Awards
• R290, a natural, propane grade refrigerant,
can save up to 40% more energy
11
Investor Day 2019 © Welbilt, Inc.Competitive Differentiator #1
Full Line of Product Offerings that Command #1 or #2 Market Positions
SYSTEM SOLUTIONS AFTERMARKET PARTS
Beverage Equipment
Refrigeration & Combi, Conveyor &
Prep. Stations High-speed Ovens
Walk-in Ranges, Grills, Induction
Refrigeration Steamers, Kettles & Skillets
Ice-cube Commercial Fryers,
Machines Hot Holding
Cold Products Hot Products Parts & Service
(~35% - 40% Revenue) (~40% - 45% Revenue) (~15% - 20% Revenue)
Benefits: Strong Foundation and Opportunity with Every Customer to Expand Wallet Share
12
Investor Day 2019 © Welbilt, Inc.Competitive Differentiator #2
Leverage Our Leading Brands by Going to Market as a Portfolio
STORING COOKING HOLDING & DISPLAYING DISPENSING & SERVING
Cross Portfolio Service Brands
Benefits: Growth, Scale and Easy-to-do-Business with
13
Investor Day 2019 © Welbilt, Inc.Competitive Differentiator #3
Technology that Connects Kitchen Operations and Improves Customer Experience
Solution Offering
Full Range of Products Digital FitKitchen
with Common User Services Process &
Interfaces Automation
Establishing a Connected Welbilt Experience and Becoming the Digital Leader in the Industry
14
Investor Day 2019 © Welbilt, Inc.Competitive Differentiator #4
Deep Customer Relationships Spanning Decades
Large Chain Customers typically Designated as “Key Accounts” 2018 Top 5 Global Chain Customers
45+ year average relationship
% of FY18 # of
Customer
Revenue Years1
End Customer 1 9.4% 56
End Customer 2 4.9% 59
End Customer 3 2.8% 29
End Customer 4 2.1% 37
End Customer 5 2.0% 21
2018 Top 5 N.A. Buying Group Customers
% of FY18 # of
Customer
Revenue Years1
Buying Group Customer 1 6.3% 31
US Channel Partners Typically Referred to as “General Market” Buying Group Customer 2 5.9% 10
Buying Group Customer 3 4.7% 10
Buying Group Customer 4 2.8% 30
Buying Group Customer 5 2.5% 24
15
1 Source: Company estimates.
Investor Day 2019 © Welbilt, Inc.Competitive Differentiator #5
Leverage Our Brands, Technology and Relationships via a Leading Global Footprint
• 53 locations in 16
countries
Manufacturing Facilities by Region
• Full-line of hot and AMERICAS EMEA APAC
cold products and
systems are sold in
100+ countries
• Worldwide network
of 5,000+ dealers
and distributors
• Unique product
manufacturing in
local markets to
support global
2018 Revenue by Region
customers
70% 19% 11%
Benefits: Growth, Scale-based Advantage in R&D and Global Accounts
16
Investor Day 2019 © Welbilt, Inc.Summary
Core Strengths and Sustainable Competitive Differentiators
STRENGTHS & DIFFERENTIATORS TARGET OUTCOMES
1. Brands that are #1 or #2
2. Go-to-market as a portfolio Win the battle for customer
3. Technology-driven solutions and
connectivity
preference at least cost
4. Deep customer relationships
5. Global footprint that scales up our
relationships and R&D
Industry leading growth with
6. Operating principles:
• Sustainability and safety rising EBITDA margin
• Operations excellence
Driving Continuous Improvement in Performance for Our Customers
17
Investor Day 2019 © Welbilt, Inc.Welbilt Production System (WPS) | Continuous Improvement is Embedded in Our Culture
Future Focus Areas
Global Network Continue to right size operations footprint and
Optimization move assembly closer to end-markets
Operational Introduce WPS across all plants and implement
Excellence / Lean Lean in all operations
Sourcing & Supply
Implement a strategic sourcing process
Chain Excellence
Operations Simplify business operations following 80/20
Simplification methodology
Quality Drive quality excellence throughout production
Excellence and new product introduction process
Safety
Continue to develop world-class safety culture
Excellence
Quality and Lean Are at the Heart of WPS Today
18
Investor Day 2019 © Welbilt, Inc.Staged Path to “Least Cost” Structure to Achieve Strategies for Preference & Differentiation
24 Months of Execution
CATEGORY WHAT’S ADDRESSED WAVE 1 WAVE 2 WAVE 3 WAVE 4
Procurement • Unit cost for all externally procured components Procurement Procurement Procurement Procurement
N.A. Manufacturing • Labor cost
N.A. Mfg. Site #1 N.A. Mfg. Site #3 N.A. Other Mfg. Sites N.A. Other Mfg. Sites
• Indirect labor cost
• Overhead cost (incl. materials consumption and indirect
spend on site) N.A. Mfg. Site #2 N.A. Mfg. Site #4
• Expedited freight spend
• Product quality
• Technical support
N.A. KitchenCare N.A. KitchenCare N.A. KitchenCare
• Warranty service efficiency
• Labor cost (customer service, marketing)
EMEA & APAC EU Mfg. Core Site EMEA Distribution
• EMEA freight cost
• Labor cost (customer service, marketing)
N.A. S&M • Non-labor cost (trade shows, advertising, SPIFFs) N.A. S&M N.A. S&M
• Alignment of compensation programs
• Brand engineering (both NPI and sustaining)
Engineering Engineering
• Central engineering
• Restructuring G&A (e.g., standardized processes, shared
G&A service centers)
G&A Transformation G&A Transformation
19
Investor Day 2019 © Welbilt, Inc.Leverage Market Trends to Drive Growth
Global Demand for Key Trends Driving Growth
Commercial Food Service Equipment1 ($B)
Rapid urbanization and increasing consumption
~$40B 2-3% Industry of processed food and beverage in emerging markets
Long-term
Expected CAGR
NORTH
$15-$16 2-3% Shift to convenience via E-commerce
AMERICA
EUROPE $9-$10 1-2%
Focus on health and food safety, and traceability
APAC $9-$10 3-4%
Automation and digital technologies to address labor
RoW $5-$6 2-3% costs and traceability
2019E
Through Brand Preference Strategy and Correctly Investing in these Key Trends, We Can Grow 1-2% Above Market
20
1 Source: Industry reports and Company estimates.
Investor Day 2019 © Welbilt, Inc.Summary: Performance Drivers
GROWTH ABOVE MARKET ~500 bps MARGIN IMPROVEMENT
Win the battle for preference (brands, 1-stop,
technology, operations excellence, customer OPERATIONS EXCELLENCE
relationships)
PROCUREMENT INITIATIVE
Portfolio approach: add products per customer
CHANNEL, GLOBAL SCALE
Global coverage
DISCIPLINED PRICING
Invest to benefit from key trends (emerging
markets, technology, e-comm, sustainability) DISCIPLINED CAPITAL ALLOCATION & INVESTMENT
Products / services for KitchenCare TECHNOLOGY + RIGHT PRODUCT VALUE PER SEGMENT
Win the Battle for Customer Preference at Least Cost to Fuel Industry Leading Growth with Rising EBITDA Margin
21
Investor Day 2019 © Welbilt, Inc.2021 Targets
1-2% 3.25x-3.75x
Organic Revenue Growth Leverage
above End-Market Growth Ratio1
~500 bps
FCF Conversion
Margin Expansion 1.0x
(i.e., $75M Run-rate Savings) Net Earnings
by 2H21
1 Long-term steady state ratio. Leverage ratio is defined as Net Debt (total debt less cash and cash equivalents
and short term investments with cash and short term investments netting limited to $150M and adjustments 22
included as permitted by our credit facility) divided by Adj. Operating EBITDA. Investor Day 2019 © Welbilt, Inc.INVESTMENT SUMMARY | CLEAR PATH TO PROFITABLE GROWTH
CONTINUOUS IMPROVEMENT IS Leading brands that are preferred due to innovation leadership, enabled
EMBEDDED IN OUR CULTURE by deep customer relationships
Operational excellence to deliver even higher customer satisfaction at
"best cost"
Further improve the customer's experience by effectively going to market
as a portfolio of brands, making us easy to do business with
Uniquely meet customers' systems needs via investments in automated
controls, system solutions and cross-connectivity across our products
effectively leveraging our broad line and global footprint
Disciplined capital allocation strategy focused on de-levering the balance
sheet and driving higher margins and strong shareholder returns
23
Investor Day 2019 © Welbilt, Inc.Innovation & R&D Overview
Rick Caron | EVP & Chief Innovation Officer
24
© Welbilt, Inc.Innovation Key Messages
01 02 03 04
Innovation Deep customer Our solutions Driving profitable
leadership remains relationships enable customers growth with best-in
a core strategy; provide insights to grow sales, class product
integration of food, that enable improve cost portfolio and
equipment, digital innovation and new management, kitchen systems
technology and product expand businesses to create and
people development and keep menus optimize new
fresh and exciting restaurant
experiences
25
Investor Day 2019 © Welbilt, Inc.Our Open Approach to Innovation
OPEN APPROACH
Building Brand
Preference
through
Quality,
Voice of Platform Equipment Systems & Data
Customer Architecture Connectivity Interoperability Insights and
• Ideation from • Full range of WBT • Existing customer • Data analysis and AI
Total Cost of
customers, suppliers, equipment platforms systems Ownership
universities, etc. • Enabling efficient • Pre-installed • Other operating
• Listen, evaluate and customization connectivity modules management systems
negotiate (born digital) (e.g., FoH)
Enabling Profitable Growth for Our Customers and Welbilt
26
Investor Day 2019 © Welbilt, Inc.Foodservice Operator Needs Are Fueling Demand for Innovation
WHY WE WIN
QUESTIONS ASKED BY OPERATORS
Goal to provide customers with most benefit and
Grow sales? Keep menu fresh? quickest ROI possible
Optimize space? Expand business?
Structured our Company to integrate our brands
Lower labor costs? Cut down training time?
into more complete solutions that deliver on the
Lean out operations? Make brand more accessible? system level
Offering solutions that enable customers to address
all listed questions
Breaking down industry silos through knowledge
building, sharing and collaboration on the kitchen
and customer experience
We Provide Solutions to Scale Across Customer Segments and Address End User Needs
27
Investor Day 2019 © Welbilt, Inc.Leveraging and Integrating Technology in the Design of the Kitchen
WHAT WELBILT OFFERS OUR CUSTOMERS
Achieve Improve
1 Top Line Growth 2 Cost Management
• Flexible, multifunctional equipment • Operational efficiency, connectivity
that are integrated into full solutions and automation
FITKITCHEN CREATION PROCESS
Inspiration Ideation Synthetization Full Scale Implementation
Collect all information related Analyze current process and Info synthesized through models Mockups performed through VR
to brand experience understand customer needs and mockups staged in culinary and design labs; launch products
demos to set path forward
Enable Customer Brand Experience by Leveraging and Integrating Technology in the Design of the Kitchen
28
Investor Day 2019 © Welbilt, Inc.Case Study | FitKitchen: Integrate, Automate and Simplify
Bringing Ideas to Reality
Provide solutions to customer kitchen performance problems
Reduce footprint, capital and labor costs
Improve speed of service and food quality
Diminish complexity in the kitchen
Introduce new technologies and products
Connect digitally through smarter kitchen systems and solutions
Automate intelligently
Offer complete systems and solutions
Leveraging Voice of Customer to Provide Holistic Solutions
29
Investor Day 2019 © Welbilt, Inc.Creating a Connected Restaurant through KitchenConnect: Smart Cloud-Based Technology
• Seamlessly connect entire chain, COMMON USER INTERFACE “EASY TOUCH”
including food supply and service, to ACROSS APPLIANCES AND WEB PORTAL
cloud to provide real time data to better
manage restaurants
Dashboard KPIs
• Link FoH with BoH to enable closed loop
production control to provide Customer Cloud Partner Cloud MENU
instructions on what to cook, how much
and when
Welbilt IoT Cloud Hosting on AWS SERVICE
• Output of Kitchen Connect:
• Simple dashboard displaying KPIs for
running appliances ALERTS
Connectivity Platform (API Option)
- On-time for equipment
- On-time for critical components Product IoT Platform (Hardware, Software)
- Number of usage cycles Food Service Equipment QUALITY
• Ability to monitor and ensure food
safety and quality
Digital Kitchen Technology & Data Generation Provides Unique Competitive Advantage for Both Us & Customers
30
Investor Day 2019 © Welbilt, Inc.KitchenConnect | Roadmap to Deepen Customer Relationships
Individual Applications for Complete Complete
Individual Product Categories Individual Systems Unified Systems
Developing functionality and management Unified complete application suites across all Unified complete application suites and
capability to deploy individual and sets of individual product categories establish interconnectivity throughout
applications to individual product categories the entire kitchen
PLATFORM
KITCHENCONNECT KITCHENCONNECT KITCHENCONNECT
APPLICATIONS
SERVICE ALERTS SERVICE ALERTS
ALERTS
MENU MENU QUALITY MENU QUALITY
INDIVIDUAL
APPLIANCE
Early Stages of Connectivity Enabling Additional Higher Margin Equipment Sales
31
Investor Day 2019 © Welbilt, Inc.Product Solutions Deliver Short Payback For Operators
Solution Performance Benefit to the Operator Typical Operator Payback
Multiplex Fresh • Next Generation self-serve beverage station • Fully Automated self beverage station
Blender • Combines core WBT technologies: ice machine, • Dispense, blend and serve – in the same cup An average of 70 drinks per day
beverage dispensing, blending and automated serves hundreds of beverages per day
cleaning
provides payback
• Reduces waste and saves labor
• Single piece of equipment to do multiple • Drives incremental revenue and profitability
beverages As short as 6 months1
Merrychef • Up to 15x faster than conventional cooking • Speed of service to meet consumer demand
methods: Toasted sandwich in 50 seconds
eikon® e2s • Flexibility to cover any part of day with high An average of 150 food items sold
• Ventless countertop oven with easy quality food
plug-n-play installation
per day provides payback
• Easy to use small footprint with big production
• Certified ventless
• Allows menu expansion to drive incremental As short as 3 months1
revenue and profitability
Convotherm 4 • Multi-use and flexible foundation of the kitchen • Extremely flexible to deliver highest quality,
most-even cooking results
• Superior menu versatility with unwavering An average of 150 food items sold
quality – proteins, vegetables, baked goods • New standard for reliable self-cleaning
per day provides payback
• Simplifies and optimizes kitchen operations • Robust and high quality
• Built-in smoker • Reduced operating costs
As short as 4 months1
1Further savings and quicker ROI can be obtained from removal of multiple appliances that our product 32
solution replaces. Investor Day 2019 © Welbilt, Inc.Accelerating Our Results by 2021
RECENT AWARDS HIGHLIGHTING
• Further adoption of current innovations: rapid cook ovens, OUR INNOVATION SUCCESS
smoothie machines, hot-holding food tracking and KitchenConnect
• R&D Investment: 2-3% of sales
• Vitality Index1 of ~30% increases to 35-40%
• Product platforms from ~40% to ~60%
• Continued innovation with 10+ higher margin, new products
2018 Supplier 2018 Supplier 2018 Supplier
of the Year of the Year of the Year
• 4 disruptive technologies: speed, footprint, sanitation and food
safety and quality
• Full implementation of born digital common controller with
common user interface across all brands
Innovation Leadership Fuels Profitable Growth
33
1 Revenue from products introduced within last five years over total revenue.
Investor Day 2019 © Welbilt, Inc.Key Takeaways
1. Innovation leadership remains a core strategy; integration of
food, equipment, digital technology and people
2. Deep customer relationships provide insights that enable
innovation and new product development
3. Our solutions enable customers to grow sales, improve cost
management, expand businesses and keep menus fresh and
exciting
4. Driving profitable growth with best-in class product portfolio
and kitchen systems to create and optimize new restaurant
experiences
34
Investor Day 2019 © Welbilt, Inc.Operations | Americas
Josef Matosevic | EVP & Chief Operating Officer
35
© Welbilt, Inc.Operations: Americas | Key Messages
01 02 03 04
Differentiated Utilize WPS to Leverage voice of Significant
industry leader with further drive customer to deepen opportunities to
holistic capabilities operational relationships by further penetrate
supported by a excellence and innovating and markets and
global network of expand service elevating solutions leverage existing
leading brands capabilities and through infrastructure for
margins connectivity, profitable growth
automation and
data analytics
36
Investor Day 2019 © Welbilt, Inc.Americas at a Glance
Key Metrics FY18 Sales by Product Class Sales by End Market
Sales $1,091M
Adj. Operating EBITDA1 $233M 17%
17%
23% 60%
83%
Commercial Foodservice Whole Goods General Market - U.S. Dealers & Distributors
Aftermarket Parts and Support Global Strategic Accounts
KitchenCare
#1 or #2 in All End Markets Served
1Adj. Operating EBITDA does not include allocation of corporate and unallocated expenses as well as non- 37
recurring expenses. Investor Day 2019 © Welbilt, Inc.Americas | Core Strengths and Competitive Differentiators
Strengths Differentiators
Flexibility and Global • Lean production system (WPS)
• Speed to change (e.g., menus)
Agility Manufacturing • Engrained 80/20 principles
• Leading brand in served markets
Recurring Global, Innovative
• Long-standing relationships • Smarter automation and connectivity
Revenue Brands
• Data analytics
Innovative,
Customer-focused • Global reach, local touch
• Voice of customer Differentiated
Global Talent • Weekly strategic meetings
Products
• Full portfolio of hot & cold and Complete
Global Client • Joined NexGen Procurement Group
beverage equipment, including Product
Relationships • Field service network
full-line coffee segment Portfolio
Unique Global Player with Holistic Capabilities
38
Investor Day 2019 © Welbilt, Inc.Market Trends
Key Trends Driving Growth HOW WELBILT AMERICAS
IS ADDRESSING TRENDS
Structuring brand families along good, better and best
Shift to convenience via E-commerce
range with flexible and convenient options
Focus on health and food safety, and Enhancing features on equipment to extend and
traceability monitor holding life in food storage
All new equipment born digital; targeted back of
Automation and digital technologies to
house automation to improve speed, free up labor
address labor costs and traceability
and reduce material handling issues
39
Investor Day 2019 © Welbilt, Inc.Our Strategic Path Forward
Create Innovative Drive Operational Achieve
Products and Excellence Profitable
Solutions to Drive through High Growth
Brand Preference Performance
Culture
40
Investor Day 2019 © Welbilt, Inc.Create Innovative Products and Solutions to Drive Brand Preference
CUSTOMER ASK WELBILT SOLUTION RESULTS
Increase speed of • Multiplex Fresh Blender
Fully automated and
service and reduce • Next generation self-serve consumer operated
waste of product for beverage station beverage station
blended beverage • Combines core Welbilt
products; customer technologies: ice machine,
experiencing loss of beverage dispensing, blending, Differentiated feature
10-15% of product in self-cleaning, connectivity and carries over to other
blender automation products
• Single piece of equipment to do
multiple beverages
• Dispense, blend and serve in
Reduction of waste and
same cup; ability to serve labor need
hundreds of beverages per day
Leveraging Welbilt Core Capabilities to Address Customer Needs and Drive Value
41
Investor Day 2019 © Welbilt, Inc.Case Study – N.A. Mfg. Plant: Diagnostic Revealed Several Improvement Vectors
VECTOR CURRENT STATE IMPROVEMENT POTENTIAL
• >5k SKUs, limited re-use, no modularity • 2% scrap and shrinkage •Procurement Case Study – Diagnostic Revealed Several Improvement Vectors
VECTOR CURRENT STATE IMPROVEMENT POTENTIAL
• 10-20% improvement in lead time/fulfilment rate
• Limitations on in-house capacity
Customer Experience • Optimized “make” vs. “buy” strategy and local vs.
• 40%+ spend in high-cost geographies
global sourcing
• >35,000 part numbers • 50-70% reduction in part numbers
Portfolio Complexity • Standardize / use “off-the-shelf” parts
• Long-tail: >90% of part numbers = 20% spend • Modularize sub-assemblies
• >1,000 suppliers, 80% suppliers = 20% spend • Grow preferred suppliers, reduce tail by 20%
Supply-base Complexity
• 50%+ suppliers unique to a brand • Leverage enterprise wide spend
• Targeted request for quotes events to increase
• Limited supplier leverage
Leverage & Outcomes leverage
• ~0% YoY cost reduction
• 3-5% YoY cost reduction
• Advanced analytics / should-cost models
• Limited application of analytical tools
Opportunity & Practices • Capture 50% of should-cost gap through fact-based,
• 10-30%+ gaps in should-cost models
collaborative negotiations
Organization & • Focus on tactical buying vs. strategic sourcing • Category specialists and strategies
Capabilities • Lack of formal capability building • Relevant experts (contracting, analytics)
43
Investor Day 2019 © Welbilt, Inc.Achieve Profitable Growth
Gaining market share in hot/cold coffee in beverage sector
• New relationship with large coffee chain to provide nitrogen-
infused coffee
• Introduce Crem product line in North America in 2Q19
• Leverage breakthrough technology into other products
Early stages of automation and connectivity opportunities
with large QSRs; once proven, expand into general market
Significant growth opportunity within the general market to
further penetrate market with buying groups
Focus on aftermarket parts and service
• Strategic partnerships with largest master parts distributors
and service arms
100-200 bps Above Market Growth
44
Investor Day 2019 © Welbilt, Inc.Key Takeaways
1. Differentiated industry leader with holistic capabilities
supported by a global network of leading brands
2. Utilize WPS to further drive operational excellence and
expand service capabilities and margins
3. Leverage voice of customer to deepen relationships by
innovating and elevating solutions through connectivity,
automation and data analytics
4. Significant opportunities to further penetrate markets and
leverage existing infrastructure for profitable growth
45
Investor Day 2019 © Welbilt, Inc.Operations | EMEA & APAC
Phil Dei Dolori | SVP & GM, EMEA & APAC
46
© Welbilt, Inc.Kanika Hotels Video
47
Investor Day 2019 © Welbilt, Inc.Operations: EMEA & APAC | Key Messages
01 02 03 04 05
Proven ability to Combination of Regional customer- Only global player Deep penetration in
increase sales and deep industry driven innovation with full portfolio emerging markets
margins above experience and new creates virtuous support capabilities with first-mover
industry growth talent to optimize cycle of sales (sales, service, advantage
rates operations growth manufacturing and
R&D) within EMEA
and APAC
48
Investor Day 2019 © Welbilt, Inc.EMEA at a Glance
Key Metrics FY18 Sales by Product Class Sales by End Market
Sales $307M
Adj. Operating EBITDA1 $78M
16%
26%
58%
16%
84%
General Market
Commercial Foodservice Whole Goods KitchenCare
Aftermarket Parts and Support Global Strategic Accounts
#1 or #2 in All End Markets Served
1Adj. Operating EBITDA does not include allocation of corporate and unallocated expenses as well as non- 49
recurring expenses. Investor Day 2019 © Welbilt, Inc.APAC at a Glance
Key Metrics FY18 Sales by Product Class Sales by End Market
Sales $192M
Adj. Operating EBITDA1 $31M
15%
31%
54%
15%
85%
General Market
Commercial Foodservice Whole Goods KitchenCare
Aftermarket Parts and Support Global Strategic Accounts
#1 or #2 in All End Markets Served
1Adj. Operating EBITDA does not include allocation of corporate and unallocated expenses as well as non- 50
recurring expenses. Investor Day 2019 © Welbilt, Inc.EMEA & APAC | Core Strengths and Competitive Differentiators
Strengths Differentiators
• Manufacturing facilities in both regions
• Factories agile and able to adapt to Global including R&D plus local sales and service
peak demand during rollouts Flexibility
Manufacturing network
• Solutions approach (equipment, services
• Track record of delivering above Recurring Global, Innovative and connectivity)
industry average growth Revenue Brands • Ability to develop regional solutions
• Strong aftermarket KitchenCare • Senior leadership teams in both regions
infrastructure in both regions for all Aftermarket Global Talent with 12+ years median industry
brands experience
• Physical presence and infrastructure Emerging Global Client • Global and local client relationships
in key emerging markets (e.g.,
Markets Relationships across multiple sales channels
Russia, India, UAE and China)
Unique Global Player with Holistic Capabilities in Both Regions
51
Investor Day 2019 © Welbilt, Inc.Market Trends
Key Trends Driving Growth HOW WELBILT EMEA & APAC
ARE ADDRESSING TRENDS
Rapid urbanization and increasing consumption Ice machines, fryers, coffee machines, refrigeration and
of processed food and beverage in emerging markets ovens designed and built in Asia for Asia
Shift to convenience via E-commerce In early stages in Europe and accelerating rapidly in Asia
Flexibility to offer freshly cooked food on demand with
Focus on health and food safety, and traceability
the Merrychef eikon® range and Garland induction
Automation and digital technologies to address labor Popular models include built-in connectivity or can be
costs and traceability easily enabled; common controller across product portfolio
52
Investor Day 2019 © Welbilt, Inc.Our Strategic Path Forward
Create Innovative Drive Operational Achieve
Products and Excellence Profitable
Solutions to Drive through High Growth
Brand Preference Performance
Culture
53
Investor Day 2019 © Welbilt, Inc.Create Innovative Products and Solutions to Drive Brand Preference
CUSTOMER ASK WELBILT SOLUTION RESULTS
Large chain looking to • Engaged in a FitKitchen Lite project through
Up to 15x faster than
make a menu change Merrychef eikon® e2s oven offering
conventional cooking
but had concerns • Multi-functional, high-speed oven with methods
about it creating a ability to roast, toast, bake, warm, etc.
bottleneck at their
drive-thru window • Easy to use, small footprint required with
big production capabilities 3x increase in speed of
service at drive-thru
Small footprint in kitchen
required; less products
needed in kitchen
New, Profitable Revenue Opportunities for Both Large Chains and Welbilt
54
Investor Day 2019 © Welbilt, Inc.Case Study – EMEA Planned Improvements
VECTOR CURRENT STATE IMPROVEMENT POTENTIAL
• Drive best practices and lean implementation
• 3 newly acquired facilities with low labor
Direct Production utilization
to world-class standards, while considering
consolidation; target ~$1M in savings
Indirect Production • Some duplication of overhead • Further leaning of management structure
• Elevated warranty expenses in some product • Better root cause analysis to help reduce
Quality Management lines warranty cost by 25%
• Simplified structure to leverage cross-brand
Sales & Distribution • 5 distribution hubs including Crem
synergies
• Improve low cost country sourcing to assist
Sourcing • >40% in high cost countries
YoY cost reduction of 3-5%
55
Investor Day 2019 © Welbilt, Inc.Achieve Profitable Growth
Significant upside potential in share and margin improvement
Penetration in general market gives us stability to capture
replacement business and new customers/markets
Unique opportunity to penetrate further into coffee segment and
convenience stores with Crem
Strategy to design, supply, build, sell and service in region-for-region
(e.g., China-for-China)
Leveraging existing infrastructure in larger existing markets (e.g.,
China, UK, Spain, Germany and Italy) to capture replacement
opportunities and chain growth
Clear first-mover advantage in emerging markets (e.g., Russia,
Poland, Hungary, Bulgaria, Israel, Thailand, India, Vietnam and South
Africa)
100-200 bps Above Market Growth
56
Investor Day 2019 © Welbilt, Inc.Crem International Overview
$83M 900+ 80 700K+ ~400 3
LTM 3’31’19 Revenue Customers Countries Served Installed Base Employees Technology Centers
COMPLETE MARKETS STRONG ENTRY INTO FULLY GEOGRAPHIC
COFFEE OFFERING SERVED AUTOMATIC SEGMENT FOOTPRINT
• Espresso: Manual and Automatic • Hotels, restaurants, catering • >$1B equipment market globally
Amotfors, SE
• Office coffee services • 14% global growth in 2018
Gandia, ES
• Filter: Manual and Automatic • Convenience stores, QSRs • Significant opportunity in QSRs,
hotel / airline clubs and regional Tampa, FL
restaurant chains
• Instant, Liquid Bruchsal, DE
Shanghai, CN
Lead Factory R&D Center
• Aftermarket
Crem Unity
57
Investor Day 2019 © Welbilt, Inc.Key Takeaways
1. Proven ability to increase sales and margins above industry
growth rates
2. Combination of deep industry experience and new talent to
optimize operations
3. Regional customer-driven innovation creates virtuous cycle of
sales growth
4. Only global player with full portfolio support capabilities (sales,
service, manufacturing and R&D) within EMEA and APAC
5. Deep penetration in emerging markets with first-mover
advantage
58
Investor Day 2019 © Welbilt, Inc.BREAK
59
© Welbilt, Inc.Financial Overview
Marty Agard| EVP & Chief Financial Officer
60
© Welbilt, Inc.Financial Key Messages
01 02 03 04 05
Stable revenue from Non-cyclical industry, Significant Margin expansion and Well positioned to
significant resilient and proven opportunities strong organic cash seize opportunities
replacement demand business model with identified to optimize flow generation with and drive profitable
and large installed low capital intensity cost and achieve disciplined investment growth and strong
base with new drives high free cash ~500 bps run-rate program enable de- shareholder returns
product and system flow generation improvement in Adj. leveraging the balance
solutions to fuel Operating EBITDA sheet
growth Margin by 2H21
61
Investor Day 2019 © Welbilt, Inc.Key Observations as Newly Appointed CFO
Brands, culture of innovation and customer relationships are a strong foundation
As a result of our 2016 spin-off, investments are required to advance corporate capabilities
• International operations and complex business structures
• Commodity, currency, interest rate risks, leverage, tax and legal entity complexities
• Independent, leading brands that have unique operating environments and processes
Significant opportunity stemming from systems (multiple ERPs) and administrative footprint (dispersed
locations) offer margin optimization
Stable cash flow generation business that would benefit from de-levering the balance sheet to ensure
flexibility for market opportunities
Well Positioned to Seize Opportunities
62
Investor Day 2019 © Welbilt, Inc.Solid Historical Financial Performance
Net Sales ($M) Adj. Operating EBITDA ($M) Adjusted EPS Free Cash Flow ($M)
& Margin $12 0.3
$106.3 $106.5
$100.1
$1,590
$35 0.3
$0.79 $0.78
$1,456 $290.2
$10 0.3
$1,445
24. 0%
$30 0.3
$265.0 $276.9
22. 0%
$25 0.3 $0.60 $80 .3
20. 0%
$20 0.3
19.2%
$60 .3
18. 0%
$15 0.3
18.2% 18.3% 16. 0%
$40 .3
$10 0.3
14. 0%
$20 .3
$50 .3
12. 0%
$0.3 10. 0% $0.3
FY16 FY17 FY18 FY16 FY17 FY18 FY16 FY17 FY18 FY16 FY17 FY18
• Large installed base and recurring • Margin improvement from ~14.6% • Improvement since spin-off driven • Modest capex and working capital
revenue Adj. Op. EBITDA Margin in 2015 primarily by margin improvement requirements
driven by Right-Sizing initiatives
• 2017 focus was on footprint • Strong FCF conversion of 111% for
consolidation • Tariffs and material costs slowed the 3-year period
margin improvement in 2018
• Innovation leadership supports
revenue growth going forward
Focused on Execution of Strategy to Drive Margin Expansion and Profitable Growth
63
Investor Day 2019 © Welbilt, Inc.Drivers of Our Revenue Opportunity
Expect Continued Modest Global Demand Growth Sources of Above Market Growth
for Commercial Food Service Equipment1 ($B)
• Cross-marketing of brands through regional sales
organizations (e.g., taking Crem into the Americas)
$38.3B
• Filling key product category gaps (e.g. horizontal
cooking) and revitalizing existing platforms
$32.4B
$14.6 • Improved penetration with chain customers in segments
NORTH where our products have a strong right to win
$12.6
AMERICA
• Enhanced strategic alignment with leading channel
$9.5
partners and dealers
EUROPE $8.4
• Innovation in FitKitchen, KitchenConnect and other
customer solution programs to further drive brand
$9.0 preference
APAC $7.0
$5.2
Continue to Drive 1-2% Organic Revenue
RoW $4.5
Growth Above Market
2013 2017
64
1 Source: Azoth.
Investor Day 2019 © Welbilt, Inc.Transformation Program
• Costs will be incurred through mid 2021; savings realization begins Target Run-Rate Savings of $75M by
to ramp in 2020 End of 2021 ($M)
• $70-80M total cost with an expected payback period of 1 year
• Combination of Restructuring and Transformation Program costs (in $75
SG&A); minimal incremental capital vs. run-rate (e.g., ~2% of sales)
• Targeting $75M in run-rate savings by 2H21 (following completion of
Wave 4: ~500 bps run-rate improvement in Adj. Op. EBITDA Margin)
• Program developed in Waves; Wave 1 starting now to include 2
$30
plants, direct material sourcing opportunities and SG&A efficiencies
• 2019 Impacts: Restructuring and Transformation Program costs
$25-30M; ~$3M savings already reflected in guidance $3
2019 2020 2021
Disciplined Management of Transformation Program with Clear Opportunities
65
Investor Day 2019 © Welbilt, Inc.Clear Path for Margin Expansion
125-175 bps ~23% Run-rate
200-250 bps
75-100 bps • Marketing spend
optimization
• In-facility
• Procurement workflow and • KitchenCare,
savings and cost debottlenecking SG&A leverage
engineering
from growth
• Residual
footprint • G&A process
optimization streamlining
Program Pursues Opportunity from Revenue Down through Entire P&L
66
Investor Day 2019 © Welbilt, Inc.Strengthening Balance Sheet (as of 3/31/19)
CAPITAL STRUCTURE TOTAL LIQUIDITY: $210M DEBT MATURITY TIMELINE ($M)
Term
$242 M Credit Revolver Loans
$855
$425 M Notes / Bonds
Total Debt: $1.5B
Senior Secured
$154.3 M
Revolving Credit Facility Notes/
Bonds
$425
Credit
$855 M Term Loans Revolver
$242
Cash and
$55.3 M Cash Equivalents
$185 M Total Equity
$88 M Cash (including ST Investments) 2019 2020 2021 2022 2023 2024 2025
67
Investor Day 2019 © Welbilt, Inc.Capital Allocation Framework | Use of Cash from Operations
Actual 2016-2018 Target 2019-2021 COMMENTARY
$125M/year1 ~$150M/year • Cash from Operations is after Restructuring and
Transformation Program costs of $25-30M/year
M&A: 10-15%
• M&A: priority is to get momentum on operational
Capex: 20-25% improvements, while we de-lever; smaller bolt-ons
M&A: 58% are possible
• Capital spending of $30-40M/year focused on plant
level operational improvements, IT (workflow and
ERP harmonization)
Debt Reduction: 40-50%
Capex: 17% • Gross debt reduction of $60-80M/year, Net Debt
reduction greater
Debt Reduction: 8%
• Some cash expected to build on balance sheet off-
Cash Build: 17% Cash Build: 15-20%
shore
Near-term Priority is Optimization Program and De-leveraging; Some Bolt-on, Accretive Acquisitions Possible
1Cash from Operations adjusted to include the “Cash receipts on beneficial interest in sold receivables” as 68
disclosed in the Statement of Cash Flows within the Cash From Investing Activities section. Investor Day 2019 © Welbilt, Inc.Capital Allocation Supports De-levering to Target Leverage Ratio of 3.25x – 3.75x1 by 2021
Welbilt Net Debt Leverage1
5.5x $1,5 50
5.0x $1,4 50
4.5x
Net Debt / Adjusted EBITDA
$1,3 50
4.0x $1,2 50
3.5x Target Leverage Ratio: 3.25x – 3.75x $1,1 50
3.0x $1,0 50
2.5x $95 0
2.0x $85 0
1.5x $75 0
2016 2017 2018 2019E 2020E 2021E
Cash at Year End: $53.8M $108.5M $70.4M ~$100M $130M-$160M $200M-$250M
Projected De-leveraging Range to Reach Target Level as Early as 2H20
1 Leverage ratio is defined as Net Debt (total debt less cash and cash equivalents and short term investments with
cash and short term investments netting limited to $150M and adjustments included as permitted by our credit 69
facility) divided by Adj. Operating EBITDA. Investor Day 2019 © Welbilt, Inc.Reiterating 2019 Financial Targets
2% - 5% 18.5% - 19.5% $0.71 - $0.81
Organic Net Sales Growth Adj. Operating EBITDA Margin Adj. Diluted Net EPS1
• Planning growth in all regions 1Q19 FY • Interest expense between $92M and
$97M
• Americas: low due to large chain Volume / Mix / Net Pricing +190 bps +225 to +275 bps
rollouts in 2018 • Effective tax rate of 28% to 30%
Material Costs & Tariffs (260 bps) (75 to 125 bps)
• EMEA: momentum with Convotherm • Assumes 141.8M fully diluted shares
and Merrychef Manufacturing Costs: Labor & Overhead (10 bps) 0 to +50 bps outstanding
• APAC: Convotherm and Merrychef SG&A (100 bps) (75 to 125 bps)
penetration
FX / Crem (70 bps) (50) to 0 bps
YoY Change (250 bps) +20 to +120 bps
1Excludes restructuring, gains or losses from impairment or disposal of assets, acquisition transaction/integration 70
costs, Transformation Program expenses, foreign currency transaction gains and losses, and pension settlements. Investor Day 2019 © Welbilt, Inc.2021 Targets
1-2% 3.25x-3.75x
Organic Revenue Growth Leverage
above End-Market Growth Ratio1
~500 bps
FCF Conversion
Margin Expansion 1.0x
(i.e., $75M Run-rate Savings) Net Earnings
by 2H21
1 Long-term steady state ratio. Leverage ratio is defined as Net Debt (total debt less cash and cash equivalents
and short term investments with cash and short term investments netting limited to $150M and adjustments 71
included as permitted by our credit facility) divided by Adj. Operating EBITDA. Investor Day 2019 © Welbilt, Inc.Key Takeaways
1. Stable revenue from significant replacement demand and large
installed base with new product and system solutions to fuel
growth
2. Restructuring and Transformation Program is well defined with
measurable and deliverable opportunities; have begun “Wave 1”
3. Management commitment to optimize cost and achieve ~500 bps
run-rate improvement in Adj. Operating EBITDA Margin by 2H21
4. Resilient and proven business model with low capital intensity
drives high free cash flow generation; combined with disciplined
investment program enables de-leveraging of balance sheet
5. Well positioned to seize opportunities and drive profitable growth
and strong shareholder returns
72
Investor Day 2019 © Welbilt, Inc.Closing Remarks
Bill Johnson | President & Chief Executive Officer
73
© Welbilt, Inc.Key Takeaways
1. A leading global provider of commercial foodservice equipment at
the forefront of innovation with deep customer relationships
2. Experienced leadership team driving profitable growth with leading
brands and new product innovation while transforming the
Company and embedding operational excellence
3. Integrated and complementary portfolio of industry-leading
products enables us to sell automated systems and solutions
4. Clear path to profitable growth over the next several years driven
by strategic investments in connectivity and common control
initiatives
5. Disciplined capital allocation strategy focused on de-levering the
balance sheet and driving higher margins and strong shareholder
returns
74
Investor Day 2019 © Welbilt, Inc.Q&A Session
All Presenters
75
© Welbilt, Inc.Site Tour
76
© Welbilt, Inc.Appendix
77
© Welbilt, Inc.Adjusted Operating EBITDA Reconciliation Table
78
Investor Day 2019 © Welbilt, Inc.Adjusted Net Earnings and Adjusted Diluted Net EPS Reconciliation Table
79
Investor Day 2019 © Welbilt, Inc.Bill Johnson | President & Chief Executive Officer
Bill Johnson is President and Chief Executive Officer of Welbilt, Inc. Before joining Welbilt, Mr.
Johnson was Chief Executive Officer of Chart Industries, Inc., a global manufacturer of highly
engineered equipment for the industrial gas, energy, and biomedical industries. From 2006 to
2016, he held various senior level positions at Dover Corporation, a leading global conglomerate
manufacturer of industrial products. He served as Vice President of Dover Corporation and
President and Chief Executive Officer of Dover Refrigeration and Food Equipment. Before that, he
was President and Chief Executive Officer of Dover’s Hill Phoenix division, a leading designer and
manufacturer of commercial refrigeration systems, and President and Chief Executive Officer of
their Triton Systems division, a designer and manufacturer of ATMs. Earlier in his career, Mr.
Johnson was President and Chief Executive Officer of Graham Corporation, a publicly traded
manufacturer of oil refining, petrochemical and power equipment. He also served as Senior Vice
President of ESAB Welding and Cutting Equipment, a manufacturer of welding, cutting, and steel
industry scarfing equipment. From 1990 to 1999, he held various positions at ABB, a $35 billion
manufacturer of electrification, robotics and motion, industrial automation, and power grid
products. Mr. Johnson began his career as a Commissioned Officer and Nuclear Engineer in the
United States Navy. He holds a B.S. in Ceramic Engineering from Alfred University and an M.B.A.
from Rollins College.
80
Investor Day 2019 © Welbilt, Inc.Josef Matosevic | EVP & Chief Operating Officer
Josef Matosevic is Executive Vice President and Chief Operating Officer of Welbilt, Inc. Prior to
joining Welbilt, he served as Senior Vice President of global operational excellence for The
Manitowoc Company and Executive Vice President, global operations and purchasing, for
Manitowoc Cranes. Prior to joining The Manitowoc Company, Matosevic served in various
executive positions, including Executive Vice President, Global Manufacturing Operations at
Oshkosh Corporation, a designer, manufacturer and marketer of a broad range of specialty
vehicles and vehicle bodies. He also previously served as Vice President of Global Operations and
Chief Operating Officer at Wynnchurch Capital/Android Industries, a sub-assembler and
sequencer of complex modules for automotive original equipment manufacturers. Matosevic
earned a bachelor’s degree from Bayerische Julius-Maximilian’s Universität, Wurzburg, Germany.
81
Investor Day 2019 © Welbilt, Inc.Marty Agard | EVP & Chief Financial Officer
Marty Agard is Executive Vice President and Chief Financial Officer of Welbilt, Inc. Prior to joining
Welbilt in April 2019, Agard was the Chief Financial Officer of Lumber Liquidators Holdings, Inc., a
leading North American specialty retailer to the hard surface flooring market, since September
2016. From 2013 to 2015, he served as Senior Vice President and Chief Financial Officer of Kohler
Company, a manufacturer of kitchen and bathroom fixtures. Prior to Kohler, he held various
financial roles including Vice President and Treasurer with Georgia Pacific Corporation, a pulp
and paper company, since 2001. Earlier in his career, he spent time in financial roles at
Homebanc Mortgage Corporation, The Eastman Kodak Company and The Proctor and Gamble
Company. Agard holds a Bachelor of Science degree in Chemistry and Economics from the
College of William and Mary and a Master of Business Administration degree from the University
of Michigan.
82
Investor Day 2019 © Welbilt, Inc.Rick Caron | EVP & Chief Innovation Officer
Rick Caron is Executive Vice President and Chief Innovation Officer of Welbilt, Inc. Previously, he
served as Executive Vice President Global Marketing and Innovation for Manitowoc Foodservice
and as Manitowoc Foodservice’s Chief Technology Officer, a position that he has held since 2005
as a former Enodis employee. Caron was instrumental in the development and success of the
Education and Technology Center. He has also led a variety of new product development
initiatives, which have helped distinguish the company as a technology leader in the foodservice
industry. Prior to Manitowoc/Enodis, Caron served as Chief Executive Officer for the Moseley
Corporation in Franklin, Massachusetts. He also served as President and Chief Executive Officer
of TurboChef, Inc. in Dallas, Texas. Prior to that, Caron was Managing Director of the consumer
products practice at Arthur D. Little (ADL) in Cambridge, Massachusetts. During his 19-year
affiliation with ADL, Caron led many consulting assignments involving technology, strategy, and
product development. Caron holds several patents in the foodservice industry, including
automated frying and rapid cooking systems. Caron is a graduate of the Massachusetts Institute
of Technology where he earned Master of Science and Bachelor of Science degrees in Chemical
Engineering Practice.
83
Investor Day 2019 © Welbilt, Inc.Phil Dei Dolori | SVP & GM, EMEA & APAC
Philip Dei Dolori is Senior Vice President and General Manager, EMEA and APAC, at Welbilt, Inc.
He is responsible for the company’s continued growth in Western and Eastern Europe as well as
the Middle East and Africa. He is also responsible for all activities within the APAC region,
including China, India, ASEAN, Northeast Asia and Australasia. During his career at Welbilt, Inc.,
Dei Dolori served as Executive Vice President, Americas Cooking Solutions, and Executive Vice
President, Europe, Middle East and Africa. Under Enodis, PLC, which was acquired by Manitowoc
Foodservice, he was Group Managing Director, Asia Pacific/Europe, and Group President, Global
Ice and Beverage. Prior to this, he served as Group President for the Middleby Corporation and
as President of Vulcan-Hart, an ITW company. Dei Dolori is a board member of Cooper-Atkins
Corporation and has served on the board of directors of the North American Association of Food
Equipment Manufacturers (NAFEM). Dei Dolori holds a bachelor’s degree from Connecticut State
University, a master’s degree in international management from the Thunderbird School of
Global Management at Arizona State University, and executive education certificates from
Dartmouth College and the Wharton School at the University of Pennsylvania.
84
Investor Day 2019 © Welbilt, Inc.You can also read