Expanding number of Western US urban centers face declining summertime air quality due to enhanced wildland fire activity
←
→
Page content transcription
If your browser does not render page correctly, please read the page content below
LETTER • OPEN ACCESS

Expanding number of Western US urban centers face declining
summertime air quality due to enhanced wildland fire activity
To cite this article: T Y Wilmot et al 2021 Environ. Res. Lett. 16 054036

View the article online for updates and enhancements.

                                This content was downloaded from IP address 46.4.80.155 on 08/09/2021 at 03:02
Environ. Res. Lett. 16 (2021) 054036 https://doi.org/10.1088/1748-9326/abf966
LETTER
Expanding number of Western US urban centers face declining
OPEN ACCESS
summertime air quality due to enhanced wildland fire activity
RECEIVED
15 January 2021 T Y Wilmot1, A G Hallar1,2,3,∗, J C Lin1 and D V Mallia1
REVISED 1
19 April 2021
University of Utah, Department of Atmospheric Science, Salt Lake City, UT, United States of America
2
Desert Research Institute, Division of Atmospheric Science, Reno, NV, United States of America
ACCEPTED FOR PUBLICATION 3
Storm Peak Laboratory, Desert Research Institute, Steamboat Springs, CO, United States of America
19 April 2021 ∗
Author to whom any correspondence should be addressed.
PUBLISHED
30 April 2021 E-mail: Gannet.Hallar@utah.edu
Keywords: air quality, aerosols, wildfire, wildland fire, trend analyses, Western US, hotspot
Original content from
this work may be used Supplementary material for this article is available online
under the terms of the
Creative Commons
Attribution 4.0 licence.
Any further distribution Abstract
of this work must
maintain attribution to
Combining multiple sources of information on atmospheric composition, wildland fire emissions,
the author(s) and the title and fire area burned, we link decadal air quality trends in Western US urban centers with wildland
of the work, journal
citation and DOI. fire activity during the months of August and September for the years 2000–2019. We find spatially
consistent trends in extreme levels (upper quantile) of fine particulate matter (PM2.5 ), organic
carbon, and absorption aerosol optical depth centered on the US Pacific Northwest during the
month of August. Emerging trends were also found across the Pacific Northwest, western Montana,
and Wyoming in September. Furthermore, we identify potential wildfire emission ‘hotspots’ from
trends in wildfire derived PM2.5 emissions and burned area. The spatial correspondence between
wildfire emissions hotspots and extreme air quality trends, as well as their concomitant spatial shift
from August to September supports the hypothesis that wildfires are driving extreme air quality
trends across the Western US. We derive further evidence of the influence of wildland fires on air
quality in Western US urban centers from smoke induced PM2.5 enhancements calculated through
statistical modeling of the PM2.5 -meteorology relationship at 18 Western US cities. Our results
highlight the significant risk of increased human exposure to wildfire smoke in August at these
Western US population centers, while also pointing to the potential danger of emerging trends in
Western US population growth, wildfire emissions, and extreme air quality in September.
1. Introduction trends toward increasingly extreme air quality have
been identified across much of the Western US [8].
Atmospheric aerosols with an aerodynamic diameter Efforts aimed at attribution of these increases in aer-
of less than 2.5 µms (particulate matter (PM2.5 )) osol loading have indicated biomass burning as a
are known to cause adverse health outcomes, such potential culprit. Emerging trends in PM2.5 associ-
as increased emergency room visits for respiratory ated with smoke have been identified in the Pacific
illness [1–4] and enhanced daily mortality [5, 6]. Northwest and portions of the surrounding Western
In light of these adverse health outcomes, PM2.5 is states [9]. Positive PM2.5 trends have been associated
treated as a ‘criteria pollutant’ by the US Environ- with elevated total carbon at sites across the West-
mental Protection agency (EPA) and regulated under ern US [8], and enhanced surface PM2.5 and aero-
the Clean Air Act, with levels set by the National sol optical depth [10] have been linked to fire smoke
Ambient Air Quality Standards (NAAQS). Currently, within the Colorado Front Range. Urbanization as the
NAAQS attainment requires annual mean and 98th driver of these aerosol trends is unlikely given evid-
percentile PM2.5 concentrations of less than 12 and ence of decreasing trends in the annual mean of PM2.5
35 µg m−3 , respectively, when averaged over three and organic aerosol concentrations throughout the
years. Western US [7, 8, 11].
Despite a 43% decline in national scale average Investigations of wildfire activity point to Western
PM2.5 concentrations over the years 2000–2019 [7], US aerosol trends as the result of a shifting climate,
© 2021 The Author(s). Published by IOP Publishing Ltd
Environ. Res. Lett. 16 (2021) 054036                                                                 T Y Wilmot et al

by which increasing temperatures, aridity [12], and       Given that official city boundaries do not consistently
a declining snowpack [13] promote more frequent           subscribe to population characteristics, these cities
and intense wildfires [14–16]. Linkages between arid-     were defined via a city clustering procedure applied to
ity, fire area burned (FAB), and aerosol loading in       population density and population count data from
the Intermountain West have been documented [17].         NASA’s Socioeconomic Data and Applications Cen-
Positive trends in FAB and the number of large wild-      ter [29]. This procedure allows a ‘city’ to be defined
fires from 1984 to 2011 have been identified [14],        beyond its administrative boundaries. When defining
and modeling under a climate change scenario of           cities, the city clustering algorithm iteratively clusters
2 ◦ C warming by 2050 suggests that the increasing        grid cells meeting a threshold population density if
trend will persist into the future [18]. The climate      they are within some distance (ℓ) of each other [30].
change—wildfire—aerosol linkage in the Western US         An ℓ value of 5 km was used here, as the literature
will expose millions of additional people to elevated     suggests values between 2 and 6 km provide the best
PM2.5 annually by mid-century [19], producing a cor-      alignment between metropolitan statistical areas and
responding increase in premature deaths attributable      city clusters [31]. A population density threshold of
to fire specific PM2.5 [20]. Furthermore, the effects     1000 km−2 was selected via qualitative observations
of climate change will be compounded by the legacy        of returned city clusters using population density
of decades of fire suppression, further amplifying the    thresholds between 500 and 1200 km−2 . The combin-
impact of large fires [21]. The extraordinary fire sea-   ation of a 5 km clustering length and a threshold pop-
son of 2020 in the Western US [22] provides vivid test-   ulation density of 1000 km−2 (e.g. figure S3) seemed
ament to the societal costs of this trajectory.           to provide the best distribution of large cities in the
     With the potential nexus of increasing aerosol       West when requiring the total population of a cluster
load, enhanced fire activity, and a growing Western       exceed 200 000 people. In total, 33 large cities within
US population [23] in mind, we carry out analyses         the Western US were defined using this procedure.
to build upon existing work by: (a) improving cur-             The city clustering performed here can be recre-
rent understanding of aerosol trends by combining a       ated by applying the cca() function from the ‘osc’
multitude of atmospheric composition data—PM2.5 ,         package in R [32] to the referenced datasets. We have
organic carbon, and absorption aerosol optical depth      found that doing so recreates the clusters developed
(AAOD); organic carbon and AAOD serve as markers          here with a maximum discrepancy in total city pop-
for biomass burning given the ability of Western US       ulation of approximately 3%. City clusters will be
wildfire activity to explain organic carbon variability   identical for the majority of the 33 cities defined.
[24] and the sensitivity of AAOD to the presence of            When applied to OMI swath AAOD data, these
brown carbon via differential ultraviolet absorption      city clusters are used to look for intersections of
[25]; (b) refining the temporal resolution of aerosol     the OMI swath with city polygons produced from
trends to monthly; (c) emphasizing human expos-           the gridded clusters. Each OMI pixel that intersects
ure to degraded air quality in urban centers, where       a given city is treated as part of that cities AAOD
the bulk of the population resides; and (d) synthes-      dataset.
izing wildfire emissions and fire burned area with
the atmospheric composition data to illustrate poten-     2.2.2. Quantile regression (QR)
tial hotspot regions that are responsible for frequent    To investigate the trajectory of extreme aerosol events
human exposure to degraded air quality.                   in the Western US, QR was applied to the EPA
                                                          PM2.5 [33], Interagency Monitoring of Protected
2. Methods                                                Visual Environments (IMPROVE) [34–37] PM2.5 and
                                                          organic carbon, EPA Chemical Speciation Network
2.1. Data                                                 (CSN) organic carbon [33, 38], and OMI swath
The spatial information, temporal information, and        AAOD [39] datasets on a month-by-month basis. QR
usage of datasets included in this study are presented    was applied at upper quantiles (98th and 95th) to
in table 1. Individual dataset descriptions and maps      focus our analysis on episodic extreme aerosol events,
of aerosol observation sites can be found in supple-      consistent with the nature of biomass burning. A
mentary information (SI) section S1 (available online     reduced quantile relative to surface aerosol datasets
at stacks.iop.org/ERL/16/054036/mmedia).                  was used for AAOD (95th) to combat data limitations
                                                          from cloud screening.
2.2. Statistical methods                                      QR allows trends to be fitted to the extremes of a
2.2.1. City clustering                                    distribution rather than the mean (linear regression)
As a means of emphasizing human exposure to               by taking advantage of asymmetric weighting during
degraded air quality in our analysis, Ozone Monit-        regression [40, 41]. This asymmetric weighting is in
oring Instrument (OMI) swath AAOD trends and              opposition to the symmetric ordinary least squares
generalized additive modeling (GAM) were applied          approach used for a linear regression. An added bene-
to observations of large ‘cities’ in the Western US.      fit of QR is that it allows for an understanding of

                                             2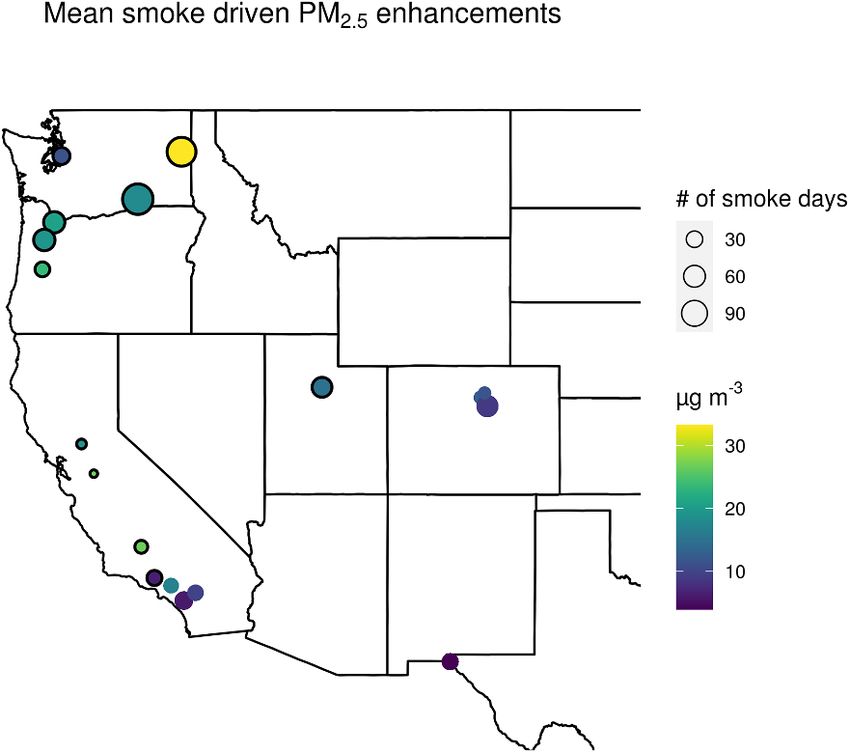
Environ. Res. Lett. 16 (2021) 054036                                                                                    T Y Wilmot et al

Table 1. A description of the data products used. The spatial and temporal information reflects the regions and years used in this study.

Product name                           Spatial info                     Temporal info                        Usage

EPA PM2.5 mass (24 h)                  141 sites                        Daily, 2000–2019                     PM2.5 trends, GAMs
                                                                                                             inputs
IMPROVE PM2.5 mass                     51 sites                         Third day, 2000–2019                 PM2.5 trends
(24 h)
EPA CSN OC mass (24 h)                 27 sites                         Third day, 2000–2019                 Organic carbon trends
IMPROVE OC mass                        96 sites                         Third day, 2005–2015                 Organic carbon trends
(24 h)
OMI swath AAOD                         13 × 24 km, 33 cities            Overpass, 2005–2019                  City scale AAOD trends
GPW Population Density                 30 arc-sec, CONUS                2020 estimate                        City clustering
v4.11
GPW Population Count                   30 arc-sec, CONUS                2020 estimate                        City clustering
v4.11
MTBS Burned Areas                      30 m, fires >405 ha,             2000–2018                            Fire area burned trends
Boundaries                             CONUS
GFED 4.1s                              0.25◦ , CONUS/CA                 2000–2019                            Fire PM2.5 emission
                                                                                                             trends
MFLEI                                  250 m, CONUS                     2003–2015                            Fire PM2.5 emission
                                                                                                             trends
QFED v2.5r1                            0.1◦ , CONUS/CA                  2000–2020                            Fire PM2.5 emission
                                                                                                             trends
FINN v1.5                              1 km, CONUS/CA                   2002–2019                            Fire PM2.5 emission
                                                                                                             trends
NCEP-DOE Reanalysis 2                  2.5◦ , CONUS/CA                  Daily mean, 2000–2019                GAMs inputs
[26]
Radiosonde data [27]                   9 sites                          00/12 UTC, 2008–2019                 GAMs inputs
SPEI [28]                              0.1◦ , CONUS                     Monthly, 2008–2019                   GAMs inputs
NOAA HMS Smoke                         ∼1 km, CONUS                     Daily, 2008–2019                     ‘Smoke’ day designation
Polygons

trends in the extremes of a dataset without a need                        GAMs have previously been used to investigate
to subset the data. We perform QR using the rq()                      enhancements in urban ozone resulting from wildfire
function from the ‘quantreg’ package in R [42]. P-                    smoke inundation [45, 46]. McClure and Jaffe [45]
values and 95% confidence intervals were developed                    use a GAM framework to demonstrate significant
via a bootstrapping procedure supplied by argu-                       increases in ozone on smoke impacted days at an
ments within the summ() function of the ‘jtools’                      EPA site in Boise, Idaho, when accounting for met-
package [43]. Essentially, each QR was reapplied to                   eorological conditions and atmospheric transport. To
100 000 resampled versions of the original dataset,                   achieve this, they fit a GAM to ozone concentration-
with replacement, to see if the regression to the actual              meteorology/back trajectory (xk ) relationships for
dataset was distinguishable at p < 0.05 from the scat-                smoke free days and then used the model to estimate
ter produced by the resampled datasets. Resampled                     ozone concentrations on smoke impacted days (µi ).
datasets were also used to construct 95% confidence                   Model estimates could be considered the expected
intervals. Specifics of QR application to each dataset                ozone concentrations for smoke impacted days based
are provided in SI section S2.                                        on meteorological and transport conditions alone,
                                                                      meaning the model residuals (observed values—µi )
2.2.3. GAM                                                            offered an estimate of the smoke enhancements to
GAMs allow for the combination of many linear                         ozone.
or non-linear predictor variables to estimate some                        Here we apply a GAM framework to 18 EPA PM2.5
response variable, and have the following general                     monitors in the Western US to investigate the role of
form [44]:                                                            wildfire smoke in anomalous PM2.5 values. EPA mon-
                                                                      itors were utilized if they fell within one of the 33
    g (µi ) = Ai θ + f (x1i ) + f (x2i ) + f (x3i , x4i ) . . .       large cities defined by our city clustering procedure
                                                                      and possessed daily data for 2008–2019. We rely on
where g is a link function relating the expected value                the meteorological datasets indicated in table 1 as our
of the response variable (µi ) to a linear combin-                    predictor variables (xk ) to estimate the daily averaged
ation of ordinary linear model components (Ai θ)                      PM2.5 on smoke impacted days (µi ). We employ an
and smooth nonlinear functions (fj ) of predictor                     identity link function, removing g() from the regres-
variables (xk ).                                                      sion equation.

                                                        3
Environ. Res. Lett. 16 (2021) 054036 T Y Wilmot et al
For each monitor, data was first divided into often p < 0.05) in FAB/PM2.5 emissions across many
‘smoke’ and ‘non-smoke’ days following the meth- inventories and time series were considered potential
ods of McClure and Jaffe [45]. ‘Smoke’ days were wildfire emissions hotspots.
required to meet two criteria: (a) the daily averaged FAB within the MTBS was calculated from the
PM2.5 had to be in excess of one standard deviation associated fire perimeter shapefiles using R. This cal-
above the mean across 2008–2019, and (b) the mon- culation is to account for unburned islands within the
itor had to fall within a NOAA Hazard Mapping Sys- maximum fire extent reported by MTBS. As a caveat,
tem (HMS) daily smoke polygon [47]. While HMS it should be noted that MTBS trends reflect FAB by
smoke polygons have previously been used to demon- ignition month, such that the associated emissions
strate statistical differences in PM2.5 concentrations may occur in subsequent months. Given this, the rel-
when smoke is present [48], their subjective basis evant MTBS trend for the Central California Foothills
opens the door for false-negative ‘non-smoke’ desig- and Coastal Mountains ecoregion reported here is for
nations. HMS smoke polygons are developed through July (table S2).
manual analysis of satellite visible imagery, meaning
they are subject to the obscuring effects of clouds and
3. Results and discussion
haze, and are best considered as a conservative estim-
ate of smoke extent [49].
3.1. Western US air quality trends
Once divided into ‘smoke’ and ‘non-smoke’ data-
QR (see section 2) analyses of PM2.5 , organic carbon,
sets, each GAM was trained on ‘non-smoke’ data, fit-
and AAOD datasets indicate statistically significant
ting the model based on PM2.5 -meteorology relation-
trends toward increasingly extreme air quality across
ships, and then applied to ‘smoke’ data. Training on
large portions of the Western US, particularly dur-
‘non-smoke’ data provided a baseline from which to
ing the months of August and September. Multi-
predict ‘smoke’ day PM2.5 from meteorology alone,
year trends for August highlight the Pacific Northw-
allowing for an estimate of the PM2.5 enhancement
est and portions of the Central California Valley as
due to the presence of smoke on these days. Residuals
regions experiencing clear degradation of air qual-
for each dataset, ‘smoke’ and ‘non-smoke’, were ana-
ity, while trends in September point to the Pacific
lyzed for statistical differences. It should be noted that
Northwest, and portions of Western Montana and
the conservative nature of the ‘smoke’ day designation
Wyoming (figure 1). The consistency of spatial pat-
may provide for attribution of smoke driven PM2.5
terns across datasets suggests wildfires are driving
enhancements to meteorological variables within the
trends in extreme air quality across the Western
models, resulting in a tempered estimate of typical
US. These findings are particularly true in urban
PM2.5 enhancements due to smoke for cities in the
centers, as the EPA monitor sites used for PM2.5
Western US. False negatives may also be responsible
analyses tend to cluster in urban settings, and our
for reduced r-squared values in some GAM setups.
city-clustered AAOD (described within section 2)
Specifics of GAM construction and cross-
focuses on locations with elevated population density
validation within R may be found in SI section S3.
(>1000 km−2 ) and total population (>200 000). The
Table S1 describes the implementation of individual
consistency between nearby EPA (primarily urban)
variables in each of our 18 GAMs.
and IMPROVE (primarily rural) PM2.5 trends coun-
ters the hypothesis that these results are driven by
2.2.4. Identification of potential emissions hotspots
urban development.
Recognition of potential wildfire emissions hotspots
with relevance to human exposure to poor air quality
was based on linear trend analyses of monthly aggreg- 3.1.1. August
ated FAB and wildfire emitted PM2.5 in Western Figures 1(a)–(c) depict the upper quantile trends for
US and Western Canadian ecoregions/ecoprovinces the month of August for PM2.5 observations from the
[50, 51]. Supporting statistics were generated via EPA and IMPROVE networks, organic carbon obser-
bootstrapping as outlined in the QR methods. Given vations from the EPA CSN and IMPROVE networks,
the uncertainty in fire emissions inventories, numer- and satellite-based AAOD from the OMI swath-level
ous inventories were considered, including: the Mon- data, respectively. From these panels, it is apparent
itoring Trends in Burn Severity (MTBS) [52] FAB that the Pacific Northwest and portions of the Central
dataset, Global Fire Emissions Database (GFED) California Valley are experiencing intense degrada-
[53–55], Fire Inventory from NCAR (FINN) [56], tion of air quality during August. Trends in the Pacific
and Quick Fire Emissions Dataset (QFED) [57]. Northwest appear especially robust in terms of spatial
When possible, trends were calculated for time series consistency, with many of the strongest trends in each
ending in 2018 (a particularly active fire year) and dataset found within the states of Washington, Ore-
2019 (a rather quiet fire year) as a means of consid- gon, and Idaho. Further, a linear fit to August mean
ering the sensitivity of results to emissions in the ter- daily PM2.5 values (figure 2) indicates that the spa-
minal year. Ecoregions/ecoprovinces demonstrating tial coherence in trends persists beyond the extremes
positive and statistically significant trends (p < 0.1, (98th quantile, figure 1(d)), underscoring the severity
4Environ. Res. Lett. 16 (2021) 054036 T Y Wilmot et al
Figure 1. (a) Results of 98th quantile QR analysis for EPA (circles) and IMPROVE network (squares) PM2.5 trends in the month
of August (years: 2000–2019). Points outlined in black indicate statistical significance at p < 0.05. (b) Results of 98th quantile QR
analysis for CSN (triangles) and IMPROVE network (squares) organic carbon trends in the month of August. CSN trends span at
least 2009–2018 while IMPROVE trends span 2005–2015. Points outlined in black indicate statistical significance at p < 0.05.
(c) Results of 95th quantile QR analysis for city-clustered OMI swath AAOD trends in the month of August spanning the years
2005–2019. Points outlined in black indicate statistical significance at p < 0.05. (d)–(f) Same as (a)–(c) but for September. PM2.5
trends for additional months can be found in figures S4–S10 in SI section S4.
Figure 2. Results of linear trend analysis for EPA network PM2.5 trends in the month of August (2000–2019). Points outlined in
black indicate statistical significance at p < 0.05.
of air quality degradation in average conditions dur- positive and significant trends in PM2.5 strongly sug-
ing August in the Pacific Northwest. gests that the PM2.5 trends may be fire driven. How-
Overlap of positive and statistically significant ever, it should be noted that areas lacking agree-
trends in organic carbon and AAOD datasets with ment across datasets may partially arise from spatial
5Environ. Res. Lett. 16 (2021) 054036 T Y Wilmot et al
Figure 3. Mean PM2.5 enhancements on smoke impacted days at 18 Western US EPA monitor sites (2008–2019). PM2.5
enhancements were calculated as the model residuals on smoke impacted days when using generalized additive modeling (GAM)
of the meteorology-PM2.5 relationship. GAMs were trained on meteorology and PM2.5 for non-smoke impacted days. Points
outlined in black indicate GAM r-squared values in excess of 0.5. Point size reflects the number of smoke impacted days
considered during GAM analysis for a given site.
under-sampling (figure S1) and/or the complexit- spatial overlap of statistically significant trends, relat-
ies associated with smoke transport in complex ter- ive to August, is an artifact of the fire season maximiz-
rain and the wildfire plume rise. Plume rise may ing in August (figure S11). For this reason, should the
decouple surface (PM2.5 and organic carbon) and trends toward enhanced wildfire activity persist into
column (AAOD) trends. Further evidence of a wild- the future, we expect September air quality trends
fire source is drawn from the maxima in trends of to exhibit greater clarity given additional years of
PM2.5 and organic carbon located within or just east data. As an alternative hypothesis, increasing trends
of the fire prone Klamath Mountains/California High (2000–2014, p > 0.1) in average fine mode (PM2.5 )
North Coast Range. As detailed in later sections, dust concentrations during the fall (September, Octo-
the Klamath Mountains/California High North Coast ber, November) suggest the potential role of dust
Range ecoregion is characterized by increasing wild- in September aerosol trends at sites in Northwest-
fire PM2.5 emissions across several wildfire emissions ern Montana and Western Oregon [58]. It should be
inventories. noted that the reduced spatial consistency of PM2.5
The presented decreasing trends in the Southw- trends relative to August results, particularly in and
est demonstrate spatial consistency with identified around the Rocky Mountains, is largely the res-
trends toward reduced summertime organic aerosol ult of variable EPA/IMPROVE monitor site density
concentrations [11]. Malm et al [11] indicate that (figure S1).
significant decreasing summertime organic aerosol
trends would prevail across the Western US were it 3.2. Smoke-driven PM2.5 enhancements in urban
not for outliers sourced from biomass burning. centers
Clear enhancements in PM2.5 levels on smoke
3.1.2. September impacted days in Western US urban centers are iden-
For the month of September the 98th quantile daily tified on the basis of GAM [37]. Mean PM2.5 enhance-
PM2.5 trends (figure 1(d)) exhibit a shift to the north ments (figure 3) are calculated as the mean model
and east relative to patterns in August (figure 1(a)), residual (observed—GAM predicted PM2.5 ) for this
underscoring air quality degradation across portions nonlinear statistical approach (see section 2). As such,
of the Pacific Northwest, Western Montana, and model residuals reflect the GAMs’ underprediction
Wyoming. Attribution of these trends to wildfires via on ‘smoke’ days when only meteorological variables
aerosol observations is hindered by their reduced stat- are used for prediction. Thus, residuals from the stat-
istical significance and limited overlap with positive istical model fitted through GAM (table S1) provide
and significant organic carbon and AAOD trends, a way to quantify the additional PM2.5 enhancement
limited to the Seattle area. We suspect that the reduced from wildfires after controlling for meteorology.
6Environ. Res. Lett. 16 (2021) 054036 T Y Wilmot et al
Figure 4. (a) Map of US EPA level 3 ecoregions and Canadian ecoprovinces that exhibit positive and statistically significant
(p < 0.1) August PM2.5 emissions trends/fire area burned trends across multiple fire emissions inventories or fire area burned
products (GFED, QFED, FINN, MTBS) for timeseries ending in 2018 (a particularly active fire year) and timeseries ending in
2019 (a mild fire year). Shading is based on the area-weighted August PM2.5 emission trend for the years 2000–2018 in the GFED
inventory. For each urban center defined by our city clustering procedure, the nearest EPA monitor site with 15+ years of data is
depicted as a triangle and colored according to the 98th quantile PM2.5 trend for the month of August at that site. Background
shading reflects average nighttime lights as seen by satellite for the year 2010 [59]. (b) Same as (a) but for September.
Ecoregion/ecoprovince abbreviations are as follows: Southern Boreal Cordillera (SBC), Northern Montane Cordillera (NMC),
Central Montane Cordillera (CMC), Eastern Cascades Slopes and Foothills (ECSF), Klamath Mountains and California High
North Coast Range (KMCHNCR), Central California Foothills and Coastal Mountains (CCFCM), Middle Rockies (MR), and
Southern Rockies (SR). The results of trend analyses for individual emissions inventories may be found in figures S12–S15 in SI
section 6. The results of trend analyses for April–July and October–December are presented in figures S16–S28 in SI section 6.
Though applied to data for all months, our GAM regions, support the idea that urban centers in the
results are generally in line with results from trend Pacific Northwest are being subjected to especially
analyses of upper quantile air quality measures for pronounced degradation of air quality as a result of
the months of August and September. Much like wildfire smoke.
the August trends, the largest mean PM2.5 enhance- Despite uncertainty in the exact magnitudes of
ments on smoke-impacted days can be found in GAM produced smoke driven PM2.5 enhancements,
the Pacific Northwest and California’s Central Val- the conservative nature, stemming from the ‘smoke’
ley. Mean smoke-impacted PM2.5 enhancements in day criterion (see section 2), and general sign of this
these regions range from 18 µg m−3 to 33 µg m−3 analysis support the idea that wildfires are contribut-
at the Spokane site. Maximum enhancements sim- ing to human exposure to extreme air quality in urban
ilarly highlight the Pacific Northwest, peaking at centers across West.
199 µg m−3 at Spokane.
While interpretation and comparison between
GAM results are complicated by differing model 3.3. Potential wildfire emissions hotspots
forms (table S1), variable strength of model fits, and Trends in monthly aggregated FAB and wildfire emit-
site-specific air quality issues (SI section S5), indicat- ted PM2.5 (section 2) across multiple fire emissions
ors of model performance highlight general patterns inventories produce a picture of wildfire activity
within the Pacific Northwest as being of greatest con- (figure 4) that reflects the spatiotemporal evolution
fidence. GAMs developed for urban centers in Wash- of trends in extreme air quality (figure 1), supporting
ington and Oregon typically produced smaller mean the notion that wildfires are driving trends in extreme
squared normalized ‘non-smoke’ test residuals, pos- air quality across the Western US. Statistically signific-
sessed larger r-squared values, and were applied to a ant and increasing trends in PM2.5 and wildfire activ-
greater number of smoke impacted days, relative to ity shift from the Pacific Northwest and the Central
GAMs developed for sites in other states. The mean California Valley toward the Rocky Mountains from
and standard deviation of GAM r-squared values for August to September. In August, the Pacific North-
sites in the Pacific Northwest were 0.61 and 0.10, west is uniquely situated between potential wild-
respectively, as compared to 0.54 and 0.10 when con- fire emissions hotspots in British Columbia and the
sidering all 18 sites. These attributes, paired with con- Pacific Northwest/California, while also demonstrat-
sistently larger mean enhancements relative to other ing the most extreme trends in upper quantile air
7Environ. Res. Lett. 16 (2021) 054036 T Y Wilmot et al
quality. Progressing into September, trends in wild- significant trend in one or more inventories through
fire activity relax in British Columbia and Wash- 2019. In light of the record-breaking 2020 fire season
ington, while reflecting potential emissions hotspots to date [22], it is suspected that extension of these
in Northern California/Southern Oregon and the analyses will produce a rebound in trend magnitudes
Rocky Mountains. Similarly, September air quality and statistical significance.
trends show an attenuation relative to August in the
Pacific Northwest while increasing in extent near the 3.3.2. September
Rockies. Reminiscent of the spatiotemporal evolution of
In terms of human exposure to wildfire degraded PM2.5 , trends in FAB and fire-emitted PM2.5 for
air quality, this setup highlights the colocation of the month of September depict the emergence of
August trends and Western US population centers a possible hotspot for wildfire emissions in the
as being of particular concern (figure 4), while also Rocky Mountains while emission trends seem to flat-
pointing to the danger of concurrent trends in West- ten in the Pacific Northwest/California and British
ern US population growth, wildfire emissions, and Columbia (figure 4(b), table S2). September trends in
extreme air quality in September. Potential explan- FAB/wildfire emissions present overall weaker mag-
ations for the spatial differences in the seasonality nitudes with reduced statistical significance relative
of wildfire trends arise from the complex intercon- to August, much like the accompanying air quality
nections between drought and aridity, surface and trends.
canopy fuels, temporal variability of wildfire-climate A Rocky Mountains wildfire emission hotspot
relationships, and variability of historic forest man- in September is supported by statistically significant
agement practices, across local to regional scales [60]. trends in emitted PM2.5 for timeseries ending in 2018
In the context of the wildland–urban interface and 2019 in both the GFED and QFED inventor-
(WUI), where structures intermingle with wildland ies, as well as FAB in the Southern Rockies in the
vegetation and human ignitions of wildfires are com- MTBS dataset. Dampening of potential hotspot activ-
mon [61], the risk posed by this setup is bolstered. ity in the Pacific Northwest/California is captured
Recent decades are characterized by an expansion of by statistically significant trends being limited to
WUI across the Western US, with growth rates by area the Klamath Mountains/California High North Coast
>75% in the Northern Rockies and portions of many Range ecoregion, which garners statistical support
Western states [61]. Further, the Western US counties from the FINN (2018 timeseries only), GFED, and
with the greatest potential for WUI expansion (by QFED inventories. The magnitude of GFED trends
area) are in Southwestern Oregon and Northern Cali- through 2018 are of order 105 –106 kg PM2.5 /year for
fornia, as well as the Northern Rockies, encompassing each of these three ecoregions.
a suspected wildfire emissions hotspot and exist- While Canadian contributions to wildfire-
ing in relatively close proximity to Pacific Northw- emitted PM2.5 trends in the month of September
est urban centers, respectively [62]. The potential for appear uncertain in our analysis, a possible explana-
WUI expansion to exacerbate the trends identified tion for the attenuation of emissions trends in British
here is cause for concern with regards to the trajectory Columbia is provided by the southward progression
of regional air quality in the Western US. of the polar jet/mid-latitude storm tracks during the
transition from summer to fall. All trends pertaining
3.3.1. August to ecoregions/ecoprovinces depicted in figure 4 are
Results of August fire emitted PM2.5 /FAB trend provided in table S2.
analyses are dominated by trends toward elev-
ated wildfire activity in potential hotspots in 4. Conclusions
British Columbia and the mountainous Pacific
Northwest/California (figure 4(a), table S2). For We find that summertime Western US air quality is
time series ending in 2018 (a particularly active fire declining while wildland fire activity is increasing. In
year), the ecoregions/ecoprovinces comprising these August, EPA and IMPROVE monitor sites across the
potential hotspot locations demonstrate statistically Western US indicate positive trends in 98th quantile
significant (p < 0.1) results across four databases PM2.5 , with the Pacific Northwest presenting partic-
(GFED, QFED, FINN, and MTBS). Among these ularly robust trends. Concurrent with August PM2.5
ecoregions/ecoprovinces, the Montane Cordillera trends, wildland fire emissions and FAB are increas-
and Klamath Mountains/California High North ing across portions of British Columbia, Washing-
Coast Range stand out, with each possessing a trend of ton, Oregon, and California, uniquely placing the
approximately 106 kg PM2.5 /year according to GFED Pacific Northwest between two potential emissions
emissions for 2000–2018. All trends through 2019 ‘hotspots’. The notion that these August PM2.5 trends
(a rather quiet fire year) demonstrate reduced mag- are the result of spatially linked wildfire emissions
nitudes and weaker p-values, highlighting the sensit- trends is further supported by analyses of organic car-
ivity of results to the terminal year of the time series. bon, AAOD, and smoke-driven PM2.5 enhancements,
However, each region identified in figure 4(a) has a each of which points to the Pacific Northwest and
8Environ. Res. Lett. 16 (2021) 054036 T Y Wilmot et al
portions of California as being impacted by wildfire computational resources. We would also like to thank
smoke and extreme air quality. the US EPA, IMPROVE network, and NASA God-
In September, the spatial coverage of positive 98th dard Space Flight Center for atmospheric compos-
quantile PM2.5 trends shifts north and east relative to ition data. IMPROVE is a collaborative association
August, demonstrating clear enhancements in West- of state, tribal, and federal agencies, and interna-
ern Montana and Wyoming. At the same time, the tional partners. US Environmental Protection Agency
spatial distribution of wildland fire emissions trends is the primary funding source for IMPROVE, with
is reconfigured such that positive trends are appar- contracting and research support from the National
ent in the Middle and Southern Rockies while trends Park Service. The Air Quality Group at the University
relax in British Columbia and Washington. The cor- of California, Davis is the central analytical laborat-
respondence in spatial shifts between wildfire emis- ory for IMPROVE data, with ion analysis provided
sions hotspots and extreme air quality trends from by Research Triangle Institute, and carbon analysis
August to September provides further support for the provided by Desert Research Institute. We are thank-
hypothesis that wildfires are driving extreme air qual- ful to NASA, the Gordon and Betty Moore Found-
ity trends across the west. While we acknowledge that ation, and The Netherlands Organisation for Sci-
air quality and wildland fire trends for the month of entific Research for funding GFED. Additionally, we
September are less robust than those of August, we are thankful to the National Center for Atmospheric
suspect the trends could emerge with greater clarity Research, NASA Global Modeling and Assimilation
given additional data. Office, and the US Geological Survey Center for Earth
Thus far, the 2020 fire season has provided an Resources Observation and Science and the USDA
exceptionally clear indication of the cost to human Forest Service Geospatial Technology and Applic-
wellbeing should the trends we have identified per- ations Center for FINN, QFED, and MTBS data,
sist over the coming decades. Extrapolation of the respectively. We are grateful to the NASA Socioeco-
PM2.5 trends we have identified 15 years into the nomic Data and Applications Center for gridded pop-
future suggests that many cities in the Western US ulation datasets. We appreciate the financial sup-
may struggle to meet NAAQS within the next few port of the iNterdisciplinary EXchange for Utah Sci-
decades. Spokane, Washington provides a particularly ence, an interdisciplinary research institute at the
striking example of this concern, as PM2.5 trends at University of Utah.
this city indicate a >16 µg m−3 (1.26–32.35 µg m−3 ,
95% confidence interval) increase in the mean and Author contributions
>34 µg m−3 (15.01–53.85 µg m−3 , 95% confidence
interval) increase in the 98th quantile of daily aver- Gannet Hallar and John Lin designed the study.
aged PM2.5 for the month of August by 2035. In Taylor Wilmot carried out the data analyses and gen-
terms of health outcomes, it has been documented erated the figures, with input from Gannet Hallar,
that wildfire derived PM2.5 enhancements in excess of John Lin, and Derek Mallia. Taylor Wilmot wrote the
37 µg m−3 have been associated with a 7.2% increase manuscript, with edits provided by Gannet Hallar,
in the risk of respiratory hospital admission across all John Lin, and Derek Mallia.
ages [2].
While our statistical findings and previous work ORCID iDs
on the air quality—wildfire connection in the West-
ern US [8–10, 17], are highly suggestive, it is apparent T Y Wilmot https://orcid.org/0000-0002-3463-
that a more sophisticated, atmospheric model-based 1420
quantitative attribution of air quality trends to wild- A G Hallar https://orcid.org/0000-0001-9972-
fire sources is needed. A quantitative attribution that 0056
identifies ‘hotspots’ for wildfire emissions with relev- J C Lin https://orcid.org/0000-0003-2794-184X
ance to Western US population centers may provide a D V Mallia https://orcid.org/0000-0003-1983-
means for mitigation via targeted fuel treatments and 7305
related forest management practices.
References
Data availability statement
[1] Black C, Tesfaigzi Y, Bassein J A and Miller L A 2017 Wildfire
All data that support the findings of this study are smoke exposure and human health: significant gaps in
included within the article (and any supplementary research for a growing public health issue Environ. Toxicol.
Pharmacol. 55 186–95
files).
[2] Liu J C et al 2017 Wildfire-specific fine particulate matter
and risk of hospital admissions in urban and rural counties
Acknowledgments Epidemiology 28 77–85
[3] Haikerwal A, Akram M, Sim M R, Meyer M, Abramson M J
and Dennekamp M 2016 Fine particulate matter (PM2.5 )
The authors are grateful to the Center for High Per- exposure during a prolonged wildfire period and emergency
formance Computing at the University of Utah for department visits for asthma Respirology 21 88–94
9Environ. Res. Lett. 16 (2021) 054036 T Y Wilmot et al
[4] Delfino R J et al 2009 The relationship of respiratory and [25] Mok J et al 2016 Impacts of brown carbon from biomass
cardiovascular hospital admissions to the California wildfires burning on surface UV and ozone photochemistry in the
of 2003 Occup. Environ. Med. 66 189–97 Amazon Basin Sci. Rep. 6 36940
[5] Schwartz J, Dockery D W and Neas L M 1996 Is daily [26] NOAA 2020b NCEP-DOE reanalysis 2, NOAA Physical
mortality associated specifically with fine particles? J. Air Sciences Laboratory [data set] (available at: https://
Waste Manage. Assoc. 46 927–39 psl.noaa.gov/thredds/catalog/Datasets/)
[6] Xing Y-F, Xu F-H, Shi M-H and Lian Y-X 2016 The impact [27] Iowa Environmental Mesonet 2020 Rawinsonde (RAOB)
of PM2.5 on the human respiratory system J. Thorac. Dis. data archive, Iowa State University [data files] (available at:
8 E69–E74 https://mesonet.agron.iastate.edu/archive/raob/)
[7] US EPA 2020a Particulate matter (PM2.5 ) trends [data page] [28] Beguería S, Latorre B, Reig F and Vicente-Serrano S M 2020
(available at: www.epa.gov/air-trends/particulate-matter- Global SPEI database [database] (available at: https://
pm25-trends) spei.csic.es/database.html)
[8] McClure C D and Jaffe D A 2018a US particulate matter air [29] Center for International Earth Science Information Network
quality improves except in wildfire-prone areas Proc. Natl (CIESIN), Columbia University 2018 Documentation for the
Acad. Sci. USA 115 7901–6 gridded population of the world, version 4 (GPWv4),
[9] O’Dell K, Ford B, Fischer E V and Pierce J R 2019 revision 11 data sets (Palisades, NY: NASA Socioeconomic
Contribution of wildland-fire smoke to US PM2.5 and its Data and Applications Center (SEDAC) (available at:
influence on recent trends Environ. Sci. Technol. 53 1797–804 10.7927/H45Q4T5F)
[10] Val Martin M, Heald C L, Ford B, Prenni A J and [30] Rozenfeld H D, Rybski D, Andrade J S Jr, Batty M,
Wiedinmyer C 2013 A decadal satellite analysis of the origins Stanley H E and Makse H A 2008 Laws of population growth
and impacts of smoke in Colorado Atmos. Chem. Phys. Proc. Natl Acad. Sci. USA 105 18702–7
13 7429–39 [31] Rozenfeld H D, Rybski D, Gabaix X and Makse H A 2011
[11] Malm W C, Schichtel B A, Hand J L and Collett J L Jr 2017 The area and population of cities: new insights
Concurrent temporal and spatial trends in sulfate and from a different perspective on cities Am. Econ. Rev.
organic mass concentrations measured in the IMPROVE 101 2205–25
monitoring program J. Geophys. Res. Atmos. 122 10462–76 [32] Kriewald S, Fluschnik T, Reusser D and Rybski D 2019 Osc:
[12] Seager R et al 2007 Model projections of an imminent orthodromic spatial clustering. R package version 1.0.5
transition to a more arid climate in Southwestern North (available at: https://CRAN.R-project.org/package=osc)
America Science 316 1181–4 [33] US EPA 2020b Air data: air quality data collected at
[13] Mote P W, Li S, Lettenmair D P, Xiao M and Engel R 2018 outdoor monitors across the us [data files] (available at:
Dramatic declines in snowpack in the western US Nat. www.epa.gov/outdoor-air-quality-data)
Partner J. Clim. Atmos. Sci. 1 2 [34] Federal Land Manager Environmental Database 2020
[14] Dennison P E, Brewer S C, Arnold J D and Moritz M A 2014 IMPROVE aerosol [data set] (available at: http://
Large wildfire trends in the western United States, views.cira.colostate.edu/fed/QueryWizard/)
1984–2011 Geophys. Res. Lett. 41 2928–33 [35] Chow J C, Watson J G, Pritchett L C, Pierson W R,
[15] Westerling A L, Hidalgo H G, Cayan D R and Swetnam T W Frazier C A and Purcell R G 1993 The dri thermal/optical
2006 Warming and earlier spring increase western U.S. forest reflectance carbon analysis system: description, evaluation
wildfire activity Science 313 940–3 and applications in U.S. air quality studies Atmos. Environ. A
[16] Westerling A L 2016 Increasing western US forest wildfire 27 1185–201
activity: sensitivity to changes in the timing of spring Phil. [36] Malm W C, Sisler J F, Huffman D, Eldred R A and Cahill T A
Trans. R. Soc. B 371 20150178 1994 Spatial and seasonal trends in particle concentration
[17] Hallar A G, Molotch N P, Hand J L, Livneh B, McCubbin I B, and optical extinction in the United States J. Geophys. Res.
Peterson R, Michalsky J, Lowenthal D and Kunkel K E 2017 Atmos. 99 1347–70
Impacts of increasing aridity and wildfires on aerosol loading [37] Hand J L, Prenni A J, Schichtel B A, Malm W C and Chow J C
in the intermountain Western US Environ. Res. Lett. 12 14006 2019 Trends in remote PM2.5 residual mass across the
[18] Spracklen D V, Mickley L J, Logan J A, Hudman R C, United States: implications for aerosol mass
Yevich R, Flannigan M D and Westerling A L 2009 Impacts reconstruction in the IMPROVE network Atmos. Environ.
of climate change from 2000–2050 on wildfire activity and 203 141–52
carbonaceous aerosol concentrations in the western United [38] US EPA 2020c Chemical speciation network (CSN) [data
States J. Geophys. Res. 114 D20301 page] (available at: www.epa.gov/amtic/chemical-speciation-
[19] Liu J C, Mickley L J, Sulprizio M P, Dominici F, Yue X, network-csn)
Ebisu K, Anderson G B, Kahn R F A, Bravo M A and [39] Torres O 2018 OMI/Aura near UV aerosol index, optical
Bell M L 2016 Particulate air pollution from wildfires depth and single scattering albedo 1-orbit L2 13×24 km
in the Western US under climate change Clim. Change [dataset] NASA Goddard Space Flight Center, Goddard
138 655–66 Earth Sciences Data and Information Services Center
[20] Ford B, Val Martin M, Zelasky S E, Fischer E V, (GES DISC)
Anenberg S C, Heald C L and Pierce J R 2018 Future fire [40] Koenker R and Bassett G Jr 1978 Regression quantiles
impacts on smoke concentrations, visibility, and health in Econometrica 46 33–50
the contiguous United States GeoHealth 2 229–47 [41] Koenker R 2005 Quantile Regression (Cambridge: Cambridge
[21] Mell W E, Manzello S L, Maranghides A, Butry D and University Press)
Rehm R G 2010 The wildland–urban interface fire [42] Koenker R 2020 Quantreg: quantile regression. R package
problem—current approaches and research needs Int. J. version 5.75 (available at: https://CRAN.R-project.org/
Wildland Fire 19 238–51 package=quantreg)
[22] Higuera P E and Abatzoglou J T 2020 Record-setting climate [43] Long J A 2020 Jtools: analysis and presentation of social
enabled the extraordinary 2020 fire season in the western scientific data. R package version 2.1.0 (available at: https://
United States Glob. Change Biol. 27 1–2 CRAN.R-project.org/package=jtools)
[23] U.S. Census Bureau 2012 United States Summary: 2010 [data [44] Wood S N 2017 Generalized Additive Models: An Introduction
summary] (available at: www.census.gov/prod/cen2010/cph- with R (Boca Raton, FL: CRC Press)
2-1.pdf) [45] McClure C D and Jaffe D A 2018b Investigation of high
[24] Spracklen D V, Logan J A, Mickley L J, Park R J, Yevich R, ozone events due to wildfire smoke in an urban area Atmos.
Westerling A L and Jaffe D A 2007 Wildfires drive Environ. 194 146–57
interannual variability of organic carbon aerosol in the [46] Gong X, Kaulfus A, Nair U and Jaffe D A 2017 Quantifying
western U.S. in summer Geophys. Res. Lett. 34 L16816 O3 impacts in urban areas due to wildfires using a
10Environ. Res. Lett. 16 (2021) 054036 T Y Wilmot et al
generalized additive model Environ. Sci. Technol. burning emissions from small fires J. Geophys. Res.
51 13216–23 117 G04012
[47] NOAA 2020c Hazard mapping system fire and smoke [56] Wiedinmyer C, Akagi S K, Yokelson R J, Emmons L K,
product, NOAA office of satellite and product operations Al-Saadi J A, Orlando J J and Soja A J 2011 The Fire
[dataset] (available at: www.ospo.noaa.gov/Products/land/ INventory from NCAR (FINN): a high resolution global
hms.html) model to estimate the emissions from open burning Geosci.
[48] Kaulfus A S, Nair U, Jaffe D A, Christopher S A and Model Dev. 4 625–41
Goodrick S 2017 Biomass burning smoke climatology of the [57] Darmenov A and da Silva A M 2013 The quick fire emissions
United States: implications for particulate matter air quality dataset (QFED) documentation of versions 2.1, 2.2 and 2.4,
Environ. Sci. Technol. 51 11731–41 ed R D Koster NASA TM-2013-104606 vol 32 p 183
[49] Rolph G D et al 2009 Description and verification of the [58] Hand J L, Gill T E and Schichtel B A 2017 Spatial and
NOAA smoke forecasting system: the 2007 fire season seasonal variability in fine mineral dust and coarse aerosol
Weather Forecast. 24 361–78 mass at remote sites across the United States J. Geophys. Res.
[50] US EPA 2020d Level III and IV ecoregions of the continental Atmos. 122 3080–97
united states [dataset] (available at: www.epa.gov/eco- [59] NOAA 2020a Nighttime Lights Time Series Version 4,
research/level-iii-and-iv-ecoregions-continental-united- Defense Meteorological Program Operational Linescan
states) System, Earth Observation Group, Payne Institute for Public
[51] Government of Canada 2020 Terrestrial ecoprovinces of Policy, Colorado School of Mines [data set] (available at:
Canada [dataset] (available at: https://open.canada.ca/data/ https://developers.google.com/earth-engine/datasets/
en/dataset/98fa7335-fbfe-4289-9a0e-d6bf3874b424) catalog/NOAA_DMSP-OLS_NIGHTTIME_LIGHTS#
[52] Eidenshink J, Schwind B, Brewer K, Zhu Z-L, Quayle B and description)
Howard S 2007 A project for monitoring trends in burn [60] Littell J S, Peterson D L, Riley K L, Liu Y and Luce C H 2016
severity Fire Ecol. Spec. Issue 3 3–21 A review of the relationships between drought and
[53] van der Werf G R et al 2017 Global fire emissions estimates forest fire in the United States Glob. Change Biol.
during 1997–2016 Earth Syst. Sci. Data 9 697–720 22 2353–69
[54] Giglio L, Randerson J T and van der Werf G R 2013 Analysis [61] Radeloff V C et al 2018 Rapid growth of the US
of daily, monthly, and annual burned area using the wildland–urban interface raises wildfire risk Proc. Natl Acad.
fourth-generation global fire emissions database (GFED4) Sci. USA 115 3314–9
J. Geophys. Res. 118 317–28 [62] Gude P, Rasker R and van den Noort J 2008 Potential
[55] Randerson J T, Chen Y, van der Werf G R, Rogers B M for future development on fire-prone lands J. For.
and Morton D C 2012 Global burned area and biomass 106 198–205
11You can also read