Measurement report: An assessment of the impact of a nationwide lockdown on air pollution - a remote sensing perspective over India
←
→
Page content transcription
If your browser does not render page correctly, please read the page content below
Atmos. Chem. Phys., 21, 9047–9064, 2021
https://doi.org/10.5194/acp-21-9047-2021
© Author(s) 2021. This work is distributed under
the Creative Commons Attribution 4.0 License.

Measurement report: An assessment of the impact of a nationwide
lockdown on air pollution – a remote sensing perspective over India
Mahesh Pathakoti1 , Aarathi Muppalla2 , Sayan Hazra3 , Mahalakshmi D. Venkata1 , Kanchana A. Lakshmi1 ,
Vijay K. Sagar1 , Raja Shekhar2 , Srinivasulu Jella1 , Sesha Sai M. V. Rama1 , and Uma Vijayasundaram3
1 Earthand Climate Sciences Area (ECSA), National Remote Sensing Centre (NRSC), Indian Space Research Organization
(ISRO), Hyderabad-500037, India
2 Bhuvan Geoportal and Data Dissemination Area, NRSC, ISRO, Hyderabad-500037, India
3 Department of Computer Science, School of Engineering & Technology, Pondicherry University, Chinna Kalapet, Kalapet,

Puducherry-605014, India

Correspondence: Mahesh Pathakoti (mahi952@gmail.com) and Mahalakshmi D. Venkata (mahameteorology@gmail.com)

Received: 28 November 2020 – Discussion started: 11 February 2021
Revised: 26 April 2021 – Accepted: 16 May 2021 – Published: 15 June 2021

Abstract. The nationwide lockdown was imposed over In-           ing total LD. The TCC levels were high in the northeast
dia from 25 March to 31 May 2020 with varied relax-              (NE) region during the phase I LD period, which is mainly
ations from phase I to phase IV to contain the spread of         attributed to the active fire counts in this region. However,
COVID-19. Thus, emissions from industrial and transport          lower TCC levels are observed in the same region due to the
sectors were halted during lockdown (LD), which has re-          diminished fire counts during phase II. Further, AOD550 is
sulted in a significant reduction of anthropogenic pollutants.   reduced over the country by ∼ 16 % (Aqua and Terra) from
The first two lockdown phases were strictly implemented          the 6-year (2014–2019) mean AOD550 levels, with a signifi-
(phase I and phase II) and hence were considered to be total     cant reduction (Aqua MODIS 28 %) observed over the Indo-
lockdown (TLD) in this study. Satellite-based tropospheric       Gangetic Plain (IGP) region with a p value of  0.05. How-
columnar nitrogen dioxide (TCN) from the years 2015 to           ever, an increase in AOD550 levels (25 % for Terra MODIS,
2020, tropospheric columnar carbon monoxide (TCC) dur-           15 % for Aqua MODIS) was also observed over central India
ing 2019/20, and aerosol optical depth (AOD550 ) from the        during LD compared to the preceding year and found signif-
years 2014 to 2020 during phase I and phase II LD and pre-       icant with a p value of 0.03. This study also reports the rate
LD periods were investigated with observations from Aura         of change of TCN levels and AOD550 along with statistical
OMI, Sentinel-5P TROPOMI, and Aqua and Terra MODIS.              metrics during the LD period.
To quantify lockdown-induced changes in TCN, TCC, and
AOD550 , detailed statistical analysis was performed on de-
trended data using the Student paired statistical t test. Re-
sults indicate that mean TCN levels over India showed a dip      1   Introduction
of 18 % compared to the previous year and also against the
5-year mean TCN levels during the phase I lockdown, which        Following the outbreak of the novel coronavirus disease
was found to be statistically significant (p value < 0.05)       (COVID-19) and its declaration as a pandemic by the World
against the respective period. Furthermore, drastic changes      Health Organization (WHO) on 11 March 2020, several
in TCN levels were observed over hotspots, namely eastern        countries across the globe imposed national lockdowns to
region and urban cities. For example, there was a sharp de-      contain this global pandemic (e.g. Tian et al., 2020). In-
crease of 62 % and 54 % in TCN levels compared to 2019           dia confirmed its first COVID-19 case on 30 January 2020
and against 5-year mean TCN levels over New Delhi with           with an exponential increase to 360 cases by 22 March 2020
a p value of 0.0002 (which is statistically significant) dur-    (https://www.mohfw.gov.in/, last access: 1 August 2020). In
                                                                 an attempt to restrict this pandemic, the Indian government

Published by Copernicus Publications on behalf of the European Geosciences Union.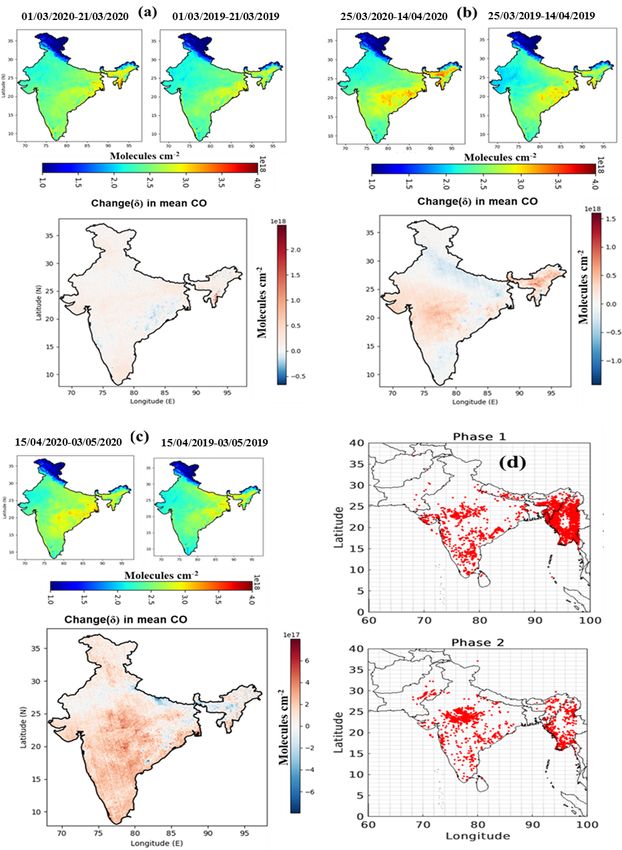
9048                                                    M. Pathakoti et al.: The impact of India’s lockdown on air pollution

called for a “Janata Curfew” on 22 March 2020, followed by         mode aerosol (PM2.5 ) is mainly from gas-to-particle conver-
the nationwide lockdown (LD) in a phased manner starting           sions, which are from biogenic and anthropogenic emissions.
from 25 March–14 April 2020 (21 d) as phase I, 15 April–           Coarse-mode aerosol (particles with a diameter larger than
3 May 2020 (19 d) as phase II, 4 May–17 May 2020 (14 d)            10 µm) arises from natural sources such as deserts, oceans,
as phase III, and 18 May–31 May in 2020 (14 d) as phase            volcanoes, and the biosphere, with less contribution from
IV. During this lockdown period, about 1.3 billion citizens        anthropogenic activities. Over the ocean surface, the natu-
of India were advised to stay indoors, all transport including     ral global aerosol mass is controlled by sulfate, sea salt, and
domestic and international flights and roadways were sus-          dust aerosol (David et al., 2018). Further, aerosol also affects
pended, and almost all the industries were closed with the         the earth–atmosphere radiation budget directly in scattering
exception of essential services, namely medical and daily          and absorption of incoming solar radiation and indirectly as
needs. However, agriculture farming and its related sectors        cloud formation and precipitation (Ramachandran and Ke-
were permitted during phase II as India is an agrarian coun-       dia, 2013), thereby influencing the Indian monsoon (David
try. However, indoor emissions due to cooking and emissions        et al., 2018).
from the emergency services were still present in phase I.            Earlier studies indicate that the emissions from vehicles
During phase II, crop residue burnings were added in addi-         (Mahalakshmi et al., 2014, 2015), industry, and thermal
tion to phase I emissions. Except for these, the rest of the an-   power plants (Ramachandran et al., 2013) contribute signif-
thropogenic emissions from the above sectors are completely        icantly to atmospheric pollution, including gaseous pollu-
shut during phase I and phase II. Thus, economic activities        tants. The ambient air quality is largely determined by the
were greatly affected and hence there was a shortfall in net       concentration of trace gases and particulate matter in the at-
energy consumption by about 30 % (https://www.ppac.gov.            mosphere (Nishanth et al., 2014). An increase in the con-
in/, last access: 4 August 2020) during the strict lockdown        centration levels of trace gases and particulate matter is re-
period (first two lockdown phases).                                ally a challenging environmental issue in urban and indus-
   Elevated levels of air pollution are considered an envi-        trial areas. Numerous studies have been carried out across
ronmental issue that is harmful to human health (Xu et al.,        the globe to understand the air pollution concentrations dur-
2020) and extends from local to global scales (Fang et al.,        ing the lockdown period, and the results indicate the varied
2009). The oxides of nitrogen (NO, NO2 ) play an important         range of percentage reductions in pollutant concentrations.
role in tropospheric chemistry and climate change. Increased       These studies are either based on ground-based measure-
exposure to air pollutants, especially to nitrogen dioxide         ments (Mohato et al., 2020; Mor et al., 2020) or satellite data
(NO2 ), has been correlated with an increased rate of mor-         alone (Biswal et al., 2020; Xu et al., 2020) or with a combina-
bidity and subsequently increased rate of mortality (WHO,          tion of both (Ratnam et al., 2021; Biswal et al., 2021; Singh
2013). Global emissions of NOx (NO, NO2 ) are primarily            and Chauhan, 2020). Biswal et al. (2021) reported lockdown-
due to anthropogenic activities such as transportation (32 %       induced changes in tropospheric NO2 variability even in ru-
in India), industrial activities (21 % in India), thermal power    ral regions of the Indian sub-continent with a marked reduc-
plants (28 % in India), and biomass burning (19 % in India),       tion of 30 %–50 % over the urban areas and megacities. This
whereas the natural sources of NOx are soils and lightning         change was mainly attributed to the reduced traffic emissions
(Biswal et al., 2021). Thus, hotspot regions of NO2 are ther-      due to restricted movements of limited transport. In contrast
mal power plants, urban cities, and industrial regions. In ad-     to the above, an increase in levels of air pollutants during
dition to NO2 , carbon monoxide (CO) is also an important          lockdown is also noticed in certain regions, which are asso-
trace gas in the troposphere and is the main precursor of sec-     ciated with natural emissions (dust storms, forest fires) and
ondary pollutant ozone in NOx -rich environments. Though           prevailing meteorological conditions. A decrease in aerosol
CO is not a direct greenhouse gas, it has a global warm-           optical depth (AOD550 ) over the Indo-Gangetic Plains (IGP)
ing potential because of its effects on the lifetime of several    and a drastic increase over central India were reported during
greenhouse gases. The natural and anthropogenic sources of         the phase I lockdown in India, which were mainly due to the
CO are forest fire, biofuel burning, volcanic activities, and      absence of anthropogenic activities and dominance of natu-
incomplete combustion of fossil fuels, oil, coal, wood, nat-       ral sources, respectively (Ratnam et al., 2021). However, the
ural gas, and oxidation of hydrocarbons. However, a signif-        preceding studies have not carried out any detailed statisti-
icant amount of contribution to CO is from anthropogenic           cal analysis to indicate the significant changes are due to the
emissions. Harmful effects of CO are dizziness, headaches,         imposed lockdown besides the long-term variability.
stomach aches, confusion, and tiredness. CO is a tracer of air        Therefore, the present study has attempted to understand
pollution due to its lifetime of about ∼ 1–2 months (Drum-         and quantify the spatio-temporal variations in air pollutants
mond and Mand, 1996).                                              over the Indian region during COVID-19 lockdown (LD)
   Natural sources and anthropogenic activities are respon-        restrictions in the country. Thus, the present study exam-
sible for the presence of aerosol in the atmosphere. An-           ined the spatio-temporal variations in remotely sensed tro-
thropogenic activities over South Asia have caused consid-         pospheric columnar NO2 (TCN), tropospheric columnar CO
erable changes in aerosol composition and loading. Fine-           (TCC), and aerosol optical depth (AOD550 ) during LD and

Atmos. Chem. Phys., 21, 9047–9064, 2021                                              https://doi.org/10.5194/acp-21-9047-2021
M. Pathakoti et al.: The impact of India’s lockdown on air pollution                                                                              9049

Table 1. Data resources.

    Parameter               Data source                            Resolution                             Website
    TCN                     Aura OMI                               0.25◦ × 0.25◦ (version: V003)          https://earthdata.nasa.gov/ (last access: 5
                            Sentinel-5P TROPOMI                    3.5 km × 7 km (year, 2019;             January 2021)
                                                                   version: 01.02.02 and 01.03.00)
                                                                   and 3.5 km × 5.5 km (year, 2020;
                                                                   version: 01.03.02)
    TCC                     Sentinel-5P TROPOMI                    7 km × 7 km (year, 2019;               https://earthdata.nasa.gov/ (last access: 5
                                                                   version: 01.02.02 and 01.03.00)        February 2021)
                                                                   and 5.5 km × 7 km (year, 2020;
                                                                   version: 01.03.02)
    AOD                     MOD08_D3 from Terra and                1◦ × 1◦ (version: v6.1)                https://ladsweb.modaps.eosdis.nasa.gov/
                            MYD08_D3 from Aqua                                                            (last access: 7 February 2021)
    Fire count              VIIRS                                  375 m                                  https://firms.modaps.eosdis.nasa.gov/
                                                                                                          download/create.php (last access:       21
                                                                                                          January 2020)
    Winds and               ECMWF-ERA5 reanalysis                  0.25◦ × 0.25◦                          https://cds.climate.copernicus.eu/cdsapp#!/
    relative humidity                                                                                     dataset/reanalysis-era5-pressure-
                                                                                                          levels?tab=form (last access: 12 December
                                                                                                          2020)

Reference period: January–July (2014–2020); strict lockdown period: 25 March–3 May 2020.

pre-LD and compared with the preceding year (2019) and                                let and the shortwave infrared. TROPOMI is a push-broom
short-term mean (2014–2020). The present study reported                               imaging spectrometer flying in a sun-synchronous orbit at
lockdown-induced changes on TCN, TCC, and AOD550 over                                 824 km altitude and is designed to retrieve the concentra-
the Indian region with special emphasis on the hotspot (usual                         tion of several atmospheric constituents which include TCN,
predominant sources) and urban regions. Further, statistical                          TCC, SO2 , etc. TROPOMI retrieved TCN and TCC values
analyses were carried out to assess the implications of strict                        with a quality flag greater than 0.50 are considered in the
lockdown in India on the levels of these air pollutants be-                           present study (Eskes et al., 2019). It was developed jointly
sides their inter-annual variability. Subsequent changes in air                       by ESA and the Royal Netherlands Meteorological Institute
quality associated with meteorology, long-range transport,                            (KNMI), which is the most advanced multispectral imaging
and forest fires have been taken into account through statis-                         spectrometer (Alonso et al., 2020). OMI was successfully
tical correlations to distinguish between natural and anthro-                         launched on the National Aeronautics and Space Adminis-
pogenic emissions.                                                                    tration (NASA) Earth Observing System Aura satellite and
                                                                                      is a push broom ultraviolet–visible spectrometer that mea-
                                                                                      sures the Earth’s backscattered radiance and solar irradiance.
2    Data                                                                             Aura OMI has a swath width of 2600 km with a nadir field of
                                                                                      view, at a spatial resolution of 0.25◦ × 0.25◦ giving a daily
Satellite-measured air pollutant data offer reliable, uninter-                        global 30 % cloud-screened TCN level 3 product (present
rupted observations with higher spatial and temporal cover-                           study used Version 3) and crossing the Equator at 13:45 LT
age than ground-based measurements, which are point ob-                               (Krotkov et al., 2017). The MODIS sensor on board NASA’s
servations. Thus, the TCN observations from the Sentinel-                             two Earth Observing System Terra and Aqua platforms pro-
5P Tropospheric Monitoring Instrument (S5P-TROPOMI)                                   vide AOD retrievals.
and Aura Ozone Monitoring Instrument (Aura OMI), TCC                                     Daily level 3 (version: V003) TCN data were ob-
data from high-spatial-resolution TROPOMI, and AOD550                                 tained from Aura OMI for computing the short-term
data from Moderate Resolution Imaging Spectroradiome-                                 mean of TCN from 2015–2019 (https://disc.gsfc.nasa.
ter (MODIS) Terra–Aqua platforms are used in the present                              gov/datasets/OMNO2d_003/summary, last access: 29 De-
study. The brief details of these sensors are given in Ta-                            cember 2020). However, high-spatial-resolution TCN and
ble 1. TROPOMI was launched on 13 October 2017 as                                     TCC data (Level 2) from TROPOMI are used dur-
the single payload on board the S5P satellite of the Euro-                            ing the LD period of 2020 and the corresponding pe-
pean Space Agency (ESA) and has a nadir-viewing spec-                                 riod in 2019 (https://doi.org/10.5270/S5P-s4ljg54). The
tral range covering wavelength bands between the ultravio-

https://doi.org/10.5194/acp-21-9047-2021                                                              Atmos. Chem. Phys., 21, 9047–9064, 2021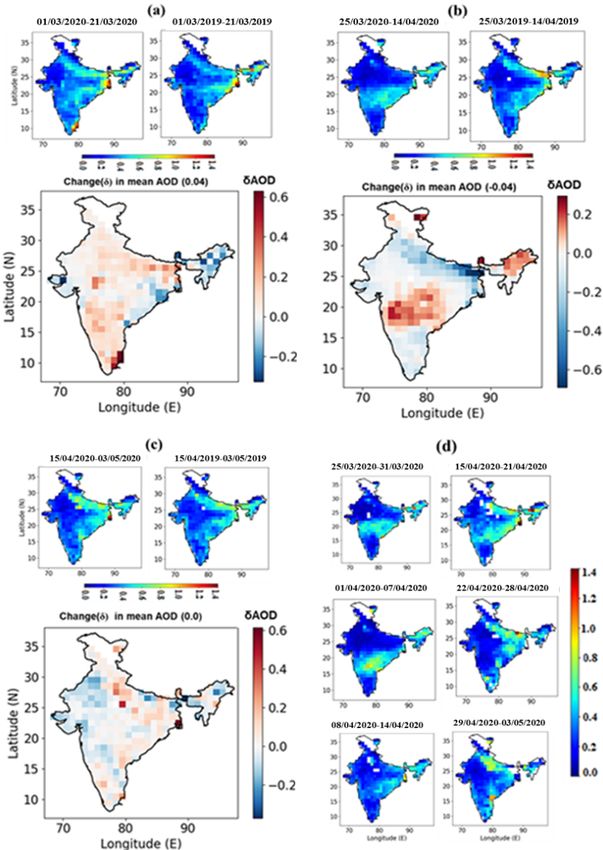
9050 M. Pathakoti et al.: The impact of India’s lockdown on air pollution
daily gridded global AOD products (Level 3) from Terra spective source files considering quality flags (https://github.
(MOD08_D3_v6.1) aerosol optical depth at 550 nm (Deep com/aarathimuppalla/airpollution_ld_study.git, last access:
Blue algorithm, land-only) and Aqua (MYD08_D3_v6.1) 10 May 2021). Swath and mask are calculated for the re-
aerosol optical depth at 550 nm (Deep Blue algo- gion of interest, and the data are resampled using the nearest-
rithm, land-only) platforms were used to investigate the neighbour algorithm. Further, time-averaged maps of TCN,
aerosol loading over the Indian region for the above- TCC, and AOD550 for pre-lockdown, phase I, and phase II
mentioned period. Detailed information about the OMI lockdown were generated for the years 2020 and 2019 along
sensor and MODIS sensor on board Aqua–Terra plat- with maps depicting the differences. With respect to 2020, if
forms is explained by Li et al. (2020). Overland, the the difference in pollutant concentrations (δx) is greater than
previous studies reported that MODIS-derived AOD un- zero, an increased effect is indicated and vice versa. Short-
certainty with respect to the AErosol RObotic NETwork term climatological means of TCN for the years 2015–2020
(AERONET) is ± 0.05 ± 0.20 × AODAERONET (Sayer et al., and AOD for the years 2014–2020 were computed. There-
2013; Levy et al. 2013). Details of the MODIS AOD retrieval after, the regional increase and decrease in pollutant concen-
algorithm for collection 6.1 and its validation can be found trations over the country and individual states were analysed.
in Hsu et al., (2019) and Sayer et al., (2019), respectively. In
addition to the above datasets, fire count data from the Vis- Statistical metrics
ible Infrared Imaging Radiometer Suite (VIIRS) with confi-
dence > 80 % were used. To understand the role of meteo- Further, detailed statistical metrics for TCN, TCC, and
rology, winds from the European Centre for Medium-Range AOD550 , namely mean, standard deviation (SD), percentage
Weather Forecasts (ECMWF- ERA5) reanalysis, which gives of the number of positive and negative pixels, and Student’s
hourly data at different pressure levels (700 and 850 hPa), paired t test values, were computed. TCN data obtained from
were also used in the present study. Similarly, relative humid- OMI and AOD550 from MODIS were utilised to estimate
ity from ECMWF for the respective pressure levels is also metrics from the long-term data against the lockdown period
used. in 2020. These metrics are calculated for every week starting
from 1 January to 31 July as 31 weeks in total for the years
2015–2020 for TCN and 2014–2020 for AOD550 over the In-
3 Methods dian region. Thus, the following steps were implemented to
quantify the metrics. These steps are written for TCN as an
In the present study, we attempted to assess the impact of example.
lockdown on air quality over India by examining remotely
sensed daily concentrations of TCN, TCC, and AOD550 from b2020–2019 (TCN) = TCN(2020) − TCN(2019) (1)
January 2014 to October 2020. Further, daily concentrations
b2020–2015 to 2019 (TCN) = TCN(2020) − TCN(2015–2019)
of the abovementioned parameters were de-trended during
(2)
the study period to subside the long-term changes. Hence, v
phase-wise changes in TCN, TCC levels, and AOD550 could uN
uX (bi − µb )2
be attributed to LD-induced changes. Thus, the present study 1 SD = t (3)
N
focused on the air pollution over the Indian region, its states, i=1
and its capital city during the strict lockdown periods (phase
bi > 1 SD, positive pixels (Pp )
I and phase II). Analysis of satellite-based observations of
If bi < −1 SD, negative pixels (Np ) (4)
TCN from the years 2015 to 2020, TCC during 2019/20,
−1 SD ≤ bi ≤ 1 SD, neglect pixels
and AOD550 from 2014–2020 was carried out for the lock-
down period (phase I and phase II) as well as the pre-
lockdown period. Short-term climatological means during Here N is the total number of qualified pixels over the
pre-LD, phase I, and phase II were computed for TCN from Indian region and µb is mean bias. At each pixel, weekly
2015 to 2020 and AOD550 from 2014 to 2020 to assess the bias (b) of TCN is estimated from the weekly mean TCN
temporal changes of pollutants in the atmosphere. We have during the 2020 lockdown period vs. 2019 and 2015–2019
focused our analysis on the first two phases of lockdown in periods as shown in Eqs. (1) and (2). For prominent change
which the industrial and transport sectors were brought to a detection, a 1 SD deviation filter was additionally applied to
near standstill. the bias values of TCN and AOD550 . Therefore, if bias is
Figure 1 shows the data processing and execution strat- greater than 1 SD, then the featured pixels are classified as
egy followed in this study. The detailed methodology used positive, and if less than −1 SD then they are considered
in this study is as follows. The Python programming lan- negative pixels. Pixels within ± 1 SD are omitted to avoid
guage is used to analyse TCN, TCC, and AOD550 variables minimalistic feature changes and for better characterisation.
during the study period as discussed in Fig. 1. The param- Subsequently, we computed the percentage of positive (in-
eters TCN, TCC, and AOD550 are extracted from the re- creased area) and negative pixels (decreased area) using the
Atmos. Chem. Phys., 21, 9047–9064, 2021 https://doi.org/10.5194/acp-21-9047-2021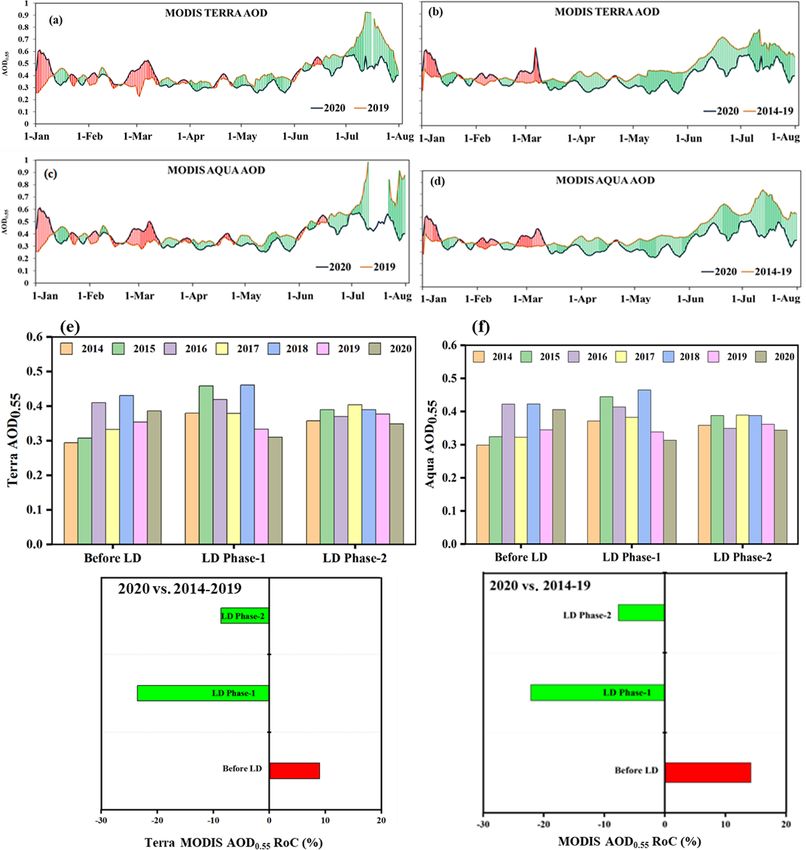
M. Pathakoti et al.: The impact of India’s lockdown on air pollution                                                        9051

Figure 1. Data processing steps and methodology.

following Eqs. (5) and (6).                                        during LD and pre-LD periods to understand the lockdown
                                                                   effects on their changes over the Indian region.
       count(Pp )
% Pp =            · 100                                     (5)
          N                                                        4.1   Effect of lockdown (LD) on TCN
       count(Np )
% Np =             · 100                                    (6)
           N                                                       The spatio-temporal variability in TCN concentrations dur-
   The same equations were applied to AOD550 during the            ing the pre-lockdown and lockdown period (phase I and
2014–2020 study periods. Further, to understand LD-induced         phase II) was analysed for the years 2019 and 2020 using
changes in TCN and AOD550 quantitatively, daily mean val-          high-spatial-resolution (Table 1) TROPOMI. Temporally av-
ues are de-trended using yearly data, which accounts for           eraged concentrations of TCN during pre-LD (1 March to
long-term changes in TCN and AOD550 . De-trended val-              21 March 2020), phase I and phase II of lockdown, and
ues of TCN and AOD550 are generated by subtracting the             the corresponding period of the previous year (2019) are
linear-regression-estimated values from the daily values of        shown in Fig. 2a–c, along with the differences in concen-
TCN and AOD550 . To study the lockdown-induced changes             tration levels between different periods. During the pre-LD
with significant levels, a paired t test (Freedman et al., 2007)   time of years 2019 and 2020 as shown in Fig. 2a, the extent
was implemented on the de-trended TCN and AOD550 data              of TCN hotspot regions (majorly eastern India and National
during the respective study period. The t test follows a Stu-      Capital Region) remains the same; however, a mild reduc-
dent t distribution under the null hypothesis of H0 with the       tion of TCN was noticed during pre-LD of 2020 compared to
means (µ) of two populations being equal (µ1 = µ2 ) with an        2019. This could probably be due to inter-annual variability
alternative hypothesis Ha : µ1 6 = µ2 . To reject or accept the    in TCN levels and also the absence of source emissions due
null hypothesis, the p value was used in this study. The hy-       to lockdown imposed by neighbouring countries via long-
pothesis H0 is rejected when a p value is less than 0.05 and       range transport (for example lockdown imposed in China
accepted if the p value is greater than 0.05 (5 % significance     from 23 January 2020, Italy from 21 February 2020, and
level).                                                            Malaysia from 18 March 2020). During this period, similar
                                                                   reduction of TCN over the National Capital Region (NCR)
                                                                   (Biswal et al., 2021) and other cities across the globe was re-
4   Results and discussion                                         ported (Tian et al., 2020; Xu et al., 2020; Berman and Ebisu,
                                                                   2020; Collivignarelli et al., 2020; Jephcote et al., 2021).
In the present study we have analysed the spatio-temporal             The mean TCN over the entire country during phase I of
variations in satellite-based data for TCN, TCC, and AOD550        2020 and 2019 is 1.53 × 10¹⁵ and 1.86 × 10¹⁵ molec. cm−2 ,

https://doi.org/10.5194/acp-21-9047-2021                                            Atmos. Chem. Phys., 21, 9047–9064, 2021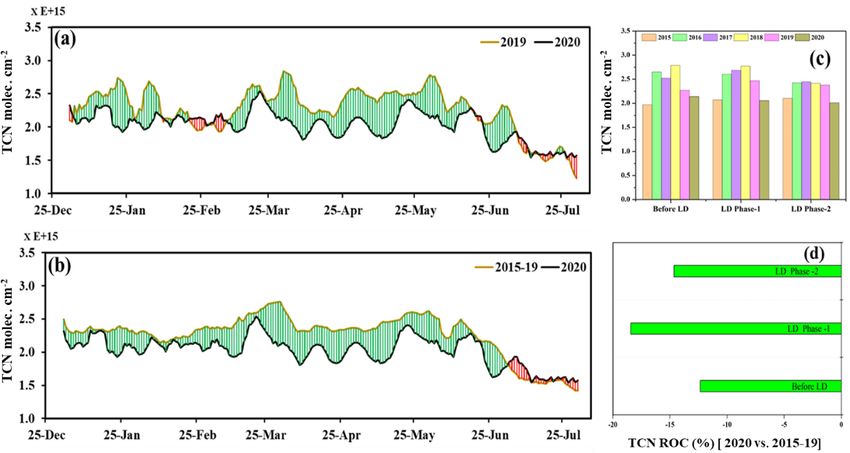
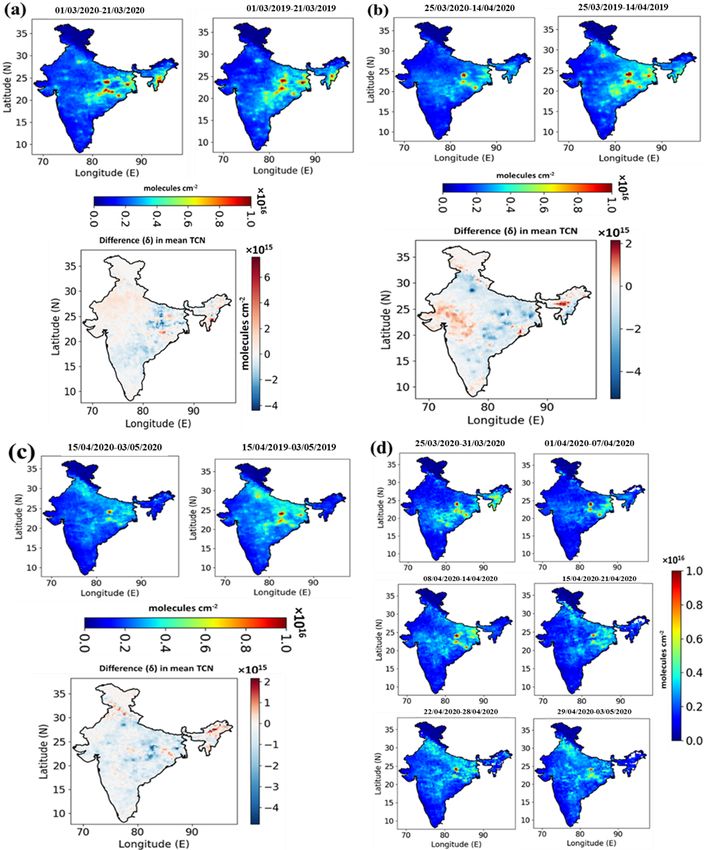
9052                                                 M. Pathakoti et al.: The impact of India’s lockdown on air pollution

Figure 2. Time-averaged TROPOMI TCN concentration and its difference maps between 2020 and 2019 during (a) pre-LD, (b) phase I
lockdown, and (c) phase II lockdown. (d) Weekly mean TCN variation starting from 25 March to 3 May 2020.

respectively. A reduction of about 22 % TCN levels is ob-        COVID-19, about 95 % of the anthropogenic activities were
served in 2020 compared to 2019 during phase I, which            halted (Ratnam et al., 2021) during phase I LD. However,
accounts for both inter-annual variability and lockdown ef-      during phase I, a few anthropogenic emissions are present
fects. Further, to understand the lockdown-induced changes       under essential services (such as pharma industries, power
in TCN levels, this study was focused on TCN hotspots,           plants, medical services, and transportation for carrying daily
which include power plants and metropolitan cities with in-      commodities) and indoor emissions. As a result, the TCN
dustrial and transport activities. To contain the spread of      levels and their area of extent as shown in Fig. 2b during

Atmos. Chem. Phys., 21, 9047–9064, 2021                                           https://doi.org/10.5194/acp-21-9047-2021
M. Pathakoti et al.: The impact of India’s lockdown on air pollution                                                              9053

Figure 3. Moving-average time series analysis during January–July of TCN during (a) 2019 vs. 2020, (b) short-term climatological mean of
TCN (2015–2019) vs. 2020, (c) annual variations in TCN (2015–2020) during the period before lockdown and different phases of lockdown,
and (d) rate of change of TCN during 2020 vs. the 2015–2019 period.

phase I of LD in 2020 over the hotspot regions (eastern re-           ued decrease in TCN levels is recorded over the hotspot
gion of India) decreased by 22 % when compared to the cor-            regions. However, an increase in TCN was also observed
responding period of 2019. The eastern region of India has a          over the neighbouring regions of the eastern region, indi-
significant number of major power plants and refineries with          cating the dispersion of TCN. In contrast to earlier obser-
associated industries. During LD phase I in 2020, a reduction         vation, an increase in TCN levels over the northeast re-
of TCN levels is observed over this region, due to the shut-          gion could be due to seasonal biomass burning in this re-
down of industries and stoppage of urban activities involving         gion. Thus, the mean TCN levels over the entire country are
transportation and small-scale industries. However, the coun-         1.54 × 10¹⁵ molec. cm−2 during total LD (phase I and phase
try’s high TCN levels are noticed in the eastern region with          II together), with a reduction of 18 % compared to the cor-
less spread, indicating the contribution of power plants in this      responding period in 2019 as well as with respect to 5-year
region. Simultaneously, the National Capital Region (NCR)             mean TCN levels.
shows a marked reduction by about ∼ 70 % during the phase                Overall, the southern part of India reported lower TCN
I LD. The major source of emissions in the NCR is attributed          values compared to the eastern and NCR regions (hotspot
to heavy traffic and densely located industries of steel, ce-         regions) during pre-LD, phase I, and phase II. The hotspots
ment, and sugar (Garg et al., 2002; Ghude et al., 2008). As           over the southern part of India are not as dense as in the east-
mentioned above, only essential services were permitted dur-          ern and northern regions, and this could be one of the rea-
ing India’s strict lockdown; consequently, all the remaining          sons for its lower values. The southern part of India is com-
activities were halted during the phase I period. Thus, there         paratively hot and humid, which will lead to higher OH (hy-
were low levels of TCN over the hotspot regions except in             droxyl) radical concentrations than the northern part of India.
the eastern region and a few grids of the central western re-         As a result, photolysis of NO2 will increase, which results in
gion, which was due to continuous operation of power plants           low NO2 concentrations. Further, in south India, the number
and petroleum refineries (Biswal et al., 2021).                       of large point sources, amount of biomass burning, and ve-
   To sustain the Indian economy, farming activities, other           hicular population are lower compared to the northern part
agricultural practices, and associated activities, namely crop        of India (Ghude et al., 2008). Thus, reduced TCN levels over
residue burning, were permitted during phase II along with            the southern part of India irrespective of LD were observed.
phase I restrictions. Figure 2c shows TCN levels and their            Weekly variations in TCN are also shown in Fig. 2d to as-
difference map during phase II LD. With respect to the same           sess the extent of source emission during the lockdown pe-
period of phase II in 2019, the TCN levels over the coun-             riod. Therefore, the present study depicted the possible driv-
try decreased by 13 % with a mean TCN of 1.55 × 10¹⁵ and              ing factors of TCN values during pre-LD, phase I, and phase
1.75 × 10¹⁵ molec. cm−2 in 2020 and 2019. Thus, a contin-             II using high-resolution spatial data from the satellite.

https://doi.org/10.5194/acp-21-9047-2021                                                Atmos. Chem. Phys., 21, 9047–9064, 2021
9054                                                                 M. Pathakoti et al.: The impact of India’s lockdown on air pollution

Table 2. Student’s paired t test for TCN during the lockdown period against the 5-year mean (2015–2019).

                             Region/city         ∗ Student’s paired t test p value (RoC in percent during total LD)

                                                 Pre-LD                During total LD                                  Post LD
                             IGP                     0.03            0.05 (22 % ↓)                                        0.31
                             East                    0.62            0.05 (29 % ↓)                                        0.11
                             NE                      0.66               0.19 (3 % ↑)                                       0.55
                             New Delhi               0.57           0.0002 (54 % ↓)                                        0.05
                             Bangalore               0.58      2.62 × 10⁻⁵ (43 % ↓)                                        0.17
                             Chennai                 0.37            0.012 (41 % ↓)                                       0.05
                             Mumbai                  0.95            0.011 (35 % ↓)                                        0.17
                             Hyderabad               0.49           0.0003 (30 % ↓)                                       0.007
                           ∗ p value < 0.05 is significant and vice versa; (↓, ↑) indicates (decrease, increase).

Short-term climatological variations in TCN due to                                    is extremely important in weather and climatological stud-
lockdown                                                                              ies because it allows understanding and prediction of the
                                                                                      trends/patterns in climatic parameters. RoC is used to de-
Time series analysis of TCN was carried out for the years                             scribe the percentage change in a parameter over a defined
2015 to 2020 from January to July over the entire Indian                              time period, and it represents the rate of acceleration of the
region covering cold and hotspot regions (Fig. 3a–d). A                               parameter. De-trended TCN daily values were used to com-
smoothing function with a span of 7 d was used for better vi-                         pute the RoC in this study, which account for the long-term
sualisation of patterns/trends in TCN levels (Fig. 3a and b),                         variability in TCN. Thus, the RoC computed in the present
with red (green) bars indicating an increase (decrease) in                            study indicates the TCN variability due to the lockdown-
TCN levels in 2020 when compared to the corresponding                                 imposed changes alone. There is an observable lowering in
period of 2019 and with mean TCN values of 2015–2019.                                 TCN levels relative to the short-term climatological mean by
The 7 d moving average shows a significant decrease in TCN                            12 % for the pre-lockdown period as also reported by Lal
concentration with a 99.99 % (p value  0.05) confidence                              et al. (2020). During the period from January–April 2020, a
interval during the total lockdown period. However, it is also                        substantial reduction in the level of TCN, TCC, and AOD550
noticed that there is a decrease in TCN during prior and post-                        was reported across the globe during the COVID-19 pan-
lockdown periods, which is further tested statistically and                           demic as different countries (at different spatial scales) im-
found to be insignificant with p values of 0.08 and 0.24,                             posed lockdown at different timescales. This could be the
respectively. Further, statistical significance of TCN vari-                          reason for a reduction in concentrations of TCN during the
ability across hotspot, cold-spot regions, and also the major                         pre-LD period in 2020 compared with 2019 as well as with
cities where TCN dropped (↓) drastically (except NE which                             mean value of 2015–2019. Furthermore, a significant reduc-
showed increase) along with their percent drop during total                           tion of TCN concentration by 18 % and 15 % is observed for
LD when compared to 5-year mean TCN levels were sum-                                  the phase I and phase II lockdowns, respectively, over the
marised in Table 2. It clearly shows the TCN levels over the                          Indian region.
IGP (22 % ↓), eastern region (29 % ↓), and major cities (New                             Figure 4a and b show statistically computed TCN met-
Delhi 54 % ↓) declined significantly compared to the pre-                             rics for a number of positive pixels and number of nega-
ceding 5-year mean TCN levels during the total LD period.                             tive pixels in percent from January to July at a weekly in-
Change in TCN during the study period is also associated                              terval which starts from 1 January. Weekly TCN means for
with the inter-annual and seasonal variability in addition to                         the years 2015–2019, 2019 and 2020 were used to calculate
its dominant anthropogenic sources. Figure 3c shows the an-                           positive and negative pixel count based on the methodology
nual means of TCN in pre-LD, phase I, and phase II LD dur-                            stated in Sect. 3.1. Thus, the red line in Fig. 4a and b rep-
ing the 2015–2020 period. It depicts inter-annual variability                         resents the number of positive/negative pixels for the years
in TCN between the years at each timescale along with the                             2019 vs. 2020, and the black line represents the same for
lockdown-imposed changes. Between the timescales during                               the years 2015–2019 vs. 2020. The study showed a greater
the study period, a clear seasonality in TCN levels is also                           number of negative pixels (decreased area) during lockdown
observed in Fig. 3c.                                                                  weeks and vice versa for positive pixels, which depict the ex-
   The horizontal bar plots in Fig. 3d show the rate of change                        tent of area affected due to LD and subsequent changes in air
(RoC) in TCN levels in 2020 against the mean TCN lev-                                 pollutants over the Indian region.
els during 2015–2019, indicating the impact of lockdown
on TCN concentrations over the Indian region. The RoC

Atmos. Chem. Phys., 21, 9047–9064, 2021                                                                         https://doi.org/10.5194/acp-21-9047-2021
M. Pathakoti et al.: The impact of India’s lockdown on air pollution 9055
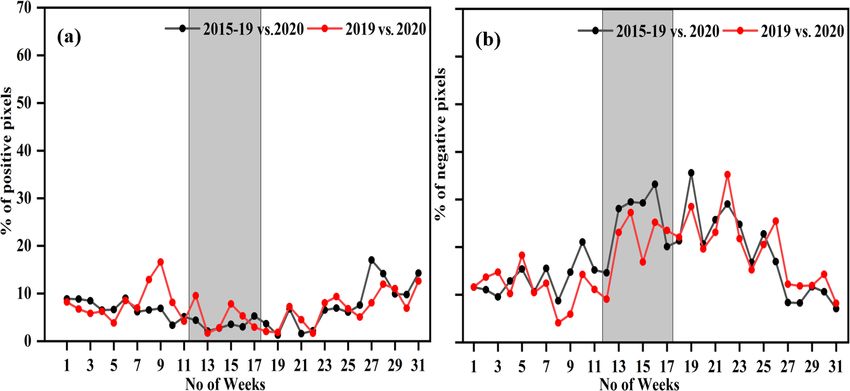
Figure 4. OMI measured the TCN (a) percentage of positive pixels and (b) percentage of negative pixels during the period 2020 vs. (2015–
2019) and 2020 vs. 2019.
4.2 Effect of LD on TCC TCC levels are decreased in the NE region, which is mainly
attributed to the reduced active fire activity in this region as
The mean TCC levels over the Indian region during the pre- shown in Fig. 5c. Except in the NE region, a consistent in-
lockdown and LD periods were studied to assess the COVID- crease in TCC levels is observed during phase II. Since the
19 lockdown-induced changes in TCC. Figure 5a–c show agriculture farming industry is exempted in the phase II LD
mean concentrations of TCC over the Indian region during and observed active fire counts in central India, an enhance-
pre-LD, phase I, and phase II LD periods using TROPOMI ment in the TCC levels is observed. An increase or decrease
data. During the pre-lockdown period (1–21 March 2020), in TCC levels in the atmosphere is mainly dominated signifi-
TCC levels were higher (mean = 2.39 × 10¹⁸ molec. cm−2 ) cantly by anthropogenic activities compared to natural emis-
compared to 2019 by ∼ 4.8 %, which indicates the increas- sions (Kanchana et al., 2020). However, comprehensive rea-
ing effect of anthropogenic activities and inter-annual vari- sons for the increase in TCC levels from the phase II LD are
ability. As shown in the Fig. 5b difference map, the TCC not investigated in this study.
levels increased in the northeastern (NE) region followed by
parts of central India (CI) and south-northwest (SNW) India 4.3 Effect of LD on AOD550
compared to 2019 and the phase I LD period. An increase
observed over these regions was evaluated statistically and We have used Terra–Aqua MODIS-derived AOD550 during
found to be insignificant (p > 0.05). An increase in TCC in 2014–2020 for January to July to understand the lockdown-
the NE region of India is mainly attributed to the active fire imposed changes. Terra MODIS AOD550 represents the
counts (Fig. 5d) during phase I of LD as shown in Fig. 5b. footprint for 10:30 LT and Aqua MODIS AOD550 for the
During phase I, other regions of India, namely the IGP, north, 13:30 LT. Although we observed similar spatial variation
and south regions, show decreased TCC levels compared to in AOD550 from both Terra and Aqua MODIS, only Aqua
the same period of 2019. The decreased TCC levels in these MODIS-derived AOD550 is shown here (Fig. 6). AOD550 lev-
regions during phase I are attributed to the shutdown of in- els over the Indian region for 2019 and 2020 and the differ-
dustries (cement, sugar, steel, etc.), absence of transportation, ence in AOD550 for both years for the pre-lockdown period
and restriction on crop residue burning. However, household are depicted in Fig. 6a. During this period, the AOD550 levels
emissions due to residential cooking are still present during for 2020 over the IGP region (∼ 21 % of the Indian territory
lockdown, which is a major contribution to CO from rural ar- landmass) are more compared to the rest of the regions of
eas and some parts of the urban region (slums). In India, 72 % India, which is expected throughout the year. This is mainly
of the population live in rural and urban slums, and most of because of its orographic effect and dense population (ac-
them continued to use household biofuel for cooking under commodating ∼ 40 % of the Indian population). The main
lockdown (Verma et al., 2018; Beig et al., 2021). anthropogenic sources over the IGP region are coal-based
However, the mean TCC levels as shown in Fig. 5c power plants and industries, crop residue and forest fires, and
are higher during phase II of lockdown. Over the en- household cooking, which contribute to high AOD in this re-
tire country, the mean TCC value during phase II is gion. Thus, the IGP is known as the first hotspot for anthro-
2.38 × 10¹⁸ molec. cm−2 in comparison to the 2019 mean pogenic aerosol emission in South Asia. During phase I of
value of 2.32 × 10¹⁸ molec. cm−2 . In phase II of LD, the LD as shown in Fig. 6b, aerosol loading over the IGP region
https://doi.org/10.5194/acp-21-9047-2021 Atmos. Chem. Phys., 21, 9047–9064, 20219056 M. Pathakoti et al.: The impact of India’s lockdown on air pollution Figure 5. TROPOMI-derived time-averaged TCC concentration and their difference maps in 2020 and 2019 (a) pre-LD, (b) phase I lock- down, and (c) phase II lockdown. (d) Fire counts from VIIRS for phase I and phase II during 2020. Atmos. Chem. Phys., 21, 9047–9064, 2021 https://doi.org/10.5194/acp-21-9047-2021
M. Pathakoti et al.: The impact of India’s lockdown on air pollution                                                      9057

Figure 6. Aqua MODIS-derived time-averaged AOD550 and its difference maps in 2020 and 2019 (a) pre-LD, (b) phase I lockdown, and
(c) phase II lockdown. (d) Weekly variation in total lockdown period during 2020.

attained its baseline concentration (∼ 45 % drop in compari-      restrictions. Further, prevailing meteorology over IGP (high
son to 2019 of the same period) due to the strict implementa-     wind speed and low relative humidity at 850 and 700 hPa) is
tion of LD. This region is densely populated and shows con-       also favourable for a decrease in AOD550 during phase I LD.
gested industrial activities, which were shut down during this       Despite the strict LD in the country, an unexpected in-
period, resulting in a nearly AOD-free atmosphere. This indi-     crease in AOD550 is observed by ∼ 28 % compared to the
cates an absence of anthropogenic activities due to mobility      preceding year of the same period over central India (CI),

https://doi.org/10.5194/acp-21-9047-2021                                           Atmos. Chem. Phys., 21, 9047–9064, 2021
9058 M. Pathakoti et al.: The impact of India’s lockdown on air pollution
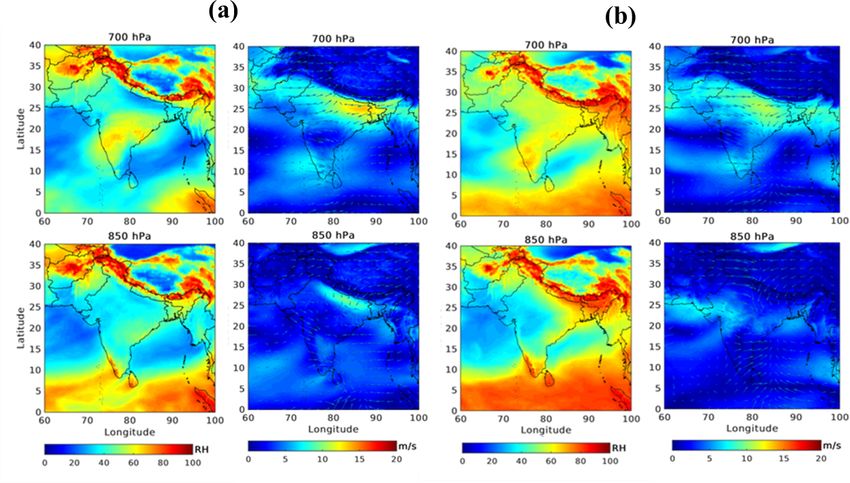
Figure 7. Mean relative humidity (%) and mean winds (m s−1 ) observed at 700 and 850 hPa (a) phase I of lockdown and (b) phase II of
lockdown.
which is predominantly dominated by dust storms (Ratnam during the total LD period and shows a significant change,
et al., 2021) through long-range transport and prevailing me- with a p value of 0.01 (99 % confidence interval) with a de-
teorology (Pandey and Vinoj, 2020). Thus, to understand the crease of 20 % over IGP and 0.03 (97 % confidence interval)
prevailing meteorology over CI, phase-wise relative humid- with an increase of 25 % over CI when compared with the
ity and wind speed at pressure levels 850 and 700 hPa, re- corresponding period of 2019.
spectively, were analysed as shown in Fig. 7a and b. During
phase I and phase II, the majority of the winds over CI are Short-term climatological variation in AOD550 due to
dominated by westerly (calm) winds with high relative hu- lockdown
midity. Under this prevailing meteorology, calm winds con-
tribute to slow dispersion, and high relative humidity (RH)
Aerosol optical depth is one of the important short-term cli-
modulates the aerosol chemistry and hygroscopic growth
matic forcing agents along with long-lived greenhouse gases,
mechanism (Pandey and Vinoj, 2020). As a result, the in-
namely carbon dioxide (CO2 ), methane (CH4 ), water vapour
crease in AOD550 over CI is observed. Further, high AOD550
(H2 O), and nitrous oxide (N2 O). A 7 d smoothing average
over NE regions was also observed because of high active
filter was applied to AOD550 time series data as discussed in
forest fire counts (Fig. 5d) compared to the 2019 LD period.
Sect. 4.1.1. Figure 8a–d show a 7 d moving-average time se-
Figure 6c shows AOD550 during phase II of India’s LD in
ries analysis of AOD550 levels for MODIS Terra and Aqua
2020 against AOD550 in 2019 of the same period. During
from January to July over the Indian region for 2014–2019
this phase, an increase in AOD550 (∼ 3 %) over IGP was ob-
mean values, 2019, and 2020. AOD550 measured by Terra–
served. Over CI, a reduction of AOD550 (∼ 18 %) was ob-
Aqua MODIS (Fig. 8b and 8d) shows a significant change
served compared to phase I of LD and not much change
in aerosol loading over the country during the lockdown
(∼ 1 %) when compared to the respective period in 2019,
period in 2020 compared to the mean AOD550 of 2014–
which depicts reversal of meteorology in phase II with re-
2019. Statistical analysis of Student’s paired t test shows
spect to phase I. Causative factors for this decrease over CI
a strongly significant change in AOD550 with a p value of
with respect to phase I are due to low RH and high wind
0.05 for Terra–Aqua MODIS during the total LD against
speed at 700 and 850 hPa over this region.
the 6-year mean (2014–2019). Interestingly, the present anal-
In a nutshell, this study demonstrates the lockdown in-
ysis shows a significant change in AOD550 during post-LD
duced Terra MODIS AOD550 changes over the IGP and CI
compared to LD, with p value ≪ 0.05 (order of an Inte-
Atmos. Chem. Phys., 21, 9047–9064, 2021 https://doi.org/10.5194/acp-21-9047-2021M. Pathakoti et al.: The impact of India’s lockdown on air pollution 9059 Figure 8. (a) Moving-average time series analysis of AOD550 measured by Terra MODIS during 2019 and 2020. (b) Terra MODIS short- term climatological mean of AOD550 (2014–2019) vs. 2020 (c) time series AOD550 measured by Aqua MODIS during 2019 and 2020. (d) Aqua MODIS short-term climatological mean of AOD550 (2014–2019) vs. 2020. (e) Variations in Terra MODIS-measured AOD550 before lockdown and different phases of lockdown and respective RoC. (f) Variations in Aqua MODIS-measured AOD550 before lockdown and different phases of lockdown and respective RoC. ger × 10−12 ), which is attributed to the continued effect of seasonal modulation between the phases during 2014–2020. lockdown phases III and IV and scavenging effects during Despite inter-annual and seasonal variability of AOD550 , the the monsoon season. Due to increasing precipitation during strict lockdown in 2020 shows a decrease in phase I and the active summer monsoon (June–July) season, lowering of phase II compared to pre-LD, which could be associated with aerosol is expected (Boucher et al., 2013). Thus, the contin- the reduced anthropogenic sources in addition to prevailing ued lockdown and active monsoon improved the air quality meteorology as discussed in Sect. 4.3. The RoC in AOD550 beyond the strict lockdown period as shown in Fig. 8a–d. was computed (Fig. 8e and f) to understand the effect of The annual mean AOD550 over the Indian region in each short-term climatological mean AOD550 over the lockdown phase is shown as vertical bars in Fig. 8e and f, indicating period in 2020. A positive RoC of +8.8 % (+14 %) was ob- the inter-annual variability of AOD550 across the phases and served during pre-LD as measured by Terra MODIS (Aqua https://doi.org/10.5194/acp-21-9047-2021 Atmos. Chem. Phys., 21, 9047–9064, 2021
9060 M. Pathakoti et al.: The impact of India’s lockdown on air pollution
MODIS) against the 6-year mean AOD550 . This increase of AOD550 over the IGP region during phase I is more promi-
is tested statistically and found insignificant with p values nent compared to phase II. Further, it is noticed that the RoC
of 0.11 and 0.37 for Terra MODIS and Aqua MODIS, re- of AOD550 computed from Terra and Aqua showed similar
spectively. During phase I (phase II) Terra MODIS showed trends during the total lockdown period with a small differ-
statistically significant negative RoC with −24 % (−9 %), ence in the amplitudes. This difference of amplitude between
and Aqua MODIS showed −22 % (−7 %) against 6-year these two sensors could be due to a difference in overpass
mean AOD550 as most of the sectors were turned off ex- time, which changes atmospheric dynamics such as planetary
cept household emissions and essential services. Therefore, boundary layer height, solar zenith angle, and prevailing me-
our study demonstrates that India’s strict lockdown improved teorology. An average of Terra–Aqua MODIS-derived RoC
the aerosol air quality over the country, with marked changes of AOD550 shows a strong reduction in the western part of
over the IGP and CI. India, mainly Rajasthan (−36 %) and Gujarat (−31 %) dur-
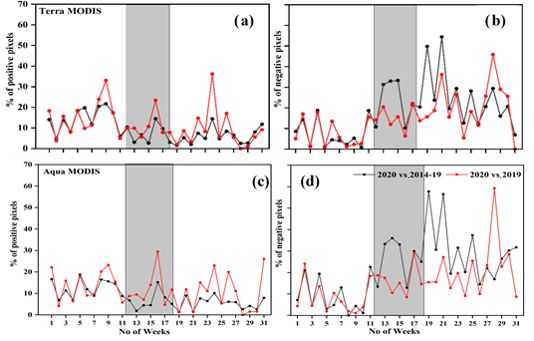
Figure 9a–d show the number of positive and negative ing the total LD period (Ranjan et al., 2020). Therefore, in
AOD550 pixels in percent at weekly intervals computed from a nutshell, an analysis of RoC depicts regional variability of
the respective biases during the study period over the Indian air pollutants during the total LD period in 2020 with respect
region. Figure 9a and b show the percentage of positive and to short-term (5–6-year) mean.
negative pixels of AOD550 measured by the Terra MODIS.
During the lockdown weeks (shaded in grey colour) in 2020,
the number of positive pixels was fewer compared to 2019 5 Conclusions
and the short-term climatological mean of AOD. Figure 9b
shows a higher percentage of negative pixels during the same The present study carried out an analysis on air pollution in
study period, indicating the larger extent of the area with connection with the world’s largest lockdown imposed by the
lower AOD550 due to strict lockdown in India. This change government of India to contain the spread of COVID-19. The
is even high with respect to short-term climatological mean lockdown was extended as four lockdowns with strict lock-
of AOD550 . The Aqua MODIS-derived AOD550 also shows down from phase I to several relaxations in phase IV. How-
similar variability and is shown in Fig. 9c and d. ever, the lockdown was near total only in phases I and II, with
the total shutdown of industrial and transport sectors. There-
4.4 State-wise rate of change (RoC) of TCN and fore, the first two phases are only considered total lockdown
AOD550 in the present study. We have analysed satellite-based obser-
vations of TCN, TCC, and AOD550 pollutant concentrations
Table 3 shows state-wise RoC computed for pre-LD, phase during the period of lockdown and before LD against the
I, phase II, and total LD phases in 2020 with respect to same period of the preceding year (2019) and also against
the 5-year mean (2015–2019) for TCN and with respect to the short-term mean (2014–2019) of about 6 years.
the 6-year mean (2014–2019) for Terra AOD550 and Aqua Following are the major findings from the present study.
AOD550 . A positive percentage of RoC indicates an increase
in pollutants for the respective phases shown in Table 3 when – The TCN levels dropped significantly by 18 % across
compared to the same period of means of TCN and AOD550 the country during the strict lockdown period compared
for 2015–2019 and 2014–2019, respectively. A negative per- to the preceding year with a p value of 0.0007 (confi-
centage of RoC indicates the decrease in TCN and AOD550 dence interval of 99.93 %).
with respect to 2015–2019 and 2014–2019 values, respec-
tively, for the phases as shown in Table 3. Results depict the – A reduction of 29 % in TCN levels was observed over
change of pollutants over each state during the lockdown pe- the hotspot regions of the Indian sub-continent during
riod compared to the respective period in 5-year mean for the total LD period with a higher confidence interval.
TCN and 6-year mean for AOD550 .
TCN values during the lockdown in 2020 significantly – The TCN levels with respect to short-term clima-
dropped in the hotspot zones of eastern states (Odisha, tological mean markedly dropped over the urban
Chhattisgarh, and Jharkhand) and NCR regions (New Delhi, cities, namely New Delhi (−54 %), Bangalore (−43 %),
Ghaziabad, Faridabad, Gurugram, and Noida) compared to Chennai (−41 %), Mumbai (−35 %), and Hyderabad
the mean TCN values of 2015–2019. Similarly, the AOD550 (−30 %) with a high confidence interval of about
measured by the Terra–Aqua MODIS also shows a signifi- 99.90 %.
cant drop over the IGP region during the total LD. However,
an unexpected increasing effect is noticed in the CI states – An unusual increase in TCN levels over the NE region
with respect to the 6-year mean of AOD550 during phase I. of India is attributed to the seasonal biomass burning in
Similar results are also observed when compared to the pre- this region. This increase is also evaluated statistically
ceding (2019) year mean AOD550 , which is discussed in de- against 5-year mean TCN and found to be insignificant
tail in the earlier section. It is observed that the negative RoC with a p value of 0.19.
Atmos. Chem. Phys., 21, 9047–9064, 2021 https://doi.org/10.5194/acp-21-9047-2021M. Pathakoti et al.: The impact of India’s lockdown on air pollution 9061
Figure 9. Terra MODIS (a) percentage of number of positive pixels, and (b) percentage of number of negative pixels during the period 2020
vs. (2014–2019) and 2020 vs. 2019. Aqua MODIS (c) percentage of positive pixels and (d) percentage of negative pixels during the period
2020 vs. (2014–2019) and 2020 vs. 2019.
– Significant reduction in TCC levels over the IGP, north, icant in the NE region with a p value of 0.33, which
and south regions during phase I LD attributed to the ab- indicates insignificant change due to LD.
sence of emissions because of a complete halt of trans-
portation and shutdown of industries. Although variabil- – The LD-induced changes in AOD550 measured by
ity in the TCC levels was noticed during the total LD, it Terra–Aqua MODIS show a significant change over the
was found statistically insignificant. High and low tro- Indian region, with very high confidence against the 6-
pospheric CO levels in the NE region during phase I year short-term climatological mean.
and phase II of LD period, respectively, are mainly at-
tributed to the active and dormant fire counts during the – Further, an analysis of RoC was carried out to depict the
corresponding period. regional variability of air pollutants during the total LD
period in 2020 compared to short-term climatological
– AOD550 levels are attained to near baseline in this re- mean.
gion (AOD mean value = 0.2) in the densely popu-
lated IGP region due to the complete shutdown of all Our study successfully demonstrated how the satellite-
the industries during the LD. This drastic decrease in based TCN, TCC, and AOD550 changes over the Indian
AOD550 over the IGP region was statistically evaluated region can be used to understand and quantify the spatio-
and found to be very significant, with a p value of 0.008 temporal variations in air quality during COVID-19 lock-
with the preceding year (45 % decrease) and 50 % re- down in India during 2020 and compared against the pre-
duction against 6-year mean with a p value
0.05. ceding year (2019) and also compared with their short-term
6-year mean values (2014–2019).
– Despite the country’s LD, the AOD550 levels are found
to be high over the CI region because of the influence Code and data availability. The satellite and reanalysis data used
of transported dust storms and prevailing meteorology. in the present study are freely available and can be down-
Also observed was high AOD550 over NE and was asso- loaded as summarised in Table 1 with the user’s credentials.
ciated with active fire counts. However, this increase is The Python code is uploaded to an online repository (https://
significant in the CI with a p value of 0.03 and insignif- github.com/aarathimuppalla/airpollution_ld_study.git, last access:
https://doi.org/10.5194/acp-21-9047-2021 Atmos. Chem. Phys., 21, 9047–9064, 20219062 M. Pathakoti et al.: The impact of India’s lockdown on air pollution
Table 3. State-wise RoC (%) computed during pre-LD, phase I, phase II, and total LD for TCN, Terra MODIS-derived AOD550 , and Aqua
MODIS-derived AOD550 .
State name Pre-LD (%) Phase I (%) Phase II (%) Total LD (%)
TCN Terra AOD Aqua AOD TCN Terra AOD Aqua AOD TCN Terra AOD Aqua AOD TCN Terra AOD Aqua AOD
Andhra Pradesh −15 −7 −6 −33 −30 −30 −23 6 −11 −28 −15 −22
Arunachal Pradesh −14 −16 −3 8 14 21 13 −25 −51 8 4 1
Assam −12 −13 −18 9 −10 −12 −3 −13 −29 2 −11 −19
Bihar −4 20 30 −19 −54 −63 −16 −12 −24 −18 −34 −45
Chhattisgarh −20 −1 1 −19 −5 −6 −18 24 15 −20 7 4
Gujarat −1 −14 −24 −4 −33 −47 −15 −16 −27 −9 −25 −37
Haryana 0 11 18 −47 −39 −44 −21 −28 −41 −31 −34 −43
Himachal Pradesh −13 35 −3 −36 −43 −50 −7 −9 8 −18 −28 −21
Jammu and Kashmir 13 4 13 12 3 1 −18 18 15 −3 10 7
Jharkhand −14 21 −1 −30 −40 −39 −16 20 11 −24 −13 −16
Karnataka −9 32 17 −24 −31 −26 −22 −3 −7 −23 −19 −18
Kerala −1 26 24 −10 −30 −45 −20 −20 −9 −14 −27 −32
Madhya Pradesh −11 13 5 −13 −16 −14 −4 −13 −7 −9 −14 −10
Maharashtra −8 −1 −1 −18 11 23 −10 −8 9 −15 3 18
Manipur 45 −37 −37 −4 −26 −24 −20 −5 −6 −7 −21 −19
Meghalaya −6 3 −8 13 −21 −21 −21 −4 −7 5 −15 −16
Mizoram 31 −16 −22 −15 −20 −22 0 −13 −28 −8 −18 −24
Nagaland −1 −23 −19 −12 −18 −19 22 −5 −25 0 −13 −18
Odisha −22 −8 −23 −18 −18 −9 −14 14 12 −18 −5 0
Punjab −14 9 0 −46 −47 −45 −16 −21 −29 −29 −32 −37
Rajasthan 12 14 −3 −10 −42 −33 −2 −34 −37 −6 −37 −35
Sikkim −60 −85 −63 −30 16 70 −36 37 −100 −33 15 62
Tamil Nadu −7 53 49 −18 −40 −40 −23 −6 −22 −20 −23 −32
Telangana −20 12 −2 −24 4 4 −18 3 5 −21 4 4
Tripura 19 −8 −8 28 −23 −33 −28 −30 −39 8 −27 −32
Uttar Pradesh 18 18 22 −27 −49 −54 −18 −6 −9 −22 −25 −30
Uttarakhand −15 13 −11 −23 −58 −56 −38 −5 3 −30 −34 −28
West Bengal −8 17 15 −15 −41 −47 −22 −7 −7 −19 −28 −32
Goa −40 −5 −23 −30 −28 −16 −26 −3 −18 −29 −18 −16
New Delhi −2 14 16 −70 −33 −27 −40 9 13 −54 −17 −19
21 April 2021, https://doi.org/10.5281/zenodo.4726649, Pathakoti, midity and wind data. We thank Pushpanathan Raja, principal scien-
2021). tist, Indian Institute of Soil and Water Conservation-Indian Council
of Agriculture Research, Ooty, India, for reviewing the manuscript.
The authors sincerely thank the handling editor and anonymous re-
Author contributions. Conceptualisation and formal analysis were viewers for their constructive comments and suggestions for im-
performed by MP, AM, SH, DVM, and VKS. Writing of the original proving the present work.
draft was carried out by MP, DVM, and ALK. Writing, review, and
editing were carried out by DVM, ALK, JS, SSR, MVR, and UV.
Review statement. This paper was edited by Rolf Müller and re-
viewed by G. China Satyanarayana and two anonymous referees.
Competing interests. The authors declare that they have no conflict
of interest.
References
Acknowledgements. The authors sincerely thank Raj Kumar, direc-
tor of the NRSC, for his support and encouragement in carrying Beig, G., Korhale, N., Rathod, A., Maji, S., Sahu, S. K.,
out this study. We greatly acknowledge the Earthdata web portal for Dole, S., Latha, R., and Murthy, B. S.: On modelling
providing free access to the Aura OMI and Sentinel-5P TROPOMI growing menace of household emissions Under COVID-
satellites data. We also greatly acknowledge LAADS (Level-1 and 19 in Indian Metros, Environ. Pollut., 272, 115993,
Atmosphere Archive and Distribution System) operated by the Na- https://doi.org/10.1016/j.envpol.2020.115993, 2021.
tional Aeronautics and Space Administration (NASA) for provid- Berman, J. D. and Ebisu, K.: Changes in US air pollution dur-
ing Aqua and Terra MODIS satellite data. The authors would also ing the COVID-19 pandemic, Sci. Total Environ., 739, 139864,
like to thank Land, Atmosphere Near real-time capability for Earth https://doi.org/10.1016/j.scitotenv.2020.139864, 2020.
Observation system (LANCE)/Fire Information for Resource Man- Biswal, A., Singh, T., Singh, V., Ravindra, K., and Mor, S.: COVID-
agement System (FIRMS) operated by NASA for providing the fire 19 lockdown and its impact on tropospheric NO2 concentra-
data. The authors further thank the European Centre for Medium tions over India using satellite-based data, Heliyon, 6, e04764.
Range Weather Forecasts (ECMWF) for providing the relative hu- https://doi.org/10.1016/j.heliyon.2020.e04764, 2020.
Atmos. Chem. Phys., 21, 9047–9064, 2021 https://doi.org/10.5194/acp-21-9047-2021You can also read