Variable Star Section Circular - The British Astronomical Association No. 188 June 2021
←
→
Page content transcription
If your browser does not render page correctly, please read the page content below
`

                                                                 ISSN 2631-4843

    The British Astronomical Association

    Variable Star
    Section Circular
    No. 188 June 2021

          Office: Burlington House, Piccadilly, London W1J 0DU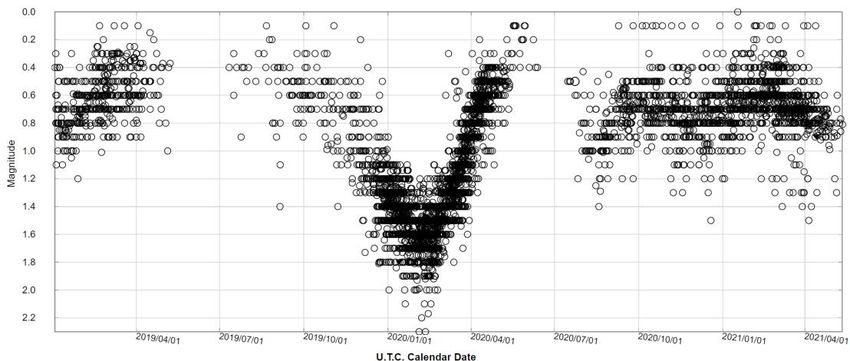
Contents

From the Director ....................................................................................................... 3
Summer Miras............................................................................................................ 3
The Centenary of the AFOEV – John Toone .............................................................. 5
Campaign to observe the very frequently outbursting Dwarf Nova CG Dra
Jeremy Shears ........................................................................................................... 5
CV & E News – Gary Poyner ..................................................................................... 7
V1391 Cas, V1112 Per, V1405 Cas – three very different Nova
David Boyd ................................................................................................................ 10
Is the supercycle of ER UMa really increasing? – Stewart Bean ................................ 14
Report of the Pulsating Star Programme 2020 – Mira Variables, Part II
Shaun Albrighton ....................................................................................................... 18
A shallow minimum of Betelgeuse in April 2021 in agreement with the recent
430 day period – Mark Kidger .................................................................................... 21
eta Geminorum and VZ Cancri – Tracie Louise Heywood .......................................... 24
V572 Cam: period calculation from a single cycle, preliminary analysis
Geoff Chaplin ............................................................................................................. 25
Eclipsing Binary News – Des Loughney ..................................................................... 29
Three for the price of one – David Conner ................................................................. 31
Follow up observations of GSC 03421-01402 aka UCAC4 709-047369
James Screech .......................................................................................................... 37
Section Publications ................................................................................................... 40
Contributing to the VSSC ........................................................................................... 40
Section Officers.......................................................................................................... 41

                                                          Cover Picture

                                                 V1405 Cas (Nova Cas 2021)
      May 08.418 UT 2021. iTel Takahashi FSQ 106ED apo +STL 11000M. 120 seconds. V=5.87
                         Martin Mobberley, Bury St. Edmunds, Suffolk UK

                                                                  2
                                                                                                                    Back to contents
From the Director                                                             Jeremy Shears

Spring has been a mixed bag for me, with sleet, hail, and sub-zero temperatures in early May and yet
April was my best observational month ever (22 nights, patrolling over 2000 cataclysmic variable
fields). We’ve also had the enjoyment of Nova Cas 2021 (V1405 Cas) which has received
considerable attention from non-VS observers too, as it has been visible in binoculars for many
weeks. The first report of a naked eye observation was a VSnet posting by Filipp Romanov observing
from near Nakhodka, Russia (nr Vladivostok, 42degN) who had it at 5.1 vis on May 10.75. This was
                                        around the time of maximum brightness (see light curve
         SUMMER MIRAS                   below).

                                      I believe this makes it the first naked eye nova since Nova Del
  M = Max, m = min.                   2013 (V339 Del), at least from these latitudes. This is a slow
                                      nova and certainly worth keeping an eye on over the next few
  R And           M=May/Jun           weeks. Might we see another brightening episode, similar to
  W And           M=Jun/Jly           what was observed with HR Del?
  RW And          M=May/Jun
  R Aqr           M=Aug               And don’t forget the other two recent novae: Nova Cas 2020
  R Aql           M=Aug               (V1391 Cas) and Nova Per 2020 (V1112 Per).
  UV Aur          m=Aug
  V Cam           m=Jun
  X Cam           M=Aug               VSS observing campaigns on CG Dra and ER UMa
                  m=Jun               systems
  SU Cnc          m=Jly
                                      May I draw observers’ attention to a new VSS campaign on
  RT CVn          m=Aug
                                      CG Dra which is described later in this Circular? This was
  o Cet           M=Aug
                                      once on the VSS “Recurrent Objects Programme” of rarely
  R Com           M=Jly/Aug
                                      outbursting cataclysmic variables. However, as the campaign
  S CrB           M=Jly
                                      in 2005 revealed it is actually one of the most active dwarf
  W CrB           m=Jly
                                      novae, going into outburst every 11 days or so. Unfortunately,
  R Cyg           m=Jly
                                      since then CG Dra has been largely neglected, so the aim of
  T Dra           m=Jly
                                      the campaign is to check on what it is up to now. We’ll run the
  RU Her          M=Aug/Sep
                                      campaign until the end of the current observing season and
  SS Her          m=Jun
                                      review.
  W Lyn           M=Jly/Aug
  X Lyn           m=Aug               Members have indicated to me that they like to engage in
  T UMa           M=Aug/Sep           campaigns of this nature as a focus for their work – often
                                      people will add a campaign star to their existing programme. A
     Source BAA Handbook              paper on a recent campaign target, the nova-like variable HS
                                      0229+8016, has been submitted to the BAA Journal.

Another campaign ongoing presently is on the supercycle lengths of ER UMa dwarf novae including
IX Dra (https://britastro.org/node/24529), ER UMa & RZ LMi (https://britastro.org/node/25052).
Nightly measurements enable us to determine the onset times of outbursts and superoutbursts.

AFOEV Centenary

On behalf of the Variable Star Section of the BAA, I had the pleasure to send hearty and fraternal
congratulations to the members of the Association Française des Observateurs d'Étoiles Variables
(AFOEV) on their centenary. The AFOEV was formed on 1921 April 16. John Toone’s article in this
Circular provides further context.

                                                  3
                                                                                        Back to contents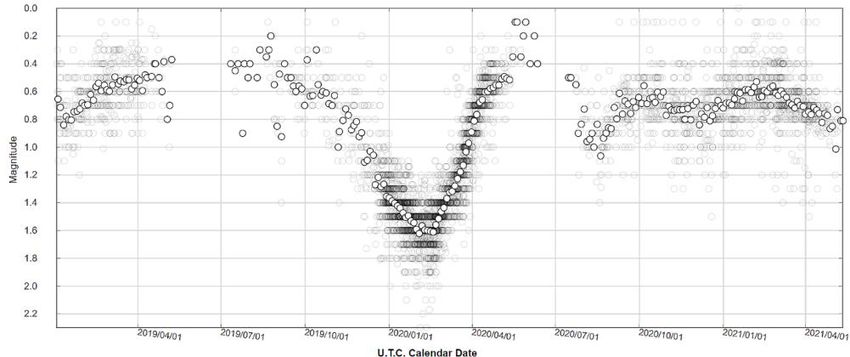
Back numbers of the VSS Circular
A number of people that have joined the Section recently have enquired about obtaining back
numbers of this Circular. The are available for download at https://britastro.org/vss/VSSC_archive.htm
Light curve for V1405 Cas (Nova Cas 2021); Mar 19 to May 30. Data from VSS database
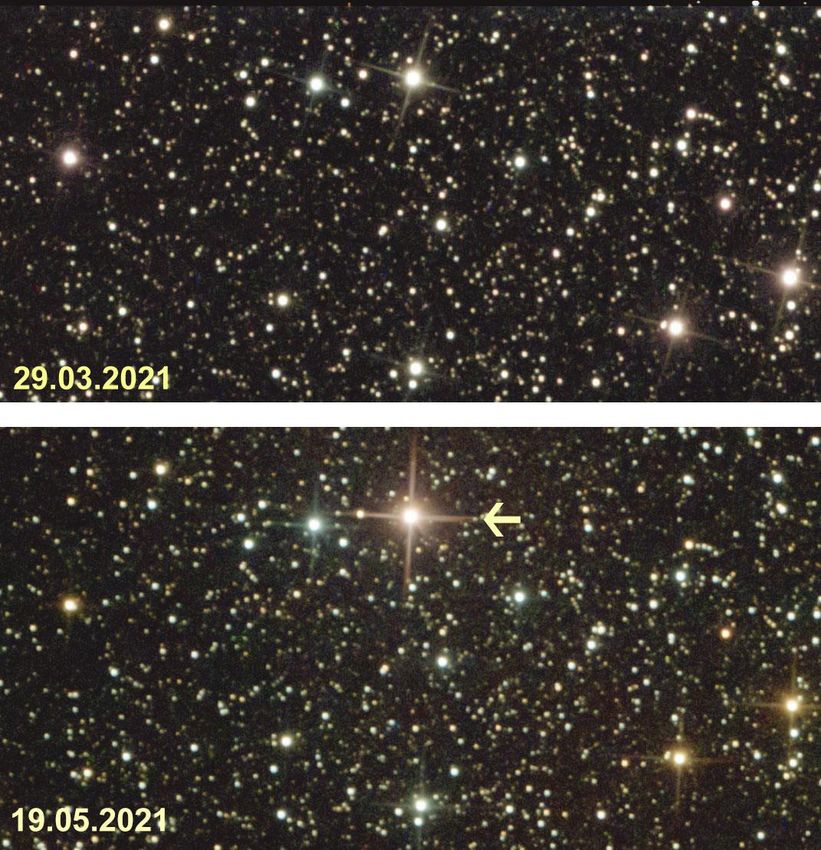
V1405 Cas. 2021 March 29 and May 19, indicating a shift to red. Skywatcher Quattro 200mm f/4
Newtonian, ZWO ASI 294MC-Pro. Exposure: 90 frames of 60 sec (Mazin Younis, Hale Barnes,
Manchester)
4
Back to contents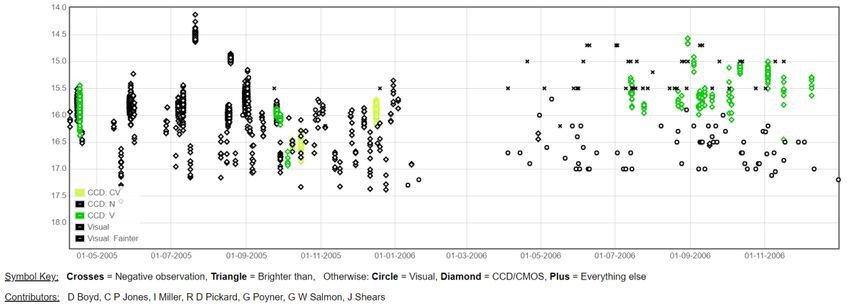
The Centenary of the AFOEV

                                           John Toone

Following the lead set by the BAA VSS in 1890 the next sustainable variable star organisation to be
formed was the AAVSO in 1911. Then there were a cluster of national variable star groups that were
formed in the 1920’s. Most like the BAA VSS were sections within nationwide astronomical
associations/societies that were set up in Australia, Denmark, Japan, New Zealand and South Africa.
France also formed a group, but they were different in that they were autonomous and more like the
AAVSO supported by a professional observatory. This group was the AFOEV, and they formed
following a meeting held on 16 April 1921 at Lyons Observatory with AAVSO founder member
Stephen Crasco Hunter in attendance. Their first observations were published the following month in
the Lyons Observatory Bulletin and the initial name adopted by the group was “Groupement Francais
d’Observateurs d’Etoiles Variables”. The name changed to Association Francaise des Observateurs
d’Etoiles Variables (AFOEV) once it was officially registered as an association in 1927. Henri
Grouiller, Jean Mascart and Antoine Brun formed the leadership of the group in the early days.

The AFOEV rapidly expanded in the late 1920’s and 1930’s and published the observations in the
AFOEV bulletin. They received observations from up to 20 countries including contributions from
Charles Butterworth who submitted his observations of variable stars that were not on the official
observing programme of the BAA VSS. During 1932–1938 the AFOEV collaborated with the AAVSO
and BAA VSS under the Joint Committee of Variable Star Associations to improve and unify variable
star sequences with the assistance of the McCormick and Strasbourg Observatories.

Unfortunately, World War II severely disrupted the work of the AFOEV and it took until 1969 to
recover when the Association was officially relaunched and the bulletins resumed.

Like the BAA VSS the AFOEV shares its observational data with the AAVSO and has amassed
approximately five million observations that are stored at its HQ at Strasbourg Observatory. Today the
AFOEV continues to be a focal point for variable star work within Europe and French speaking
countries worldwide. On the 16 April 2021 the AFOEV celebrated its centenary, the third major
variable star organization to do so.

             Campaign to observe the (very) frequently outbursting
                            Dwarf Nova CG Dra

                                         Jeremy Shears

CG Draconis was discovered by Hoffmeister in 1965 (1) and he later classified it as a dwarf nova (2).
Rather little was known about its outburst frequency until an intensive monitoring campaign was
conducted during 2005, the results of which were published in the BAA Journal (3). This revealed that
the star has frequent outbursts every 11 days or so and the star spends very little time at quiescence.
Two types of outburst were detected: short outbursts lasting about 4 days and long outbursts lasting
about 8 days. The range is mag 14.1 to 17.4 as shown in the VSS light curve below.

                                                   5
                                                                                         Back to contents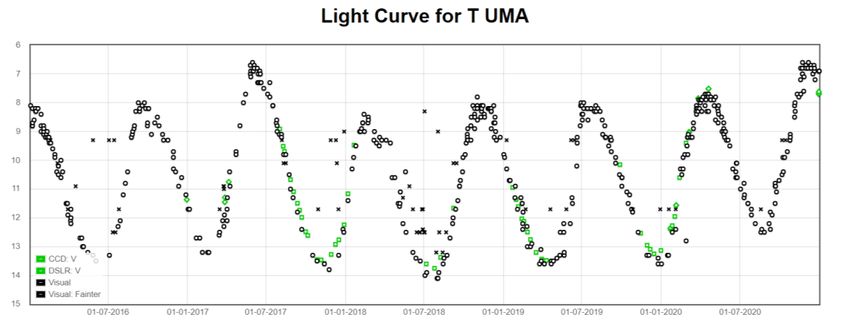
A subsequent paper presented evidence for very shallow (~0.16 mag) eclipses with a duration of
about 18 min (4). The times between the eclipses were consistent with an orbital period of 0.18864(4)
d, or 4h 31m 38 +/- 3s.

Rather few observations of this star have been made since 2008, according to the BAA and AAVSO
databases. Hence the intent of the present campaign is to rectify that situation and check on CG Dra’s
current behaviour. Has it changed in the last 15 years?

Two kinds of observation are requested. The first is nightly “snapshot” observations to determine the
overall light curve of CG Dra, thus its outburst frequency and duration. These can be digital or visual
(if you have a sufficiently large telescope). Secondly, some long runs of time series photometry would
help to verify, and time, eclipses. Unfiltered photometry is very suitable for this.

Charts and sequences are available from the AAVSO Variable Star Plotter (e.g., chart
https://app.aavso.org/vsp/chart/X26515JI.png). CG Dra is located at RA 19 07 32.63 Dec +52 58 28.1
(J2000.0). The campaign will run until the end of the current observing season, likely early 2022
depending on latitude.

Given that this star undergoes frequent outbursts, it provides much interest for those that decide to
follow it, as it is always doing something! Please submit your data to the VSS Database and help us
to shed new light on this neglected dwarf nova.

1. Hoffmeister C., Mitt. Veranderl. Sterne 2, 96 (1965).
2. Hoffmeister C., Astron. Nachr. 289, 139 (1966).
3. Shears J., Pickard R. and Poyner G., J. Br. Astron. Assoc., 117, 22-24 (2007).
4. Shears J., Boyd D., Brady S. and Pickard R. J. Br. Astron. Assoc., 118, 343-347 (2008).

                              Light curve of CG Dra from VSS database

                                                   6
                                                                                         Back to contents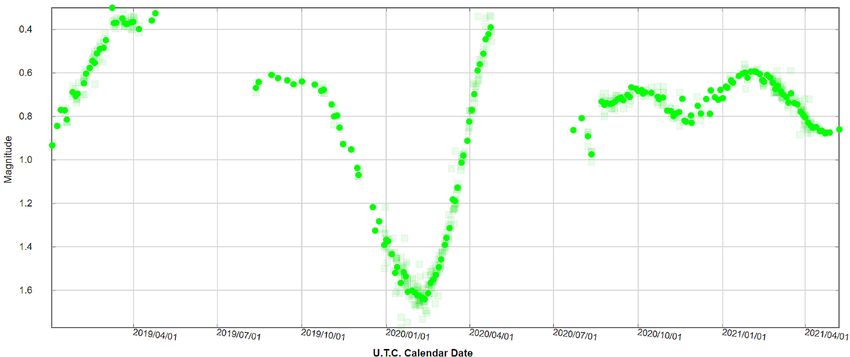
CV & E News

                                          Gary Poyner

Recent activity in five objects on the BAAVSS Cataclysmic Variable & Eruptive Star
programme are discussed – ES Aql, DO Dra, YY Her, V742 Lyr and DV UMa.

ES Aql:

Recent observations of the RCB star ES Aql reveal an historic low state occurring in late April. The
BAAVSS DB reports that the final observations of 2020 show the star at maximum brightness of 11.6
visual on November 19. Unfiltered
CCD observations on March 23 2021             11.0
reveal ES Aql had faded to 14.03CV,
                                              12.0
and one month later the decline had
reached 19.66CV by April 26. A                13.0
recovery to magnitude 17.2CV by May
22 has followed, with ES Aql spending         14.0
just ten days at minimum brightness.
The previous faintest level ES Aql has        15.0
                                            Magnitude

been recorded is 18.4V in 2011 (from
AAVSO IDB).                                   16.0

Observations of ES Aql began as                17.0
recently as 1999, yet in those 22 years
no fewer than twelve fades below               18.0
magnitude 15 have been recorded.
                                               19.0
Each one of those fades have been of
short duration, with a recovery                20.0
occurring within a month of minimum              10/5/16       10/5/18     9/5/20         9/5/22
brightness. Not really classic RCB
                                                                              Visual CCD V
behaviour. With this unusual high
activity seen in an RCB star, one wonders why there are so few BAAVSS observers – eight in total,
and just three in the last decade.

The light curve above right shows the current historic fade, and the previous fade which occurred in
March/April 2019. (BAAVSS database).

DO Dra:

Intermediate Polars can be strange beasts. A magnetic white dwarf leading to a truncated accretion
disc is a good recipe for an interesting time to be had for any observer who follows these fascinating
CV’s – and DO Dra is proving that as I write these words.

Since 1985 there have been eleven outbursts reported to brighter than magnitude 12, and three
between magnitudes 12 and 14. Minimum can vary between magnitudes 14 and 18, and the period
between 2016-2020 showed lots of activity in these lower levels. Outbursts tend to be short duration
events – around 2 to 4 days at most, with the occasional rare outburst lasting longer. With such a
short outburst duration, one wonders just how many outbursts in IP’s are being missed entirely! A

                                                        7
                                                                                         Back to contents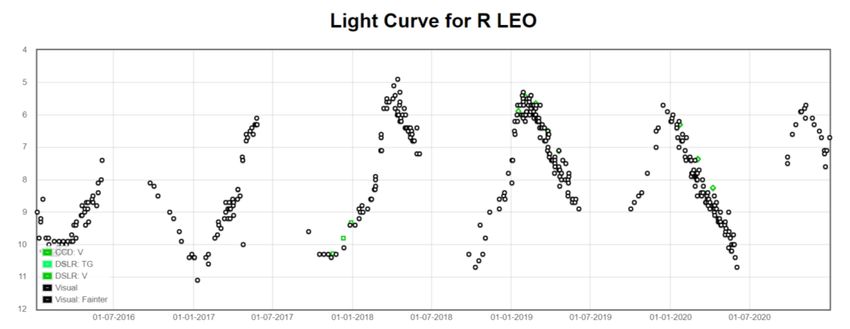
visual inspection of the light curve below shows a lack of any outbursts being detected between May
2011 and May 2016.

The amplitude of the outburst has also been decreasing over the last 30 years or so. The brightest
yet seen occurred in September 1990 peaking at magnitude 9.8, with subsequent outbursts each
fainter than the previous one. The last ‘bright’ outburst occurred in November 2010 which peaked at
magnitude 12.0. (AAVSO IDB).

The current outburst (still ongoing as I write these words on May 23), has been quite unusual for a
couple of reasons – the duration (14 days so far), and the occurrence of a rebrightening. Having
peaked at magnitude 12.4 on May 9, DO Dra then faded back to magnitude 15.0 by May 11. The
rebrightening occurred two days after on May 13, which peaked at 13.6V on May 16. By May 22, DO
Dra could still be seen bright at magnitude 13.9C. The AAVSO have the most complete data on DO
Dra available, with no historic outbursts having shown a rebrightening.

                               DO Dra 1984-2021. AAVSO International Database.

YY Her:

The Symbiotic variable YY Her entered its first outburst since 2014 during March 2021. The outburst
appears to have peaked around magnitude 12.0 on April 19, and slowly faded to its current level (May
23) of 12.6V. This event has followed a deep minimum recorded in June 2020 when YY Her reached
a magnitude of 13.8 at minimum brightness – the faintest seen since July 2015. The outburst was
first announced on ATel 14458.

                11.5

                12.0

                12.5
    Magnitude

                13.0

                13.5

                14.0
                 07/01/2011   06/01/2013   06/01/2015       05/01/2017   05/01/2019    04/01/2021
                                                        730d                          Visual        V

                          YY Her, 2011-2021. Visual and V date from BAAVSS Database

                                                        8
                                                                                               Back to contents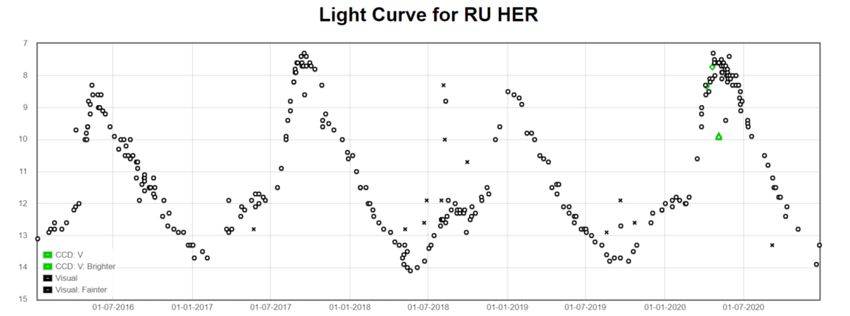
V742 Lyr:

Rather like the aforementioned ES Aql, V742 Lyr is another RCB star which is apparently being
ignored by both visual and CCD observers alike, with just five observers reporting data to the
database since monitoring began in 2009 (first identified as NSV 11154). This is rather unfortunate,
as V742 Lyr is proving to be an interesting classical RCB star with an amplitude in excess of seven
magnitudes. Recently, the star has just seen its deepest minimum yet, bottoming out at magnitude
19.4C in November 2020 before rising slowly to its current level (at time of writing, May 23) of 13.8
visual on May 20. A rise of 5.5 magnitudes in five months. The previous deep minimum was seen in
October 2017 when the star reached magnitude 19.0V at minimum.

With a magnitude range of 11.5V-19.5CV, V742 Lyr is an excellent target for both visual and CCD
users who have an interest in the unpredictability of RCB stars.

              11.0
              12.0
              13.0
              14.0
              15.0
  Magnitude

              16.0
              17.0
              18.0
              19.0
              20.0
                 6/7/09   18/11/10   1/4/12   14/8/13   27/12/14   10/5/16   22/9/17   4/2/19   18/6/20   31/10/21

                                                    Visual   V     CV   TG

                                V742 Lyr (NSV 11154) 2009-2021. BAAVSS database

DV UMa:

The eclipsing UGSU star DV UMa was detected in outburst
on March 29.9 at 15.2CV by Jeremy Shears. This was the
first outburst observed since April 2020, and the first
superoutburst seen since February 2014. The outburst
lasted 19 days.

Roger Pickard observed several eclipses (see right) on the
nights of April 3 (top) and April 17 (bottom).

The times of mid eclipse in Roger’s observations have
allowed me to compare with the ephemeris given on the
BAAVSS eclipse page (under CV’s). It was quite apparent
that the ephemeris given for DV UMa was incorrect, and
both John Greaves (who wrote the CV eclipse program)
and I suspected that other timings might be out too, as the
data to calculate the mid timings were old. With this in
mind, the CV eclipse predictions have been removed from
the BAAVSS web page. Mid eclipse timings for selected
(but not all) eclisping CV’s can be found in VSX.

                                                             9
                                                                                                     Back to contents
V1391 Cas, V1112 Per, V1405 Cas – three very different Novae

                                           David Boyd

B and V band photometry and spectroscopy of three recent northern hemisphere novae
reveals their different behaviour.

Observations

Northern hemisphere novae are like buses. You wait ages for one then three come along at the same
time. I have tried to observe all three as regularly as weather conditions and their visibility has
allowed. I obtained photometry with a 0.35m SCT, SXVR-H9 CCD and B and V filters and
spectroscopy with a 0.25m SCT and LISA spectrograph. They have all gradually become lower in the
north-west over recent months making observation increasingly difficult because of obstruction by
trees and buildings. Using comparison stars from the relevant AAVSO charts, I measure B and V
instrumental magnitudes on each image and use the B-V colour index to transform V magnitudes to
the Johnson V photometric standard. At their brightest, exposures had to be very short and therefore
suffered from atmospheric scintillation. This was mitigated by averaging magnitudes measured on
many consecutive images. At their faintest I switched to a clear filter to maintain a reasonable signal
to noise ratio. Spectra have been calibrated in absolute flux using concurrently measured V
magnitudes.

I show below for each nova, using my own measurements, how their V (and C) magnitudes and B-V
colour indices evolved over time, and the paths they have followed in a V vs B-V colour-magnitude
diagram. I have also included a spectrum of each nova recorded close to the point where it reached
maximum brightness shortly after discovery. The most prominent emission lines in the spectra at this
stage in the outburst are the lines of the hydrogen Balmer series and, in V1112 Per and V1405 Cas,
lines of He I. These emission lines often show P Cygni type absorption dips on their blue side caused
by absorption in the ejecta of the explosion which is moving towards us. The different behaviour of
each nova is clear from these results.

More data on each nova from many observers can be found in the BAA photometry and spectroscopy
databases.

Nova Cas 2020 = V1391 Cas

Discovered on 2020 July 27 at unfiltered magnitude 12.9 by Stanislav Korotkiy in the course of the
New Milky Way Survey [1], Nova Cas 2020 was reported on the CBAT Transient Objects
Confirmation Page (TOCP) as TCP J00114297+6611190. It rose to a maximum V magnitude of 10.6
on August 10 before experiencing a series of flares as it faded slowly and erratically until December
2020. It then faded rapidly to below magnitude 20 and its B-V colour index became much redder. This
was attributed in ATel 14267 to the formation of optically thick dust in its ejecta. Because there was a
star 5 arcsec to the north and of similar brightness to the now very faint nova, it became difficult to
perform reliable photometry of the nova for several weeks. Eventually in March 2021 it started to
brighten, and I was able to begin measuring it again using a clear filter. It has continued to brighten
slowly and now appears to have reached a plateau at magnitude 16.3. V1391 Cas has been classified
spectroscopically in ATel 13905 as an Fe II type nova suffering from extensive interstellar reddening
with E(B-V) = 1.39. This explains the steep downward slope of the spectral continuum towards shorter
wavelengths.

                                                  10
                                                                                          Back to contents
Figure 1. Photometry and spectroscopy of V1391 Cas.
Nova Per 2020 = V1112 Per
Discovered by Seiji Ueda at unfiltered magnitude 10.6 on 2020 November 25 using a DSLR camera,
Nova Per 2020 was reported as TCP J04291884+4354232 on the TOCP. It rose to V magnitude 8.2
over the next 2 days and varied over a half magnitude range for 9 days before starting to fade slowly
reaching magnitude 11 on 2021 January 5. It then began a rapid decline coupled with a sharp
reddening of the B-V colour before eventually bottoming out at magnitude 16 around the middle of
February. This fade was confirmed in ATel 14338 as also being due to the formation of dust. The B-V
colour index recovered some 6 weeks later but the V magnitude only increased slowly and now
appears to have plateaued at V magnitude 14.3. V1112 Per was classified an Fe II type nova in ATel
14229 with interstellar extinction estimated in the range E(B-V) = 0.6 - 0.8.
11
Back to contentsFigure 2. Photometry and spectroscopy of V1112 Per.
Nova Cas 2021 = V1405 Cas
Nova Cas 2021 was discovered on 2021 March 18 by Yuji Nakamura with a CCD camera and 135
mm lens at unfiltered magnitude 9.6. It was reported on the TOCP as PNV J23244760+6111140 and
appears to be coincident with the known eclipsing variable CzeV3217 (according to ATel 14530 this is
possibly a nova-like variable misclassified as a W UMa-type binary). The nova rose rapidly to V
magnitude 7.5 two days later then faded slowly over 20 days to V magnitude 8.1 around April 7 before
starting to brighten again. This rise continued until it reached V magnitude 7.2 on May 5. Over this
period, the B-V colour index was gradually becoming redder. After May 5 it brightened more rapidly
with a further reddening in colour reaching V magnitude 5.3 five days later. It then started to fade
reaching 6.7 on May 15 and the colour became bluer again suggesting that there was still no
formation of dust. This is its current state at the time of writing. ATel 14577 reports the presence of Fe
II emission lines in the spectrum for the first time on April 6 on the basis of amateur spectra submitted
to the ARAS spectroscopic database, finally revealing V1405 Cas as another Fe II type nova. ATel
14476 reports reddening with E(B-V) = 0.55.
12
Back to contentsFigure 3. Photometry and spectroscopy of V1405 Cas.
References
[1] Sokolovsky K. et al. ASPC, 490, 395 (2014)
13
Back to contentsIs the supercycle period of ER UMa really increasing?
Stewart Bean
The evolution of the super-cycle period is reviewed from 1992 to the present epoch.
The conclusion is that as more data is obtained over a longer epoch the smaller the
rate of change of the supercycle period.
Introduction
Dwarf novae (DNe) are binary systems comprising a white dwarf with a companion star from which
matter is being drawn into an accretion disc. This flow of matter leads to temperature oscillations in
the accretion disc which in turn produce a series of brightening events known as normal outbursts.
When the disc radius grows to a certain size, the disc becomes unstable and a long duration
superoutburst, one magnitude brighter than normal outbursts, returns the disc to its initial state. The
sequence of normal outbursts followed by a superoutburst then repeats. The time between
superoutbursts is known as the super-cycle period P(sc). The Variable Star Index (VSX) (1) gives the
following definition for the UGER stars:
ER Ursae Majoris-type subclass of UGSU dwarf novae. These stars typically spend a third of their
time in super-outburst with a super-cycle of 20-90 days. Outside of super-outburst they typically pack
in a rapid succession of normal outbursts.
UGER stars therefore offer the opportunity to observe several superoutbursts per year and derive
P(sc) values. ER UMa itself has a super-cycle of approximately 45 to 60 days. The super-cycle
period, and its evolution, is considered one parameter that models of DNe evolution should describe.
M. Otulakowska-Hypka and A. Olech (2) present a collection of P(sc) results for some UGER stars,
including ER UMa and IX Dra (see VSSC 187). The authors suggest that the super-cycle period may
be increasing for most UGER stars. In this note, recent results for ER UMa, obtained using the
AAVSO database, the Variable Star Observers League in Japan (VSOLJ), Lasair (4) and ASAN-SN
(5) results are used to update the existing literature.
ER UMa has a brightness range of 12.4 to 15.2 and coordinates of RA 09 47 11 and Dec +51 54.08
according to VSX (1). The observing season starts in November and runs until June based upon the
reports to the AAVSO database.
ER UMa literature review
As part of a larger study of ER UMa type stars, M. Otulakowska-Hypka and A. Olech (2) averaged
individual ER UMa supercycle periods, extracted from AAVSO and other records, into five
measurements to produce the graph, reproduced from their paper, in Figure 1. This shows an
apparent increase in P(sc) for ER UMa from 43 days in 1994 to 51 days in 2010 which the authors
suggested was a trend for UGER stars as a whole. The daily rate of change of the supercycle period
−4
was estimated to be 12.7 ± 1.9 × 10 .
14
Back to contentsFigure 1. The super-cycle period for ER UMa from M.Otulakowska-Hypka and A. Olech (2) .
A more detailed analysis was then almost immediately published by Zemko et al (3) in 2013 using the
same databases and almost the same time period of 1992 to 2012. They avoided any averaging and
this article's Figure 2 shows a more complex behaviour taken from their Figure 6 . The first
supercycle dates from 1992 and the last from 2012 with E as the number of superoutbursts since JD
2448740. The different symbols refer to the number of normal outbursts between the superoutbursts
and can be ignored. The authors fitted a line to the data to derive an estimate for the daily rate of
-4
change of the supercycle period of 6.7 x 10 . This rate is approximately half that reported by
M.Otulakowska-Hypka and A. Olech using the same data. Zenko et al also commented that
“Supercycle lengths (Ts) appeared to change discontinuously and show oscillations superimposed on
a secular increasing trend.”
Figure 2. Variation of the supercycle lengths measured by a linear fitting of the O - C diagram. The
solid line shows the secular increasing trend. Taken from Figure 6 of Zemko et al (3).
15
Back to contentsAn updated analysis for ER UMa
An updated analysis has been made by extending the results of Zemko et al (3) using results from
the AAVSO, VSOLJ, Lasair and ASAS-SN sources to 2021 January. Observations have also been
undertaken by one of the AAVSOnet telescopes (BSM NM in New Mexico) under their observing
program number #163 which started in 2020 November. Observations by Beech, Coates, Henderson,
Hull, Johnson, Leyland, Miller, Pickard, Poyner, Poxon, Rock, Rodda, Walton and Withers from the
VSS have all contributed to the period covered by the updated results. The new supercycle period
graph is shown in Figure 3. The blue symbols represent the data presented by Zemko et al (3). The
black symbols are this author's interpretation of the more recent observations. Only those
superoutbursts whose start times were clearly recorded by the observations are included in the graph.
The behaviour over the last 50 cycles since 2012 continues to be unpredictable. The supercycle
period appears to be centred on a value of 50 days but with gradual changes, over about 10 cycles, to
extreme values of 42 and 61 days. If a linear line is fitted to all of the data (using OpenOffice
-4
spreadsheet tools) the daily rate of change of the supercycle period is 3.3 x 10 . This result is highly
dependent upon the range of data used. If the early data with supercycle periods of less than 45 days
is ignored, the linear fit becomes close to zero!
Figure 3. The updated graph of the supercycle period against cycle number following Zemko et al (3)
16
Back to contentsDiscussion
The new analysis extends the work of Zemko et al (3) by about 8 years and suggests the rate of
change of the supercycle period has halved compared to their result. The sensitivity of the result to
the starting point of the analysis suggests that the data set is not sufficient to distinguish whether the
supercycle period is either increasing gradually or is actually zero. The three analyses are
summarised below.
-4 M. Otulakowska-Hypka and A. Olech (2)
12.7 x 10
-4 Zemko et al (3)
6.70 x 10
-4 This analysis
3.30 x 10
This update shows that the rate of change of the super-cycle period for ER UMa is smaller than
reported by both of the earlier reports. The actual rate of change may even be zero, but the present
data covers too short a time period to be confident of such a conclusion. Only many years of
observations, led by the amateur community, can provide the extended data set that can shed further
light on the topic.
References
1: The International Variable Star Index (VSX) (aavso.org)
2: M. Otulakowska-Hypka and A. Olech, MNRAS 433, 1338–1343 (2013)
3: Zemko, P., Kato, T. and S. Yu. Shugarov, Publications of the Astronomical Society of Japan,
Volume 65, Issue 3, 25 June 2013, 54
4: Lasair, K. W. Smith, R. D. Williams et. al., Research Notes AAS,3,26 (2019).
5: ASAS-SN Sky Patrol
Acknowledgements
I acknowledge with thanks all of the BAA-VSS and AAVSO members who contributed observations.
17
Back to contentsMira Variables 2020 Part II
Shaun Albrighton
This report covers the activity of a further selection of Mira variables during 2020. All
estimates are visual, unless stated otherwise.
T Dra – Fade from 11.5 in Jan to Min of around 13.5 in May/June. Rise to 11.5 in Nov/Dec.
RU Her – At standstill near to mag 12 until late Feb, then rapid rise to bright Max, 7.5 in May. Fade to
13th mag by end of year. Below is a light curve of RU Her, covering the years 2016 – 2020 inc. A
hump/standstill is readily seen at around mag 12 on the last three ascending branches.
SS Her – No observations until Apr when at 12.6. Rise to Max near 8.5 in late May. Fade to Min 13.0
in late Jul, then rise to poorly observed Max, around 8.9 in early Sep. Fade to 10.7 by Oct. No further
observations.
SU Lac – Poorly observed. At Mag 15 (V Band) in Jan, then rise from 14.5 (Vis) to Max, 11.4 in Jul.
Fade to 13.8 Nov, with further fade to 15th mag (V Band) by end of year.
R Leo – Fade from near Max at approx. 5.8 in Jan to 11.0 in Jun., then lost. Recovered in Sep at 7.5.
Then rise to Max 5.8 in early Nov before fade to around mag 8 in Jan 2021. Below is a 5-year light
curve for R Leo, covering 2016-2020.
18
Back to contentsRS Leo – Poorly observed. Fade from possible Max 11.2 in early Mar to 13.7 in mid-May. Only two
further estimates during remainder of year.
R Lep – Poorly observed. Possible Max around 7.2 in Dec.
W Lyn – Poorly observed. Fade from Max 10.5 in Dec 2019 to Min of 15.8 in Apr. Rise to 13.5 in May,
then lost. Recovered at/near Max of 10.3 in Sep, then fade to 13.3 (V Band) in Dec.
X Lyn – Poorly observed. Rise in V Band from 15.2 in Jan to Max 9.8 in Apr. Visual observations near
max agree closely with V Band results. Lost in Jun, with only two sightings during remainder of year,
13.8 Sep, and 15.6 (V Band) Dec.
X Oph – At Max 6.9 at start of year. Fade to long flat Min 8.4 from May to late Jul. Rise to 6.6 in Nov,
with slight fade to 7.0 by end of year.
U Ori – Rise from 13.2 to Max 7.5 in early May, then lost. Recovered in Sep, around 10.2, before fade
to bright Min of approx. 12.3 in Dec 2020/Jan 2021.
R Ser – Rise from Min, 13.2 in Jan to Max 6.0/6.3 in May. Fade to mag 13 by end of the year. A 5-
year light curve (2016-2020 inc.) is shown below.
19
Back to contentsR Tri – Fade from 7.5 towards Min, 11.6 in Mar, when lost. Recovered at/near Max, approx. mag 6.0
in late Jul. Fade to Min, 11.0 (V Band), 11.4 (visual) in Dec. A five year light curve is shown below.
R UMa – At Max 7.3 in Jan, then fade to poorly observed Min, approx. 12.8 in Jun. Second Max
approx., 7.9 Oct/early Nov. Fade to 9.5 by end of year.
S UMa – Large scatter. Rise from mag 9 in Jan to Max mag 8 in Mar. Sharp fade to 11.8 in Jul.
Second Max observed in Sep/Oct around 8.5, fade to 10.9 by end of year.
T UMa – Well observed. Rise from 12th mag in Jan to fainter Max, 7.8, in Apr. Fade to Min,12.5 in
Sep. Rise to brighter Max 6.7 in late Nov/Early Dec. A five year light curve is shown below.
S UMi – Max 8.2 (V Band) in Feb, then fade to 11.3 by end of Jun. A second broader Max was
observed in Dec, 8.4 (vis), 8.1 (V Band).
R Vul – Very poorly observed. Max at 6.8 observed in Jan.
20
Back to contentsA shallow minimum of Betelgeuse in April 2021 in agreement with the
recent 430 day period
Mark Kidger
ESA/ESAC
Predictions based on recent behaviour of Betelgeuse led to the speculative suggestion that a
new minimum to magnitude +1.0 approximately should occur around 2021 April 12, with a
possible error of around ±10 days. Photoelectric photometry and visual estimates show a
minimum to magnitude +0.9 on 2021 April 23±5, in reasonable agreement with predictions. A
new study supports the core-collapse supernova end-of-life model for Betelgeuse, but
suggests that it is much further from supernova explosion than previously assumed.
Interest in Betelgeuse remains high. No fewer than 6061 visual estimates have been submitted to the
AAVSO database since the start of 2019 (3880 for the 2019/20 observing season, 1716 for 2020/21,
compared to an average of 780 for the ten years prior to 2019 and an average of 320 per year over
the full 125 years of lightcurve coverage). This interest has provoked numerous recent studies of the
star. For example, Joyce et al. (2020, ApJ, 902, 63) added nine years of high-accuracy photometric
data from the Solar Mass Ejection Imager (SMEI) instrument aboard the Coriolis satellite, obtained
from 2003-2011 to the AAVSO record since 1928. They find a pulsation period of 416±24d and a long
secondary period 2365±10d (6.48 years), although they note that neither strictly cyclic. When these
periods were removed from the lightcurve, a further pulsation period of 185.5±0.1d remains in the
modern, photometric data. Such excited oscillation modes take as long as 150 years to build up in a
star of 19 Solar Masses, around the suggested current mass of Betelgeuse.
They also suggest that there are suggestions of a 35-40 year dimming cycle in the full lightcurve,
similar to the estimated rotation period of 35 years. From a combination of datasets with multiple
simulations of evolution and oscillations, they concluded that the distance of Betelgeuse is 548 light
years, with a range of uncertainty from 499-634 light years, similar to the “traditional” value for the
distance and smaller than recent determinations from radio data. Finally, they conclude from the
pulsation periods in the lightcurve that the mass of Betelgeuse is in the range from 16.9-19 Solar
Masses and that it is early in the helium-burning phase, rather than half-way through, or late in it, as
has been assumed typically previously. Betelgeuse is heading for a death as a Type IIp supernova,
but maybe not for another half a million years.
Joyce et al. (2020) find that the low amplitude variability of Betelgeuse is due to a combination of
short-lived pulsation modes and the effects of giant convection cells in the photosphere. However,
deep minima, such as that of 2020, require other causes, such as dimming by dust clouds. Among the
more intriguing suggestions is the conclusion that the high measured rotational velocity of Betelgeuse
(15km/s) giving a rotation period of 31±8 years (Kervella et al. 2018, A&A, 609, A67) is extremely
difficult to account for by standard stellar evolution models. Wheeler et al. (2016, MNRAS, 465, 2564)
had suggested that the star absorbed a 1 Solar Mass companion as it expanded, leading to spin-up of
the rotation of the primary. Chatzopoulos et al. (2020, ApJ, 896, 50) examined this and concluded that
a merger with a 1-4 Solar Mass companion would explain the fast rotation; they also suggest that the
runaway nature of Betelgeuse requires the binary to have been ejected from the parent cluster where
it formed some millions of years ago and to have merged with its companion after ejection.
Based on the 430 day period (Guinan, Wasatonic & Calderwood, 2020, ATel#13365) and the timing of
the 2020 minimum, a prediction was made that a new minimum would occur in early April 2021 (Dupree,
21
Back to contentsGuinan & Thompson, 2020, ATel#13901). However, this was predicted to be a shallower event than
the great minimum of 2020, expected to reach magnitude +1.0.
Photometry from the STEREO satellite (Dupree, Guinan & Thompson, 2020, ATel#13901) and
photoelectric photometry reported to AAVSO, some of it taken in daylight, shows a fade down to
magnitude +1.0 in mid-August 2020, although Betelgeuse had recovered to +0.75 a week and a half
later, with the rise missed in an inconvenient gap in data. From late August to the end of October the
magnitude oscillated over a small range from +0.60 to +0.82. A systematic fade started in mid-
February, with a rate of 0.026 magnitudes/week, reaching a flat minimum of +0.88 around April 23 rd,
after which, the very scarce data suggests that a recovery has started (Figure 1).
Figure 1: Three day means of photoelectric photometry in V reported to AAVSO from 2019 January
01 to date. A small minimum is seen at 2021 April 23±5 days, but the contrast with the Great Minimum
of 2020 is stark.
The apparent date of minimum is in good agreement with the predictions of the 430 day pulsational
model, although once again showing that the periodicity is only approximate. This is also consistent
with the findings of Joyce et al. (2020, ApJ, 902, 63) who find that the mean period since 1998 is
416±24d whereas, if it were an exact period, we would expect it to be very strongly constrained after
32 years of observation.
Did visual observers detect this predicted April 2021 minimum? A range of 0.3 magnitudes is
generally thought to be below the level of visual detectability. The raw lightcurve is, predictably, noisy
(Figure 2). There is a hint of a fade, in early 2021, but it is far from clearly above the noise. We see
also that in early April 2021, when the mean was magnitude +0.8, magnitudes as faint as +1.5 and as
bright as +0.1 were being reported.
22
Back to contentsFigure 2: The raw AAVSO visual lightcurve for the same range of dates as Figure 1. There is a hint of
a turn-down, but it is far from obvious in the data. Note that some observers are giving magnitudes as
faint as +1.5 and as bright as +0.1 when the mean was +0.7.
However, if we take 3-days means of the visual estimates (Figure 3) the fade in early 2021 is obvious
and even the small November dip seen in the photoelectric data seems to be present. The very large
quantity of estimates does seem to allow relatively low-amplitude variations to be distinguished,
following the well-known “gobstopper theorem”, whereby if a large number of people estimate the
number of sweets (or gobstoppers) in a jar, while the individual estimates will show a large range of
variation, the mean of the estimates will be close to the correct number.
Figure 3: 3-days means of the AAVSO visual data from Figure 2. The fade to the April 2021 minimum
is seen clearly in the data.
Conclusions
A lightcurve minimum of approximately the time and of the depth predicted from the 430d period is
duly observed in the lightcurve of Betelgeuse. This is consistent with models of Betelgeuse as a star
of approximately 18 Solar Masses that is in an early phase of helium burning and generating semi-
stable pulsational modes. While the low-amplitude variations are due to a mix of pulsations and of
variations caused by convection cells, there is even some evidence of rotational modulation of the
lightcurve with a period of 30-35 years, while the deep minimum seen in 2020 is still, most likely, due
to dust absorption, although some authorities dissent from this view and suggest other models such
as superstarspots.
23
Back to contentseta Geminorum and VZ Cancri
Tracie Louise Heywood
My visual observations of the autumn 2020 eclipse of eta Geminorum, and VZ Cnc: A delta
Scuti type variable that can be followed using binoculars.
eta Gem is usually quoted as having a magnitude range of about 3.0-4.0. Half of this range is due to
semi-regular variations with a period of about 233 days. The other half is due to eclipses that occur
approx. every 2984 days
(8.17 years). Based on
observations of previous
eclipses, I was expecting mid-
eclipse to occur around late
November 2020. Totality
normally lasts for about a
month, but the presence of
the semi-regular variations
can make it difficult to be
certain as to the duration of
the partial phase.
Looking at my light curve,
which includes naked eye
and 10x50 binocular
estimates, it seems likely that mid-eclipse actually occurred in early November. The star was most
likely fading into a semi-regular minimum when it emerged from August's morning twilight, but my best
guess would be that that partial phase started in late August and that after totality the partial phase
lasted until mid-January.
VZ Cancri is a delta Scuti type variable. Most stars of this type have brightness ranges that are too
small to be followed accurately using visual observations. VZ Cancri is a notable (and welcome)
exception, having a range of
0.7 magnitudes and a period
of approx. 4.3 hours. The
light curve shows my
observations, using 11x80
binoculars, during the
evening of 2021 April 6th.
Observations ended when
the star disappeared behind
my neighbour's house!
24
Back to contentsV572 Cam: Period calculation from a single cycle, preliminary analysis
Geoff Chaplin
High frequency CCD data for HADS variable V572 Cam obtained on a single night is used to
calculate the period. Analysis of many data sets then gives an indication of possible variation.
A description of further research, and what further data is required, is included.
This note examines high frequency observations of the HADS variable V572 Cam (GSC 4556-1113)
made by the author on 2 May, 15 Jun, 11 Jul, 9 Oct, 5 Nov, 5 Dec 2020, and 26 Feb 2021 using T21
on the iTelescope network (43cm CDK with FLI-PL6303E camera, 2000m elevation in New Mexico),
and by D W G Smith on 2 Mar and 5 Apr 2020 using a C11 telescope with Atik 460EX camera based
in the UK. The T21 observations have a reported average accuracy of 0.003mag, and the C11 0.010
mag.
Observations are mostly made at a constant time cadence (1 minute exposure, plus time to download
data etc giving 1.375 minutes in the case of Chaplin, shorter for Smith) with occasional long gaps (up
to several minutes) when the telescope drive is resetting. Different equipment set-up, as well as
different exposure times, can give rise to a different time difference.
Several methods were used to reduce the data noise before analysis. Figure 1 shows data and a 9-
point centred moving average (CMA). A 7 point CMA, and also a non-parametric curve using singular
spectrum analysis (SSA) were also used with essentially the same results throughout. Both methods
required some preliminary data manipulation: for CMA the occasional gap was filled by linear
interpolation, and SSA required data at constant time differences, again obtained by linear
interpolation.
Figure 1: V572 Cam, 6 Nov 2020
25
Back to contentsThe star is known to be a binary – the abstract to the paper by Wils et. al. (IAU Inform. Bull. Var. Stars,
6049, 1 (2013/February-0), “Photometry of high-amplitude delta Scuti stars in 2012.”) says “The
binary nature of GSC 4556-1113 has been confirmed” referring to a 164 day period companion,
however period variation arising from the binary nature will not be apparent during a single night’s
observations.
Apart from the obvious roughly 0.4 mag variability, there appears to be more short-term variability at
the fainter magnitude and looking closely at the falling brightness [=rising magnitude] phase there is at
least a hint of several steps down, one step sideways. Figure 2 below shows some data from 15 Jun
2020 of the rising magnitude phase and this pattern appears more evident. This and similar noise in
the data cause slight high-frequency variation in a smoothed curve which persists when we calculate
the period below.
Figure 2:
Figure 3 below shows the data and curve used for Smith’s observations on 2 Mar 2020. In this case
the time difference between observations is approximately 0.75 minutes and the curve is defined at
these time steps.
26
Back to contentsFigure 3: V572 Cam 2 Mar 2020
To calculate the period, we adopt the following procedure. For a rising leg, for each point on the curve
we search for the corresponding point [same magnitude] on the following rising leg (which generally
requires interpolation between two points at which the curve is defined). A similar procedure is
followed for a falling leg. This generates – depending on the smoothing method and observation
frequency – between 23 and 90 values for the period in cases where a complete rise or fall are
observed. The mean and the standard deviation of these observations is then calculated and shown
in table 1.
date Period (minutes) stDev leg
6 Nov 2020 123.86 0.52 rising
123.97 1.62 falling
6 Dec 2020 124.39 0.28 falling
124.09 0.40 rising
3 May 2020 124.70 0.69 rising
2 Mar 2020 124.73 0.69 rising
123.88 0.57 falling
5 Apr 2020 127.64 1.79 rising
124.20 1.43 falling
Table 1:
27
Back to contentsBased on these figures there is no significant difference between the periods in these legs and dates.
All of these period observation were then amalgamated into a single file one for each observer.
Outliers were generally in clusters and were removed and the period recalculated – this gave a period
of 124.13 minutes (2 hours 4 minutes 8s) with a standard deviation of 26s – close to the AAVSO
quoted period of 2h 4m 20s.
Available data comprises 116 high-frequency CCD series of observations of which about 25 cover
more than a full period. These were analysed by the same processes described above and the mean
and standard deviations of the periods are shown in Figure 4 below.
Figure 4: Mean and standard deviation of periods based on a single night’s data
The results suggest – but with low confidence – a tendency for the period to shorten or be periodic in
the longer term but with short-term variations.
Further research will cover improvement to the noise reduction process and refinements to the
interpolation method, but we will also analyse differences between magnitudes recorded on different
nights. Different observers with different equipment, comparison stars and reduction software lead to
surprisingly large differences in magnitude level and in the range of variability (which at least in part
can be corrected by shifting and stretching data) both of which will add uncertainty to final results.
However, if comparable sets of observations are, say 30 days apart, this amounts to 360 periods and
assuming the period is actually constant over the interval this should lead to a dramatic reduction in
standard error – to below a few seconds. Period variation would then become more apparent but is
hampered by the clumping of observations over time. Regular – monthly observation – would be
ideal, and the star is circumpolar so well placed to observe round the year and without moonlight
interference.
The author wishes to thank Patrick Wils for very helpful comments on an earlier version of this paper,
and for copies of relevant research material.
28
Back to contentsEclipsing Binary News
Des Loughney
Krakow Atlas of O-C Diagrams
The Mount Suhora Observatory have made the following statement on their website.
“The Atlas of O-C Diagrams has been superseded by newer data available online at
http://www.as.up.krakow.pl/ephem. The books are no longer available, and this online version is kept
for historical reference only. Please use the new data in any research.”
Recent minima of various Eclipsing Binary stars from Tony Vale
Timings of minima of various eclipsing binaries are presented here. These were derived from
observations made by Tony Vale from February to April 2021 using a Startravel 102mm Skywatcher
refractor telescope and a Canon 600D DSLR camera. The observations have all been posted to the
BAAVSS photometric database. Precise times of minima were obtained from the light curves using
Bob Nelson’s Minima software. All times listed are Heliocentric Julian Day.
Timings:
Star HJD of Min Filter Error Type of Minimum
AD And 2459258.35579 TG 0.00122 Secondary
CD Cam 2459264.35862 TG 0.00123 Primary
SV Cam 2459272.40012 TG 0.00025 Primary
AW Uma 2459281.37996 TG 0.00095 Primary
SV Cam 2459291.37768 TG 0.00109 Primary
RS Cvn 2459303.54428 TG 0.00043 Primary
TU Boo 2459308.49690 TG 0.00089 Primary
AG Vir 2459310.43684 TG 0.00017 Primary
AI Dra 2459317.42285 TG 0.00022 Primary
TZ Boo 2459327.45799 TG 0.00022 Primary
References:
Software by Bob Nelson – Variable Stars South
29
Back to contentsHere is an illustration of the work Tony is doing using DSLR photometry with a 4”refractor and a
Canon 600D camera. He has constructed a light curve of RS CVN which illustrates very well a
primary eclipse. It is perhaps worth noting that the light curve shows no evidence of the starspots on
the magnetically active secondary that are a feature of the RS CVN class of eclipsing binaries. The
eclipse took place on the 29th/30th March 2021.
The camera was set to an ISO 100 and an exposure time of 50s. 460 raw images with these settings
were obtained. IRIS software was used to reduce these images and to stack them in groups of 12.
Each datapoint therefore represents 10 mins of integration time. AstroimageJ was used to perform
photometry.
VW Cephei
Starting in April 2021 I have been studying VW Cep. It is an easy system to study as it is bright, is
near Polaris and is visible all year round. It is always high up. This is an EW/KW system which is on
our observing list of Low Amplitude Eclipsing Binaries. It is a suitable target for DSLR photometry. It
varies from 7.38 to 7.78 magnitude. On our list it is described as having a period of 0.2783089 days.
However, in constructing my phase diagram I used the latest Krakow period which is 0.2783094 days.
As an EW system it can be observed at any time. It varies quickly going through its whole cycle in
6.67 hours. The Canon 550D settings were ISO 800, exposure 5 seconds. 20 images were taken for
each point on the phase
diagram. The images were
stacked and analysed with
AIP4WIN. I used three
comparisons which were
HIP 100504 (7.79
magnitude), HIP 101824
(7.07 magnitude) and HIP
102982 (7.26 magnitude).
On the phase diagram
below the vertical axis is V
magnitude and the
horizontal axis is the phase.
The measurements were
obtained between 15th and
21st of April 2021.
30
Back to contentsI have referred to the 2018 paper written by T.Mitnyan et al which is entitled ‘The contact binary VW
Cephei revisited: surface activity and period variation’ (1). This paper indicates that measurements of
the system can show asymmetry in the light curve. On page one of the paper, it states:
“A lot of contact binaries show asymmetry in the light curve maxima (O’Connell effect), which is likely
caused by starspots on the surface of the components as a manifestation of the magnetic activity.
The difference between the maxima can change from orbit to orbit because of the motion and
evolution of these cooler active regions. This phenomenon may indicate the presence of an activity
cycle similarly to what can be seen on our Sun.”
The measurements can contribute to studies of period variation which is referred to on page 10 of the
paper:
“Nevertheless, the available data suggest that mass transfer from the more massive primary to the
less massive secondary star (with a slowly decreasing mass transfer rate) is the most probable
explanation of the observed period variation of VW Cep.”
My studies of this system will continue with a goal, later on in the year, of measuring a whole cycle in
one night.
Reference:
(1) The contact binary VW Cephei revisited: surface activity and period variation. T. Mitnyan et al
Three for the price of one
David Conner
Three variable stars in Leo fall within one field of view of my camera; UV, UZ and IN
Leonis. These are the results from a number of observing runs during April 2021.
April 2021 had several clear nights which I used to make observations of the eclipsing binaries UV
Leonis and UZ Leonis, hoping to generate complete phase diagrams. These objects are less than a
degree apart and both will fit into the same field of view of my set-up (Atik Titan camera with 50mm
aperture ~f4 objective lens). As an added bonus, the RS type variable star IN Leonis is also in the
field of view. All observations used in this article were made without a filter.
The combined light curves appear below (UV top, UZ middle, IN bottom), with black being the night of
April 3-4, red April 6-7, blue April 14-15, purple April 18-19.
31
Back to contentsThe resulting phase diagrams of the UV Leo and UZ Leo systems are below.
32
Back to contentsThere are gaps in the phase diagrams of UV and UZ, but when combined with historic observations
from Somerby and the Bradford Robotic Telescope Cluster Camera (BRT) then more complete phase
diagrams are possible.
Given the short time over which the observations were made, the inequalities of the minima and
maxima on different nights are quite possibly due to observational/photometry issues of some kind.
More observations and further analysis needed.
33
Back to contentsTimes of minima obtained from these observations, using Peranso/ANOVA, are as follows.
Star HJD of Filter Error Type of
minimum minimum
UV Leo 2459308.42353 CV 0.00005 Secondary
UV Leo 2459311.42411 CV 0.00005 Secondary
UZ Leo 2459319.42586 CV 0.00009 Secondary
UV Leo 2459319.52475 CV 0.00007 Primary
UV Leo 2459323.42589 CV 0.00006 Secondary
UZ Leo 2459323.44466 CV 0.00006 Primary
The field star IN Leonis is catalogued as an RS type variable (i.e. non-eclipsing, as opposed to, e.g.,
EA/RS type) with a period of 6.217 days (GCVS, AAVSO VSX accessed 2021 May 13). This is a little
fainter than both UV and UZ, and the exposures are not ideal for this star. As before, black is the
night of April 3-4, red April 6-7, blue April 14-15, purple April 18-19.
Adding photometry from Bradford Robotic Telescope Cluster Camera images of UV Leo and UZ Leo
(2014 January 1 to 2014 June 28, in magenta) generated the following light curve and phase diagram.
34
Back to contentsIt will be seen that the BRT data generates a moderately symmetrical phase diagram, but the April
2021 observations are not a good fit to this, particularly those of April 14-15 and 18-19. As well as
possible observational ‘glitches’, this could be due to chromospheric and/or spot activity within the
system, together with nonsynchronous rotation of one or both components (op cit).
A slightly improved fit can be obtained by using a period of 12.434d, i.e. double the catalogue period,
as below. This generates two minima per cycle of different depths. Additionally, with this data at
least, the two maxima are also different magnitudes, consistent with spots and/or chromospheric
activity within the system.
35
Back to contentsEA/RS type variables do have phase diagrams with these characteristics, e.g. Conner (2018) and Li-
yun Zhang and Sheng-hong Gu (2007).
Whether or not eclipses occur in this particular system is another matter, and this feature of the phase
diagram could simply be an artefact due to gaps in the data at the relevant phases of 0.25 and 0.5 for
a period of 12.434 days.
It should be noted that a similar exercise using ASAS data does not generate minima of alternating
depths, or maxima of alternating heights, using either of the two periods (6.217d and 12.434d). [The
link allows you to plot phase diagrams of ASAS data with selected periods. It can also be accessed
via AAVSO VSX website – select ASAS Light Curve in the External Links ‘Location’ box.]
This system would benefit from more observations and analysis, and has now been added to my
ongoing COAST observing program with optimised exposures using a V filter.
More information about these and other observations can be found on my website.
36
Back to contentsFollow up observations of
GSC 03421-01402 aka UCAC4 709-047369
James Screech
This article describes the process followed to determine the period of the recently discovered
eclipsing binary star UCAC4 709-047369 (GSC 03421-01402). The observations used were the
work of Walter F. (Štefánik Observatory, Prague, Czech Republic) and the author.
Having reported on the discovery of GSC 03421-01402 as an EA eclipsing binary in the March 2020
edition of the circulars, this is a follow-on report on an investigation and subsequent discovery of its
period.
The initial minimum was discovered timed at approximately 2458847.39 (the evening of 29 th
December 2019) see figure 1. Further observations during the 2019-20 observation window failed to
discover any further minimum, however during the next window a second minima was discovered at
2459208.35 figure 2 (the evening of 24th December 2020). The time between minima being 360.96
days, thus the period must be this or a sub-multiple of this time. A computer application was written by
the author to help determine the period by discounting possible sub-multiples of 360.96 days by the
use of negative observations.
Then while searching the internet I came across observations of this star by 1Walter F. (Štefánik
Observatory, Prague, Czech Republic) showing a possible minimum at 2458532.52 figure 3. When
this timing was added to my period finder application together with my first minimum and negative
observations the possible periods (in days) were determined are listed in table 1. My own observed
minima gave the possible periods shown in table 2.
When the two tables are cross referenced the best matching periods are 7.6798 & 7.6800 days, a
difference of about 17 seconds. Using a period of 7.68 days I made a prediction that there would be
an observable minimum at approximately 2459323.55, a few days in the future and the weather
forecast was looking promising for once. Observations were made at the appropriate time and
another minimum found at the predicted time, figure 4.
When this timing was combined with my second minimum the possible periods calculated is shown in
table 3, again the only close period is 7.6797 days.
In conclusion I believe that this proves that the period of this eclipsing binary is approximately 7.68
days. Figure 5 shows a phase diagram of all my observations plotted with this period. Although there
are several gaps, where no observations have been obtained and a few outliers (possibly due to
cloud) the observations fit this period well. The minima’s observed are all of a similar depth (0.15m)
and as there is no sign of a second minimum it looks like these are observations of primary eclipses
and that the system may not have secondary eclipses, or they are of very small brightness reduction.
However, it is possible that a second eclipse could be hidden in the missing gaps in the phase
diagram if the star’s orbit is non-circular.
1
Walter F. (Štefánik Observatory, Prague, Czech Republic)
http://var2.astro.cz/EN/obslog.php?obs_id=1305470210&projekt=%25&star=GSC%2003421-
01402%20Lyn&lang=en&shv=Lyn
37
Back to contentsYou can also read