Detection of Spatiotemporal Clusters of COVID-19-Associated Symptoms and Prevention Using a Participatory Surveillance App: Protocol for the ...
←
→
Page content transcription
If your browser does not render page correctly, please read the page content below
JMIR RESEARCH PROTOCOLS                                                                                                                De Ridder et al

     Protocol

     Detection of Spatiotemporal Clusters of COVID-19–Associated
     Symptoms and Prevention Using a Participatory Surveillance App:
     Protocol for the @choum Study

     David De Ridder1,2,3,4*, PhD; Andrea Jutta Loizeau1,2*, PhD; José Luis Sandoval3,5, MD, PhD; Frédéric Ehrler6, PhD;
     Myriam Perrier6, MSc; Albert Ritch6, MSc; Guillemette Violot7, MSc; Marc Santolini8, PhD; Bastian Greshake
     Tzovaras8, PhD; Silvia Stringhini1,2, PhD; Laurent Kaiser2,9,10, MD, PhD; Jean-François Pradeau6, MSc; Stéphane
     Joost3,4, PhD; Idris Guessous1,2,3,4, MD, PhD
     1
      Division of Primary Care, Geneva University Hospitals, Geneva, Switzerland
     2
      Department of Health and Community Medicine, Faculty of Medicine, University of Geneva, Geneva, Switzerland
     3
      Group of Geographic Information Research and Analysis in Population Health, Geneva University Hospitals, Geneva, Switzerland
     4
      Laboratory of Geographic Information Systems, School of Architecture, Civil and Environmental Engineering, Swiss Federal Institute of Technology
     Lausanne, Lausanne, Switzerland
     5
      Department of Oncology, Geneva University Hospitals, Geneva, Switzerland
     6
      Direction of Information Systems, Geneva University Hospitals, Geneva, Switzerland
     7
      Communication Directorate, Geneva University Hospitals, Geneva, Switzerland
     8
      Center for Research and Interdisciplinarity, INSERM U1284, University of Paris, Paris, France
     9
      Division of Infectious Disease and Laboratory of Virology, Geneva University Hospitals, Geneva, Switzerland
     10
          Center for Emerging Viral Diseases, Geneva University Hospitals, Geneva, Switzerland
     *
      these authors contributed equally

     Corresponding Author:
     Idris Guessous, MD, PhD
     Division of Primary Care
     Geneva University Hospitals
     4 Rue Gabrielle-Perret-Gentil
     Geneva, 1205
     Switzerland
     Phone: 41 22 305 58 61
     Email: Idris.Guessous@hcuge.ch

     Abstract
     Background: The early detection of clusters of infectious diseases such as the SARS-CoV-2–related COVID-19 disease can
     promote timely testing recommendation compliance and help to prevent disease outbreaks. Prior research revealed the potential
     of COVID-19 participatory syndromic surveillance systems to complement traditional surveillance systems. However, most
     existing systems did not integrate geographic information at a local scale, which could improve the management of the SARS-CoV-2
     pandemic.
     Objective: The aim of this study is to detect active and emerging spatiotemporal clusters of COVID-19–associated symptoms,
     and to examine (a posteriori) the association between the clusters’ characteristics and sociodemographic and environmental
     determinants.
     Methods: This report presents the methodology and development of the @choum (English: “achoo”) study, evaluating an
     epidemiological digital surveillance tool to detect and prevent clusters of individuals (target sample size, N=5000), aged 18 years
     or above, with COVID-19–associated symptoms living and/or working in the canton of Geneva, Switzerland. The tool is a
     5-minute survey integrated into a free and secure mobile app (CoronApp-HUG). Participants are enrolled through a comprehensive
     communication campaign conducted throughout the 12-month data collection phase. Participants register to the tool by providing
     electronic informed consent and nonsensitive information (gender, age, geographically masked addresses). Symptomatic participants
     can then report COVID-19–associated symptoms at their onset (eg, symptoms type, test date) by tapping on the @choum button.
     Those who have not yet been tested are offered the possibility to be informed on their cluster status (information returned by

     https://www.researchprotocols.org/2021/10/e30444                                                      JMIR Res Protoc 2021 | vol. 10 | iss. 10 | e30444 | p. 1
                                                                                                                       (page number not for citation purposes)
XSL• FO
RenderX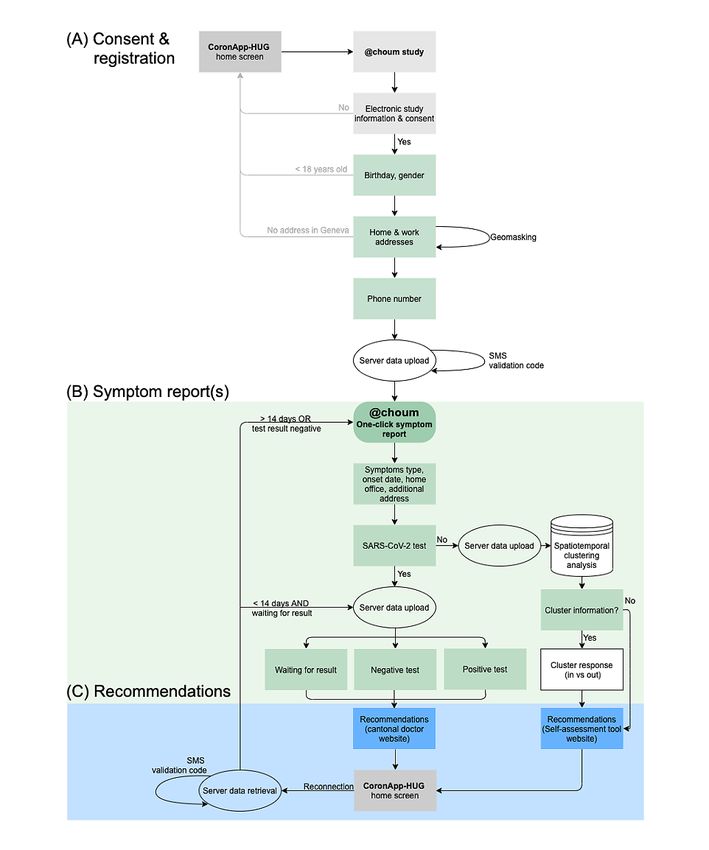
JMIR RESEARCH PROTOCOLS                                                                                                         De Ridder et al

     daily automated clustering analysis). At each participation step, participants are redirected to the official COVID-19
     recommendations websites. Geospatial clustering analyses are performed using the modified space-time density-based spatial
     clustering of applications with noise (MST-DBSCAN) algorithm.
     Results: The study began on September 1, 2020, and will be completed on February 28, 2022. Multiple tests performed at
     various time points throughout the 5-month preparation phase have helped to improve the tool’s user experience and the accuracy
     of the clustering analyses. A 1-month pilot study performed among 38 pharmacists working in 7 Geneva-based pharmacies
     confirmed the proper functioning of the tool. Since the tool’s launch to the entire population of Geneva on February 11, 2021,
     data are being collected and clusters are being carefully monitored. The primary study outcomes are expected to be published in
     mid-2022.
     Conclusions: The @choum study evaluates an innovative participatory epidemiological digital surveillance tool to detect and
     prevent clusters of COVID-19–associated symptoms. @choum collects precise geographic information while protecting the user’s
     privacy by using geomasking methods. By providing an evidence base to inform citizens and local authorities on areas potentially
     facing a high COVID-19 burden, the tool supports the targeted allocation of public health resources and promotes testing.
     International Registered Report Identifier (IRRID): DERR1-10.2196/30444

     (JMIR Res Protoc 2021;10(10):e30444) doi: 10.2196/30444

     KEYWORDS
     participatory surveillance; infectious disease; COVID-19; SARS-CoV-2; space-time clustering; digital health; mobile app;
     mHealth; epidemiology; surveillance; digital surveillance; public health

                                                                           emphasized the importance of rapid prospective spatiotemporal
     Introduction                                                          epidemiological surveillance, which can help prioritize locations
     Background                                                            for targeted interventions, rapid testing, and resource allocation
                                                                           [7,19-22]. Despite this opportunity, individuals may be reluctant
     Since 2020, many countries worldwide, including Switzerland,          to report exact addresses together with symptoms owing to
     have experienced multiple fluctuations of SARS-CoV-2                  security and privacy concerns [23,24]. Therefore, such
     transmission associated with cycles of increased followed by          participatory surveillance systems must be developed in a way
     relaxed measures [1,2]. These cycles will remain until                that minimizes the risks and best guarantees the individuals’
     appropriate immunization levels through natural infection or          rights to privacy.
     vaccination are achieved [3]. There is growing concern that
     adherence to public health recommendations, including                 The @choum (English: “achoo”) study proposes a digital
     SARS-CoV-2 testing, is declining (ie, testing fatigue) [4,5].         participatory epidemiological surveillance tool using precise
     Thus, it is essential to define alternative strategies to encourage   space-time data to monitor COVID-19–associated symptoms
     timely testing, recommendation compliance, and monitor spread         at their onset in the canton of Geneva, Switzerland. The
     of the virus.                                                         @choum tool is a 5-minute survey that profits from being
                                                                           integrated into a free and secure preexisting app for COVID-19
     Traditional disease surveillance systems, relying on                  resources and information developed by the University Hospitals
     SARS-CoV-2 cases confirmed by real-time polymerase chain              of Geneva (HUG). Upon registration to @choum, participants
     reaction (RT-PCR) or antigenic tests, suffer from underreporting      can report COVID-19–associated symptoms at their onset by
     and a delay of notification due to the time between the onset of      tapping on the @choum button visible on the home screen. They
     symptoms and case declaration [6]. There is a need for                are then redirected to the official COVID-19 recommendations
     alternative sources of information complementing the traditional      websites. This study provides an innovative combination of best
     COVID-19 surveillance systems [7,8]. The use of collaborative         practices in participatory surveillance and spatiotemporal
     information through participatory surveillance, facilitated by        epidemiology. This report describes the rationale and
     mobile phone apps and web-based tools, offers a quick way to          methodology of the @choum study, and presents the
     collect data at a population scale and disseminate critical           development procedure of the @choum digital tool, which has
     information [9]. Participatory syndromic surveillance systems         been publicly available since February 11, 2021.
     have shown promising results for several public health events
     [10,11], and many have already been described since the start         Objectives
     of the COVID-19 pandemic [9,12-16]. However, most apps                The specific study objectives are as follows: (1) to prospectively
     require users to report health information daily or weekly, which     detect active and emerging spatiotemporal clusters of reported
     could increase dropout rates. Moreover, only a few apps have          COVID-19–associated symptoms by running a daily automated
     been configured to collect geographic information at high             spatiotemporal cluster detection algorithm; and (2) to
     resolution [12,15,16]. Increased knowledge about the potential        retrospectively analyze the outbreaks detected over the 12-month
     risk of infection at a local scale (ie, precise geographic            data collection phase, and examine the association of outbreak
     coordinates associated with a specific date) can play an essential    characteristics with sociodemographic and environmental
     role for residents and local authorities [17] who lack information    factors.
     to make appropriate decisions [18]. Several studies have

     https://www.researchprotocols.org/2021/10/e30444                                               JMIR Res Protoc 2021 | vol. 10 | iss. 10 | e30444 | p. 2
                                                                                                                (page number not for citation purposes)
XSL• FO
RenderX
JMIR RESEARCH PROTOCOLS De Ridder et al
Study Preparation
Methods
A 5-month preparation phase, starting on September 1, 2020,
Study Design has preceded the 12-month data collection phase. The
The @choum study evaluates a digital participatory development milestones included: (1) frontend development
epidemiological surveillance tool to detect and prevent (content, design, and branching logic); (2) backend development
spatiotemporal clusters of individuals, aged 18 years or above, (database); (3) spatiotemporal clustering analysis
with COVID-19–associated symptoms living and/or working implementation and testing; (4) data exchange between the app,
in the canton of Geneva, Switzerland. Its design integrates both server, and Python script running daily clustering analyses; and
prospective and retrospective analytical features. The study (5) complete security assessment. Following an iterative process,
began on September 1, 2020, and will be completed on February the tool’s content was reviewed and refined by experts in
28, 2022. infectious disease, epidemiological research, citizen science,
health communication, and app design. Multiple technical and
Setting and Governance Team analytical tests have been performed at various development
This study takes place in the canton of Geneva. It is carried out stages of the tool in preproduction and production modes.
by an interdisciplinary team based at the HUG in close A 1-month pilot phase was performed among 38 pharmacists
collaboration with experts from the University of Geneva working in seven pharmacies located in the canton of Geneva
(UNIGE), the Swiss Federal Institute of Technology Lausanne before the study launch. The pharmacists were asked to follow
(EPFL), and the University of Paris (UP). The different expected app utilization scenarios (eg, reporting either a positive
components of the study have been distributed across the or negative test result) and to complete a 10-minute satisfaction
governance team members as follows: digital tool development, online questionnaire.
Direction of Information Systems, HUG; communication
campaign strategy, Communication Directorate, HUG; Recruitment Campaign
spatiotemporal analyses, Geographic Information Research and We developed a comprehensive two-phase multichannel
Analysis in Population Health, HUG, UNIGE, and EPFL; and communication campaign launched together with the @choum
smart testing referral strategy, Division of Primary Care, HUG. tool on February 11, 2021 (Figure 1). This campaign aims to
Collaborators at the Center for Research and Interdisciplinarity maximize the chances of attaining individuals interested in
at UP provide expertise on citizen-based participation strategies. participating in the study. We conducted a first communication
Prior research has demonstrated our extended team’s productive phase of 2 weeks within the hospital (HUG) setting before
collaboration, generating impactful research that integrates launching the second phase targeting the entire population of
expertise in the fields of population health, spatial epidemiology, the canton of Geneva. This progressive two-phase
and virology [21,22,25]. communication approach has enabled our research team to
Participants and Eligibility maintain control over potential technical challenges associated
with an increased participation rate. The first phase of the
Participant eligibility criteria include (i) aged≥18 years, (ii) communication strategy included paper and digital
living and/or working in the canton of Geneva, (iii) having advertisements (flyers, posters, screens), internal emails
access to a smartphone with a Swiss or French phone number (intranet), hospital-based web and social media pages (landing
and a connection to the internet, and (iv) being capable of page linked to other HUG-based pages, YouTube, LinkedIn,
providing informed consent. Individuals not meeting these Instagram, Facebook, and Twitter), and oral presentations. The
criteria are prevented from completing study registration but second phase expanded the communication strategy to
are redirected to official recommendation websites. All additionally include outdoor advertisement at locations of high
participants provide electronic informed consent (eIC) to pedestrian traffic in the city center and surroundings areas (main
participate in the study. Participant enrollment began on streets, parks, bus and train stations), digital advertisement
February 11, 2021, and will be completed on February 28, 2022, (public transport, grocery stores, and malls), external emails
meaning that participants can enroll during the entire data (intranet of partner associations, local companies, and
collection phase. universities), articles and interviews in traditional media (radio,
Our approach to eIC follows the guidelines provided by the tv, press), and social media also broadcasting five 2-minute
local institutional ethics committee, and requires participants video tutorials and a short and engaging 45-second video [26].
to (i) read the study electronic information letter and declaration The selection of outdoor advertisement locations was guided
of consent displayed within two scrolling menus, (ii) check the by prior research from our group, which identified the canton’s
consent box, and (iii) tap the “I accept” button. The study does areas at risk of increased SARS-CoV-2 transmission [25]. All
not ask for the name or signature of participants to ensure communication materials were designed and developed by the
individual privacy. Participants are informed that they can opt HUG communications team in collaboration with the other
out at any time via their profile or by contacting the research governance team members. The core advertising message
team. In the absence of an opt-out request, all participants are expresses the possibility of contributing to a collective action
followed throughout the data collection phase. helping researchers in the fight against the pandemic.
https://www.researchprotocols.org/2021/10/e30444 JMIR Res Protoc 2021 | vol. 10 | iss. 10 | e30444 | p. 3
(page number not for citation purposes)
XSL• FO
RenderXJMIR RESEARCH PROTOCOLS De Ridder et al
Figure 1. The @choum (English: “achoo”) comprehensive communication campaign started on February 11, 2021, within the hospital setting (Phase
I) before its extension to the entire population of the canton of Geneva on March 1, 2021 (Phase II).
Participation in the @choum study is simple, takes
Participation Steps and Elements approximately 5 minutes, and consists of three steps: (1) consent
Individuals wishing to participate in the study can download and registration, (2) report of COVID-19–associated symptoms
the CoronApp-HUG, freely available on Android (Google Play by tapping on the @choum button, and (3) COVID-19
Store) [27] and iOS (Apple Store) [28] devices in Switzerland recommendations. Registration is completed only once, whereas
and France. @choum has been added as a new functionality to episodes of COVID-19–associated symptoms can be reported
the preexisting CoronApp-HUG mobile app, released by the at multiple time points throughout the data collection phase. An
HUG on March 12, 2020, which provides users with valuable information button is displayed on the upper right corner of
resources and the latest information on COVID-19. Upon some selected screens, which provides participants with more
download completion, users accept the General Terms and detailed explanations relevant to each participation step. The
Conditions of Use of the app and access the tool via a button main study screens are presented in Figure 2, and the study
visible on the home screen. branching logic and elements are presented in Figure 3.
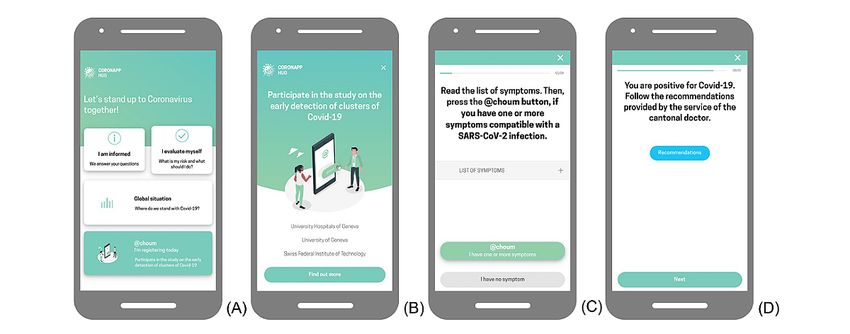
Figure 2. The main @choum (English: “achoo”) study screens, translated into English: (A) CoronApp-HUG home screen with access to the study, (B)
the screen preceding study consent and registration, (C) the main screen providing the possibility to report COVID-19–associated symptoms by tapping
on the @choum button (green button stating “@choum I have one or more symptoms”), and (D) example screen redirecting to COVID-19 recommendations.
https://www.researchprotocols.org/2021/10/e30444 JMIR Res Protoc 2021 | vol. 10 | iss. 10 | e30444 | p. 4
(page number not for citation purposes)
XSL• FO
RenderXJMIR RESEARCH PROTOCOLS De Ridder et al
Figure 3. Simplified scheme of the @choum (English: “achoo”) study branching logic and elements. Once (A) registration is completed, (B)
COVID-19–associated symptoms can be reported at multiple time points throughout the data collection phase (from February 11, 2021, to February
28, 2022), and (C) recommendations are provided based on each report. HUG: Geneva University Hospitals.
First, individuals interested in participating receive information replaced with masked geographic coordinates. The geographic
on the study goals, benefits, and impacts of participation. masking procedure consists of displacing geographic coordinates
Second, they go through the electronic letter of information and randomly within a circular radius of 200 meters around their
the declaration of consent to give their eIC via the “I accept” original position [29]. Individuals providing eIC can register
button, designed for this purpose. Individuals are informed that for the study by reporting their gender, age, residential and/or
they will be asked for their work and home addresses but that work addresses, and phone number. Registration is then
these addresses are not used for tracking purposes and are confirmed by a unique code sent via SMS text message. Upon
https://www.researchprotocols.org/2021/10/e30444 JMIR Res Protoc 2021 | vol. 10 | iss. 10 | e30444 | p. 5
(page number not for citation purposes)
XSL• FO
RenderXJMIR RESEARCH PROTOCOLS De Ridder et al
completion of study registration, the @choum button for launched by the SFOPH, which helps interrupt chains of
symptoms reporting becomes accessible on the home screen. transmission using digital contact tracing of confirmed
No action is required from participants, as long as they are not COVID-19 cases. After a period based on the information
experiencing any COVID-19–associated symptoms. A user provided in the symptom report (Figure 3), the @choum button
profile is created, allowing participants to check and modify becomes accessible again and participants have the opportunity
their home and work addresses at any given time. to create another report upon experiencing new
COVID-19–associated symptoms. All study screens are
When perceiving COVID-19–associated symptoms, participants
presented in Multimedia Appendix 1.
can start the symptoms report process by tapping on the
@choum button. Users are required to go through a list of Data Collection
symptoms before proceeding further into their symptom report. Enrollment and follow-up data are collected at study registration
This step aims to ensure that participants are informed about and at each report of COVID-19–associated symptoms,
the symptoms typically associated with COVID-19. Participants respectively (Figure 4). Enrollment data include age (date of
are asked a set of questions (detailed in the Data Collection birth, age≥18 years), gender (female, male, nonbinary), home
section) concerning their symptoms. If they have not yet been and work addresses (street name, street number, postal code vs
tested for SARS-CoV-2, they are given the possibility to be do not live or work in Geneva), and phone number (Swiss or
informed on whether they currently live or work in an area French prefix number). The data obtained for each symptoms
where a high number of other participants have reported report include perceived symptoms (acute respiratory symptoms
COVID-19–associated symptoms (ie, active and emerging [cough, cold, or difficulty breathing], fever, loss of smell or
spatiotemporal clusters). This feedback is based on the taste, other), date of symptom onset (≤last 14 days), home office
automated spatiotemporal clustering analysis results updated (yes vs no), suspected address of infection (street name, street
daily and returned to participants via specific screens within number, postal code vs do not wish to add an additional address),
the app to encourage user engagement. Symptomatic participants cluster status (I wish vs I do not wish to be notified) if the
with addresses located within such a cluster are further participant has not yet done the test, SARS-CoV-2 test (yes vs
encouraged to get tested for SARS-CoV-2 and subsequently no), date of the test (≤last 14 days and ≥date of symptom onset),
report the test date and result. This information is used to filter and test result (positive, negative, waiting for result).
the addresses included in the prospective spatiotemporal cluster Participants’ cluster status (principal addresses [home and/or
detection analyses. work] in vs out) is obtained through the spatiotemporal
Lastly, participants are redirected to publicly available and clustering analyses performed every 24 hours. Lastly, data
official recommendation websites based on their reported collection ascertains whether the participant has opened the link
information. Participants who have symptoms but have not yet to the self-assessment tool website (yes vs no) and the cantonal
been tested for SARS-CoV-2 are redirected to a survey tool by doctor’s official recommendations (yes vs no). Participants can
the Swiss Federal Office of Public Health (SFOPH) [30]. The change their personal addresses at any time under their @choum
tool allows individuals to self-assess their risk of SARS-CoV-2 profile.
infection and book a test appointment through the HUG website. Data on adoption, participation, and usage behaviors are
Participants are presented with a link to the cantonal doctor’s collected from the Google Play Store, Apple Store, and
websites at each participation step and are invited to follow the CoronApp-HUG app. Data obtained from these sources include
official COVID-19 recommendations [31]. Upon symptoms the number of CoronApp-HUG landing page visits per day on
reporting, all participants are thanked for their participation and each store, the number of CoronApp-HUG downloads per day,
invited to download the contact-tracing app SwissCovid [32], and app utilization pattern metrics.
https://www.researchprotocols.org/2021/10/e30444 JMIR Res Protoc 2021 | vol. 10 | iss. 10 | e30444 | p. 6
(page number not for citation purposes)
XSL• FO
RenderXJMIR RESEARCH PROTOCOLS De Ridder et al
Figure 4. Schedule of study preparation, participant recruitment, and assessments. HUG: Geneva University Hospitals.
All collected data are treated confidentially and securely stored
Data Monitoring and Handling in the HUG-located server, respecting the general data protection
Since the tool’s launch, data are extracted and analyzed weekly regulation legislations of the European Union (GDPR) and
by the research team to monitor adoption, participation, and Geneva (LIPAD). A unique validation code sent to the
currently active and emerging spatiotemporal clusters. participant is used to confirm the participant device’s ownership
Information on areas currently facing increased and reduce abusive system use. The data collected on the
COVID-19–associated symptoms may be shared with local frontend of the app are sent to the server at specific time points:
public health authorities to guide local interventions. upon study registration completion, after being asked about
Individual-level data will not be shared at any time, and an SARS-CoV-2 test results, and every time the validation code
assessment of possible participation biases will be conducted is sent (Figure 3). The geocoding (ie, the transformation of
before sharing any information to avoid risks of misguiding addresses into geographic coordinates) is implemented through
public health efforts. The evolution of the participation rates a completely offline procedure using a reference dataset of Swiss
and the geographical distribution of participants are used to addresses [33]. The geographical masking is conducted before
adapt the communication campaign activities in intensity and uploading the data to the server, and thus no exact street address
location. or original geographical coordinates are uploaded to the server
at any given time. One data manager, responsible for the
database maintenance, encrypts the data prior to their extraction
https://www.researchprotocols.org/2021/10/e30444 JMIR Res Protoc 2021 | vol. 10 | iss. 10 | e30444 | p. 7
(page number not for citation purposes)
XSL• FO
RenderXJMIR RESEARCH PROTOCOLS De Ridder et al
for analyses. An opt-out request by the participant results in the date and masked geographical coordinates (home, work,
complete deletion of the account and data. suspected location of infection) of the symptom reports. This
information is used to notify participants reporting
Sample Size COVID-19–associated symptoms of their cluster status (ie,
The sample size was calculated as ~5000 participants to detect within a cluster or not). The algorithm’s parameters are currently
active and emerging spatiotemporal clusters of reported set to MinPts=3, EpsT1=14, EpsT2=1, and EpsS=600 meters.
COVID-19–associated symptoms. This analysis assumed a total The time window is specified according to the current
of 500,000 potential participants aged≥18 years (~400,000 living knowledge on incubation and transmission periods [48]. The
in and ~100,000 commuting to Geneva for work) [34,35]. Out spatial window of 600 meters represents a good compromise
of this total number, 2% (~10,000) may download the app and between the resolution of the analysis and privacy preservation
half (~5000) are expected to consent to the study. Statistics on [21,25]. The MinPts is set to 3 according to the cluster definition
health-related mobile app retention rates show that 3% of users used by local health authorities [49]. The parameters used for
are likely to use a health-related app for an entire 30-day use each daily analysis are stored and adapted according to the latest
period [36-38]. However, COVID-19 mobile apps have seen research on the spatiotemporal scales of COVID-19
better retention rates, with examples such as the UK National transmission. The Python script returns the geographical
Health Service COVID-19 app and the SwissCovid app, which coordinates of the detected clusters. Only the clusters active at
are being used by around 20% of the population [39,40]. A the date of analysis are retained. To avoid geometries in our
conservative sample size was selected because it is expected to data, which would require spatial databases, the area of the
be highly influenced by the evolution of the epidemiological circular polygon formed by each cluster is approximated using
situation. hectometric squares that are uniquely identified and stored using
their upper-left coordinates only.
Data Analysis
Software Retrospective Analyses
Descriptive statistics of user participation, retention, and
Analyses will be conducted using Python 3.8 [41], R 4.0.5 [42],
collected participant data will be computed using means (SD)
GeoDa 1.18 [43], and QGIS 3.18.1 [44].
and medians (IQR), and frequencies for continuous and
Prospective Analyses categorical variables. These will enable assessing our sample’s
The prospective detection of spatiotemporal clusters will be representativity compared to the canton of Geneva’s general
achieved using the modified space-time density-based spatial population.
clustering of applications with noise (MST-DBSCAN) The number of monthly active users and the number of created
algorithm, designed to detect, characterize, and visualize disease and deleted accounts will be monitored during the entire study
cluster evolution [45]. The MST-DBSCAN algorithm is among period, which will enable estimating the retention rate of the
various density-based clustering methods to detect disease @choum study. The performance and the conversion rate of
clusters. This modified version of the spatiotemporal DBSCAN the digital communication campaign will be monitored for each
has the advantage of considering the transmission relationship employed social media platform (ie, Twitter, YouTube,
between cases, thus incorporating the effect of the incubation Facebook, Instagram, and LinkedIn) by collecting metrics on
period and the ability to detect irregularly shaped clusters [45]. the number of views and the number of users interacting with
Additionally, density-based methodologies only require each communication post. Additionally, the number of
symptomatic reports to function, making them particularly suited downloads of the CoronApp-HUG and the number of @choum
to the @choum study that collects reports only from users registered users will be monitored weekly following these
experiencing symptoms. This method determines clusters using communication campaigns. Together, this will allow us to
a circular spatial scanning window (EpsS) and a time window estimate the conversion rate of the communication efforts.
defined by two parameters, EpsT1 and EpsT2, which determine
the threshold value for the longest and shortest transmission We will analyze outbreaks across the entire study period using
period, respectively. Similar to the traditional DBSCAN, the spatiotemporal and purely spatial statistic methods to understand
MST-DTSCAN algorithm then classifies points into three the evolution of the outbreaks detected over the 12-month data
categories: core, border, and noise points [45,46]. A core point collection phase. Unusual utilization patterns such as repeated
is a point with enough spatiotemporal neighbors to be considered reports (ie, >2) of symptoms with positive RT-PCR test results
the major structure of a cluster with high incidence. The will be classified as “spam” and discarded from retrospective
minimum number of neighbors that a point must have to be analyses. However, this potential risk of high users falsely
classified as a core is defined by the parameter MinPts. A border inflating reports in location and time has been reduced by
point is a point that is part of a cluster without being itself the limiting users to only report COVID-19–associated systems
center of a cluster because it does not have enough neighbors. once every 14 days to ensure that reports correspond to a single
Finally, noise points are outliers located in low-incidence areas episode of COVID-19–associated symptoms. Multiple methods
[45]. will be used to provide a more complete and robust assessment
of the underlying spatiotemporal process [50,51], and include
To obtain the most up-to-date information on active and the space-time scan statistics [52], local join count statistics
emerging clusters, a Python (v3.8) script, based on the package [53], and MST-DBSCAN [45]. The latter will provide a
pySDA 0.1.6 [47], is automatically run every 24 hours using fine-scale characterization of the evolution of clusters in
https://www.researchprotocols.org/2021/10/e30444 JMIR Res Protoc 2021 | vol. 10 | iss. 10 | e30444 | p. 8
(page number not for citation purposes)
XSL• FO
RenderXJMIR RESEARCH PROTOCOLS De Ridder et al
Geneva’s canton across the entire study period. This over 3000 confirmed COVID-19 cases were more persistent in
characterization of clusters into classes (eg, emerge, growth, the socioeconomically disadvantaged Geneva-area
steady, reduce, merge, move, split) will enable the differentiation neighborhoods, which could be targeted in priority for
of populations and areas of high and low temporal concentration intervention [25]. However, most existing participatory
of symptoms (ie, epidemic peakedness) [54]. Lastly, we will syndromic surveillance initiatives are not designed to collect
examine the association between spatiotemporal cluster high-resolution spatiotemporal data [56]. The @choum study
characteristics and sociodemographic and environmental tackles this challenge by using modern spatiotemporal methods
determinants of COVID-19–associated symptoms (covariates) and precise location data while protecting the user’s privacy,
using procedures presented in detail elsewhere [22,25]. enabling potentially more efficient and effective management
of the SARS-CoV-2 pandemic. A few notable studies have
Results already taken a similar approach using fine-scale geographic
information in combination with spatiotemporal clustering
The study began on September 1, 2020, and will be completed analyses [7,16]. For example, Leal-Neto et al [7] used a
on February 28, 2022. The @choum study received final combination of data from traditional and participatory
approval on November 12, 2020, by the Cantonal Research surveillance to detect spatial clusters; however, the temporal
Ethics Commission of Geneva, Switzerland (2020-01586). A component was not considered due to the potential latency of
5-month preparation phase has preceded the 12-month data 14 days on COVID-19 cases. The MST-DBSCAN algorithm
collection phase starting on September 1, 2020, and February employed in the @choum study tackles this challenge by
11, 2021, respectively. Multiple tests performed at various time incorporating the incubation period effect.
points throughout the first 4 months of the preparation phase
have helped to improve the tool’s user experience. Subsequently, Since the start of the pandemic, a growing body of literature
the 1-month pilot phase conducted among 38 pharmacists has highlighted the existence of health inequalities in COVID-19
confirmed that the spatiotemporal clustering analyses worked infection and mortality [57-59]. However, most studies have
appropriately, and the feedback helped to improve the user been performed in the United States and United Kingdom. In
experience and address technical bugs. Since the tool’s launch Switzerland, a study published by our group in early 2021
to the entire population of Geneva on February 11, 2021, and revealed important sociodemographic determinants of epidemic
as of May 15, 2021, we have enrolled over 1000 eligible spread at the local level [25]. Findings from the @choum study
participants. The primary study outcomes are expected to be will provide critical insights into the mechanisms underlying
published in mid-2022. the diffusion dynamics of SARS-CoV-2 by performing
retrospective analyses of collected data, and exploring the
Discussion associations between cluster characteristics and
sociodemographic and environmental determinants. Indeed, the
The @choum study seeks to develop, implement, and test an shape of COVID-19 epidemics is an area of great scientific
innovative participatory epidemiological surveillance tool to interest [60,61], and the use of spatiotemporal clustering may
rapidly detect and prevent clusters of COVID-19–associated offer an innovative tool to better understand the determinants
symptoms by using precise geographic information. Multiple of peaked or prolonged epidemics at a fine geographic scale.
tests and a 1-month pilot study conducted among 38 pharmacists A distinctive feature of the @choum tool lies in the unique
working in 7 Geneva-based pharmacies have confirmed the possibility for participants who have not yet been tested to be
proper functioning of the tool. Since the tool’s launch to the informed on their current cluster status (ie, whether they
entire population of Geneva on February 11, 2021, daily currently live or work in an area where a high number of other
prospective clustering analyses at a local scale help detect active participants have reported COVID-19–associated symptoms).
and emerging spatiotemporal clusters, and thus inform citizens In the context of testing fatigue [5], this returned information
and local authorities on areas potentially facing a COVID-19 on the participants’ cluster status could promote testing among
burden. symptomatic participants and reduce the delay of notification
The retrospective analyses performed at the end of the study inherent to traditional epidemiological surveillance systems
will deliver critical insights into the mechanisms underlying the [8,9]. Moreover, because @choum is integrated into an app for
diffusion dynamics of SARS-CoV-2. COVID-19 resources and information, and is linked to other
official COVID-19 recommendation websites, it supports the
The rationale underlying the @choum study builds on the centralization of local COVID-19 communications [6]. These
well-recognized need to rapidly inform key stakeholders (ie, may be crucial, as getting mixed messages from various sources
clinical decision-makers, local authorities, and citizens) about can reduce compliance with preventive measures [62,63].
geographical areas facing a higher burden of disease [6,9,54].
Prioritizing areas and populations of high COVID-19 burden Several limitations of this study merit comment. First,
has been critical since the start of the SARS-CoV-2 pandemic generalization will be limited to the adult population living or
and will continue during the following months as the vaccination working in the canton of Geneva. Second, adoption and
campaign expands. For example, the province of Ontario, utilization of the @choum tool might suffer from a participation
Canada, has recently expanded vaccination eligibility criteria bias, as attitudes toward digital COVID-19 public health tools
to all adults living in hotspot neighborhoods [55]. Similarly, such as contact tracing apps vary among sociodemographic
our group has shown that clusters observed among a sample of groups [64,65]. However, we developed and implemented
several strategies to foster participation across sociodemographic
https://www.researchprotocols.org/2021/10/e30444 JMIR Res Protoc 2021 | vol. 10 | iss. 10 | e30444 | p. 9
(page number not for citation purposes)
XSL• FO
RenderXJMIR RESEARCH PROTOCOLS De Ridder et al
groups and ensure user retention. We implemented a To the best of our knowledge, @choum is the first participatory
comprehensive communication campaign using numerous online epidemiological surveillance system combining fine-scale
and offline channels. In implementing this campaign, potential spatiotemporal data with prospective clustering analyses. Such
competition between the @choum study and the preexisting a tool could be helpful to effectively prevent the spread of
contact tracing app (SwissCovid) [32] has been considered; COVID-19 and related diseases. This tool has the potential to
@choum was explicitly designed to avoid this possibility, provide timely and precise geographical information to
notably by encouraging the adoption of SwissCovid and encourage infection control interventions at a local scale and
explaining their complementarity. We also aimed to allow users public health recommendations compliance. The study findings
to rapidly and easily report symptoms, which could improve will also advance other research contributions investigating the
participation and retention rates compared to other participatory complex relationship of environment and health using novel
syndromic surveillance systems requiring frequent use or digital technologies. It is thus hoped that the @choum study
periodical inputs. Third, geographic data are limited to fixed will be a valuable support in the fight against COVID-19.
coordinates, and thus occupations involving high mobility (eg,
in-home nurses, taxi drivers) are not represented.
Acknowledgments
The investigators thank the Communication Directorate team at Geneva University Hospitals, and external partners, institutions,
and companies for their major support in the communication campaign. The investigators also wish to thank Dr Mayssam Nehme
for her contribution in developing the study material and the group Pharmacies Principales for their precious help in pilot testing
the tool. We also thank Théo Mobilia who helped with recruitment and the participants who are providing their time to this study.
This work is supported by UBP Private Banking, UBS AG, and the Geneva University Hospitals Private Foundation. The funding
sources played no role in the design or conduct of this study.
Authors' Contributions
Study concept and design: DDR, AJL, FE, JLS, MS, BGT, SS, LK, J-FP, SJ, IG; tool development: DDR, AJL, FE, JLS, MP,
AR, GV, IG; communication campaign: GV, AJL, IG; statistical analyses: DDR; interpretation of data: DDR, AJL, FE, JLS, IG;
drafting of the manuscript: DDR, AJL, FE, JLS, IG; critical manuscript revision: DDR, AJL, FE, JLS, MS, BGT, SS, LK, J-FP,
SJ, IG; study administration: AJL, IG; study supervision: IG. All authors have read and agreed to the published version of the
manuscript.
Conflicts of Interest
None declared.
Multimedia Appendix 1
All screens related to study participation.
[PDF File (Adobe PDF File), 5730 KB-Multimedia Appendix 1]
References
1. Iacobucci G. Covid-19: Cycle of 50 day lockdowns and 30 day relaxations could be effective, study finds. BMJ 2020 May
20;369:m2037. [doi: 10.1136/bmj.m2037] [Medline: 32434797]
2. Oliu-Barton M, Pradelski BSR, Aghion P, Artus P, Kickbusch I, Lazarus JV, et al. SARS-CoV-2 elimination, not mitigation,
creates best outcomes for health, the economy, and civil liberties. Lancet 2021 Jun 12;397(10291):2234-2236 [FREE Full
text] [doi: 10.1016/S0140-6736(21)00978-8] [Medline: 33932328]
3. The Lancet Infectious Diseases. The COVID-19 exit strategy-why we need to aim low. Lancet Infect Dis 2021 Mar;21(3):297
[FREE Full text] [doi: 10.1016/S1473-3099(21)00080-3] [Medline: 33581748]
4. COVID-19 testing sees decline, but remains essential, experts say. Medscape. URL: https://www.medscape.com/viewarticle/
946907 [accessed 2021-03-21]
5. The Covid Testing Slump. The New York Times. URL: https://www.nytimes.com/2021/03/26/briefing/
jessica-walter-suez-canal-usc-gynecologist.html [accessed 2021-04-14]
6. Budd J, Miller BS, Manning EM, Lampos V, Zhuang M, Edelstein M, et al. Digital technologies in the public-health
response to COVID-19. Nat Med 2020 Aug 07;26(8):1183-1192. [doi: 10.1038/s41591-020-1011-4] [Medline: 32770165]
7. Leal-Neto O, Santos F, Lee J, Albuquerque J, Souza W. Prioritizing COVID-19 tests based on participatory surveillance
and spatial scanning. Int J Med Inform 2020 Nov;143:104263 [FREE Full text] [doi: 10.1016/j.ijmedinf.2020.104263]
[Medline: 32877853]
8. Yeng PK, Woldaregay AZ, Solvoll T, Hartvigsen G. Cluster detection mechanisms for syndromic surveillance systems:
systematic review and framework development. JMIR Public Health Surveill 2020 May 26;6(2):e11512 [FREE Full text]
[doi: 10.2196/11512] [Medline: 32357126]
https://www.researchprotocols.org/2021/10/e30444 JMIR Res Protoc 2021 | vol. 10 | iss. 10 | e30444 | p. 10
(page number not for citation purposes)
XSL• FO
RenderXJMIR RESEARCH PROTOCOLS De Ridder et al
9. Drew DA, Nguyen LH, Steves CJ, Menni C, Freydin M, Varsavsky T, COPE Consortium. Rapid implementation of mobile
technology for real-time epidemiology of COVID-19. Science 2020 Jun 19;368(6497):1362-1367 [FREE Full text] [doi:
10.1126/science.abc0473] [Medline: 32371477]
10. Koppeschaar CE, Colizza V, Guerrisi C, Turbelin C, Duggan J, Edmunds WJ, et al. Influenzanet: citizens among 10 countries
collaborating to monitor influenza in Europe. JMIR Public Health Surveill 2017 Sep 19;3(3):e66 [FREE Full text] [doi:
10.2196/publichealth.7429] [Medline: 28928112]
11. Smolinski MS, Crawley AW, Baltrusaitis K, Chunara R, Olsen JM, Wójcik O, et al. Flu near you: crowdsourced symptom
reporting spanning 2 influenza seasons. Am J Public Health 2015 Oct;105(10):2124-2130. [doi: 10.2105/AJPH.2015.302696]
[Medline: 26270299]
12. Rossman H, Keshet A, Shilo S, Gavrieli A, Bauman T, Cohen O, et al. A framework for identifying regional outbreak and
spread of COVID-19 from one-minute population-wide surveys. Nat Med 2020 May;26(5):634-638 [FREE Full text] [doi:
10.1038/s41591-020-0857-9] [Medline: 32273611]
13. COVID-19-Tracking Suisse. URL: https://www.covidtracker.ch/ [accessed 2021-03-21]
14. Menni C, Valdes AM, Freidin MB, Sudre CH, Nguyen LH, Drew DA, et al. Real-time tracking of self-reported symptoms
to predict potential COVID-19. Nat Med 2020 Jul;26(7):1037-1040 [FREE Full text] [doi: 10.1038/s41591-020-0916-2]
[Medline: 32393804]
15. Leal Neto O, Dimech GS, Libel M, de Souza WV, Cesse E, Smolinski M, et al. Saúde na Copa: The world's first application
of participatory surveillance for a mass gathering at FIFA World Cup 2014, Brazil. JMIR Public Health Surveill 2017 May
04;3(2):e26 [FREE Full text] [doi: 10.2196/publichealth.7313] [Medline: 28473308]
16. Leal Neto O, Cruz O, Albuquerque J, Nacarato de Sousa M, Smolinski M, Pessoa Cesse E, et al. Participatory surveillance
based on crowdsourcing during the Rio 2016 Olympic Games using the Guardians of Health platform: descriptive study.
JMIR Public Health Surveill 2020 Apr 07;6(2):e16119 [FREE Full text] [doi: 10.2196/16119] [Medline: 32254042]
17. Li Z, Li X, Porter D, Zhang J, Jiang Y, Olatosi B, et al. Monitoring the spatial spread of COVID-19 and effectiveness of
control measures through human movement data: proposal for a predictive model using big data analytics. JMIR Res Protoc
2020 Dec 18;9(12):e24432 [FREE Full text] [doi: 10.2196/24432] [Medline: 33301418]
18. Hsiang S, Allen D, Annan-Phan S, Bell K, Bolliger I, Chong T, et al. The effect of large-scale anti-contagion policies on
the COVID-19 pandemic. Nature 2020 Aug;584(7820):262-267. [doi: 10.1038/s41586-020-2404-8] [Medline: 32512578]
19. Desjardins M, Hohl A, Delmelle E. Rapid surveillance of COVID-19 in the United States using a prospective space-time
scan statistic: Detecting and evaluating emerging clusters. Appl Geogr 2020 May;118:102202 [FREE Full text] [doi:
10.1016/j.apgeog.2020.102202] [Medline: 32287518]
20. Hohl A, Delmelle EM, Desjardins MR, Lan Y. Daily surveillance of COVID-19 using the prospective space-time scan
statistic in the United States. Spat Spatiotemporal Epidemiol 2020 Aug;34:100354 [FREE Full text] [doi:
10.1016/j.sste.2020.100354] [Medline: 32807396]
21. De Ridder D, Sandoval J, Vuilleumier N, Stringhini S, Spechbach H, Joost S, et al. Geospatial digital monitoring of
COVID-19 cases at high spatiotemporal resolution. Lancet Digit Health 2020 Aug;2(8):e393-e394 [FREE Full text] [doi:
10.1016/S2589-7500(20)30139-4] [Medline: 33328043]
22. Ladoy A, Opota O, Carron P, Guessous I, Vuilleumier S, Joost S, et al. Size and duration of COVID-19 clusters go along
with a high SARS-CoV-2 viral load: A spatio-temporal investigation in Vaud state, Switzerland. Sci Total Environ 2021
Sep 15;787:147483 [FREE Full text] [doi: 10.1016/j.scitotenv.2021.147483] [Medline: 34000545]
23. Brownstein JS, Cassa CA, Mandl KD. No place to hide--reverse identification of patients from published maps. N Engl J
Med 2006 Oct 19;355(16):1741-1742. [doi: 10.1056/NEJMc061891] [Medline: 17050904]
24. Allshouse WB, Fitch MK, Hampton KH, Gesink DC, Doherty IA, Leone PA, et al. Geomasking sensitive health data and
privacy protection: an evaluation using an E911 database. Geocarto Int 2010 Oct 01;25(6):443-452 [FREE Full text] [doi:
10.1080/10106049.2010.496496] [Medline: 20953360]
25. De Ridder D, Sandoval J, Vuilleumier N, Azman AS, Stringhini S, Kaiser L, et al. Socioeconomically disadvantaged
neighborhoods face increased persistence of SARS-CoV-2 clusters. Front Public Health 2020;8:626090. [doi:
10.3389/fpubh.2020.626090] [Medline: 33614571]
26. @CHOUM, un outil de veille épidémiologique. YouTube. URL: https://www.youtube.com/watch?v=mfiT1JVv5Xw
[accessed 2021-09-14]
27. Coronapp-HUG. Google Play. URL: https://play.google.com/store/apps/details?id=com.hug_ge.coronapp [accessed
2021-04-12]
28. CoronApp-HUG. Apple App Store. URL: https://apps.apple.com/ch/app/coronapp-hug/id1502401817? [accessed 2021-04-12]
29. Zandbergen PA. Ensuring confidentiality of geocoded health data: assessing geographic masking strategies for individual-level
data. Adv Med 2014;2014:567049. [doi: 10.1155/2014/567049] [Medline: 26556417]
30. Do the coronavirus check now. Office Fédéral de la Santé Publique. URL: https://foph-coronavirus.ch/check/ [accessed
2021-09-13]
31. COVID-19 - How to protect yourself and others. Republique et canton de Genève. URL: https://www.ge.ch/en/
covid-19-how-protect-yourself-and-others [accessed 2021-09-07]
https://www.researchprotocols.org/2021/10/e30444 JMIR Res Protoc 2021 | vol. 10 | iss. 10 | e30444 | p. 11
(page number not for citation purposes)
XSL• FO
RenderXJMIR RESEARCH PROTOCOLS De Ridder et al
32. Troncoso C, Payer M, Hubaux J. Decentralized privacy-preserving proximity tracing. arXiv. 2020 May 21. URL: https:/
/arxiv.org/abs/2005.12273 [accessed 2021-09-21]
33. Registre fédéral des bâtiments et des logements. Federal Statistical Office, Switzerland (OFS). 2017. URL: https://www.
housing-stat.ch/ [accessed 2020-04-28]
34. Statistiques cantonales. République et canton de Genève. URL: http://www.ge.ch/statistique/domaines/10/10_02/publications.
asp [accessed 2021-07-12]
35. Population résidante, personnes actives occupées, personnes en formation: pendulaires par canton - 2010-2019 | Tableau.
Federal Statistical Office, Switzerland (OFS). URL: https://www.bfs.admin.ch/bfs/fr/home/statistiques/mobilite-transports/
transport-personnes/pendularite.assetdetail.15504086.html [accessed 2021-03-22]
36. Worldwide mobile app user retention by OS 2016. Statista. URL: https://www.statista.com/statistics/243728/
worldwide-mobile-app-user-retention-by-mobile-plaform/ [accessed 2021-03-22]
37. Torous J, Lipschitz J, Ng M, Firth J. Dropout rates in clinical trials of smartphone apps for depressive symptoms: A
systematic review and meta-analysis. J Affect Disord 2020 Feb 15;263:413-419. [doi: 10.1016/j.jad.2019.11.167] [Medline:
31969272]
38. Meyerowitz-Katz G, Ravi S, Arnolda L, Feng X, Maberly G, Astell-Burt T. Rates of attrition and dropout in app-based
interventions for chronic disease: systematic review and meta-analysis. J Med Internet Res 2020 Sep 29;22(9):e20283
[FREE Full text] [doi: 10.2196/20283] [Medline: 32990635]
39. Wymant C, Ferretti L, Tsallis D. The epidemiological impact of the NHS COVID-19 App. GitHub. URL: https://github.
com/BDI-pathogens/covid-19_instant_tracing/blob/master/
Epidemiological_Impact_of_the_NHS_COVID_19_App_Public_Release_V1.pdf [accessed 2021-03-22]
40. Salathé M, Althaus C, Anderegg N, Antonioli D, Ballouz T, Bugnon E, et al. Early evidence of effectiveness of digital
contact tracing for SARS-CoV-2 in Switzerland. Swiss Med Wkly 2020 Dec 14;150:w20457 [FREE Full text] [doi:
10.4414/smw.2020.20457] [Medline: 33327003]
41. Van Rossum G, Drake FL. Python 3 Reference Manual. Scotts Valley, CA: CreateSpace; 2009.
42. The R Development Core Team. R: A Language and Environment for Statistical Computing. Vienna, Austria: R Foundation
for Statistical Computing; Feb 08, 2008.
43. Anselin L, Syabri I, Kho Y. GeoDa: an introduction to spatial data analysis. Geogr Anal 2006 Jan;38(1):5-22. [doi:
10.1111/j.0016-7363.2005.00671.x]
44. QGIS Geographic Information System. 2021. URL: https://qgis.org/ [accessed 2021-03-22]
45. Kuo F, Wen T, Sabel CE. Characterizing diffusion dynamics of disease clustering: a Modified Space–Time DBSCAN
(MST-DBSCAN) algorithm. Ann Am Assoc Geogr 2018 Jan 26;108(4):1168-1186. [doi: 10.1080/24694452.2017.1407630]
46. Ester M, Kriegel H, Sander J, Xu X. A density-based algorithm for discovering clusters in large spatial databases with
noise. 1996 Presented at: Knowledge Discovery in Databases (KDD); August 2-4, 1996; Portland, Oregon.
47. Wen T. pySDA. GitHub. 2018. URL: https://github.com/wenlab501/pysda [accessed 2021-04-12]
48. Lauer SA, Grantz KH, Bi Q, Jones FK, Zheng Q, Meredith HR, et al. The incubation period of coronavirus disease 2019
(COVID-19) from publicly reported confirmed cases: estimation and application. Ann Intern Med 2020 May
05;172(9):577-582 [FREE Full text] [doi: 10.7326/M20-0504] [Medline: 32150748]
49. COVID-19 - glossaire. Republique et Canton de Geneve. URL: https://www.ge.ch/document/covid-19-glossaire [accessed
2021-03-26]
50. Martins-Melo FR, Pinheiro MCC, Ramos AN, Alencar CH, Bezerra FSDM, Heukelbach J. Spatiotemporal patterns of
schistosomiasis-related deaths, Brazil, 2000-2011. Emerg Infect Dis 2015 Oct;21(10):1820-1823. [doi:
10.3201/eid2110.141438] [Medline: 26401716]
51. Huang L, Pickle LW, Das B. Evaluating spatial methods for investigating global clustering and cluster detection of cancer
cases. Stat Med 2008 Nov 10;27(25):5111-5142 [FREE Full text] [doi: 10.1002/sim.3342] [Medline: 18712778]
52. Kulldorff M. A spatial scan statistic. Commun Stat Theor M 2007 Jun 27;26(6):1481-1496. [doi:
10.1080/03610929708831995]
53. Anselin L, Li X. Operational local join count statistics for cluster detection. J Geogr Syst 2019 Jun 2;21(2):189-210 [FREE
Full text] [doi: 10.1007/s10109-019-00299-x] [Medline: 31171898]
54. Rader B, Scarpino SV, Nande A, Hill AL, Adlam B, Reiner RC, et al. Crowding and the shape of COVID-19 epidemics.
Nat Med 2020 Dec 05;26(12):1829-1834. [doi: 10.1038/s41591-020-1104-0] [Medline: 33020651]
55. Ontario opening vaccine eligibility to anyone 18up in COVID-19 hot spots. toronto.com. URL: https://www.toronto.com/
news-story/10368539-ontario-opening-vaccine-eligibility-to-anyone-18-and-up-in-covid-19-hot-spots/ [accessed 2021-04-12]
56. Segal E, Zhang F, Lin X, King G, Shalem O, Shilo S, et al. Building an international consortium for tracking coronavirus
health status. Nat Med 2020 Aug 02;26(8):1161-1165. [doi: 10.1038/s41591-020-0929-x] [Medline: 32488218]
57. Bambra C, Riordan R, Ford J, Matthews F. The COVID-19 pandemic and health inequalities. J Epidemiol Community
Health 2020 Nov 13;74(11):964-968 [FREE Full text] [doi: 10.1136/jech-2020-214401] [Medline: 32535550]
58. Niedzwiedz CL, O'Donnell CA, Jani BD, Demou E, Ho FK, Celis-Morales C, et al. Ethnic and socioeconomic differences
in SARS-CoV-2 infection: prospective cohort study using UK Biobank. BMC Med 2020 May 29;18(1):160 [FREE Full
text] [doi: 10.1186/s12916-020-01640-8] [Medline: 32466757]
https://www.researchprotocols.org/2021/10/e30444 JMIR Res Protoc 2021 | vol. 10 | iss. 10 | e30444 | p. 12
(page number not for citation purposes)
XSL• FO
RenderXJMIR RESEARCH PROTOCOLS De Ridder et al
59. Bowleg L. We're not all in this together: on COVID-19, intersectionality, and structural inequality. Am J Public Health
2020 Jul;110(7):917. [doi: 10.2105/AJPH.2020.305766] [Medline: 32463703]
60. Dalziel BD, Kissler S, Gog JR, Viboud C, Bjørnstad ON, Metcalf CJE, et al. Urbanization and humidity shape the intensity
of influenza epidemics in U.S. cities. Science 2018 Oct 05;362(6410):75-79 [FREE Full text] [doi: 10.1126/science.aat6030]
[Medline: 30287659]
61. Rader B, Astley C, Sy KTL, Sewalk K, Hswen Y, Brownstein JS, et al. Geographic access to United States SARS-CoV-2
testing sites highlights healthcare disparities and may bias transmission estimates. J Travel Med 2020 Nov 09;27(7):taaa076
[FREE Full text] [doi: 10.1093/jtm/taaa076] [Medline: 32412064]
62. Clements JM. Knowledge and behaviors toward COVID-19 among US residents during the early days of the pandemic:
cross-sectional online questionnaire. JMIR Public Health Surveill 2020 May 08;6(2):e19161 [FREE Full text] [doi:
10.2196/19161] [Medline: 32369759]
63. Wang D, Marmo-Roman S, Krase K, Phanord L. Compliance with preventative measures during the COVID-19 pandemic
in the USA and Canada: Results from an online survey. Soc Work Health Care 2021 Jan 06;60(3):240-255. [doi:
10.1080/00981389.2020.1871157] [Medline: 33407057]
64. Li T, Cobb C, Yang J, Baviskar S, Agarwal Y, Li B, et al. What makes people install a COVID-19 contact-tracing app?
Understanding the influence of app design and individual difference on contact-tracing app adoption intention. Pervasive
Mob Comput 2021 Aug;75:101439. [doi: 10.1016/j.pmcj.2021.101439]
65. Hargittai E, Redmiles EM, Vitak J, Zimmer M. Americans’ willingness to adopt a COVID-19 tracking app. First Monday
2020 Oct 06;25(11):11095 [FREE Full text] [doi: 10.5210/fm.v25i11.11095]
Abbreviations
eIC: electronic informed consent
EPFL: Swiss Federal Institute of Technology Lausanne
HUG: Geneva University Hospitals
MST-DBSCAN: modified space-time density-based spatial clustering of applications with noise
RT-PCR: real-time polymerase chain reaction
SFOPH: Swiss Federal Office of Public Health
UNIGE: University of Geneva
UP: University of Paris
Edited by G Eysenbach; submitted 14.05.21; peer-reviewed by O Leal Neto, S Pesälä; comments to author 28.06.21; revised version
received 18.07.21; accepted 19.07.21; published 06.10.21
Please cite as:
De Ridder D, Loizeau AJ, Sandoval JL, Ehrler F, Perrier M, Ritch A, Violot G, Santolini M, Greshake Tzovaras B, Stringhini S, Kaiser
L, Pradeau JF, Joost S, Guessous I
Detection of Spatiotemporal Clusters of COVID-19–Associated Symptoms and Prevention Using a Participatory Surveillance App:
Protocol for the @choum Study
JMIR Res Protoc 2021;10(10):e30444
URL: https://www.researchprotocols.org/2021/10/e30444
doi: 10.2196/30444
PMID: 34449403
©David De Ridder, Andrea Jutta Loizeau, José Luis Sandoval, Frédéric Ehrler, Myriam Perrier, Albert Ritch, Guillemette Violot,
Marc Santolini, Bastian Greshake Tzovaras, Silvia Stringhini, Laurent Kaiser, Jean-François Pradeau, Stéphane Joost, Idris
Guessous. Originally published in JMIR Research Protocols (https://www.researchprotocols.org), 06.10.2021. This is an open-access
article distributed under the terms of the Creative Commons Attribution License (https://creativecommons.org/licenses/by/4.0/),
which permits unrestricted use, distribution, and reproduction in any medium, provided the original work, first published in JMIR
Research Protocols, is properly cited. The complete bibliographic information, a link to the original publication on
https://www.researchprotocols.org, as well as this copyright and license information must be included.
https://www.researchprotocols.org/2021/10/e30444 JMIR Res Protoc 2021 | vol. 10 | iss. 10 | e30444 | p. 13
(page number not for citation purposes)
XSL• FO
RenderXYou can also read