Exploring Climate-Change Impacts on Energy Efficiency and Overheating Vulnerability of Bioclimatic Residential Buildings under Central European ...
←
→
Page content transcription
If your browser does not render page correctly, please read the page content below
sustainability

Article
Exploring Climate-Change Impacts on Energy Efficiency and
Overheating Vulnerability of Bioclimatic Residential Buildings
under Central European Climate
Luka Pajek             and Mitja Košir *

                                          Faculty of Civil and Geodetic Engineering, University of Ljubljana, 1000 Ljubljana, Slovenia;
                                          luka.pajek@fgg.uni-lj.si
                                          * Correspondence: mitja.kosir@fgg.uni-lj.si

                                          Abstract: Climate change is expected to expose the locked-in overheating risk concerning bioclimatic
                                          buildings adapted to a specific past climate state. The study aims to find energy-efficient building
                                          designs which are most resilient to overheating and increased cooling energy demands that will
                                          result from ongoing climate change. Therefore, a comprehensive parametric study of various passive
                                          building design measures was implemented, simulating the energy use of each combination for a
                                          temperate climate of Ljubljana, Slovenia. The approach to overheating vulnerability assessment
                                          was devised and applied using the increase in cooling energy demand as a performance indicator.
                                          The results showed that a B1 heating energy efficiency class according to the Slovenian Energy
                                          Performance Certificate classification was the highest attainable using the selected passive design
                                          parameters, while the energy demand for heating is projected to decrease over time. In contrast,

                                   the energy use for cooling is in general projected to increase. Furthermore, it was found that, in
Citation: Pajek, L.; Košir, M.
                                          building models with higher heating energy use, low overheating vulnerability is easier to achieve.
Exploring Climate-Change Impacts          However, in models with high heating energy efficiency, very high overheating vulnerability is not
on Energy Efficiency and                  expected. Accordingly, buildings should be designed for current heating energy efficiency and low
Overheating Vulnerability of              vulnerability to future overheating. The paper shows a novel approach to bioclimatic building design
Bioclimatic Residential Buildings         with global warming adaptation integrated into the design process. It delivers recommendations
under Central European Climate.           for the energy-efficient, robust bioclimatic design of residential buildings in the Central European
Sustainability 2021, 13, 6791.            context, which are intended to guide designers and policymakers towards a resilient and sustainable
https://doi.org/10.3390/su13126791        built environment.

Academic Editor: Luisa F. Cabeza
                                          Keywords: climate change; bioclimatic design; passive design; energy efficiency; overheating;
                                          building resilience; robustness
Received: 24 May 2021
Accepted: 12 June 2021
Published: 16 June 2021

                                          1. Introduction
Publisher’s Note: MDPI stays neutral
with regard to jurisdictional claims in        Since Neolithic times, the building of homes has provided people with a higher
published maps and institutional affil-   degree of flexibility and independence in terms of climate and consequential habitability.
iations.                                  Shelters and houses offered their occupants protection from the environment, predators
                                          and intruders [1]. Moreover, people were no longer forced to migrate towards flourishing
                                          regions with pleasant weather as the seasons passed and the climate changed. Thus, many
                                          relatively inhospitable environments were settled. Alongside the habitation of diverse
Copyright: © 2021 by the authors.         climates, the struggle of builders to either utilise or fight the climatic characteristics of
Licensee MDPI, Basel, Switzerland.        a location had begun. Only the best performing building design ideas were passed on,
This article is an open access article    and thus, the knowledge on climate-adapted buildings was passed on intrinsically from
distributed under the terms and           generation to generation. Climate opportunities, together with the occupants’ and society’s
conditions of the Creative Commons        needs and expectations, and the technological know-how about building, form the so-
Attribution (CC BY) license (https://     called triquetra of bioclimatic building design [1]. Therefore, the concept of bioclimatic
creativecommons.org/licenses/by/          building design is often associated with the harmonisation of climate, comfort, and energy
4.0/).

Sustainability 2021, 13, 6791. https://doi.org/10.3390/su13126791                                        https://www.mdpi.com/journal/sustainability
Sustainability 2021, 13, 6791                                                                                             2 of 17

                                efficiency [2]. The closer the building can follow and respond to the external dynamics,
                                such as temperature, solar radiation and relative humidity, the more efficient it is [3].
                                       Bioclimatic design is an engineering practice usually described through the building’s
                                ability to utilise climatic conditions and resources in a particular location to advance its
                                performance. Hence, the goal is that a building and its elements should facilitate occupant’s
                                comfort through an energy- and resource-efficient approach by adapting to the location’s
                                climatic conditions to the highest reasonable degree [4,5]. In professional circles, the general
                                opinion is that vernacular (i.e., traditional) architecture is perfectly adapted to the climatic
                                characteristics of a specific location, as it is presumed that it has “evolutionarily” adapted
                                to the given climate over the centuries. Therefore, vernacular architecture is often a source
                                of bioclimatic strategies and corresponding passive design measures incorporated into
                                new buildings [1,6,7]. Nowadays, in building design, bioclimatic strategies are regularly
                                accompanied by sophisticated and expensive active systems that can dynamically reduce
                                energy use and increase thermal comfort [8,9].
                                       As indicated above, climate plays a crucial role in bioclimatic building design. While
                                there are large parts of continents with the same climate type, in some parts of the Earth,
                                such as the Alpine-Adriatic region in Europe, many climate types are found in a relatively
                                small area [10]. According to Köppen–Geiger climate classification [11], the prevailing
                                climates in Central Europe are warm temperate (i.e., C) and boreal (i.e., D), fully humid
                                (i.e., f) climates with warm (i.e., b) or cool (i.e., c) summers. Such climate diversity results
                                in specific bioclimatic architecture [12]. In these climates, a residential building designed
                                according to the bioclimatic design paradigm should mainly facilitate passive solar gains,
                                reduce thermal losses during the colder part of the year, and allow heat storage through
                                high thermal mass of the envelope [1]. Furthermore, the thermal response of residential
                                buildings under temperate and boreal climates is typically envelope dominated [13]. There-
                                fore, implementing bioclimatic (i.e., passive) measures on the level of the building envelope
                                might be highly efficient in optimising building heating energy use.
                                       During the last century, evident changes in climate have been noted [14–18], and by
                                the end of the twenty-first century, global temperature is projected to rise by up to 4 ◦ C [19].
                                In the times of hunter-gatherer societies, people had the option of migrating to other,
                                more pleasant regions in the event of significant climatic changes. Once buildings were
                                added to the equation, migratory behaviour was no longer an attractive option as a climate
                                adaptation strategy because one would leave behind the result of one’s hard work—a
                                building. Hence, climate-adapted buildings carry a possible built-in risk concerning
                                climate change. However, according to the Migration and Climate Change Report [20],
                                over 1 billion people are expected to face displacement by 2050 due to climate warming and
                                related ecological threats. In particular, sub-Saharan Africa, South Asia, the Middle East,
                                and North Africa face the most significant number of threats, such as lack of access to food
                                and water and increased natural disasters occurrence [21]. On the other hand, developed
                                regions in Europe and North America are expected to face fewer ecological threats [21].
                                Nevertheless, not giving them the immunity to broader implications of climate change,
                                such as the impact on urbanised environments and buildings.
                                       A warmer climate will inevitably affect the thermal performance of buildings, even
                                bioclimatic buildings adapted to the current or past climate. Wang et al. [22] warned
                                that there is an increasing need to clarify the challenges posed by climate warming to
                                limit potential thermal discomfort by applying passive building measures. In climates
                                present in Central Europe, the bioclimatic design measures integrated into buildings are
                                based primarily on heating need to achieve comfort during the winter months. Namely,
                                south-oriented windows for passive solar heating, building envelopes with low thermal
                                conductivity and compact building shapes are commonly used in building design [23].
                                Nevertheless, the projected effects of a warming climate will lead to a risk of overheat-
                                ing for such buildings, especially if the line between a thermally comfortable and a hot
                                environment is thin. Therefore, bioclimatic strategies used in buildings in such locations
                                must be re-evaluated, as emphasised by Pajek and Košir [24]. Numerous studies have been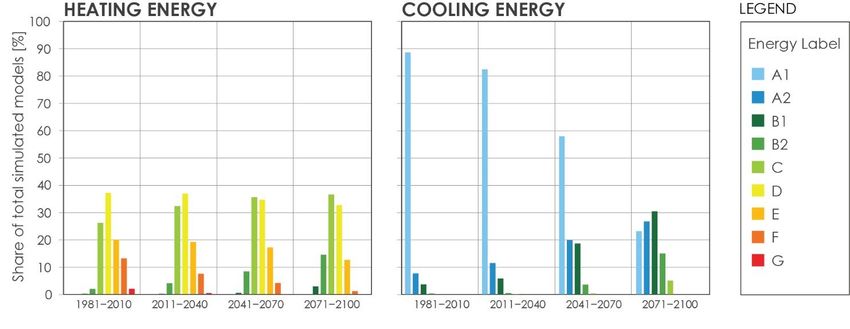
Sustainability 2021, 13, 6791                                                                                          3 of 17

                                conducted in order to assess the effects of climate change on building energy performance.
                                Berardi and Jafarpur [25] in Toronto, Canada, showed an average decrease of 18–33% for
                                heating and an average increase of 15–126% for cooling energy use by 2070, depending on
                                climate file and building typology. Furthermore, Rodrigues and Fernandes [26] stated that,
                                in residential buildings, a general increase in cooling demand (up to 137%) and a smaller
                                reduction in heating demand (up to 63%) is expected until 2050 in Mediterranean locations,
                                while the current ideal U-values will mainly not cause overheating. Bravo Dias et al. [27]
                                explored climate change implications on passive building design efficiency in 43 most
                                populated cities in the European Union. They concluded that buildings using passive
                                design measures, whose performance is highly climate-dependent, will be particularly
                                affected. For example, in Southern Europe, the shading season will increase by 2.5 months,
                                making shading by overhangs or other fixed elements less effective.
                                      Therefore, the selection of passive design measures should be based on the ability
                                to achieve the highest possible resilience of a building. Martin and Sundley [28] define
                                resilience as a process that involves several criteria, including vulnerability, resistance,
                                robustness, and recoverability. According to Attia et al. [29], overheating vulnerability
                                assessment considering future climate scenarios should be part of the building design
                                process. Such an approach aims to achieve a design solution with less sensitive performance
                                to “noise” in the form of change of the environmental boundary conditions [30]. Even in the
                                animal world, the idea of resilient “building” can be found in ant gardens, which apparently
                                allow the species to be more resilient to climate change than they would be outside of this
                                system [31]. However, to assess the resilience of cities and buildings to climate change,
                                studies of robustness and vulnerability evaluation have been made (see refs. [32–38]).
                                For instance, Fonseca et al. [32] studied the effects of climate change on the energy use
                                of buildings in the United States. They concluded that additional research is needed to
                                provide more robust estimates of the impact of climate change on the building sector.
                                Similarly, Shen and Lior [33] performed a vulnerability analysis on climate change impacts
                                of present renewable energy systems used in net-zero energy buildings. Different authors,
                                namely Moazami et al. [30], Kotireddy et al. [35], and others, presented workflows and
                                methods for building performance robustness assessment to prevent significant variations
                                in energy use. Given these points, Houghton and Castillo-Salgado [39] recommended using
                                green building programs and certifications to help reduce the vulnerability of buildings to
                                climate change.
                                      Finally, the concept of building resilience concerning building energy use should be
                                discussed, particularly in the context of the EU Energy performance of buildings directive
                                (EPBD) [40]. To help enhance the energy performance of buildings, the EPBD also intro-
                                duced building energy performance certification (EPC). However, in most countries, more
                                than half of all existing residential buildings with registered EPCs have energy class D or
                                lower [41]. On the other hand, the share of newly constructed nearly Zero-Energy Build-
                                ings (nZEB), also introduced through EPBD and characterised by high energy efficiency, is
                                increasing. Furthermore, in 2020, the EU Commission presented its strategy to boost the
                                energy renovation for climate neutrality of buildings in the EU [42]. For this reason, the
                                vulnerability of buildings to climate change must be considered.
                                      Bioclimatic principles are often associated with energy-efficient buildings, especially
                                in temperate climates where buildings are primarily heating-dominated but have consid-
                                erable potential for passive solar heating. Under such climatic conditions, buildings are
                                usually designed to address the heating energy efficiency while overlooking the potential
                                overheating risk during the warmer part of the year. Therefore, passive design measures,
                                such as large equatorially oriented windows, compact building shapes, and highly ther-
                                mally insulated envelopes, are commonly applied [43]. Nevertheless, it is unclear to what
                                extent such design practices pose a potential lock-in overheating risk under projected
                                climate scenarios. The paper aims at investigating potential solutions to simultaneously
                                achieve high energy efficiency for the heating of bioclimatically designed buildings while
                                at the same time maintaining low vulnerability to a warming climate. The study was
Sustainability 2021, 13, 6791 4 of 17
conducted for Ljubljana, Slovenia, as a representative of a location with a temperate Cen-
tral European climate. Energy models of bioclimatic buildings were evaluated against
heating and cooling energy use, applying a comprehensive parametric analysis of passive
design measures. The study’s main objective was to demonstrate a novel approach to the
bioclimatic design of buildings, where the adaptation and resistance to a warming climate
are integrated into the design process. Hence, the paper presents recommendations for the
adoption of resilient bioclimatic building design into practice and legislation.
2. Materials and Methods
The study’s methodology was developed to enable the reaching of the above-stated
objective of the paper. Thus, in principle, the applied methods can be split into four
basic steps:
1. Sourcing historical climate data for the location of Ljubljana and preparing future
climate data according to climate change projections using the morphing technique
(Section 2.1).
2. Building energy model definition with corresponding variable parameters for the
conducted parametric analysis (Section 2.2).
3. Definition of the methodology for energy performance evaluation based on the current
Slovenian legislation (Section 2.3).
4. Definition of the methodology applied for overheating vulnerability analysis (Section 2.4).
2.1. Location and Climate
The study was performed for a Central European climate. As a representative of such
climate, the location of Ljubljana (N 46.22, E 14.48, 385 m above sea level) in Slovenia was se-
lected. This location is characterised by a warm temperate, fully humid climate with warm
summers (Cfb according to Köppen–Geiger climate classification). The EPW climate file
needed for building energy analysis was sourced from the International Weather for Energy
Calculation (IWEC) database representing weather data measured between 1982 and 1999.
In the paper, this climate data period was labelled as 1981–2010. Furthermore, the EPW
of Ljubljana was used to generate projected EPW climate files for the periods 2011–2040,
2041–2070, and 2071–2100. The projected EPW files were generated using the morphing
technique (i.e., time series adjustment method) according to the Intergovernmental Panel
on Climate Change (IPCC) Special Report on Emissions Scenarios (SRES) A2 climate change
scenario [44] and CCWorldWeatherGen tool [45]. The applied morphing technique uses
historical climate data based on representative meteorological measurements in conjunc-
tion with projected global climate change patterns derived through numerical computer
modelling to generate a new set of future projected climate. The use of recorded climate
data as a starting point for future projected climate results in temporal continuity and
spatial downscaling. The latter might be an issue for building energy simulations if only
projections from global climate models are used.
2.2. Parametric Analysis
An extensive parametric analysis was carried out in order to study a vast pool of
differently designed residential buildings. A single-family house with 162 m2 of net floor
area and a volume of 486 m3 was chosen as the groundwork for the analysed energy
models. Several building-related input parameters were fixed as constant for all the
models considering the EN 16798-1 standard [46], meaningfully limiting the number of
total possible combinations. Accordingly, the heating and cooling set-points were set
to 21 ◦ C and 26 ◦ C, respectively, while the indoor temperature was controlled via the
operative temperature. The summation of infiltration and natural ventilation was set to
0.60 h−1 (April till October) and to 0.375 h−1 (November till March). Internal heat gains
and occupancy schedules were set according to EN 16798-1, Annex C [46]. Our previous
analyses [47] have shown that external window shading is a crucial element of high energy
performing bioclimatic buildings and was therefore not parametrised. It was set to blockSustainability 2021, 13, 6791 5 of 17
direct solar beams from April till October when incident solar radiation on the window
was higher than 130 W/m2 and external air temperature higher than 16 ◦ C. The external
thermal emissivity of all opaque building elements was set to 0.80.
The following variable input parameters were selected: opaque envelope thermal
transmittance (UO ), window thermal transmittance (UW ) and the paired solar heat gain co-
efficient (SHGC), window to floor ratio (WFR), window distribution (Wdis ), building shape
expressed through shape factor (f0 ), diurnal heat storage capacity (DHC) of load-bearing
construction, external surface solar absorptivity (αsol ), and summer natural ventilation
cooling rate (NVC ) (see Table 1).
Table 1. Variable input parameters.
Parameter Parameter Range
UO [W/m2 K] 0.10–1.00
UW [W/m2 K] (paired SHGC [-]) 0.60 (0.45)–2.40 (0.75)
WFR [%] 5.0–45.0
Wdis [-] 0.00, 1.00 a
f0 [m−1 ] 0.78 (compact), 0.80 (semi-compact), 1.08 (non-compact)
63 (cross laminated timber), 98 (brick), 146
DHC [kJ/m2 K] b
(concrete/stone)
αsol [-] 0.20–0.80
NVC [h−1 ] c 0.0–8.0
total number of models 496,800
a 0.00 = equal area of windows at all orientations, 1.00 = south-concentrated windows (3.75% of WFR is distributed
among all other orientations); b DHC is determined according to the principles presented by Bergman et al. [48];
c NV is applied between April and October when the following conditions are met: internal air temperature
C
is > 24 ◦ C, external air temperature is between 16 and 30 ◦ C, and temperature difference between internal and
external air is ≤4 K.
Given the above-presented constant and variable building parameters, building energy
models were formed in EnergyPlus [49]. Each model was divided into four thermal zones
according to each cardinal axis. The jEPlus [50] software was used to conduct the parametric
analysis. The annual building energy use for heating (QNH ) and cooling (QNC ) per square
meter of floor area was calculated to evaluate the performance of each building model. Both
QNH and QNC values represent the necessary thermal energy that needs to be delivered
(or extracted in the case of cooling) to the thermodynamic system of a building in order
to reach the specified internal thermal conditions. Therefore, these values do not reflect
the effects of heating and cooling systems or specific fuels that would be used for running
them. For a detailed explanation of the definition of building models, see the paper by
Pajek and Košir [51], where the same methodology was used.
2.3. Energy Performance Evaluation
The annual energy use for heating (QNH ) and cooling (QNC ) of each building model
was evaluated in relation to the Slovenian Rules on the efficient use of energy in build-
ings [52], which implements the EPBD requirements at the national level. These rules apply
to all new buildings and all buildings being renovated or retrofitted, where at least 25% of
the thermal envelope surface is retrofitted. The rules provide the highest allowed QNH of a
residential building per square meter of conditioned floor area, given by Equation (1):
QNH ≤ 45 + 60 × f0 − 4.4 × TL (1)
where QNH is annual building energy use for heating in kWh/m2 , f0 is the ratio between
the area of the thermal envelope of the building and the net heated volume of the building
in m−1 (i.e., building shape factor), and TL is the average annual outdoor air temperature
at the location in ◦ C. TL for Ljubljana (1981–2010) is 10.7 ◦ C [53].
Although the maximum allowed energy for heating depends on the building shape
and location, the Rules on the efficient use of energy in buildings [52] limit the QNC perSustainability 2021, 13, 6791 6 of 17
square meter of the cooled area to 50 kWh/m2 , regardless of building shape and location.
Table 2 shows the energy use limits, given the three different building shapes used in the
study. The compliance of the building energy use with these rules was evaluated for the
climate data, representing the period 1981–2010, since these are the climate data used in
current energy efficiency analyses in practice.
Table 2. Building energy use upper limit according to the Slovenian Rules on the efficient use of
energy in buildings by building shape [52] for the location of Ljubljana, Slovenia.
f0 QNH Limit QNC Limit
0.78 (compact) ≤44.7 kWh/m2
0.80 (semi-compact) ≤45.9 kWh/m2 ≤50.0 kWh/m2
1.08 (non-compact) ≤62.7 kWh/m2
Furthermore, building models were classified into energy efficiency classes. They
were given labels based on the Slovenian EPC classification (Rules on the methodology of
production and issuance of energy performance certificates for buildings [54]). According
to Slovenian rules, the EPC labels are based only on QNH value. However, in the conducted
study, each model was also labelled according to the QNC value using the same method-
ology and criteria as for the QNH . The EPC labels, colour markings, and corresponding
building energy use ranges are presented in Table 3.
Table 3. Energy Performance Certificate efficiency classification [54].
Label Energy Use [kWh/m2 ] Label Colour
A1 Q ≤ 10
A2 10 < Q ≤ 15
B1 15 < Q ≤ 25
B2 25 < Q ≤ 35
C 35 < Q ≤ 60
D 60 < Q ≤ 105
E 105 < Q ≤ 150
F 150 < Q ≤ 210
G Q > 210
2.4. Overheating Vulnerability Analysis
The vulnerability of building models to overheating was assessed by conducting a ro-
bustness analysis presented by Kotireddy et al. [34] using a minimax regret method. In this
method, the performance regret for each climate scenario is the difference in performance
between a building design and the best performing design in a given scenario. The maxi-
mum performance regret of a design across all scenarios is the measure of its robustness.
Thus, the most robust design is the design with the lowest maximum performance regret.
The minimax regret method can be explained through Equations (2)–(4).
Rmax,i = max Ri1 , Ri2 , . . . , Rij (2)
Rij = PIij − Aj (3)
Aj = min PI1j , PI2j , . . . , PIij (4)
where Rmax,i is the maximum performance regret of the i-th building model, Rij is the
performance regret of the i-th building model in climate scenario j, Aj is the minimum
value of the performance indicator in climate scenario j, and PIij is the performance indicator
of the i-th building model in climate scenario j. Here, i = 1–496,800 and j = 1–4 since the
performed parametric analysis resulted in 496,800 individual building models simulated
through four different climate scenarios. As a performance indicator (i.e., PI), the increase in
energy use for cooling (i.e., ∆QNC ) vis-à-vis the QNC in the 1981–2010 climate was selectedSustainability 2021, 13, 6791 7 of 17
and was calculated for each building model in each future climate scenario, namely 2011–
2040, 2041–2070, and 2071–2100 climate (see Section 2.1. Location and climate). Then,
the building model with the highest climate change vulnerability, and thus the lowest
robustness, was identified through Equation (5):
Vmax = max(Rmax,i ) (5)
where Vmax is the most vulnerable design.
Furthermore, the overheating vulnerability score (OV score) was calculated by nor-
malising the performance regret of each building model with the performance regret of
the most vulnerable building model. The building model with the lowest OV score (i.e.,
equal to 0) is the least vulnerable (i.e., the most robust), and the building model with the
highest OV score (i.e., equal to 1) is the most vulnerable to climate change in terms of
overheating vulnerability.
3. Results
3.1. Energy Efficiency
The parametrically simulated building energy models were evaluated concerning the
compliance with the Slovenian Rules on the efficient use of energy in buildings. This was
done to assess the possibility of meeting the requirements of these rules using exclusively
the analysed bioclimatic (i.e., passive) design measures without using any active measures,
such as mechanical heat recovery ventilation. The conformity with the rules was evaluated
for the 1981–2010 period since these are the climate data used in current energy efficiency
compliance assessments in Slovenia. The results showed that 15.7% of simulated building
models were compliant with the maximum permissible heating energy use (i.e., QNH )
criteria (see Table 2). The median QNH of the energy-rule-compliant building models was
42.7 kWh/m2 , and the absolute best-performing model had a QNH equal to 24.1 kWh/m2 .
However, the QNH threshold is related to f0 of a particular building (see Table 2), which
resulted in the fact that compliance with the QNH criteria was easier achieved in the case of
a less compact building design. Namely, the criteria were met in 22.5%, 13.5%, and 11.8%
of building models with a non-compact (i.e., f0 = 1.08), a semi-compact (i.e., f0 = 0.80), and
a compact (i.e., f0 = 0.78) shape, respectively. At this point, caution should be exercised
in generalizing the above-stated results. The described phenomenon is a consequence
of the methodology used to determine the threshold QNH (see Equation (1)) given in the
Slovenian Rules on the efficient use of energy in buildings and not of better energy response
of such building shape. In general, all the models meeting or surpassing the criteria of QNH
have an equal or lower value of UO than 0.25 W/m2 K. The other parameters are normally
distributed. The cooling energy use (QNC ) criterion (see Table 2) was achieved in all the
analysed models since the highest QNC of simulated models for the 1981–2010 period was
34.1 kWh/m2 . The QNC of the analysed building models is projected to exceed the limit of
50 kWh/m2 for the first time in the 2041–2070 period.
Furthermore, in order to gain a better insight into energy efficiency, the simulated
building models in each of the analysed climate periods were classified according to the
Slovenian Rules on the methodology of production and issuance of energy performance
certificates for buildings (Figure 1). In general, the results in Figure 1 show that using the
selected passive design measures results in building models with relatively satisfactory en-
ergy efficiency. Although none of the analysed building models was classified into heating
energy efficiency classes A1 (i.e., QNH < 10 kWh/m2 ) and A2 (i.e., 10 < QNH > 15 kWh/m2 ),
either under the current or the future climate file, all the other classes (i.e., B1 through G)
are represented (Figure 1). Under the influence of the projected climate change, the heating
energy efficiency of the analysed buildings is projected to increase over time. The share
of building models with higher heating energy efficiency (i.e., classes B1, B2 and C) is
increasing. Accordingly, the share of less energy-efficient models is decreasing (i.e., classes
D, E, F and G). This means that during the 1981–2010 period, roughly 28% of building
models were in class C or higher (QNH < 60 kWh/m2 ), while for the 2071–2100 period, thisthrough G) are represented (Figure 1). Under the influence of the projected climate
change, the heating energy efficiency of the analysed buildings is projected to increase
over time. The share of building models with higher heating energy efficiency (i.e., classes
Sustainability 2021, 13, 6791
B1, B2 and C) is increasing. Accordingly, the share of less energy-efficient models is8 de- of 17
creasing (i.e., classes D, E, F and G). This means that during the 1981–2010 period, roughly
28% of building models were in class C or higher (QNH < 60 kWh/m2), while for the 2071–
2100 period, this share almost doubled to 54%, an increase of 26 percentage points (p.p.).
share almost in
Furthermore, doubled to 54%, period,
the 1981–2010 an increase
onlyof3726(i.e.,
percentage points (p.p.).
0.01%) building models Furthermore,
can be classi-in
the under
fied 1981–2010 period,
heating onlyefficiency
energy 37 (i.e., 0.01%)
label B1building
(i.e., 15models
< QNH >can be classified
25 kWh/m under
2), while thisheating
num-
energy
ber efficiency
increases label(i.e.,
to 13,740 B1 (i.e.,
2.77%)15 cases
< QNHin>the kWh/m2 ),period.
25 2071–2100 while this numberthe
In general, increases
most ex-to
13,740 (i.e., 2.77%) cases in the 2071–2100 period. In general, the most
tensive changes in the shares of building models in individual heating energy efficiency extensive changes
in the shares
classes between of the
building models
1981–2010 andin 2071–2100
individualperiods
heating canenergy efficiencyfor
be observed classes
classbetween
B2 and
the 1981–2010
class andof
F, an increase 2071–2100
13 p.p. inperiods
the former canand
be observed
a decrease forofclass B2in
12 p.p. and
theclass F, Moreover,
latter. an increase
of 13 p.p. in
concerning the
the former and
analysed a decrease
building modelofpopulation,
12 p.p. in theit islatter. Moreover,
projected concerning
that there the
will be no
analysed building model population, it is projected that there will be
more models with a G heating energy efficiency label in the 2041–2070 period and beyond no more models with
a G heating
(Figure 1). energy efficiency label in the 2041–2070 period and beyond (Figure 1).
Figure 1. Share of total simulated models by heating and cooling energy label for each period.
Figure 1. Share of total simulated models by heating and cooling energy label for each period.
Taking the 1981–2010 period as a starting point, the QNH is expected to decrease by
24–39%Taking
untilthe
the1981–2010
end of theperiod as with
century, a starting point,decrease
an average the QNH of is 32%.
expected
Tableto4decrease
presents by
the
24–39% until the end of the century, with an average decrease of 32%. Table
limits (i.e., variance) of building model parameters necessary for achieving a specific heat- 4 presents the
limits (i.e., variance)
ing energy efficiencyoflabel.
building
It canmodel parameters
be considered thatnecessary
in order toforclassify
achievingone aofspecific heat-
the analysed
ing energymodels
building efficiency label.
under theItB1can be considered
heating that in order
energy efficiency labeltoduring
classifytheone of the analysed
1981–2010 climate,
one maymodels
building choose from
undera therelatively limited
B1 heating pool of
energy choices (i.e.,
efficiency labelmin-max
during the range of a specific
1981–2010 cli-
parameter).
mate, one may The latterfrom
choose applies to the range
a relatively of all
limited poolinvestigated variable
of choices (i.e., parameters
min-max range of(see
a
Table 4, B1). The other heating energy classes offer more “freedom of choice”
specific parameter). The latter applies to the range of all investigated variable parameters concerning
the variance
(see of analysed
Table 4, B1). The other passive design
heating measures.
energy classes offer more “freedom of choice” con-
cerning Furthermore,
the varianceconcerning
of analysedthe cooling
passive energy
design use of the analysed building models,
measures.
good cooling energy efficiency can be achieved using passive design measures under the
Ljubljana climate. For the 1981–2010 period, the majority (i.e., 89%) of building models can
be classified into the A1 cooling energy-efficient label, while the remaining 11% fall at least
in class B2 (i.e., 25 < QNC > 35 kWh/m2 ). However, the cooling energy efficiency of the
analysed buildings is projected to decrease significantly over time. The share of the most
energy-efficient building models (i.e., label A1) is projected to decrease by 66 p.p. between
1981–2010 and 2071–2100 periods with the A2, B1, B2 and C cooling energy efficiency labels
increasing proportionally (Figure 1). After the 2041–2070 period, building models classified
under labels C (5% in 2071–2100 period) and D (0.01% in 2071–2100 period) appear, which
were not present before. Therefore, by the end of the 21st century, the QNC of each building
model is expected to increase by at least 59%, compared to the 1981–2010 period. For some
instances, the QNC increased from zero in 1981–2010 to up to 10 kWh/m2 by the end of
the 21st century. Table 5 presents the limits (i.e., variance) of building model parameters
necessary for achieving a specific cooling energy efficiency label under the 2071–2100 climate
file. In order to maintain the A1 cooling energy efficiency label in the future, the “freedom of
choice” (i.e., min-max range) for the values of the varied parameters is not as limited as for
heating energy use. Nevertheless, lower than the entire sample average UW , WFR, and αsol ,
and higher than average DHC and NVC should be used.Sustainability 2021, 13, 6791 9 of 17
Table 4. Typical building parameter values by heating energy label using the 1981–2010 climate file (i.e., “current” label).
Heating Energy Label in the 1981–2010 Period
Variable (i.e., “Current” Label)
Parameter
B1 B2 C D E F G Entire Sample Average
mean 0.10 0.10 0.16 0.34 0.63 0.90 0.99 0.43
UO [W/m2 K] min 0.10 0.10 0.10 0.10 0.30 0.50 0.80 0.10
max 0.10 0.15 0.40 0.80 1.00 1.00 1.00 1.00
mean 0.60 0.86 1.40 1.56 1.54 1.57 1.60 1.50
UW [W/m2 K] min 0.60 0.60 0.60 0.60 0.60 0.60 0.60 0.60
max 0.60 1.80 2.40 2.40 2.40 2.40 2.40 2.40
mean 41.2 29.4 24.5 25.2 24.6 22.8 19.7 24.6
WFR [%] min 35.0 10.0 5.0 5.0 5.0 5.0 5.0 5.0
max 45.0 45.0 45.0 45.0 45.0 45.0 45.0 45.0
mean 1.00 0.75 0.48 0.42 0.43 0.45 0.39 0.45
Wdis [-] min 1.00 0.00 0.00 0.00 0.00 0.00 0.00 0.00
max 1.00 1.00 1.00 1.00 1.00 1.00 1.00 1.00
mean 0.79 0.81 0.85 0.87 0.88 0.90 1.07 0.88
f0 [m−1 ] min 0.78 0.78 0.78 0.78 0.78 0.78 0.80 0.78
max 0.80 1.08 1.08 1.08 1.08 1.08 1.08 1.08
mean 146 109 104 102 102 101 100 102
DHC [kJ/m2 K] min 146 63 63 63 63 63 63 63
max 146 146 146 146 146 146 146 146
mean 0.75 0.55 0.52 0.51 0.50 0.46 0.34 0.50
αsol [-] min 0.60 0.20 0.20 0.20 0.20 0.20 0.20 0.20
max 0.80 0.80 0.80 0.80 0.80 0.80 0.80 0.80
Table 5. Typical building parameter values by cooling energy label using the 2071–2100 climate file.
Cooling Energy Label in the 2071–2100 Period
Variable (i.e., Projected Label)
Parameter
A1 A2 B1 B2 C D Entire Sample Average
mean 0.44 0.42 0.41 0.44 0.57 0.99 0.43
UO [W/m2 K] min 0.10 0.10 0.10 0.10 0.10 0.80 0.10
max 1.00 1.00 1.00 1.00 1.00 1.00 1.00
mean 1.36 1.43 1.51 1.69 1.86 2.27 1.50
UW [W/m2 K] min 0.60 0.60 0.60 0.60 0.60 1.80 0.60
max 2.40 2.40 2.40 2.40 2.40 2.40 2.40
mean 13.2 20.4 29.5 35.0 38.2 44.6 24.6
WFR [%] min 5.0 5.0 5.0 5.0 5.0 40.0 5.0
max 45.0 45.0 45.0 45.0 45.0 45.0 45.0
mean 0.49 0.46 0.37 0.46 0.52 0.92 0.45
Wdis [-] min 0.00 0.00 0.00 0.00 0.00 0.00 0.00
max 1.00 1.00 1.00 1.00 1.00 1.00 1.00
mean 0.90 0.89 0.88 0.84 0.83 0.79 0.88
f0 [m−1 ] min 0.78 0.78 0.78 0.78 0.78 0.78 0.78
max 1.08 1.08 1.08 1.08 1.08 0.80 1.08
mean 110 106 102 93 79 63 102
DHC [kJ/m2 K] min 63 63 63 63 63 63 63
max 146 146 146 146 146 63 146
mean 0.35 0.49 0.54 0.61 0.69 0.80 0.50
αsol [-] min 0.20 0.20 0.20 0.20 0.20 0.80 0.20
max 0.80 0.80 0.80 0.80 0.80 0.80 0.80
mean 4.6 4.0 3.9 3.6 3.1 2.8 4.0
NVC [h−1 ] min 0.0 0.0 0.0 0.0 0.0 0.0 0.0
max 8.0 8.0 8.0 8.0 8.0 8.0 8.0Sustainability 2021, 13, 6791 10 of 17
3.2. Climate-Change Vulnerability
The above-presented results indicate that heating energy efficiency is projected to
improve over time under the projected climate change scenario. Therefore, the overheating
vulnerability analysis for each building model was made according to the heating energy
efficiency label attainted under the 1981–2010 climate, as explained in Section 2.3. Figure 2
shows that models with different heating energy efficiency labels also have different over-
heating vulnerability score (OV score). However, since radiative forcing and global average
temperatures are projected to increase over time due to climate change, the overheating
Sustainability 2021, 13, x FOR PEER REVIEW 11 of 19
risk of buildings is expected to follow that pattern. Consequently, the OV score is highest
for buildings evaluated under the 2071–2100 climate (Figure 2).
Overheating vulnerability
Figure 2. Overheating vulnerability score
score (OV
(OV score)
score)of
ofsingle-family
single-familyhouses
housesinineach
eachfuture
futureclimate
climateperiod.
period.Building
Buildingmodels
mod-
els
areare classified
classified by heating
by heating energy
energy labellabel attained
attained according
according to1981–2010
to the the 1981–2010 climate
climate file, namely
file, namely “current”
“current” heating
heating energyenergy
label.
label.
The average OV score is projected to increase similarly for all the energy labels.
Building models OV
The average classified
score isunder the B2
projected toand C heating
increase energy
similarly efficiency
for all the energylabels display
labels. on
Build-
average
ing models theclassified
lowest susceptibility
under the B2 toand
increasing
C heatingoverheating vulnerability
energy efficiency labelsover the studied
display on av-
period.the
erage In lowest
particular, the averagetoOV
susceptibility score of the
increasing B2 label buildings
overheating increases
vulnerability overbythe0.213 from
studied
0.041 in 2011–2040 to 0.256 in 2071–2100. Simultaneously, the
period. In particular, the average OV score of the B2 label buildings increases by 0.213 min-max range increases
substantially
from 0.041 in from 0.093 in
2011–2040 to2011–2040 to 0.413 in Simultaneously,
0.256 in 2071–2100. 2071–2100. Although the lowerrange
the min-max average
in-
OV score in 2041–2070 and 271–2100 periods are reached for
creases substantially from 0.093 in 2011–2040 to 0.413 in 2071–2100. Although the lower the G labelled buildings,
these buildings
average OV score are
inalso characterised
2041–2070 by oneperiods
and 271–2100 of the highest min-max
are reached ranges
for the (i.e., 0.971
G labelled build-in
2071–2100).
ings, Consequentially,
these buildings are also this indicates that
characterised theyofhave
by one the on average
highest a low overheating
min-max ranges (i.e.,
risk, although
0.971 in 2071–2100).individual building configurations
Consequentially, this indicates canthat betheyvery
havesusceptible
on average toait.lowThe OV
over-
score min-max range is the narrowest in most heating energy-efficient
heating risk, although individual building configurations can be very susceptible to it. The buildings (i.e.,
B1 label),
OV meaning that
score min-max range theisoverheating
the narrowest vulnerability is easier
in most heating to control for buildings
energy-efficient highly heating(i.e.,
B1 label), meaning that the overheating vulnerability is easier to control for highlywith
energy-efficient buildings. Nevertheless, it should be stressed that buildings the
heating
highest heating energy efficiency are generally not characterised
energy-efficient buildings. Nevertheless, it should be stressed that buildings with the by the lowest OV scores.
Although
highest in theenergy
heating 2011–2040 period,are
efficiency thegenerally
B1 label buildings actuallyby
not characterised have
thethe lowest
lowest OVaverage
scores.
OV score (i.e., 0.034), the reached minimum score (i.e., 0.025)
Although in the 2011–2040 period, the B1 label buildings actually have the lowest is higher than in theaverage
case of
all other heating energy efficiency labels. The described situation is projected
OV score (i.e., 0.034), the streached minimum score (i.e., 0.025) is higher than in the case of to escalate in
the second part of the 21 century when the OV score of the B1 label
all other heating energy efficiency labels. The described situation is projected to escalate buildings increases
in the second part of the 21st century when the OV score of the B1 label buildings increases
substantially (Figure 2). So much so that in the 2041–2070 period, the B2 and G labelled
buildings have a lower average OV score, while in the 2071–2100 period, the B2, C, and G
labelled buildings have lower average scores. This indicates that highly heating energy-
efficient bioclimatic buildings (i.e., B1 label) are also characterised by substantial locked-Sustainability 2021, 13, 6791 11 of 17
substantially (Figure 2). So much so that in the 2041–2070 period, the B2 and G labelled
buildings have a lower average OV score, while in the 2071–2100 period, the B2, C, and G
labelled buildings have lower average scores. This indicates that highly heating energy-
efficient bioclimatic buildings (i.e., B1 label) are also characterised by substantial locked-in
overheating risk. The main reason is that these models have south-concentrated large
window areas (i.e., WFR higher than 35%, see Table 4). On the other hand, the maximum
OV score of the B1 labelled buildings is the lowest in all periods (Figure 2). Therefore,
when using passive design measures for high heating energy efficiency, an overall lower
maximum OV score can be expected than in other designs (i.e., B2 to G labelled buildings).
The overall lowest overheating vulnerability score was achieved by a building model
having poor thermal insulation (UO = 1.0 W/m2 K, namely 2 cm of thermal insulation),
highly thermally insulated windows (UW = 0.6 W/m2 K, SHGC = 0.45), minimal window
areas (WFR = 5%), a non-compact shape (f0 = 1.08), high thermal mass (DHC = 146 kJ/m2 K),
light-coloured external surfaces (αsol = 0.20) and high rates of natural ventilation cooling
(NVC = 8 h−1 ). Its QNC is projected to increase from 0.0 kWh/m2 in the 1981–2010 period to
3.2 kWh/m2 in 2071–2100. However, the building model is highly energy inefficient from
the aspect of heating energy use (i.e., G heating energy efficiency label). On the other hand,
the most overheating vulnerable building model is characterised by poor thermal insulation
(UO = 1.0 W/m2 K), low thermally insulated windows (UW = 2.2 W/m2 K, SHGC = 0.75),
equally distributed extremely large window area (WFR = 45%), a compact shape (f0 = 0.78),
high thermal mass (DHC = 146 kJ/m2 K), dark-coloured external surfaces (αsol = 0.80)
and without natural ventilation cooling (NVC = 0 h−1 ). Its heating energy efficiency is
classified under the F label, while its QNC is projected to increase by 37.7 kWh/m2 , from
12.7 kWh/m2 in the 1981–2010 period to 50.4 kWh/m2 in 2071–2100, an increase of 297%.
Table 6 shows typical values of building parameters by OV score percentiles. It can be
concluded that, in general, the least prone to overheating (i.e., p05 in Table 6) were building
models with above-average UO , Wdis , f0 , DHC, and NVC , and below-average UW , WFR,
and αsol .
Table 6. Typical building parameter values by long-term (2071–2100) overheating vulnerability score (OV score) percentiles.
Variable Long-Term (2071–2100) OV Score Percentiles
Parameter p05 Q1 Q2 Q3 Q4 p95 Entire Sample Average
mean 0.49 0.42 0.41 0.38 0.51 0.74 0.43
UO [W/m2 K] min 0.10 0.10 0.10 0.10 0.10 0.10 0.10
max 1.00 1.00 1.00 1.00 1.00 1.00 1.00
mean 1.30 1.35 1.40 1.51 1.74 1.78 1.50
UW [W/m2 K] min 0.60 0.60 0.60 0.60 0.60 0.60 0.60
max 2.40 2.40 2.40 2.40 2.40 2.40 2.40
mean 9.6 13.8 20.8 29.6 34.0 34.2 24.6
WFR [%] min 5.0 5.0 5.0 5.0 5.0 5.0 5.0
max 40.0 45.0 45.0 45.0 45.0 45.0 45.0
mean 0.49 0.52 0.46 0.42 0.38 0.26 0.45
Wdis [-] min 0.00 0.00 0.00 0.00 0.00 0.00 0.00
max 1.00 1.00 1.00 1.00 1.00 1.00 1.00
mean 0.94 0.89 0.89 0.87 0.85 0.85 0.88
f0 [m−1 ] min 0.78 0.78 0.78 0.78 0.78 0.78 0.78
max 1.08 1.08 1.08 1.08 1.08 0.80 1.08
mean 114 108 106 100 95 85 102
DHC [kJ/m2 K] min 63 63 63 63 63 63 63
max 146 146 146 146 146 63 146
mean 0.24 0.35 0.49 0.51 0.64 0.74 0.50
αsol [-] min 0.20 0.20 0.20 0.20 0.20 0.80 0.20
max 0.80 0.80 0.80 0.80 0.80 0.80 0.80
mean 4.7 4.7 4.0 3.9 3.4 3.3 4.0
NVC [h−1 ] min 0.0 0.0 0.0 0.0 0.0 0.0 0.0
max 8.0 8.0 8.0 8.0 8.0 8.0 8.0Sustainability 2021, 13, 6791 12 of 17
4. Discussion
In the bioclimatic design of buildings, the decision-making conditions are diverse,
with several design objectives and criteria to be considered, particularly occupant comfort,
energy efficiency, and daylighting [55–57]. In practice, trade-offs between these goals
are very common, which need to be addressed appropriately. Only the energy efficiency
aspect for providing thermal comfort was undertaken as a central part of this study, while
occupant thermal comfort, indoor air quality and daylighting were not directly addressed.
Therefore, the presented results should be interpreted in the exposed context. Similarly, the
results should be understood in the framework of the applied passive design parameters
and their value ranges. At the same time, several other design measures, such as evapora-
tive cooling, fixed shading, sunspace, ground heat exchanger cooling, etc., were excluded
from the analysis. Their exclusion from the analysis was based on the fact that they are ei-
ther not common in the design practice (e.g., ground heat exchanger cooling) or ineffective
(e.g., evaporative cooling) in the studied climatic context. Under these circumstances, the
paper aimed to analyse the energy efficiency and overheating vulnerability of bioclimatic
single-family houses in the Central European climate of Slovenia, Ljubljana. The energy
efficiency was evaluated according to the annual energy use for heating (QNH ) and cooling
(QNC ) per m2 of building floor area. According to the Slovenian building energy efficiency
rules, a B1 heating energy efficiency class was the highest achievable using the selected pas-
sive design parameters under the currently applicable climate file (i.e., 1981–2010 period)
and the projected future climate scenarios. Nevertheless, a much warmer future climate is
projected to improve the heating energy efficiency of such buildings because the energy
needed for heating is projected to decrease.
Furthermore, it was highlighted that given the uncertainties of future climate, it
is advisable to design buildings for current heating energy efficiency while aiming for
low vulnerability to future overheating. Accordingly, Figure 3 displays three conceptual
examples of a bioclimatic building designed for the analysed Central European temperate
climate of Ljubljana. These three concepts were proposed after the interpretation of the
study results. The first building (Figure 3a) corresponds to the B1 label heating energy
efficiency with simultaneously the lowest overheating vulnerability score (OV score) of
the buildings in the B1 energy label. Next, Figure 3b shows the building design, which
meets the B2 label heating energy efficiency with the lowest OV score of the buildings
in the B2 energy label. The last building (Figure 3c) is the least overheating vulnerable
building design of the buildings that fall into the C label according to the heating energy
efficiency. The QNH value of each exposed building example intensifies from 24.7 kWh/m2
(building B1) to 49.0 kWh/m2 (building C) according to the 1981–2010 climate. At the same
time, the QNC follows the reverse trend. Namely, according to the 2071–2100 climate, the
QNC is highest for building B1 (18.6 kWh/m2 ) and lowest for building C (4.1 kWh/m2 ).
Although the best performing concept concerning the heating energy efficiency is
the B1 building design (Figure 3a), it has several drawbacks regarding bioclimatic design.
According to Potočnik and Košir [58], window size and glazing transmissivity are the
dominant parameters to achieve adequate visual and non-visual indoor comfort. Therefore,
vast south-concentrated window areas present a significant daylighting related drawback
since they would be mainly shaded during summer. In contrast, during the rest of the year,
glare might occur while utilising solar gains. On the other hand, building C, shown in
Figure 3c, has minimal windows, resulting in potentially inadequate daylighting. It is also
less heating energy-efficient than the other two presented design alternatives. Moreover,
while using the WFR of 35% (Figure 3a), a natural summer ventilation rate (i.e., NVC )
above 4 h−1 is recommended to achieve lower overheating vulnerability, which is, in reality,
very hard and rarely achievable in residential buildings [59]. Although high-intensity
natural ventilation is also preferred in the case of building B2 (Figure 3b), it is not as crucial.
The reason is that building B2 has a smaller WFR, and thus solar heat gains and indoor
surface temperatures are more governable. In all the best performing three cases, the lowest
analysed UO and UW were used.Sustainability 2021, 13, 6791 13 of 17
Figure 3. Three conceptual examples of bioclimatic building design for the analysed location. Examples represent a building of
the most overheating resilient combination of passive measures for a building in: (a) B1 heating energy efficiency class; (b) B2
heating energy efficiency class; (c) C heating energy efficiency class. Each building has a useful floor area equal to 162 m2 .
Another fact worth noting is that the difference in QNH between different examples
in Figure 3 is projected to halve by the end of the century, while the difference in QNC isSustainability 2021, 13, 6791 14 of 17
projected to double or triple. Assume both heating and cooling energy use (i.e., QNH +
QNC ) of the three buildings are taken together. In this case, it becomes evident that building
B1 (QNH + QNC = 31.4 kWh/m2 ) is the best performing in the 1981–2010 period, while
building B2 (QNH + QNC = 28.7 kWh/m2 ) is the best performing and building B1 is the
worst performing (QNH + QNC = 35.6 kWh/m2 ) in the 2071–2100 period. Furthermore,
of the three, building B1 is the only one with higher cumulative heating and cooling
energy use in the 2071–2100 period compared to the 1981–2010 period. Therefore, to
achieve adequate heating energy efficiency, assure low overheating vulnerability, and
at the same time create conditions for adequate daylighting, the combination of passive
design measures presented in the case of building B2 (Figure 3b) or similar should be used.
Of course, the highlighted findings are limited to the building geometries and envelope
configurations considered. Therefore, substantially differently configured buildings may
be designed while being aware of their effects on energy use.
Accordingly, it is recommended to use highly thermally insulated building envelopes,
especially windows. Furthermore, not too large window areas should be adopted, e.g.,
WFRs in the range of 10–25%. The windows can be concentrated on the south façade
(e.g., window to wall ratio (WWR) between 20 and 60%) for autumn–spring solar harvest-
ing. South concentrated windows also prevent unwanted solar gains in the forenoon and
the afternoon during summer. Accordingly, fixed overhangs on the south façade can be
used for partial shading. However, in the case of south-concentrated windows, external
shading (e.g., blinds) of the entire glazed surface for overheating prevention should be
applied. Furthermore, shading operation should be automatically controlled since the
overheating risk would be higher if shading devices were manually controlled by occu-
pants [60]. Concerning the building shape, a more compact design is recommended. It is
also suggested to use massive construction materials to increase the thermal capacity of the
building. Otherwise, the thermal mass should be added in other forms, such as capacitive
furniture [61] or phase change materials [62]. Although the B1 heating energy efficiency
class can only be achieved using dark coloured external surfaces, it is recommended to use
lighter colours (e.g., αsol = 0.40–0.60) that reduce overheating vulnerability. Alternatively,
vegetated surfaces (see Figure 3c) [63] or “cool” surface finishes [64] may be used to act as
an effective overheating prevention measure. It is advisable to cool spaces using natural
ventilation in summer when conditions allow, typically during the night. To this end, cross
ventilation or stack ventilation of the building should be made possible by the appropriate
arrangement of rooms and openings.
In addition to the presented and proposed passive design measures, additional either
active or passive measures could be applied to reduce the energy use of a building. In
particular, heating energy efficiency can be further improved by applying the heat recovery
mechanical ventilation, improving the airtightness of the envelope, optimising occupant
behaviour and similar. Besides, renewable energy sources, such as solar energy through PV
or BIPV systems or solar collectors, are advisable [65]. In either case, an emphasis should
be placed on long-term overheating vulnerability and not just current heating and cooling
energy efficiency. In this way, high resilience and sustainability of the built environment
may be achieved, primarily by raising the awareness of designers and policymakers.
5. Conclusions
Our civilisation faces the same frustration as the first humans—a struggle to build
homes that provide safety and climate independence. As the presented research has
demonstrated, the effort continues, while we still have a lot to learn about global warming
and its implications for the (energy) performance of the built environment, especially
with a limited amount of natural resources. The study successfully demonstrated a novel
approach to the bioclimatic design of buildings by attaining current and future energy
efficiency while also addressing climate adaptation and overheating resistance. The results
of this paper clarify the overall picture concerning the design of bioclimatic residentialSustainability 2021, 13, 6791 15 of 17
buildings in the Central European climate. The main conclusions and novelty of the paper
can be summarised as:
• The paper demonstrates how to assess overheating vulnerability of bioclimatic build-
ings. In Central Europe, overheating vulnerability is a significant but often overlooked
concern in building design, as designers and policymakers focus primarily on heating
energy efficiency. However, overheating vulnerability assessment is required since
climate change is projected to negatively affect the cooling energy need of buildings,
especially those designed for passive solar energy harvesting during the colder part
of the year.
• Recommendations for the energy-efficient resilient bioclimatic building design in
Central European temperate climate are given. Such recommendations are needed
because residential buildings under this climate are heating-dominated, and with a
warming climate comes the risk of overheating. Nevertheless, adapting buildings to
current heating energy efficiency requirements while aiming for low vulnerability to
future overheating can be achieved with reasonable trade-offs presented in the paper.
• Lastly, the results provide designers and policymakers with information to adopt a
resilient bioclimatic building design approach into practice and regulations. A clear
path towards the resilience and sustainability of buildings should be defined according
to the study findings to preserve resources and mitigate climate change.
Author Contributions: Conceptualization, L.P. and M.K.; methodology, L.P. and M.K.; software, L.P.;
validation, L.P. and M.K.; formal analysis, L.P.; investigation, L.P.; resources, M.K.; data curation,
L.P.; writing—original draft preparation, L.P.; writing—review and editing, M.K.; visualization, L.P.;
supervision, M.K. Both authors have read and agreed to the published version of the manuscript.
Funding: This research was funded by the Slovenian Research Agency (research core funding
No. P2—0158).
Institutional Review Board Statement: Not applicable.
Informed Consent Statement: Not applicable.
Data Availability Statement: The data presented in this study are available on request from the
corresponding author. The data are not publicly available as they are not stored on a publicly
accessible repository.
Conflicts of Interest: The authors declare no conflict of interest.
References
1. Košir, M. Climate Adaptability of Buildings: Bioclimatic Design in the Light of Climate Change; Springer International Publishing:
Cham, Switzerland, 2019; ISBN 978-3-030-18455-1.
2. Almusaed, A. Biophilic and Bioclimatic Architecture: Analytical Therapy for the Next Generation of Passive Sustainable Architecture;
Springer: London, UK, 2011; ISBN 978-1-84996-533-0.
3. Krainer, A. Passivhaus contra bioclimatic design. Bauphysik 2008, 393–404. [CrossRef]
4. Szokolay, S.V. Introduction to Architectural Science: The Basis of Sustainable Design, 3rd ed.; Routledge: Oxfordshire, UK, 2014;
ISBN 978-0-415-82498-9.
5. Maciel, A.A.; Ford, B.; Lamberts, R. Main influences on the design philosophy and knowledge basis to bioclimatic integration
into architectural design—The example of best practices. Build. Environ. 2007, 42, 3762–3773. [CrossRef]
6. Desogus, G.; Felice Cannas, L.G.; Sanna, A. Bioclimatic lessons from Mediterranean vernacular architecture: The Sardinian case
study. Energy Build. 2016, 129, 574–588. [CrossRef]
7. Oikonomou, A.; Bougiatioti, F. Architectural structure and environmental performance of the traditional buildings in Florina,
NW Greece. Build. Environ. 2011, 46, 669–689. [CrossRef]
8. Yang, L.; Yan, H.; Lam, J.C. Thermal comfort and building energy consumption implications–A review. Appl. Energy 2014, 115,
164–173. [CrossRef]
9. Halhoul Merabet, G.; Essaaidi, M.; Ben Haddou, M.; Qolomany, B.; Qadir, J.; Anan, M.; Al-Fuqaha, A.; Abid, M.R.; Benhaddou,
D. Intelligent building control systems for thermal comfort and energy-efficiency: A systematic review of artificial intelligence-
assisted techniques. Renew. Sustain. Energy Rev. 2021, 144, 110969. [CrossRef]
10. Pajek, L.; Košir, M. Can building energy performance be predicted by a bioclimatic potential analysis? Case study of the
alpine-adriatic region. Energy Build. 2017, 139, 160–173. [CrossRef]You can also read