2020 Energy Storage Assessment Study - Black Hills Energy April 28, 2020 Principal Investigators - Tri-State ...
←
→
Page content transcription
If your browser does not render page correctly, please read the page content below
Appendix O
                                                           Proceeding No. 20M-0008E

                                2020 Energy Storage
                                Assessment Study
                                Black Hills Energy
                                April 28, 2020
Colorado PUC E-Filings System

                                                     Principal Investigators
                                                         Lukas Rowland, PE
                                                        Tomas Vazquez, PE
Appendix O
Proceeding No. 20M-0008E
Appendix O
                                                                                                                  Proceeding No. 20M-0008E
                                                                                           2020 Energy Storage Assessment Study
                                                                                                               Black Hills Energy

                                                                   Contents
1       Introduction .................................................................................................................................... 3
2       Energy Storage Technology Overview............................................................................................ 3
        2.1      Battery Technology............................................................................................................... 4
                 2.1.1 Lithium-ion ............................................................................................................... 4
                 2.1.2 Vanadium Redox Flow ............................................................................................. 7
        2.2      Other Emerging Technologies .............................................................................................. 8
3       Energy Storage as a Non-Wires Alternative.................................................................................. 10
        3.1      Definition ............................................................................................................................ 10
        3.2      Examples ........................................................................................................................... 11
4       Cost Assessment ......................................................................................................................... 12
        4.1      Trends ................................................................................................................................ 12
        4.2      BESS Cost Estimation ........................................................................................................ 13
5       Upgrade Deferment Valuation ...................................................................................................... 18
6       References .................................................................................................................................. 20
7       Appendix...................................................................................................................................... 22
        7.1      Project Team ...................................................................................................................... 22

                                                                      Tables
Table 1: Summary of compiled 2018 findings and 2025 predictions of cost and parameter ranges
        by technology type - BESS (PNNL, 2019).................................................................................. 14

                                                                     Figures
Figure 1. Cost Projections for 4-hour Battery Energy Storage Systems .................................................. 13
Figure 2: BESS CapEx vs Duration........................................................................................................ 15
Figure 3: Li-ion vs Flow BESS Installed Cost ......................................................................................... 16
Figure 4: Specific Capital Cost vs BESS Size ........................................................................................ 17
Figure 5: Flow Chart for Deferment Cost-Benefit Analysis ...................................................................... 19
Figure 6: Deferment Benefit vs Deferment Years (IEEE Example).......................................................... 20

                                              Acronyms and Abbreviations
                  AHJ                                                                 Authority Having Jurisdiction
                  BESS                                                                Battery Energy Storage Systems
                  BHE                                                                 Black Hills Energy
                  CAES                                                                Compressed Air Energy Storage
                  CapEx                                                               Capital Expenditure
                  CPUC                                                                Colorado Public Utilities Commission
                  DOD                                                                 Depth of Discharge
                  ESS                                                                 Energy Storage System

                                                                                                                                      April 12, 2019 | i
Appendix O
Proceeding No. 20M-0008E
2020 Energy Storage Assessment Study
Black Hills Energy
HMMP Hazardous Material Management Plan
HMA Hazard Mitigation Analysis
LFP Lithium-Iron-Phosphate
Li-ion Lithium-ion
LTO Lithium-Titanate
MW Megawatt
MWh Megawatt-hour
NMC Nickel-Manganese-Cobalt
NPV Net Present Value
NWA Non-Wires Alternative
PHES Pumped Hydropower Energy Storage
PCS Power Conversion System
PNNL Pacific Northwest National Laboratory
RTE Round Trip Efficiency
T&D Transmission & Distribution
VrB Vanadium Redox Battery
VAR Volt-Ampere Reactive
ii | April 12, 2019Appendix O
Proceeding No. 20M-0008E
2020 Energy Storage Assessment Study
Black Hills Energy
1 Introduction
Black Hills Energy (BHE) is investigating energy storage as part of its efforts to comply
with the Colorado Public Utilities Commission (CPUC) Rules 3206 (Transmission) and
3207 (Distribution). These rules require that BHE consider energy storage in its planning
process as an alternative to construction or extension of transmission/distribution facilities.
The use of energy storage for this application is an example of what are commonly referred
to as “Non-Wires Alternatives” (NWAs). Energy storage technology has advanced
considerably in recent years in both technical aptitude and reduced cost, which has led to
increasing interest amongst electric utilities in the deployment of energy storage systems,
in place of more conventional transmission and distribution solutions.
This report provides a technical overview of the current state of the energy storage
industry, including types of commercially available energy storage technology that may be
applicable as NWAs in BHE’s transmission and distribution planning processes. Key
characteristics that influence the design, cost, and performance of energy storage projects
are discussed. An overview of how energy storage systems can be used as NWAs is also
presented, including specific examples from real-world projects.
In order to establish a quantifiable basis of comparison between energy storage systems
and conventional T&D facilities, an approximation of installed cost for Li-ion battery energy
storage systems is included. Li-ion battery technology is chosen for this cost assessment,
as it is the most prevalent and widely deployed energy storage technology for systems of
this scale and for this purpose.
The final part of this report includes a summary comparison table for the purpose of directly
comparing energy storage systems to conventional T&D facilities on the basis of both
technical and economic feasibility. This table will compare “typical” energy storage system
parameters to specific examples of BHE projects from past planning periods.
2 Energy Storage Technology Overview
Disclaimer: It is not the intention of this report to endorse or promote any specific vendor,
but to incorporate a wider picture of energy storage technology as applied to utilities and
specifically to BHE.
There are a wide assortment of Energy Storage System (ESS) technologies available for
utility-scale applications. A few of these options have reached commercial maturity and
are being deployed regularly today. Historically, the vast majority of ESS that have been
installed to date are pumped hydropower energy storage systems (PHES). This is a very
mature and well established technology; however, the specific geotechnical requirements
and long installation times for PHES make it unsuitable for consideration as a NWA for
most applications. Therefore, PHES will not be discussed further in this report.
April 28, 2020 | 3Appendix O
Proceeding No. 20M-0008E
2020 Energy Storage Assessment Study
Black Hills Energy
Advancements in battery cell technology, largely due to the immense demand for
lightweight and energy dense batteries for portable electronics, have opened the door to
applying the same technology to very large scale stationary storage applications. The last
decade has seen a steady growth in the number and size of utility-scale energy storage
systems that are based on electrochemical energy storage technology. These types of
systems are referred to as “Battery Energy Storage Systems” (BESS). Many different
battery chemistries and form factors have been considered for large BESS applications,
each with varying degrees of energy density, cycle life, efficiency, cost, thermal runaway
considerations, and many other factors. Some of these chemistries and form factors have
already seen widespread deployment and could be considered “commercially mature”,
while others are in the research & development or demonstration phase.
Of the currently available BESS chemistries; lithium ion (Li-ion), sodium sulfur, and
vanadium redox flow have emerged as commercially viable at this time. These types of
storage technologies have characteristics and costs that make them suitable for
consideration by BHE and are discussed in depth in this report. Other energy storage
technologies such as compressed air energy storage, mechanical storage, hydrogen
storage, flywheels, other battery chemistries, and liquid air systems are not considered
appropriate technologies for BHE at this time for a variety of reasons including challenges
associated with technological maturity, system complexity, storage duration, geographical
requirements and commercial availability. Some description of these technologies is
provided in this report, but the technologies are not compared on an economic basis.
2.1 Battery Technology
The power input and output of battery energy storage systems are governed by a
bidirectional inverter known as a Power Conversion System (PCS). A PCS can respond to
a dispatch signal to charge or discharge in milliseconds, allowing a BESS to ramp up from
standby mode to full nameplate capacity in less than 2 seconds, including communication
latencies. Because there is no rotational inertia, a BESS can change from charging to
discharging (and vice versa) nearly instantaneously. This enables the provision of very
high performance ancillary services such as frequency regulation. Additionally, battery
PCS units have the ability to supply full four-quadrant AC output, which can be utilized to
supply voltage and volt-ampere reactive (VAR) support.
2.1.1 Lithium-ion
Background
Li-ion batteries have rapidly become the workhorse of the battery energy storage industry.
Large scale manufacturing and production of multiple chemistries (lithium nickel
manganese cobalt oxide (LiNiMnCoO2 or NMC), lithium iron phosphate (LiFePO4 or LFP),
lithium manganese oxide (LMO), and lithium titanate (Li4Ti5O12 or LTO)) have given it a
significant portion of the commercial energy storage market. Li-ion’s competitive energy
density and power density have made it the standard for portable applications. The global
demand for portable technologies has played a direct part in Li-ion investment that in turn
carries over into large scale Li-ion production.
Maturity
4 | April 12, 2019Appendix O
Proceeding No. 20M-0008E
2020 Energy Storage Assessment Study
Black Hills Energy
Li-ion is the second-most mature technology in the stationary battery energy storage
market, after lead acid (conventional lead acid battery systems are not economical for
utility energy storage because of their low energy density, short cycle life, and high cost).
The Li-ion technology was first proposed in 1970, released commercially in 1991, and is
now the standard technology for portable electronics and electric vehicles. The same
technology used for electric vehicles has become widely accepted for large-scale energy
storage applications and also forms the core technology for stationary energy storage.
The vast majority of the BESS systems currently in operation are on the order of 10MW or
less. It has not been until recent years that larger systems are being constructed. Currently,
the largest BESS in operation worldwide is the 100MW (129MWh) Lithium-ion system for
Hornsdale Power Reserve in South Australia. This record will not stand for long, as several
Li-ion BESS projects are set to come online in 2020-2022 that will exceed 100 MW by
some margin.
A large number of vendors, known as Original Equipment Manufacturers or OEMs,
produce the technology, including Bosch, Panasonic, Johnson Controls, LG Chem, NEC,
Samsung, Saft, BYD, Hitachi, CATL, and GS Yuasa (Mitsubishi). Other companies, known
as integrators, are involved in the purchase and assembly of battery cells from OEMs into
large, containerized units for deployment in the field.
All Lithium-ion battery systems will gradually degrade in energy capacity over time. The
rate of this degradation is heavily dependent on duty cycle, cell chemistry,
charge/discharge rates, and other factors. In order to account for this degradation, Li-ion
systems can be over-built at the beginning of a project, have modules replaced or added
periodically, or some combination of these approaches can be utilized. The addition of new
modules to retain nameplate capacity over time is known as “augmentation.” Li-ion battery
suppliers are now offering capacity maintenance agreements to maintain capacity for at
least 20 years using periodic augmentation or full module replacement. These
augmentation periods typically are planned to occur every 5-10 years.
Technological Characteristics
Li-ion batteries consist of a range of technologies varying in size, shape, and chemistry.
The primary chemistries in use today are lithium nickel manganese cobalt oxide (NMC),
lithium manganese oxide (LMO), lithium iron phosphate (LFP), and lithium titanate (LTO).
For stationary applications, the battery industry has thus far moved toward more heavily
utilizing NMC. NMC is the most typical chemistry in utility-scale BESS due to its balanced
performance characteristics in terms of energy, power, cost, and cycle life.
There has been growing interest in LFP batteries for utility-scale BESS in recent years. In
contrast to the NMC battery, LFP technology is a lower cost battery with a slightly
decreased power density, thus requiring more space than NMC for the installation of a
similar energy rating. LFP technology has a constant discharge voltage, the cell can
produce full power to 100 percent depth of discharge (DOD) and its chemistry is seen as
safer and less of a fire risk when compared to other Li-ion chemistries due to its higher
temperature threshold for thermal runaway. LFP batteries are also prone to a higher
degree of self-discharge meaning that the batteries will tend to lose charge faster than
other technologies when not in use.
April 28, 2020 | 5Appendix O
Proceeding No. 20M-0008E
2020 Energy Storage Assessment Study
Black Hills Energy
Li-ion battery cells typically consist of a graphite anode, metal-oxide cathode, and a lithium
salt electrolyte gel. For stationary applications these are typically packaged in a flat pouch
or rolled up like a jelly-roll (prismatic). Battery cells are integrated into battery modules,
which are typically installed in standard 19-inch-wide racks similar to those used for
telecom or substation equipment. The racks are then installed in a building or specially
prepared steel container to function as an integrated battery system. Essential to any
BESS installation is a battery management system (BMS), which monitors the electrical
and thermal conditions of the cells and controls the charging, discharging, and cell
balancing while ensuring the system is operated within its designed limits and protected
from damage.
Connecting this DC power system to an AC grid at the point of interconnection requires a
bi-directional inverter, generally known as a “power conversion system” (or PCS). A PCS
is similar to an inverter used for solar power systems, with the added capability of allowing
power to flow in the reverse direction (from AC to DC) to charge the BESS. PCS are
typically standalone units installed separately from a battery container, however some
suppliers offer containers with integrated PCS.
Li-ion batteries are highly sensitive to temperature. The building or container is typically
fitted with an active cooling system to maintain the batteries within an optimal temperature
range. The system will quickly degrade if operated or stored for any significant length of
time outside of these optimal temperature ranges. Li-ion batteries are typically designed
for operation in an ambient temperature of 70°F, though the optimal point will vary by
vendor and intended use.
Due to the temperature sensitivity, fire hazard, and special shipping requirements, many
states classify stationary Li-ion systems as hazardous materials. Some jurisdictions may
require hazardous material management plans (HMMP) and/or a hazard mitigation
analysis (HMA). In general, most states, including Colorado, adopt the International Fire
Code which leaves it up to the authority having jurisdiction (AHJ) to decide whether
HMMPs or HMAs are required. Careful consideration should be given to fire suppression
consisting of either gaseous (dry) systems, which may require air permitting, or liquid
systems that may cause concerns with the Clean Water Act.
The C-rate of a battery is the ratio of the system’s rated charge/discharge power, to its
rated energy capacity. Lithium-ion battery systems are inherently best suited for C-rates
between 0.25 and 2. This translates to storage charge/discharge durations between 0.5
and 4 hours. Different use-cases necessitate different storage durations, but most recent
lithium-ion installations are 1-4 hour systems, as this duration is typically sufficient to cover
the peak load duration of a utility. To achieve longer durations, more racks or containers
can be added in parallel while maintaining balance of plant equipment with the same rated
power.
Lithium-ion batteries have a round trip efficiency (RTE) generally 85-90 percent at the AC
point of interconnection. The auxiliary power required for system HVAC, controls, and
other loads varies heavily. This aux power is generally self-supplied and included in the
RTE number.
6 | April 12, 2019Appendix O
Proceeding No. 20M-0008E
2020 Energy Storage Assessment Study
Black Hills Energy
2.1.2 Vanadium Redox Flow
Background
Vanadium Redox Batteries (VrBs) are a fundamentally different type of battery energy
storage system to the forms previously discussed. A VrB system uses a liquid anode and
liquid cathode rather than a single liquid electrolyte. The anode and cathode fluids are
circulated through the battery cell into holding tanks.
There is much interest in these systems as they have a high cycle-life, have a large
allowable temperature range, operate at low temperature, and are capable of long storage
durations.
Maturity
While the first VrB operational system was demonstrated in Australia in the 1980s, there
are only a few systems in operation worldwide. A number of vendors manufacture these
systems, including, Gildemeister (American Vanadium), Rongke Power, Prudent Energy,
ViZn Energy, Vionx Energy, and Sumitomo. The industry is currently in a phase of
continuous improvement, with multiple generations of technology available. Only a few
systems operate commercially from a worldwide perspective. San Diego Gas & Electric
has a demonstration project in coordination with Sumitomo Electric from Japan. The flow
battery system provides 2 megawatts (MW) and 8 megawatt hours (MWh) of energy,
enough to power the equivalent of about 1,000 homes for up to four hours.
VrB systems use electrodes to generate current through flowing vanadium electrolytes.
The size and shape of the electrodes govern power density, whereas the amount of
electrolyte governs the energy capacity of the system. The cell stacks are comprised of
two compartments separated by an ion exchange membrane. Two separate streams of
electrolyte flow in and out of each cell with ion or proton exchange through the membrane
and electron exchange through the external circuit.
VrB systems are recognized for their long service life (up to 20,000 life cycles with routine
maintenance) as well as their ability to provide system sizing flexibility in terms of power
and energy. The separation membrane prevents the mix of electrolyte flow, making
recycling possible. The end of life can be extended by replacing the electrolyte and the
membrane.
The industry is moving away from custom systems to more prepackaged systems, to
compete with Li-ion. Some vendors are also offering 2- to 20-year warranties with
performance guarantees and long-term service agreements. The industry is currently
hampered by the infancy of the companies providing the technology. Many of the vendors
are venture-capital backed companies with only a single product line. Additionally, the
systems tend to be uneconomic for storage durations less than 3 hours and better suited
for longer duration applications. While this technology holds promise, it is still in its early
phases of commercialization.
Technological Characteristics
All flow batteries share the common topology of a battery cell with flowable electrolyte
pumped between storage tanks. Electrolyte is pumped through the cell for charging or
discharging, and is stored in separate tanks for longer duration storage. The volume of the
April 28, 2020 | 7Appendix O
Proceeding No. 20M-0008E
2020 Energy Storage Assessment Study
Black Hills Energy
storage tank determines the duration of energy storage. Early systems, and those provided
by Prudent Energy and Sumitomo, are still custom engineered with varying durations of
storage.
As noted previously, the industry is moving toward containerized systems with pre-
determined storage durations of 3 to 8 hours. The prepackaged systems utilized one or
more containers per battery. The containers typically have both secondary and tertiary
containment for the electrolyte fluid. Some containerized flow products can be stacked
vertically to reduce their footprint. As with Li-ion systems, a PCS is required to connect the
DC battery system to an AC grid.
For larger flow systems on the scale of 50MW or more, it is sometimes advantageous to
install the equipment in one large building rather than in modularized containers. This can
improve energy density and reduce auxiliary power costs. One such facility is currently
under construction in Dalian, China. The 200MW, 800MWh Vanadium redox flow system,
provided by Rongke Power, is scheduled to come online in 2020.
VrB batteries are characterized by a high cycle life and insensitivity to temperature. They
operate at a low temperature and are only limited by the temperature rating of the auxiliary
components (pumps, sensors, etc.). The electrolyte degrades very slowly over time,
allowing for a very high cycle life. This allows VrB systems to maintain nameplate capacity
for 20+ years without requiring the periodic replacement or “augmentation” that Li-ion
systems must undergo. Due to the pumps and other losses, they have a high station
service load yielding a lower round trip efficiency than other technologies. With current
technology, RTE values for VrB systems are generally quoted to be around 70-75 percent 1.
Critical to the design of these systems is that the energy available from the battery depends
on the discharge rate. For a continuous discharge at a specified rate (resource adequacy),
the storage duration could vary from 2 to 8 hours.
2.2 Other Emerging Technologies
There are several other ESS technologies listed below, that are not discussed or compared
in this report as they are either not technologically applicable to BHE’s NWA planning
needs, or are not sufficiently developed to be considered commercially available. Some of
these technologies may be available on a commercial scale, but because of duration
limitations, capability limitations, limited supplier base, or limited operating experience,
they are not considered favorable for BHE and are not compared from an economic
perspective. A brief discussion is presented for each technology summarizing reasons for
not including them in the economic evaluation.
Advanced Lead-Acid, Zinc-Bromine, Zinc-Air flow, and other battery chemistry
There are numerous electrochemical (battery) energy storage solutions with various
chemistries in various stages of development and deployment, in addition to the Li-ion and
VrB technologies detailed in this report. Some of these technologies have the potential to
be cost competitive with the established chemistries, but none appear to offer significantly
1
AC-to-AC, including auxiliary power.
8 | April 12, 2019Appendix O
Proceeding No. 20M-0008E
2020 Energy Storage Assessment Study
Black Hills Energy
better economics. Therefore, the technologies that were evaluated, Li-ion and VrB can act
as proxy for these chemistries that were not evaluated in detail. As these battery
chemistries become commercially available, they should be compared with established
systems for specific applications on the basis of cost effectiveness, reliability,
warranty/guarantee protection, and other factors.
Liquid Air
Liquid air storage uses electricity to cool air from the atmosphere to the point at which air
liquefies, approximately minus 195 °C. The liquid air, which takes up approximately one-
thousandth of the volume of air in the gas phase, can be stored for long periods in a
vacuum insulated vessel at atmospheric pressure. At times when electricity is demanded,
the liquid air is pumped into a heat exchanger, which acts as a boiler. Either heat from
ambient air or low grade waste heat is used to heat the liquid and turn it back into a gas.
The increase in volume and pressure from this is used to drive a turbine to generate
electricity. In isolation, liquid air storage systems have a round-trip efficiency of
approximately 25 percent. This can be increased to 50-60 percent with the addition of a
cold store to capture the energy generated by evaporating the liquid air. There is one pilot
facility in operation worldwide, a 2.5 MWh system developed by University of Leeds and
Highview Power Storage. Because of the relatively low round-trip efficiency and very
limited number of deployments, this technology was not considered favorable for BHE.
Hydrogen Storage
Hydrogen energy storage systems use hydrogen as the medium for storage of energy.
Hydrogen is generated using electrical energy through electrolysis of water and stored as
compressed gas in underground caverns of aboveground tanks. The hydrogen is
converted back to electricity through a conventional gas turbine or internal combustion
engine or through a fuel cell. Hydrogen systems are capable of storage energy density
that is higher than a compressed air energy storage system (CAES), leading to modest
costs for the storage portion of the ESS. This technology is characterized by low round-
trip efficiency in the 30 to 40 percent range and high power conversion system cost,
approximately two to eight times as expensive as PHES. Given the low round-trip
efficiency, lack of commercial scale demonstration, and high cost, this technology was not
considered favorable for this BHE application.
Flywheels
Flywheel technology is a well-established technology with discharge durations in the scale
of seconds to minutes. They are well suited for power related services such as UPS,
frequency regulation, and bridging to back-up system. They are not commercially available
for bulk-storage applications with discharge durations in the range of multiple hours as
may be required by BHE.
Capacitors
Capacitors are a direct method of storing electrical energy, storing energy as electrical
charges. They are widely used in power-quality related services such as bridging and ride-
through. They have short storage durations on the scale of milliseconds up to a few
April 28, 2020 | 9Appendix O
Proceeding No. 20M-0008E
2020 Energy Storage Assessment Study
Black Hills Energy
minutes. Current capacitor technology has energy density that is orders of magnitude
lower than state-of-art battery systems. Because of their low energy density and short
discharge times, they are not considered favorable for BHE’s bulk-storage needs.
Magnetic and superconducting magnetic systems
Magnetic and superconducting magnetic energy storage system are a direct method of
storing electrical energy, storing energy in the form of a magnetic field created by flowing
electrical charges. Because of their fast response time, they are suitable for power-quality
related services such as bridging and ride-through. They have short storage durations on
the scale of milliseconds up to a few minutes. Current magnetic technology has energy
density that is higher than the energy density of capacitors, but is still orders of magnitude
lower than state-of-art battery systems. Because of their low energy density and short
discharge times, these systems are not considered favorable for BHE’s bulk-storage
needs.
Gravitational Potential Energy
Mechanical gravity energy storage systems convert electrical energy into potential energy
by raising heavy solid objects in the earth’s gravitational field. The stored potential energy
can be converted back to electrical energy by a generator coupled to the object that allows
the object fall in a controlled way. PHES is a form of mechanical gravity energy storage
that uses water as the working medium. Various arrangements have been proposed
including railcar systems, crane-based systems, and in-ground systems. There have been
a few demonstration projects completed, but no commercial deployment has been made.
Because of the lack of any commercial deployment, this technology is not considered
favorable for BHE’s applications.
3 Energy Storage as a Non-Wires Alternative
3.1 Definition
Non-Wires Alternatives are defined as “an electricity grid investment or project that uses
non-traditional transmission and distribution solutions, such as distributed generation,
energy storage, energy efficiency, demand response, and grid software and controls, to
defer or replace the need for specific equipment upgrades, such as T&D lines or
transformers, by reducing load at a substation or circuit level,” (Navigant, 2017). Generally
speaking, an energy storage system can be placed “downstream” of a particular asset that
is experiencing (or may experience) overloading. By charging during low-load periods and
discharging during peak-load periods, a process known as “peak shaving”, the peak load
on that particular asset can be reduced. This can either postpone the need for replacing
or upgrading the asset, or prolong the life of the asset (or both). The value of the deferred
upgrade and/or the prolonged asset life can then be compared to the cost of the energy
storage system to determine economic feasibility. This process is discussed further in
Section 5 below.
10 | April 12, 2019Appendix O
Proceeding No. 20M-0008E
2020 Energy Storage Assessment Study
Black Hills Energy
Because energy storage systems are time-limited resources, they need to be classified
both in terms of power rating and energy capacity. It is important to consider not just the
power required for a specific application, but also the amount of energy, or in other terms,
the duration for which that power is required. Both power and energy ratings factor into the
cost of an energy storage system. For example, a 1 MW, 0.5 MWh BESS is likely to be
significantly smaller and less expensive than a 1 MW, 4 MWh BESS. As a result, it is
generally more cost effective to use storage for peak shaving when the shapes of the
peaks are sharp and narrow, as opposed to more broad and less pronounced.
3.2 Examples
OPALCO - DECATUR ISLAND BESS, WA
Orcas Power & Light Coop. (OPALCO) is currently in the construction stages of a 0.5
MW/2 MWh Lithium-ion BESS located on Decatur Island. OPALCO services 20 islands in
San Juan County, Washington. The islands receive power from BPA via a subsea
transmission cable connected to the mainland, which first reaches customers on Decatur
Island. The primary purpose of the BESS is to defer the replacement of the subsea cable
by peak shaving on a daily basis. Pacific Northwest National Laboratory estimates the total
value of this upgrade deferment to be $2.0 Million. The BESS will also be providing volt/var
support, demand charge reduction, and outage mitigation, further adding value to the
project. The BESS is scheduled to become operational in 2020.
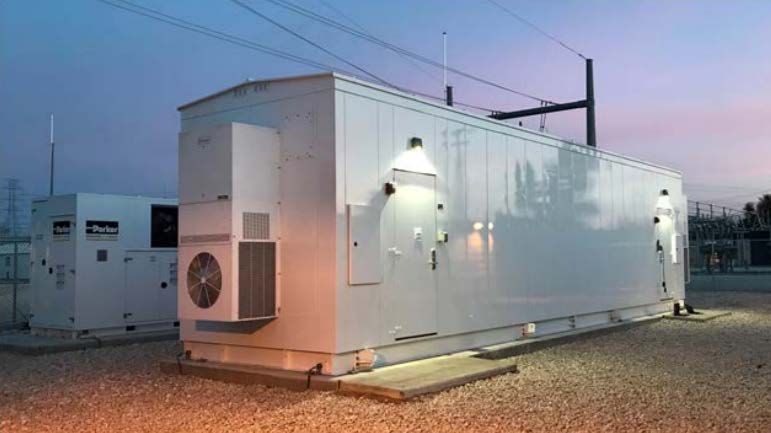
APS – PUNKIN CENTER BESS, AZ
Arizona Public Service (APS) Electric completed the installation of a 2 MW/8 MWh BESS
at Punkin Center, Arizona in 2018. The project consists of two 40’ x 8’ steel containers
filled with Lithium-ion battery modules. APS determined that the storage system provided
a more affordable solution to address load growth than the option of rebuilding 17 miles of
distribution lines over rough terrain. The system provides peak shaving to reduce thermal
load on the existing distribution feeder, as well as volt/var support to maintain power
quality.
The Punkin Center is considered a critical load facility, so spare equipment is kept on site
along with an interconnection point for a diesel generator in case of a contingency event.
April 28, 2020 | 11Appendix O
Proceeding No. 20M-0008E
2020 Energy Storage Assessment Study
Black Hills Energy
“The project proved to be a cost-effective solution for APS to serve the rural community,
compared to reconductoring of the line. The success of the project demonstrates the
capability of this NWA solution to serve the residents of Punkin Center for a decade and
possibly longer depending on the load growth.” –Smart Electric Power Alliance, 2019
The site was developed with provisions for anticipated expansion of the BESS to meet
future load growth. APS is planning to install up to 500 MW of energy storage capacity
over the next 15 years.
DUKE ENERGY – MOUNT STERLING MICROGRID, NC
In 2017, Duke Energy completed the implementation of a microgrid to service a remote
communications tower in Great Smoky Mountains National Park. The microgrid features a
10 kW PV solar installation and a 95 kWh Zinc-air BESS. The system was selected as an
alternative to four miles of distribution line, which was decommissioned as a result of the
project. Duke Energy elected to utilize the Zinc-air battery technology due to its very low
risk of fire, given the sensitive surroundings. When fully charged, the BESS is capable of
supporting load continuously for 11 days. The new microgrid offers improved reliability
over the previous distribution line for critical communications equipment for the National
Park.
DOMINION ENERGY – HANOVER COUNTY BESS, VA
In 2019, Dominion Energy of Virginia announced plans to build three battery energy
storage pilot projects, totaling 16 MW. One of these projects, located at Hanover
Substation, will utilize a 2 MW/4 MWh Lithium-ion BESS to “explore the feasibility of using
battery energy storage systems instead of traditional grid investments, such as transformer
upgrades, necessary to serve customers during times of high energy usage.” The project
is expected to be in service by the end of 2020.
4 Cost Assessment
4.1 Trends
The costs for battery storage technologies are expected to continue to fall as maturity is
gained and the economies of growing market orders are secured. The cost of Li-ion
batteries have dropped nearly 90 percent from their commercialization in 1991 and have
been trending down at an annual rate of approximately 14 percent over the past 5 years.
Most indications show that the downward trend will continue as suppliers continue to
improve manufacturing processes and production capacity. In 2018, increasing demand
for mineral resources, especially cobalt, slowed the decline in NMC battery prices and
increased lead times. Since then, newer NMC cell designs have been introduced to the
market that use significantly less cobalt than their predecessors. Less established
technologies such as flow batteries will likely see a substantial decline in installed cost if
they are able to reach the level of widespread commercialization that Li-ion batteries are
12 | April 12, 2019Appendix O
Proceeding No. 20M-0008E
2020 Energy Storage Assessment Study
Black Hills Energy
now experiencing. Many flow technologies also offer the advantage of a very long cycle
life as compared to current Li-ion cell technology. This means they do not require the same
periodic augmentation or replacement (and the associated costs) that Li-ion batteries do
to maintain energy capacity.
Figure 1 below shows the approximate battery installed cost trend out to 2030, based on
data assembled by Bloomberg New Energy Finance in 2018. The most significant
component of capital expenditure (CapEx) tends to be the cost of the battery modules
themselves (shown in light blue below), which is projected to continue to decline due to
aggressively scaled manufacturing and technological improvements. Other components
of BESS CapEx are comprised of more conventional and commercially mature equipment,
therefore cost decline associated with this other equipment is expected to be modest.
Figure 1. Cost Projections for 4-hour Battery Energy Storage Systems
700
Capital Costs for a
Nameplate 20MW/80MWh (AC) Li-ion Energy Storage System
600
32
28
500
81
Real 2018 $/kWh
8
400 58
68 20
18 19
18 18
300 20 40 17 17
5 39 17 15
15 5 38
15 37 17 14
37 6
14 16
36 5 36 13
18 36 14 6 34 16 12
200 17 35 13 6 33 16 11 11
17 34 12 16 15 10
16 7 32 30 15 10 9
15 32 11 4 29 15 15
286 14 30 11 6
10 6 28 28
30 10 6 27
13 28 9 4
9 5
8
100 204 13 27 26
189 173 12 11 26 26
158 11 10 10
142 127 111 96 90 84 79 74 70
0
2017 2018 2019 2020 2021 2022 2023 2024 2025 2026 2027 2028 2029 2030
Battery Rack PCS BOS EMS Transformer/Other EPC Developer OH Developer Margin
4.2 BESS Cost Estimation
In order to approximate the capital and operating expenses of a Battery Energy Storage
System, it is important to understand the many variables that factor into the cost equation.
There is still a wide range of installed costs for real-world projects, and it is generally overly
simplistic to use a flat dollar-per-kWh value when estimating the cost of a hypothetical
BESS. The following factors tend to have a major impact on the resulting capital and
operational expenses of a BESS:
April 28, 2020 | 13Appendix O
Proceeding No. 20M-0008E
2020 Energy Storage Assessment Study
Black Hills Energy
TECHNOLOGY SELECTION
In July of 2019, the Pacific Northwest National Laboratory (PNNL) published the “Energy
Storage Technology and Cost Characterization Report” which aimed to compare various
energy storage technologies from an economic and technical standpoint. The table below
represents the main findings of the report, showing cost breakdowns by technology with
price ranges and averages for 2018, along with predictions for 2025 pricing. All prices are
approximated for a 1 MW, 4 MWh energy storage system. As demonstrated by the table,
Li-ion remains the most cost effective choice for most applications.
Table 1: Summary of compiled 2018 findings and 2025 predictions of
cost and parameter ranges by technology type - BESS (PNNL, 2019)
14 | April 12, 2019Appendix O
Proceeding No. 20M-0008E
2020 Energy Storage Assessment Study
Black Hills Energy
C-RATE
When referring to an energy storage system, “C-rate” is the ratio between the power rating
and the energy rating of a system. It is the inverse of the “duration” of the system; in other
words, a 4-hour BESS would have a C-rate of 0.25, and a 1-hour BESS would have a C-
rate of 1. It is important to consider both power rating and energy rating when evaluating
a BESS, as some components (such as the number of battery modules required) depend
more heavily on energy rating, while other components (such as the number and size of
PCSs required) depend on the power rating.
For a multitude of reasons, most BESS installations in recent years have been Li-ion
systems with a 4-hour duration. Therefore, many resources that track energy storage
pricing, including the PNNL report references above, assume a 4-hour duration (or a C-
rate of 0.25). Figure 2 below, extrapolated from the PNNL data, illustrates how the $/kWh
price point increases dramatically for shorter duration systems. For example, a 4 MWh
BESS with a 2-hour duration (therefore a 2 MW power rating), would cost approximately
20% more than a 4 MWh BESS with a 1 MW power rating.
Figure 2: BESS CapEx vs Duration
CAPEX vs Duration (Li-ion)
300.00%
Normalized Installed Cost
250.00%
200.00%
150.00%
100.00%
50.00%
0.00%
0.5 1 1.5 2 2.5 3 3.5 4 4.5 5 5.5 6 6.5 7 7.5 8
Duration (hrs)
Installed Cost ($/kWh) - Normalized over 4-hr
Installed Cost ($/kW) - Normalized over 4-hr
April 28, 2020 | 15Appendix O
Proceeding No. 20M-0008E
2020 Energy Storage Assessment Study
Black Hills Energy
However, there are some advantages presented by flow battery solutions that make them
potentially more cost-effective than Li-ion for longer durations (i.e. lower C-rates). Because
flow battery systems are comprised of a small number of very large, fluid cells rather than
thousands of very small pre-fabricated cells, there is more flexibility in de-coupling energy
rating from power rating. With a flow system, power modules and energy modules are
typically separated, allowing higher energy capacities to be achieved through the use of
more or larger electrolyte tanks, without requiring more power modules. Because of this,
there is potential for flow systems to offer a lower dollar-per-kWh price than typical Li-ion
systems. This concept is illustrated by Figure 3 below.
Figure 3: Li-ion vs Flow BESS Installed Cost
Li-ion vs Flow BESS
Installed Cost
3500
Installed Cost ($/kW)
3000
2500
2000
1500
1000
500
0
4 8
Duration (hrs)
L-ion Installed Cost ($/kW) Flow Installed Cost ($/kW)
16 | April 12, 2019Appendix O
Proceeding No. 20M-0008E
2020 Energy Storage Assessment Study
Black Hills Energy
ECONOMIES OF SCALE
The concept of economies-of-scale, or the reduced unit cost of something as the number
of units increases, applies well to BESS installations as they are generally very modular
and repetitive systems. Equipment cost per unit, along with the associated shipping and
installation, generally decreases with increasing order volumes. Additionally, the balance-
of-plant costs and overall site footprint tend to be more consolidated with larger
installations. The Figure 4 below represents a combination of recent installed cost
estimates from publicly available resources (identified in orange) and HDR’s internal
database of quotes for real-world projects (in blue) for 4-hour Li-ion systems. The best-fit
line illustrates the sharp decline in $/kWh for system sizes larger than 5-10 MWh.
Figure 4: Specific Capital Cost vs BESS Size
Specific Capital Cost ($/kWh)*
700
Lazard - C&I (max)
Lazard - Utility Scale
600 (max)
PNNL (max) Lazard - wholesale
(max)
500
400
$/kWh
NREL
300
Lazard - Utility Scale y = -37.59ln(x) + 587.07
BNEF (2019) (min) Lazard - wholesale
200 (min)
100 PNNL (min)
0
0 100 200 300 400 500 600 700 800 900 10001100120013001400150016001700180019002000
System Size (MWh)
*For 4-hour Li-ion Systems
Includes BOP/AC System and EPC
DEGRADATION & CAPACITY MAINTENANCE
It is widely understood that battery capacities tend to fade through time and use. The rate
at which capacity degradation occurs varies widely depending on: battery chemistry and
manufacturing quality, the depths and frequencies of charge/discharge cycles, battery
temperature, years of service, and several other variables. Most battery suppliers can
predict with some accuracy the rate at which their product will degrade, and can offer a
“Capacity Maintenance Plan” or “Capacity Maintenance Agreement” to maintain the
nameplate energy capacity of the BESS throughout the life of the project. This is
accomplished by periodically “augmenting” or adding new battery modules to the system,
and/or replacing old modules with new ones. The cost associated with these
augmentations and replacements can be difficult to accurately predict without knowing the
specific cell chemistry and daily dispatch cycle of the proposed BESS. Flow batteries taut
their ability to maintain energy capacity for 20+ years without the need for augmentation,
however this claim must be evaluated on a case-by-case basis.
April 28, 2020 | 17Appendix O
Proceeding No. 20M-0008E
2020 Energy Storage Assessment Study
Black Hills Energy
For Li-ion projects, degradation rate varies heavily based on how the battery is
charged/discharged and the underlying cell chemistry, as such there are many different
strategies for capacity maintenance. Augmentations or replacements can be required
between every 2 to 10 years, and costs can range from approx. $2.50/kWh-yr to
$12.00/kWh-yr. Because of this variability, HDR recommends conservatively assuming
$10.00/kWh-yr for small Li-ion systems (10MWh or less). In reality, these costs are not
incurred annually but rather every few years. However, for the purpose of a high-level
economic analysis it can be advantageous to simplify this to an annualized cost.
5 Upgrade Deferment Valuation
In order to properly consider energy storage as an alternative to conventional T&D
infrastructure, the cost of the proposed energy storage system (outlined in the previous
section) must be weighed against the economic benefit that it would provide to BHE and
its ratepayers. The primary benefit offered by energy storage as a NWA is the deferment
of a planned upgrade to a piece of infrastructure to meet thermal constraints due to load
growth. The method for estimating the value of a deferred upgrade must coincide with
BHE’s planning and project finance mechanisms and thus would be best developed by the
in-house subject matter experts at BHE. However, it can be prudent to first establish a
proof-of-concept by performing a high-level economic evaluation of the deferment benefit
using a simplified approach.
One such approach is outlined in the IEEE report titled “Distribution Feeder Upgrade
Deferral Through use of Energy Storage Systems” by Zhang, Emanuel, and Orr. This
report uses a hypothetical distribution feeder upgrade as a basis for demonstrating how
an energy storage vs T&D infrastructure cost-benefit analysis might work. In their analysis,
the net present value (NPV) of a feeder upgrade, PVF is compared to the NPV of an
optimally-sized storage system including both the CapEx, PVB, and the OpEx, PVBO, of the
BESS. The total benefit is measured by taking the difference between the feeder NPV if
installed at present and the sum of the BESS NPV installed at present and the feeder NPV
if installed after “tp” years. This formula is shown as the “Benefit Calculation” equation in
the flow chart below. With this scenario, it is assumed that the CapEx of the T&D
infrastructure is funded by loan with a specified interest rate and loan period. Discount rate
(d) is also taken into account.
The flow chart below depicts the iterative process used for determining the maximum NPV
that can be generated by an optimally-sized energy storage system to defer a T&D
upgrade.
18 | April 12, 2019Appendix O
Proceeding No. 20M-0008E
2020 Energy Storage Assessment Study
Black Hills Energy
Figure 5: Flow Chart for Deferment Cost-Benefit Analysis
Parameter Variable Definition
Deferral Duration tp The number of years the proposed BESS can defer the
proposed T&D project.
Feeder Present Value PVF The present value of the feeder (or other T&D) installation.
BESS CapEx Present Value PVB The present value of the capital/installed cost of the BESS.
BESS OpEx Present Value PVBO The present value of the operational costs of the BESS. This
includes annual O&M as well as periodic battery
augmentations/replacements to maintain capacity.
Discount Rate d Discount rate applied to the project finance formula.
Maximum Deferral Duration tpMAX The number of years of deferral for which the maximum net
benefit is achieved.
The process outlined in the IEEE report (and the flow chart above) is as follows:
1. Determine system inputs such as discount rate, interest rates, loan durations, cost
rates for the proposed BESS and T&D infrastructure, etc.
2. Assume an initial deferral duration of tp = 1 year.
3. Determine the BESS size that will be required to replace the need for the T&D
project for tp years.
April 28, 2020 | 19Appendix O
Proceeding No. 20M-0008E
2020 Energy Storage Assessment Study
Black Hills Energy
4. Run the benefit calculation based on these parameters.
5. If the maximum benefit has been achieved, end the process. If not, proceed to step
6.
6. Increase the deferral duration, tp, by one year. Proceed to step 3.
As can be expected, the more years of deferment achieved by the energy storage system,
the greater the benefit valuation. The length of the deferment period is heavily dependent
on the rate at which load is expected to grow at the point of constraint. If load growth is
rapid, a BESS of a certain size will be capable of adequate peak shaving services for fewer
years. The figure below, taken from the report, shows how the expected annual load
growth rate (ra) has a major influence on the deferment benefit of the energy storage
system in the evaluated hypothetical scenario. Faster load growth resulted in a shorter
period during which energy storage could defer the upgrade, resulting in diminished and
sometimes strictly negative benefit.
Figure 6: Deferment Benefit vs Deferment Years (IEEE Example)
As described in the previous section, the cost of a BESS required to provide adequate
peak shaving to defer an upgrade is heavily dependent on both the power and energy
rating. The load profile at the point of constraint is thus another critical factor in the
assessment. A tall and narrow peak offers a greater value proposition for the use of energy
storage than a short and broad peak. Ultimately, BHE’s planning group will need to
determine optimal BESS size and deferral period on a case-by-case basis based on the
load profile and expected load growth rate at the point of constraint.
6 References
The following references were cited in the preparation of this report.
20 | April 12, 2019Appendix O
Proceeding No. 20M-0008E
2020 Energy Storage Assessment Study
Black Hills Energy
• Balducci, Patrick. “Washington Clean Energy Fund (CEF) II - OPALCO Community
Solar and Energy Storage on Decatur Island.” Www.opalco.com, OPALCO, 19 Jan.
2018.
• “Battery Storage Pilot Project Fact Sheet.” Dominionenergy.com, Dominion Energy, 2
Aug. 2019, www.dominionenergy.com/Battery-Storage-Pilot.
• Federal Energy Regulatory Commission, “Market Oversight Glossary”,
http://www.ferc.gov/market-oversight/guide/glossary.asp.
• “Non-Wires Alternatives / Case Studies from Leading U.S. Projects.”
e4thefuture.Org, E4TheFuture, PLMA, SEPA, Nov. 2018, e4thefuture.org/wp-
content/uploads/2018/11/2018-Non-Wires-Alternatives-Report_FINAL.pdf.
• “Great Smoky Mountains National Park Microgrid Stems from Lineman's Idea.”
Microgrid Knowledge, 20 Dec. 2019, microgridknowledge.com/great-smoky-
mountains-national-park-microgrid/.
• Department of Energy, “Grid-Scale Energy Storage Demonstration using Ultrabattery
Technology”, October, 2012.
• Rocky Mountain Institute, HOMER Energy, and global X, “The Economics of Load
Deflection”, April, 2015.
• NERC, “Ancillary Services Summary Across North American RTOs and ISOs”.
• The Brattle Group, “The Value of Distributed Electricity Storage in Texas”, Prepared
for ONCOR, November, 2014.
• Sandia National Laboratories, “Market and Policy Barriers to Energy Storage
Deployment: A Study for the Energy Storage Systems Program”, Report SAND2013-
7606, September, 2013.
• Sandia National Laboratories, “Protocol for Uniformly Measuring and Expressing the
Performance of Energy Storage Systems”, Report SAND2013-7084, August, 2013.
• CAISO, “Advancing and Maximizing the Value of Energy Storage Technology: A
California Roadmap”, December, 2014.
• DOE, “DOE/EPRI 2013 Electricity Storage Handbook”, in Collaboration with NRECA,
July, 2013.
• GTM Research, “US Energy Storage Monitor: 2019 Year in Review”
www.gtmresearch.com, March, 2020.
• SPP, “SPP 2017 RESOURCE ADEQUACY REPORT.” Www.spp.org, 19 June 2017
• Mongird, K, et al. Energy Storage Technology and Cost Characterization Report. US
Department of Energy, 2019, Energy Storage Technology and Cost Characterization
Report, energystorage.pnnl.gov/pdf/PNNL-28866.pdf.
April 28, 2020 | 21Appendix O
Proceeding No. 20M-0008E
2020 Energy Storage Assessment Study
Black Hills Energy
7 Appendix
7.1 Project Team
HDR has been a leader in the evaluation, development, implementation and innovation of
a wide variety of battery energy storage systems. They understand the many roles that
energy storage currently plays in enhancing the performance, reliability and value of the
grid and how those roles are expected to expand in the future. HDR’s staff has worked
with reliability organizations, utilities, transmission and independent system operators,
project developers, regulators, investors and other stakeholders on a variety of energy
storage projects.
HDR is uniquely positioned to help clients develop electrical systems to suit their specific
needs. Whether the task is providing energy security for the Department of Defense,
enhancing the value of VER projects, understanding the impact of variable generation on
our utility clients, or modernizing infrastructure at existing pumped storage plants, HDR’s
engineers have the experience to understand the appropriate technologies and evaluate
their effectiveness for each application.
Through their knowledge of energy storage technology and their experience with
renewable energy, traditional power generation, power delivery and grid operations, HDR
provides strategic solutions to battery energy storage systems (BESS) challenges.
A confluence of new technologies, new financing mechanisms, and government
regulations is driving fundamental changes in how we generate, deliver and maintain
quality power. BESS are a key component in the evolving topic of the grid modernization
and are becoming a fundamental part of solving the new and dynamic challenges
associated with variable energy resources (VER) and microgrids. Improving resource
adequacy and renewable integration as well as providing energy resiliency for critical
infrastructure, IEEE 1547A compliance or regulating system frequency are just some of
the potential applications of a well-executed BESS.
HDR’s engineers have first-hand experience in the following roles:
• Feasibility Assessment: Energy planners have addressed integrated resource plans
(IRP) including those with high penetration levels of VERs and assessed strategic
flexibility solutions for electric utilities across the U.S.
• Technical Design: Engineers and designers have extensive experience developing
designs for the integration of stationary battery energy storage systems.
• Owners’ Engineering: The HDR team has worked alongside clients from project
conception to construction to energization.
• Specifications: Engineers have partnered with clients to develop the project technical
specifications and performance guarantees to ensure the BESS meets their use case.
• Standards and Associations: The HDR team includes committee members and
advisors of government and private associations addressing new and existing energy
storage technologies.
22 | April 12, 2019Appendix O
Proceeding No. 20M-0008E
2020 Energy Storage Assessment Study
Black Hills Energy
HDR’s approach for this project has been developed to provide BHE with an exceptional
engineering and consulting team to perform the required activities and address project
scope. The project team was selected based on technical competence, project
understanding, and experience with similar projects.
ENERGY STORAGE TECHNICAL LEAD – LUKAS ROWLAND
Lukas has extensive experience providing owner’s engineering and design support on
numerous battery energy storage projects ranging from 500 kWh to 400 MWh. This work
includes specification writing, bid evaluations, electrical design, construction cost
estimates, technical research, and system optimization. He has also lead electrical
balance of plant design and performed quality control reviews for multiple battery energy
storage projects, including utility-scale facilities (both standalone and co-located with
solar or wind plants), and commercial/industrial scale installations located behind-the-
meter for customer energy management and resiliency.
QA/QC LEAD – TOMAS VAZQUEZ
Tomas manages engineering efforts and consulting services for utility-scale power
generation and industrial projects including desalination plants, transmission lines,
highway and railroad bridge design, and construction. His experience encompasses
thermal (fossil-fired fueled projects), LNG, and renewable (solar, wind, hydro) power
plant development as well as the design of civil/structural systems.
Moreover, Tomas has expertise in the areas of independent engineering management,
owner’s engineering management, technical and environmental due diligence, project
engineering, and business development.
April 28, 2020 | 23You can also read