Farm service agency employee intentions to use weather and climate data in professional services
←
→
Page content transcription
If your browser does not render page correctly, please read the page content below
Renewable Agriculture and                            Farm service agency employee intentions to
       Food Systems
                                                            use weather and climate data in
       cambridge.org/raf                                    professional services
                                                            Rachel E. Schattman1, Gabrielle Roesch-McNally2, Sarah Wiener3,
       Themed Content: Ag/Food                              Meredith T. Niles4 and David Y. Hollinger5
       Systems and Climate                                  1
                                                              USDA Forest Service/University of Vermont Extension, 140 Kennedy Drive, Suite 201, South Burlington, Vermont
       Change                                               05403, USA; 2USDA Forest Service, 3200 SW Jefferson Street, Corvallis, OR 97331, USA; 3USDA Forest Service,
                                                            Southern Research Station, 920 Main Campus Drive, Suite 300, Raleigh, NC 27606, USA; 4University of Vermont,
       Cite this article: Schattman RE, Roesch-             Food Systems Program, Department of Nutrition and Food Sciences, 350 Carrigan Wing, Marsh Life Sciences
       McNally G, Wiener S, Niles MT, Hollinger DY          Building, Burlington, Vermont 05405, USA and 5USDA Forest Service, Northern Research Station, 271 Mast Road,
       (2018). Farm service agency employee                 Durham, NH 03824, USA.
       intentions to use weather and climate data in
       professional services. Renewable Agriculture
       and Food Systems 33, 212–221. https://doi.org/         Abstract
       10.1017/S1742170517000783                              Agricultural service providers often work closely with producers, and are well positioned to
       Received: 17 July 2017
                                                              include weather and climate change information in the services they provide. By doing so,
       Accepted: 10 December 2017                             they can help producers reduce risks due to climate variability and change. A national survey
       First published online: 20 February 2018               of United States Department of Agriculture Farm Service Agency (FSA) field staff (n = 4621)
                                                              was conducted in 2016. The survey was designed to assess FSA employees’ use of climate and
       Key words:
                                                              weather-related data and explore their perspectives on climate change, attitudes toward adap-
       Agriculture; climate change; FSA; risk
                                                              tation and concerns regarding climate- and weather-driven risks. Two structural equation
       Author for correspondence:                             models were developed to explore relationships between these factors, and to predict respon-
       Rachel E. Schattman, E-mail: rschattm@uvm.edu          dents’ willingness to integrate climate and weather data into their professional services in the
                                                              future. The two models were compared with assess the relative influence of respondents’ cur-
                                                              rent use of weather and climate information. Findings suggest that respondents’ perceptions of
                                                              weather-related risk in combination with their personal observations of weather variability
                                                              help predict whether an individual intends to use weather and climate information in the
                                                              future. Importantly, climate change belief is not a significant predictor of this intention; how-
                                                              ever, the belief that producers will have to adapt to climate change in order to remain viable is.
                                                              Surprisingly, whether or not an individual currently uses weather and climate information is
                                                              not a good predictor of whether they intend to in the future. This suggests that there are
                                                              opportunities to increase employee exposure and proficiency with weather and climate infor-
                                                              mation to meet the needs of American farmers by helping them to reduce risk.

                                                            Introduction
                                                            Global climate change has diverse and varied regional impacts, evident today and forecast into
                                                            the future (Noble et al., 2014), presenting challenges and opportunities for agricultural produ-
                                                            cers worldwide. Given that climate change is already affecting producers, utilizing weather and
                                                            climate data can assist managers in capitalizing on new opportunities while reducing financial
                                                            risks. Agricultural service providers play an important role in this context; public sector tech-
                                                            nical experts, extension professionals and private consultants all provide farmers with import-
                                                            ant information and services as they make production decisions and consider climate change.
                                                                Agricultural service providers operate across many organizations, including the USDA
                                                            Farm Service Agency (FSA). The overarching mission of FSA is ‘to equitably serve all farmers,
                                                            ranchers and agricultural partners through the delivery of effective, efficient agricultural pro-
       © Cambridge University Press 2018. This is a
                                                            grams for all Americans’ (USDA-FSA, 2017a). FSA administers disaster assistance through
       work of the U.S. Government and is not               multiple programs, necessitating that employees interface with farmers and ranchers immedi-
       subject to copyright protection in the               ately following extreme climate and weather events. The Agency also supports the conservation
       United States. This is an Open Access article,       of vulnerable agricultural lands with two programs containing incentives for: (a) the removal
       distributed under the terms of the Creative
                                                            of ecologically sensitive agricultural land from production (through programs such as the
       Commons Attribution licence (http://
       creativecommons.org/licenses/by/4.0/), which         Conservation Reserve Program, or CRP) and (b) conservation practices on active agricultural
       permits unrestricted re-use, distribution, and       land (through programs such as the Continuous Conservation Reserve Program or C-CRP).
       reproduction in any medium, provided the             Because of these core functions, in combination with their frequent and sustained contact
       original work is properly cited.                     with farmers and ranchers, FSA employees regularly deliver services that support the overlap-
                                                            ping goals of conservation and climate-adaptation.
                                                                Considering the great impact that agricultural service providers have on agricultural com-
                                                            munities across the USA, it is important to understand the factors that influence the intentions
                                                            of these individuals to access and use climate-relevant information in their professional

Downloaded from https://www.cambridge.org/core. 13 Apr 2021 at 09:25:55, subject to the Cambridge Core terms of use.
Renewable Agriculture and Food Systems 213
services. A rich body of research developed over the past decade management decisions. Whether or not individuals within
focuses on climate change beliefs and risk perceptions of agricul- boundary organizations such as FSA have access to or familiarity
tural stakeholders, and if these beliefs lead to different behavioral with current climate and weather information may have
outcomes. For our purposes, climate belief is a belief that the cli- implications for how they assist agricultural producers in addres-
mate is changing in a manner sufficient to impact producer man- sing climate- and weather-related risks. Specifically, the appropri-
agement decisions. A selection of research explores beliefs and ate use of climate forecasts is important for providing services
risk perceptions among farmers (Niles et al., 2013; Prokopy related to a number of relevant agricultural decision-making
et al., 2015a; Mase et al., 2016), extension professionals (Fraisse processes.
et al., 2009; Prokopy et al., 2015b; Campbell and Tomlinson,
2016) and climate scientists (Cook et al., 2016). While USDA
Theoretical background and variable selection
employees are included in some of these studies as subsets of
the populations of interest, there are no investigations that specif- The motivating factors that activate behavior are not necessarily
ically target FSA employees, nor are there any that take a national linear but modulated through beliefs and experiences, which
approach to their assessment. can lead to support for climate adaptation or mitigation actions
To address this gap, a nation-wide survey of FSA employees (Niles et al., 2013; van der Linden, 2014; Arbuckle et al., 2015).
was conducted, targeting individuals who work directly with agri- Structural equation modeling lends itself well to this type of ana-
cultural producers. In this paper, we explored two primary lysis as it incorporates interactions between variables in its calcu-
research questions. First, among FSA field staff, what is the rela- lation of model fit. The factors considered in this study are climate
tionship between climate and weather perceptions and current belief, personal experience with extreme weather, perception of
professional use of weather and climate data? Secondly, how weather-related risk and the belief that producers will need to
well do FSA employees’ beliefs and perceptions in these areas pre- adapt to climate change in order to remain viable. It is widely
dict their willingness to integrate more climate and weather data accepted that many factors influence agricultural service provi-
into their professional services in the future? To answer these ders’ use of climate and weather-related information (Prokopy
questions, we developed and compared several structural equation et al., 2013), therefore the theoretical underpinnings of our
models (SEMs) that explore relationships between variables. approach are derived from a number of studies. While previous
Conducting these analyses enabled us to develop a broader under- research in the area of intention towards behavior change has
standing of how the variables may influence the intentions sometimes coupled SEMs in tight alignment with theoretical
regarding use of climate and weather information in the future models (e.g. Hansen et al. (2004)), this was not our approach.
by FSA field staff, particularly in the context of a changing Rather, we sought to draw from several theoretical frameworks
climate. utilized in previous studies that help explain relationships between
belief, perceptions of risk, experiences, intentions to act and
behavior change. For example, Roesch-McNally et al. (2017) com-
Background bined components of the Theory of Planned Behavior (Ajzen,
1991), the Reasoned Action Approach (Fishbein and Ajzen,
FSA as an agricultural boundary organization
2010) and the Anatomy of Adaptation Typology (Smit et al.,
The majority (66%) of FSA employees are located in county and 2000) to examine the influence of farmers’ perceptions of weather
state offices around the USA. To meet their mission, FSA relies variability on their willingness to adopt specific conservation
upon approximately 2500 peer-elected county committee mem- practices as a climate adaptation response. Other studies used to
bers to help administer FSA programing (USDA-FSA, 2017b). inform our selection of variables took a less formal approach to
Climate adaptation, specifically managing weather-related risks using theory to guide statistical models, as in Spence et al.
through insurance, disaster relief and conservation, is within the (2011) in their use of Goal Setting Theory to address the role of
purview of FSA programing, meaning FSA employees are well personal experience of extreme events. Likewise, Haden et al.
situated to support agricultural communities as the climate con- (2012) explored personal experiences with climate change and
tinues to change. its relative influence on exposure to risk as a motivating driver
Familiarity with climate science and use of climate and wea- of behavior change, using Construal Level Theory as the basis
ther data, including forecasts and outlooks, are important duties of their investigation. Though they are drawn from many different
carried out by members of some boundary organizations (Hu theoretical frames, the studies referenced above and many more
et al., 2006). Coined by Guston (1999), boundary organizations all contribute to our understanding of how adaptive decisions
are those that serve as a conduit of information between stake- are made, and illustrate relevant factors that describe agricultural
holder groups. Carr and Wilkerson (2005) further describe how service providers’ intentions to use climate and weather informa-
these organizations facilitate the ability of groups to retain their tion in service delivery with producers in the future. The findings
cultural identity while learning about the perspectives of another thus are likely to inform service delivery to agricultural producers
group. Boundary organizations can also serve as tools toward in the era of climate change.
what Jasanoff (1996) calls ‘co-production of knowledge and social
order’ (1996, p. 393) or the actionability of science in both man- Climate belief
agement and policy sectors. We suggest that, because of the com- According to Fishbein and Ajzen (2010), beliefs are a precursor to
mon spaces inhabited by FSA programs and FSA county attitudes, which can ultimately lead to behavioral changes. It
committees, FSA is an example of a boundary organization. stands to reason that attitudes or the favorable or unfavorable
Additionally, some farmer groups consider FSA employees a appraisal of a specific behavior (Beedell and Rehman, 2000)
top source of soil and water conservation information (Tucker also influence behavioral intentions (Bayard and Jolly, 2007). In
and Napier, 2002), and it is likely that FSA employees will interact the USA, much research conducted on the climate beliefs of
with producers before, during and after important farm agricultural advisors (and how these beliefs influence service
Downloaded from https://www.cambridge.org/core. 13 Apr 2021 at 09:25:55, subject to the Cambridge Core terms of use.214 R. E. Schattman et al.
provision) focuses on the Midwest (Prokopy et al., 2017).1 In one Perception of weather-related risk
such study, researchers found that agricultural advisors have vary- Behavioral intentions are driven, in part, by perceptions of climate
ing degrees of willingness to discuss climate change with produ- and weather-related risks (O’Conner et al., 1999; Zahran et al.,
cers, and that willingness is often associated with program area 2006; Arbuckle et al., 2013b; Hyland et al., 2015). Some evidence
(Haigh et al., 2015). The majority (74%) of extension profes- suggests that an individuals’ perception of the severity of climate
sionals surveyed in the Midwest region believe that climate change risks is likely to outweigh the actual risks. This applies to indivi-
is taking place, while 23% attributed the cause of modern climate duals’ willingness to support climate-friendly policies and other
change mostly to human activity (Prokopy et al., 2015b). climate-oriented actions or initiatives (Arbuckle et al., 2015).
Attribution skepticism or the belief that recent climate change is Niles and Mueller (2016) found that perception of climate-related
not a consequence of human activities, is a barrier to discussions changes (and associated risk) are influenced by an individual’s
between advisors and producers about mitigation and adaptation belief in climate change, their prior support for climate-related pol-
practices. Several studies suggest that whether or not an individual icy and the presence of practices that lessen the felt-impact of wea-
believes in climate change and human attribution has implications ther events (e.g. irrigation infrastructure). Political ideology can also
for that individual’s subsequent support of mitigation and adaption be associated with risk perception, as well as support for climate
activities (Howden et al., 2007; Arbuckle et al., 2013a, b; Hyland adaptation and mitigation activities (Takahashi et al., 2016;
et al., 2015; Chatrchyan et al., 2017). Agricultural advisors are Running et al., 2017). Kahan’s (2015) distinction between scientific
more likely to believe in an anthropogenic cause of climate change literacy around climate change and the influence that social net-
if they perceive that unusual weather variability is occurring, and works have on individuals’ belief and decision-making help to
this belief influences their perspectives on agricultural adaptation explain why access to scientific information is not the most import-
(Mase et al., 2015). Further, advisors who believe in an anthropo- ant limitation when it comes to behavior change. Scientific literacy
genic role in climate change are more likely to make ‘climate- still plays a role, however, as Lemos et al. (2014b) show that agri-
conscious recommendations’ to their clients and are more likely cultural service providers are more likely to provide producers
to agree that they should assist farmers in preparing for climate with climate information when the service providers’ concern
change (Mase and Prokopy, 2014; Chatrchyan et al., 2017, p. 13). about long-term risks of climate change for agriculture are high.
Other research, however, challenges the degree to which climate
change beliefs or the understanding of climate science translates
Belief that producers will need to adapt
into either risk perception or support for adaptation behavior.
While the need to adapt agricultural practices to changing climate
For example, normative influences such as political party and social
conditions is a widely accepted concept among scientists and
group affiliation have been shown to influence behavioral intentions
many policymakers (Noble et al., 2014), it is not universal, and
(Takahashi et al., 2016; Running et al., 2017). Furthermore, Niles
research does not necessarily demonstrate that an agricultural
et al. (2016) found that climate change belief was not a significant
producer’s belief that climate adaptation is necessary will influ-
correlate of actual behavior changes at a farm level for climate miti-
ence climate-adaptive behavior. Amongst producers, previous
gation and adaptation, only a driver of intention to change.
use or adoption of a practice or behavior can be a greater driver
than belief in climate change or the need for adaption. For
Personal experience with extreme weather example, Roesch-McNally et al. (2017), show that a producer’s
There is debate about the importance of personal experience with current use of specific farm practices (e.g. no-till farming and
climate and weather-related events, specifically related to indivi- tile drainage) is the primary factor in predicting future use of
duals’ belief that climate change is occurring and intention to these same practices in response to projected climate impacts.
change their own behavior. While some research supports the Niles et al. (2016) found that the strongest drivers of both inten-
association between climate change belief and personal experience tion and implementation of adaptation practices were perceived
with extreme weather events (Spence et al., 2011; Haden et al., capacity and perceived likelihood of success. Despite this, the
2012; Akerlof et al., 2013), other studies find personal experience need for institutions and organizations to support agricultural
with these events does not have significant influence (Saad, 2015; adaptation remains widely discussed (Raymond and Robinson,
Carlton et al., 2016). The opposing findings in the above studies 2013), and there is evidence that producers and advisors agree
support the conclusion of Whitmarsh (2008), who finds that dif- on the efficacy of certain adaptation practices (Schattman et al.,
ferent weather events may have more or less influence on indivi- 2017). There is also evidence suggesting that agricultural advisors
duals’ intentions and behavior depending on the type of weather and farmers may form regional cultural cohorts, which function-
and the severity of impacts. For example, personal experience with ally reinforce each other’s world views, including those related to
floods has relatively low association with levels of climate-concern climate change adaptation (Prokopy et al., 2015b). Institutional
compared with personal experience with air pollution, while support for climate-outreach and education can be a driver on
Spence et al. (2011) show that personal experience with floods agricultural advisors’ willingness to discuss climate change with
is associated with greater concern for climate impacts (Myers farmers (Lemos et al., 2014a), potentially shifting the views of
et al., 2013). Among agricultural producers, personal experience their social group, including farmers.
with crop loss can increase perceptions of climate-related risks
(Menapace et al., 2015); however, other studies found that experi-
ence with major drought did not have significant impact on agri- Hypotheses
cultural advisors’ perceptions of risk or their attitudes about Based on the theoretical framing of our models and the evidence
adaptation (Carlton et al., 2016). of prior research, we developed the following hypothesis:
1
While FSA field staff are better described as agricultural service providers, there is
H1: Respondents’ current use of climate and weather data will pre-
overlap between advising and service provision. Both advisors and service providers dict respondents’ intentions to use such data in their future
offer management-related information to producers on a regular basis. professional services.
Downloaded from https://www.cambridge.org/core. 13 Apr 2021 at 09:25:55, subject to the Cambridge Core terms of use.Renewable Agriculture and Food Systems 215
H2: Climate belief will have less influence on respondents’ inten- perceived weather-related risk, belief that producers will need to
tions to use climate and weather-related tools and information adapt and climate belief. We conducted a Kendell’s Tau B (non-
than those factors that measure perceptions of weather-related parametric test of association) to test respondents’ perceived
risk and personal experience with extreme weather events. dependence on historical weather data or weather and climate
forecasts. In addition, we utilized an independent latent variable
(i.e. current use of weather and climate information) in our ana-
Methods lysis, for which we provided eigenvalue, factor loadings and the
Cronbach alpha score. This variable was determined using princi-
Sampling and survey administration
pal component factors, which indicated a single factor solution
In fall, 2016, a team consisting of USDA Climate Hub collabora- with factor loadings significantly greater than a cut-off of 0.40
tors from the US Forest Service, FSA and the University of (Osborne and Costello, 2005). To measure similar latent concepts
Vermont developed a survey instrument for FSA field staff. represented in current use of weather and climate information, we
Many survey questions were adapted, with permission, from the created a scale to average responses (current use of weather and
Survey of Agricultural Advisors developed by the U2U project climate information = 0.93) (Clark and Watson, 1995), which
(Prokopy et al., 2013, 2017). In November, the survey was tested had a Cronbach’s alpha coefficient higher than 0.70, a generally
by four agency staff in states in different regions of the country. accepted cut-off point for reliability (Nunnally, 1978). We identi-
Adjustments to the survey were made in response to feedback fied an intention to use weather and climate information as an
from these tests. Respondent email addresses and position titles observed, dependent variable, which we used to measure respon-
were collected from the publicly available, online USDA Service dents’ intention either to continue the use of these resources in
Center directory. The survey was designed to target FSA staff in their professional service (if they already use them) or to adopt
all US states and territories who work directly with agricultural the use of these resources in the future.
land managers, therefore those individuals with job titles who
were unlikely to fulfill this description were removed.
Additionally, survey participants were asked early in the survey Structural equation model
whether they work directly with land managers. Only those We utilized SEMs to assess the relationship between climate
who reported that they did so were included in our analysis. change experiences, belief, risk and adaptation perceptions, use
The total number of FSA staff targeted for the survey was of weather and climate information, and intention to use weather
10,614. Institutional Review Board approval was granted through and climate information in the future. We developed two models
The University of Vermont under an exempt status (IRB to assess the variables that predict an FSA employee’s intention to
Approval Number CHRBSS: 17-0254). use weather and climate information with their farmer constitu-
Survey recruitment followed the tailored design method for ents. The first (model 1) was a conceptual model based on exist-
online surveys (Dillman et al., 2008). FSA Deputy Administrators ing theory of climate experience and beliefs. The second (model
of Field Offices (DAFOs) in all states and territories were asked 2) included a latent variable to assess the extent to which current
to send an introductory email to field staff explaining that the sur- use of weather and climate information is likely to predict inten-
vey would be arriving by email. The first solicitation for survey par- tion to use such practices in the future. The comparison of the
ticipation was released three days later. Two follow-up reminders two models allowed us to test H1 (whether or not respondents’
were sent one week apart. The survey was closed three weeks fol- current use of climate and weather information was associated
lowing the final solicitation. In total, 4621 people responded to with their intention to do so in the future). Both models allowed
the survey (42% response rate, calculated using RR4 methods us to test H2 (that climate belief has a lower relative influence on
from the American Association of Public Opinion Research). To the dependent variable than those factors that measure percep-
conduct non-response bias tests, we used the wave analysis tions of weather-related risk and personal experience with
approach as described by Phillips et al. (2016). Respondents were extreme weather events). Models were constructed and analyzed
divided into three groups based on if they responded to the first, using Stata 13 structural equation modeling (StataCorp LLC,
second or third requests for participation. Responders to the College Station, Texas). SEMs were estimated using maximum-
third request were assumed to be representative of non-responders. likelihood estimations with missing values to avoid listwise dele-
We tested differences in demographic variables as well as responses tions of responses and with bootstrap standard errors (n = 500).
to questions covering the topics of climate change belief, climate Model 2 was constructed first with a confirmatory factor analysis
adaptation and on-farm greenhouse gas emission reductions. of the latent variable construct and observed variables (Table 1),
There was no significant difference between early and late which was confirmed by a Cronbach alpha test. The addition of
responses to these questions. Respondents to the survey were dis- the latent variable to model 2 was further assessed through modi-
proportionately female (67 vs 26% male), white (86%) and fication indices to add additional covariances between observed
non-Hispanic (87%), which does not differ significantly from the variables. FIML (full information maximum-likelihood) estimates
target population. The number of respondents in each state and were used to run both models, which adjusts the likelihood func-
territory reflected the population of the FSA workforce in those tion so that each case contributes information on the variables
states and territories, as determined by reviewing the percentage that were observed (Enders and Bandalos, 2001).
of respondents in each state compared with the overall number
of FSA employees targeted for our survey in each state. The average
response rate by the state was 45%; the standard deviation was 14%. Results
The analysis presented in this paper utilizes five questions
Descriptive results
from the survey. Table 1 reports these questions, their variables,
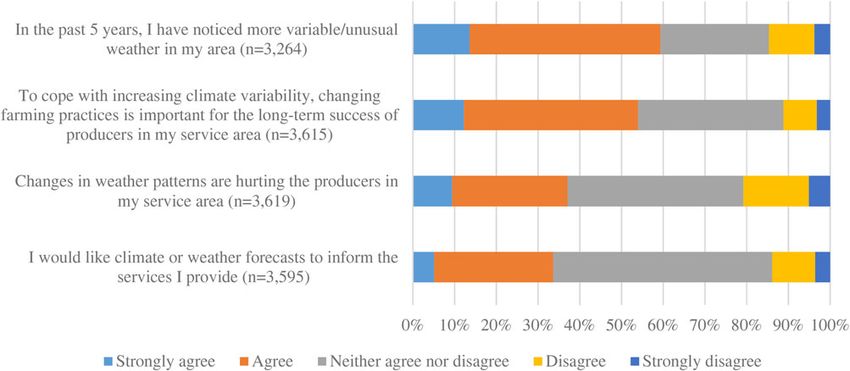
scales, means and standard deviations. Independent observed The majority (59%) of respondents agree or strongly agree that
variables used in this analysis include observed weather variability, they have noticed more variable or unusual weather in their
Downloaded from https://www.cambridge.org/core. 13 Apr 2021 at 09:25:55, subject to the Cambridge Core terms of use.216 R. E. Schattman et al.
Table 1. Model scales and variables with measures of reliability.
Eigen Factor Cronbach
Variable Question/statement Scale Mean SD value loadings alpha
Intention to use I would like climate or Five-point scale (1 = 3.21 0.832 – – –
weather and weather forecasts to inform strongly disagree, 5 =
climate the services I provide strongly agree)
informationa
Observed weather In the past 5 years, I have Five-point scale (1 = 3.55 0.982 – – –
variability noticed more variable/ strongly disagree, 5 =
unusual weather in my area strongly agree)
Perceived Changes in weather patterns Five-point scale (1 = 3.21 0.984 – – –
weather-related are hurting the producers in strongly disagree, 5 =
risk my service area strongly agree)
Belief that producers To cope with increasing Five point scale (1 = 3.52 0.921 – – –
will need to adapt climate variability, changing strongly disagree, 5 =
farming practices is important strongly agree)
for the long-term success of
the producers in my service
area
Climate belief Please select the statement Five-point scale: 1 = less 3.44 0.982 – – –
that best reflects your beliefs agreement with
about climate change scientific consensus on
climate change, 5 =
greater agreement)
Current use of In general, how dependent are you Four-point scale: 1 = not 2.21 0.015 5.01 0.93
weather and on the following types of weather dependent, 4 = very
climate information to do your job? dependent
information (1) Historical weather trends 0.790
(2) Weather data for the past 12 0.809
months
(3) Current weather conditions 0.865
(4) 1–7-day forecasts 0.843
(5) 8–14-day outlooks 0.873
(6) Monthly or seasonal outlooks 0.895
(7) Annual or longer term 0.837
outlooks
SD, standard deviation.
Italics indicate sub-sections of a question (e.g. for ‘Current use of weather and climate information’ each question is italicized).
a
Dependent variable.
locality. Respondents were less likely to agree that changing wea- either historical weather trends or longer-term outlooks. The
ther patterns cause harm to producers in their area (37% agree or Kendell’s Tau B showed that use of any of these weather or climate
strongly agree). The climate-related future impacts on agricultural data sets is correlated with every other data set (τB scores were
production that respondents reported being either concerned or between 0.453 and 0.889, all P < 0.01), meaning that individuals
very concerned about included: longer dry periods and drought were either likely to use several or all these tools in their profes-
(65%), increased heat stress on crops (51%), increased weed pres- sional services, or none. To understand how FSA employees use
sure (50%), increased heat stress on livestock (47%), increased climate and weather resources, respondents were asked to report
insect pressure (44%), higher incidence of crop disease (43%) the programmatic context in which they applied these resources,
and more frequent extreme rain events (41%). Over half of and the types of resources they use and are most familiar with.
respondents (54%) agree or strongly agree that, in order to ensure Program areas in which 30% or more of the respondents are
long-term success, agricultural producers will need to adapt to cli- using historical weather trends and/or forecasts in discussions
mate variability by changing farming practices. Approximately with producers include: crop rotations/field assignments (32%),
one-third (34%) of respondents agreed or strongly agreed that crop/variety choices (35%), purchasing crop insurance or enrol-
they would like climate or weather forecasts to inform the services ling in the Non-insured Crop Disaster Assistance Program or
they provide (see Fig. 1). NAP (51%) and planting or harvesting schedules (42%).
The majority (77%) of respondents believe that climate change
is occurring, while a minority of respondents (13%) attribute cli-
Structural equation model
mate change primarily to human activities (the option most
aligned with scientific consensus, see Cook et al. (2016)). A larger Model 1 (Fig. 2) utilized four observed variables: observed weather
group (46%) of respondents believes that climate change is caused variability, perceived weather-related risk, belief that producers will
equally by human activities and environmental factors. need to adapt and climate belief. Model 2 (Fig. 3) incorporated a
Respondents reported that they were more dependent on cur- latent variable derived from respondents’ current use of weather
rent weather conditions and 1–7-day forecasts than they were on and climate information. Model 1 (χ2/df = 1), had a CFI of
Downloaded from https://www.cambridge.org/core. 13 Apr 2021 at 09:25:55, subject to the Cambridge Core terms of use.Renewable Agriculture and Food Systems 217
Fig. 1. Responses to questions leading to the observed variables used in SEM.
0.999 and a RMSEA of 0.034. Model 2 (χ2/df = 37), had a CFI of good predictor of whether they intend to do so in the future. In
0.992 and a RMSEA of 0.043. While the model R 2 values and fit the following section, as we investigate the influence of select vari-
statistics show that they are both good models, Model 1 has a ables, we will report statistics from model 1 unless specifically
lower AIC score (ΔAIC = 48,583; ΔBIC = 48,793). Further, the noted otherwise.
additional complexity of the latent variable to Model 2 contri-
butes only a marginal increase in the explained variability (R 2) Climate belief
of the dependent variable, from 0.229 to 0.291, suggesting that Overall the model predicts 19% of the variance for climate belief
the latent variable only predicts about 6% of the variability in (R 2 = 0.194), with both observed weather variability (β = 0.336,
the dependent variable. Thus, the addition of the latent variable P < 0.001) and perceived weather risk (β = 0.141, P < 0.001) posi-
does not contribute greatly to our efforts to understand why tively associated with climate belief. Respondents who believed
FSA employees may or may not wish to use weather and climate in climate change, and who were in greater agreement with the
data during service provision. This finding disproves H1, which scientific consensus on its causes, were more likely to believe
anticipated that the latent variable would enhance the model. In that on-farm adaptation is necessary in order for farms to remain
other words, whether or not an FSA employee currently uses wea- viable in the future. However, the relative influence of climate
ther and climate information in their professional services is not a belief in the model is low. This confirms H2, which anticipated
Fig. 2. Significant pathways in model 1 with standardized coefficients.
Downloaded from https://www.cambridge.org/core. 13 Apr 2021 at 09:25:55, subject to the Cambridge Core terms of use.218 R. E. Schattman et al.
Fig. 3. Significant pathways in model 2 with latent variable and standardized coefficients. A full model including non-significant pathways can be found in the
Supplementary Materials (Fig. S1).
that individuals’ beliefs (associated with sense of self and social through the belief that producers will need to adapt. The finding
position) would have less influence than variables not associated that the latter variable explains more variation within the model
with climate belief. In model 2, there was no significant relation- and has a stronger association with the dependent variable than
ship between climate belief and current use of climate and weather climate belief is unexpected because the statements that generated
data. both variables include the term climate change, while other state-
ments used less contested terms such as weather variability and
Perceptions of weather-related risk and observed weather weather forecasts.
variability
The model predicts 57% of the variance for perceptions of
weather-related risk (R 2 = 0.567). This variable has a strong posi- Discussion
tive influence on the belief that producers will need to adapt (β = The results of the comparison between models 1 and 2, as well as
0.365, P < 0.001), intention to use climate and weather information the relatively stronger fit statistics in Model 1, illustrate three
(β = 0.266, P < 0.001) and climate belief (β = 0.141, P < 0.001). important findings. First, the latent variable included in model
This implies that respondents who believe that changing weather 2, which described respondents’ current use of weather and cli-
patterns cause harm to producers in their area are more likely to mate information, did not lead to improved model fit. Model 2
believe in climate change, agree that adaptation is necessary, and describes an important relationship between respondents’ current
intend to use weather and climate information in the future. This use of climate and weather information and their intention to do
variable is highly correlated with observed weather variability (β = so in the future (β = 0.258, P < 0.001). However, the comparison
0.644, P < 0.01). Respondents who reported noticing more vari- between the two models implies that not using weather and cli-
able weather in their region in the past 5 years are more likely mate data in the present may not be a barrier to doing so in
to believe in climate change (β = 0.336, P < 0.001), believe that the future, indicating potential opportunities to increase the
producers will need to adapt (β = 0.339, P < 0.001), and agree awareness and the current use of weather and climate information
that variable weather is causing harm to producers in their area amongst appropriate FSA field staff. Additionally, 34% of respon-
(β = 0.644, P < 0.001). dents reported that they would like to use climate and weather
tools in the future. Therefore, we reject H1, and find that respon-
Belief that producers will need to adapt dents’ current use of climate and weather data does not predict
The model predicts 49% of the variance for the belief that produ- respondents’ intentions to use such data in future professional
cers will need to adapt (R 2 = 0.491). This variable has a direct services.
influence on intention to use climate and weather information Secondly, we clarified the role and level of importance that cli-
in the future (β = 0.241, P < 0.001). In addition, climate belief mate change belief plays in anticipating the intentions of FSA
had a positive effect on the belief that producers will need to employees to use climate and weather data in the future. The
adapt (β = 0.123, P < 0.001). While climate belief had a relatively majority (64%) of survey respondents believe that climate change
weak direct influence on the dependent variable (β = 0.054, P < is occurring. Fewer survey respondents (13%) correctly attributed
0.001), the model suggests that the climate belief is moderated the cause of modern climate change to human activities than the
Downloaded from https://www.cambridge.org/core. 13 Apr 2021 at 09:25:55, subject to the Cambridge Core terms of use.Renewable Agriculture and Food Systems 219
general population in the USA has in similar surveys (Howe et al., advisors were open to greater incorporation of weather and cli-
2015). The Yale Climate Opinion polls (Marlon et al., 2016) mate information into their services (Prokopy et al., 2013).
report that 37% of US citizens agree that climate change is pri- With the likely opportunity that FSA field staff are open to
marily caused by human activity. The 2016 Gallup Poll reported increasing their professional use of climate and weather data,
that 65% of US citizens believe that warming temperatures are the the question then becomes, how? It is important to recognize
effect of human pollution (Saad and Jones, 2016). Although the that not all climate and weather information is equally useful to
results of these studies and our own are not directly comparable, agricultural service providers. Agricultural service providers will
noting the different outcomes is a useful exercise as we develop a benefit the most from professional development opportunities
better understanding of agricultural stakeholders as a subset of the that introduce them to information and resources that are (a)
US population. While earlier research shows that lesser degrees of unfamiliar to them and (b) relevant to their customers’ produc-
climate skepticism are associated with pro-environmental behavior tion decisions (Hayman et al., 2007).
(Poortinga et al., 2011), Hornsey et al.’s research (2016) suggests
that attribution skepticism may not be a barrier to climate-related
pro-environmental behavior as previously assumed. Conclusion
In support of this emerging framing of the relationship Given the unique organizational structure of FSA, in combination
between climate skepticism and climate change related behavior with the importance of the services this agency provides to US
or intentions, we found that whether or not an FSA employee producers, employees of this agency play an important role in
accurately identifies the causes of climate change has less impact providing information and support to land managers. Greater
on their desire to use climate and weather data than other factors. integration of weather and climate information into relevant
Therefore, we accept H2, and find that climate belief has less influ- FSA programs and services may be an opportunity for enhanced
ence on FSA employees’ intentions to use climate and weather- service provision and program efficacy. Findings from this study
related tools and information than those factors that measure per- show that FSA respondents’ perceptions of weather-related risk
ceptions of weather-related risk and personal experience with in combination with their personal observations of weather vari-
extreme weather events. In addition, we found a non-significant ability help predict if an individual is likely to use weather and cli-
relationship between climate change belief and current usage of mate information in the future. The belief that producers will have
climate and weather information. These findings provide valuable to adapt to climate change in order to remain viable is a signifi-
insights for those engaged in communication of climate science cant predictor of whether respondents intend to use climate and
with non-scientific audiences. Beliefs, including climate belief, weather information in the future, and there is a notable willing-
are strongly associated with an individual’s social and cultural iden- ness on behalf of FSA field staff to do so. While important,
tity rather than their level of knowledge (Kahan, 2015). Our find- climate belief has relatively less influence on respondents’ inten-
ings suggest that, as long as the topic of communication between tions to use this information. Our study disproves the hypothesis
scientific experts and land managers is related to adaptation, that current use of weather and climate-related tools predicts
there is ample common ground available when discussing technical respondents’ intention to use these tools in their professional ser-
and applied approaches for climate change risk reduction. vices in the future. Overall, our work implies that there are ample
While belief in climate change may not predict an individuals’ opportunities to increase employee exposure and proficiency with
intention to use climate and weather data in the future, it may sig- relevant sources of weather and climate information.
nal other behaviors or belief systems that influence service provi-
sion. For example, belief about climate change and its underlying Supplementary material. The supplementary material for this article can
causes is associated with differing levels of support for climate be found at https://doi.org/10.1017/S1742170517000783.
mitigation policies (Niles et al., 2013; van der Linden et al.,
Acknowledgements. USDA Climate Hubs leadership, staff and Executive
2015) and variation between agricultural stakeholders’ support Committee. FSA employees who contributed their time to reviewing the sur-
for climate adaptation measures (Arbuckle et al., 2013b, 2014). vey, providing feedback on survey questions and thoughtfully responding. We
In the context of agricultural service providers, attribution skepti- specifically would like to thank Rich Iovanna and Mary Carey for their assist-
cism may not be an impediment to the use of climate and ance and consideration; two anonymous reviewers and the guest editor of this
weather-related tools and resources. However, increasing access special issue.
to scientifically grounded climate information may enable a
broader understanding of climate change causes and conse-
quences among some agricultural service providers, leading to References
more support for additional adaptation and mitigation activities. Ajzen I (1991) The theory of planned behavior. Organizational Behavior and
Thirdly, we found that respondents’ perceptions of weather- Human Decision Processes 50(2), 179–211. doi: 10.1016/0749-5978(91)
related risk and observed weather variability are highly correlated. 90020-T.
As previously discussed, the role that personal experience plays in Akerlof K, Maibach EW, Fitzgerald D, Cedeno AY and Neuman A (2013)
developing an individuals’ sense of weather-related risks is Do people “personally experience” global warming, and if so how, and
explored (and questioned) in several studies. Our study supports does it matter? Global Environmental Change 23(1), 81–91. doi: 10.1016/
the position articulated in Menapace et al. (2015), Spence et al. j.gloenvcha.2012.07.006.
(2011) and Scannell and Gifford (2013), that observed weather Arbuckle JG, Haigh T, Hobbs J and Knoot T (2013a) Climate change beliefs,
concerns, and attitudes toward adaptation and mitigation among farmers in
variability (interpreted as personal experience with weather vari-
the Midwestern United States. Drought Mitigation Center Faculty
ability) and its close relationship with perceptions of weather- Publications 11, 1–13.
related risk influences the intentions of FSA employees to use Arbuckle JG, Morton LW and Hobbs J (2013b) Farmer beliefs and concerns
climate and weather information in the future. about climate change and attitudes toward adaptation and mitigation: evi-
Our findings also echo research pertaining to several dence from Iowa. Climatic Change, 118(3–4), 551–563. doi: 10.1007/
Midwestern US states, where it was shown that agricultural s10584-013-0700-0.
Downloaded from https://www.cambridge.org/core. 13 Apr 2021 at 09:25:55, subject to the Cambridge Core terms of use.220 R. E. Schattman et al.
Arbuckle JG, Hobbs J, Loy A, Morton LW, Prokopy LS and Tyndall J (2014) resistant to influence? Some cause for optimism. Environment and
Understanding corn belt farmer perspectives on climate change to inform Behavior 48(7), 905–928. doi: 10.1177/0013916515574085.
engagement strategies for adaptation and mitigation. Journal of Soil and Howden SM, Soussana J, Tubiello FN, Chhetri N, Dunlop M, Meinke H,
Water Conservation 69(6), 505–516. doi: 10.2489/jswc.69.6.505. Howden SM, Soussana J, Tubiello FN, Chhetrill N and Dunlop M
Arbuckle JG, Morton LW and Hobbs J (2015) Understanding farmer per- (2007) Adapting agriculture to climate change. Proceedings of the
spectives on climate change adaptation and mitigation: the roles of trust National Academy of Sciences of the United States of America 104(50),
in sources of climate information, climate change beliefs, and perceived 19691–19696. doi: 10.1073/pnas.0701890104.
risk. Environment and Behavior 47(2), 205–234. doi: 10.1177/ Howe PD, Mildenberger M, Marlon JR and Leiserowitz A (2015)
0013916513503832. Geographic variation in opinions on climate change at state and local scales
Bayard B and Jolly C (2007) Environmental behavior structure and socio- in the USA. Nature Climate Change 5, 596–603. doi: 10.1038/nclimate2583.
economic conditions of hillside farmers: a multiple-group structural equa- Hu Q, Zillig LMP, Lynne GD, Tomkins AJ, Waltman WJ, Hayes MJ,
tion modeling approach. Ecological Economics 62, 433–440. doi: 10.1016/ Hubbard KG, Artikov I, Hoffmann SJ and Wilhite DA (2006)
j.ecolecon.2006.07.004. Understanding farmer’s forecast use from their beliefs, values, social
Beedell J and Rehman T (2000) Using social-psychology models to understand norms, and perceived obstacles. Journal of Applied Meteorology and
farmers’ conservation behaviour. Journal of Rural Studies 16, 117–127. Climatology 45(9), 1190–1201. doi: 10.1175/JAM2414.1.
Campbell A and Tomlinson P (2016) Climate change challenges for extension Hyland JJ, Jones DL, Parkhill KA, Barnes AP and Williams AP (2015)
educators: technical capacity and cultural attitudes. Journal of Extension 54 Farmers’ perceptions of climate change: identifying types. Agriculture and
(6), 1–14. Human Values, Springer Netherlands 33(2), 323–339. doi: 10.1007/
Carlton JS, Mase AS, Knutson CL, Lemos MC, Haigh T, Todey DP and s10460-015-9608-9.
Prokopy LS (2016) The effects of extreme drought on climate change beliefs, Jasanoff S (1996) Beyond epistemology: relativism and engagement in the pol-
risk perceptions, and adaptation attitudes. Climatic Change 135(2), 211–226. itics of science. Social Studies of Science 26(2), 393–418. doi: 10.1177/
doi: 10.1007/s10584-015-1561-5. 030631296026002008.
Carr A and Wilkinson R (2005) Beyond participation: boundary organiza- Kahan D (2015) Climate-science communication and the measurement prob-
tions as a new space for farmers and scientists to interact. Society and lem. Political Psychology 36(S1), 1–43. doi: 10.1111/pops.12244.
Natural Resources 18(3), 255–265. doi: 10.1080/08941920590908123. Lemos MC, Kirchhoff CJ, Kalafatis SE, Scavia D and Rood RB (2014a)
Chatrchyan AM, Erlebacher RC, Chaopricha NT, Chan J, Tobin D and Moving climate information off the shelf: boundary chains and the role
Allred SB (2017) United States agricultural stakeholder views and decisions of RISAs as adaptive organizations. Weather, Climate, and Society 6(2),
on climate change. Wiley Interdisciplinary Reviews: Climate Change 8(5), 1– 273–285. doi: 10.1175/WCAS-D-13-000441.
21. doi: 10.1002/wcc.469. Lemos MC, Lo YJ, Kirchhoff C and Haigh T (2014b) Crop advisors as climate
Clark LA and Watson D (1995) Constructing validity: basic issues in objective information brokers: building the capacity of us farmers to adapt to climate
scale development. Psychological Assessment 7(3), 309–319. change. Climate Risk Management 4, 32–42. doi: 10.1016/j.crm.2014.08.001.
Cook J, Oreskes N, Doran PT, Anderegg WRL, Verheggen B, Maibach EW, Marlon J, Howe P, Mildenberger M and Leiserwitz A (2016) Yale Climate
Carlton JS, Lewandowsky S, Skuce AG, Green SA, Nuccitelli D, Jacobs P, Opinion Maps, U.S. 2016. New Haven CT: Yale Program on Climate
Richardson M, Winkler B, Painting R and Rice K (2016) Consensus on Change Communication.
consensus: a synthesis of consensus estimates on human-caused global Mase AS and Prokopy LS (2014) Unrealized potential: a review of perceptions
warming. Environmental Research Letters, IOP Publishing 11(4), 48002. and use of weather and climate information in agricultural decision making.
doi: 10.1088/1748-9326/11/4/048002. Weather, Climate, and Society 6(1), 47–61. doi: 10.1175/WCAS-D-12-00062.1.
Dillman DA, Smyth JD and Christian LM (2008) Internet, Mail, and Mase AS, Cho H and Prokopy LS (2015) Enhancing the social amplification
Mixed-mode Surveys: The Tailored Design Method, 2nd edn. Hoboken, of risk framework (SARF) by exploring trust, the availability heuristic, and
NJ: John Wiley & Sons, Ltd. doi: 10.2307/41061275. agricultural advisors’ belief in climate change. Journal of Environmental
Enders CK and Bandalos DL (2001) The relative performance of full informa- Psychology 41, 166–176. doi: 10.1016/j.jenvp.2014.12.004.
tion maximum likelihood estimation for missing data in structural equation Mase AS, Gramig BM and Prokopy LS (2016) Climate change beliefs, risk
models. Structural Equation Modeling: A Multisdisciplinary Journal 8(3), perceptions, and adaptation behavior among Midwestern U.S. crop farmers.
430–457. doi: 10.1207/S15328007SEM0803. Climate Risk Management, The Authors 15, 8–17. doi: http://dx.doi.org/
Fishbein M and Ajzen I (2010) Predicting and Changing Behavior: The 10.1016/j.crm.2016.11.004.
Reasoned Action Approach. New York: Taylor and Francis. Menapace L, Colson G and Raffaelli R (2015) Climate change beliefs and per-
Fraisse CW, Breuer NE, Zierden D and Ingram KT (2009) From climate ceptions of agricultural risks: an application of the exchangeability method.
variability to climate change: challenges and opportunities to extension. Global Environmental Change, Elsevier Ltd 35, 70–81. doi: 10.1016/
Journal of Extension 47(2), 1–10. doi: 10.1088/1755-1307/6/4/242015. j.gloenvcha.2015.07.005.
Guston D (1999) Stabilizing the boundary between U.S. politics and science. Myers TA, Maibach EW, Roser-Renouf C, Akerlof K and Leiserowitz AA
Social Studies of Science 29(1), 87–111. doi: 10.1177/030631299029001004. (2013) The relationship between personal experience and belief in the real-
Haden VR, Niles MT, Lubell M, Perlman J and Jackson LE (2012) Global and local ity of global warming. Nature Climate Change, Nature Publishing Group
concerns: what attitudes and beliefs motivate farmers to mitigate and adapt to 3(4), 343–347. doi: 10.1038/nclimate1754.
climate change? PLoS ONE 7(12), 1–7. doi: 10.1371/journal.pone.0052882. Niles MT and Mueller ND (2016) Farmer perceptions of climate change:
Haigh T, Morton LW, Lemos MC, Knutson C, Prokopy LS, Lo YJ and associations with observed temperature and precipitation trends, irrigation,
Angel J (2015) Agricultural advisors as climate information intermediaries: and climate beliefs. Global Environmental Change, Elsevier Ltd 39, 133–142.
exploring differences in capacity to communicate climate. Weather, doi: 10.1016/j.gloenvcha.2016.05.002.
Climate, and Society 7(1), 83–93. doi: 10.1175/WCAS-D-14-00015.1. Niles MT, Lubell M and Haden VR (2013) Perceptions and responses to cli-
Hansen J, Marx S and Weber E (2004) The role of climate perceptions, expec- mate policy risks among California farmers. Global Environmental Change,
tations, and forecasts in farmer decision making: the Argentine Pampas and Elsevier Ltd 23(6), 1752–1760. doi: 10.1016/j.gloenvcha.2013.08.005.
South Florida. International Research Institute for Climate Predictions Niles MT, Dynes R and Brown M (2016) Farmer’s intended and actual adop-
Technical Report, pp. 1–142. tion of climate change mitigation and adaptation strategies. Climatic
Hayman P, Crean J, Mullen J and Parton K (2007) How do probabilistic sea- Change, 135, 277–295. doi: 10.1007/s10584-015-1558-0.
sonal climate forecasts compare with other innovations that Australian Noble IR, Huq S, Anokhin YA, Carmin J, Goudou D, Lansigan FP,
farmers are encouraged to adopt ? Australian Journal of Agricultural Osman-Elasha B and Villamizar A (2014) Climate change 2014: impacts,
Research, 58, 975–984. adaptation, and vulnerability. In Field CB, Barros VR, Dokken DJ, Mach KJ,
Hornsey MJ, Fielding KS, Mcstay R, Reser JP and Bradley GL (2016) Are Mastrandrea MD, Bilir TE, Chatterjee M, Ebi KL, Estrada YO, Genova RC,
people high in skepticism about anthropogenic climate change necessarily Girma B, Kissel ES, Levy AN, MacCracken S, Mastrandrea PR and
Downloaded from https://www.cambridge.org/core. 13 Apr 2021 at 09:25:55, subject to the Cambridge Core terms of use.Renewable Agriculture and Food Systems 221
White LL (eds) Global and Sectoral Aspects. Contribution of Working Group Saad L (2015) U.S. views on climate change stable after extreme winter, Gallup
II to the Fifth Assessment Report of the Intergovernmental Panel on Climate Poll Social Series: Environment. Available at http://www.gallup.com/poll/
Change. New York, pp. 833–868. Available at http://www.ipcc.ch/pdf/assess- 182150/views-climate-change-stable-extreme-winter.aspx.
ment-report/ar5/wg2/WGIIAR5-Chap14_FINAL.pdf. Saad L and Jones J (2016) U.S. Concern About Global Warming at Eight-Year
Nunnally JC (1978) Pscyhometric Theory, 2nd edn. New York: McGraw-Hill. High. Available at Gallup.com (Accessed June 30 2017).
O’Conner RE, Bord RJ and Fischer A (1999) Risk perceptions, general environmen- Scannell L and Gifford R (2013) Personally relevant climate change: the role
tal beliefs and willingness to address climate change. Risk Analysis 19(3), 461–471. of place attachment and local versus global message framing in engagement.
Osborne JW and Costello AB (2005) Best practices in exploratory factor ana- Environment and Behavior 45(1), 60–85. doi: 10.1177/0013916511421196.
lysis: four recommendations for getting the most from your analysis. Schattman RE, Mendez VE, Merrill SC and Zia A (2017) A mixed methods
Practical Assessment, Research and Evaluation 10(7), 1–9. Available at approach to understanding farmer and agricultural advisor perceptions
http://scholar.google.com/scholar?hl=en&btnG=Search&q=intitle:Best+Practices of climate change and adaptation in Vermont, United States. Agroecology
+in+Exploratory+FActor+Analysis:+Four+Recommendations+For+Getting and Sustainable Food Systems 24(2), 121–148. doi: 10.1080/21683565.2017.
+the+Most+FRom+Your+Analysis#2%5Cnhttp://scholar.google.com/scholar? 1357667.
hl=en&btnG=Search&q=intitle:Best+practices+in+. Smit B, Burton I, Klein RJT and Wang J (2000) An anatomy of adaptation to
Phillips AW, Reddy S and Durning SJ (2016) Improving response rates and climate change and variability. Climate Change 45(1), 223–251. doi:
evaluating nonresponse bias in surveys: AMEE Guide No. 102. Medical 10.1023/A:1005661622966.
Teacher 38(3), 217–228. doi: 10.3109/0142159X.2015.1105945. Spence A, Poortinga W, Butler C and Pidgeon NF (2011) Perceptions of cli-
Poortinga W, Spence A, Whitmarsh L, Capstick S and Pidgeon NF (2011) mate change and willingness to save energy related to flood experience.
Uncertain climate : an investigation into public scepticism about anthropo- Nature Climate Change, Nature Publishing Group 1(4), 46–49. doi:
genic climate change. Global Environmental Change, Elsevier Ltd 21(3), 10.1038/nclimate1059.
1015–1024. doi: 10.1016/j.gloenvcha.2011.03.001. Takahashi B, Terracina-hartman MBC, Sopchak AR and Selfa T (2016)
Prokopy LS, Haigh T, Mase AS, Angel J, Hart C, Knutson C, Lemos MC, Climate change perceptions of NY state farmers: the role of risk perceptions
Lo Y-J, McGuire J, Morton LW, Perron J, Todey D and Widhalm M and adaptive capacity. Environmental Management, Springer US 58, 946–
(2013) Agricultural advisors: a receptive audience for weather and climate 957. doi: 10.1007/s00267-016-0742-y.
information? Weather, Climate, and Society 5(2), 162–167. doi: 10.1175/ Tucker M and Napier TL (2002) Preferred sources and channels of
WCAS-D-12-00036.1. soil and water conservation information among farmers in three mid-
Prokopy LS, Arbuckle JG, Barnes AP, Haden VR, Hogan A, Niles MT and western US watersheds. Agriculture, Ecosystems & Environment 92,
Tyndall J (2015a) Farmers and climate change: a cross-national comparison 297–313.
of beliefs and risk perceptions in high-income countries. Environmental USDA-FSA (2017a) Farm Service Agency mission and values, History and
Management, Springer US 56, 492–504. doi: 10.1007/s00267-015-0504-2. Mission. Available at https://www.fsa.usda.gov/about-fsa/history-and-mission/
Prokopy LS, Carlton JS, Arbuckle JG, Haigh T, Lemos MC, Mase AS, index (Accessed 1 January 2017).
Babin N, Dunn M, Andresen J, Angel J, Hart C and Power R (2015b) USDA-FSA (2017b) USDA-FSA Organization and Structure. Available at https://
Extension’s role in disseminating information about climate change to www.fsa.usda.gov/about-fsa/structure-and-organization/index (Accessed 1
agricultural stakeholders in the United States. Climatic Change 130(2), January 2017).
261–272. doi: 10.1007/s10584-015-1339-9. van der Linden S (2014) On the relationship between personal experience,
Prokopy LS, Carlton JS, Haigh T, Lemos MC, Mase AS and Widhalm M affect and risk perception: the case of climate change. European Journal
(2017) Useful to usable: developing usable climate science for agriculture. of Social Psychology 44(5), 430–440. doi: 10.1002/ejsp.2008.
Climate Risk Management. doi: 10.1016/j.crm.2016.10.004. van der Linden SL, Leiserowitz AA, Feinberg GD and Maibach EW (2015)
Raymond CM and Robinson GM (2013) Factors affecting rural landholders’ The scientific consensus on climate change as a gateway belief: experimental
adaptation to climate change: insights from formal institutions and commu- evidence. PLoS ONE 10(2), 1–8. doi: 10.1371/journal.pone.0118489.
nities of practice. Global Environmental Change, Elsevier Ltd 23(1), 103– Whitmarsh L (2008) Are flood victims more concerned about climate change
114. doi: 10.1016/j.gloenvcha.2012.11.004. than other people? The role of direct experience in risk perception and
Roesch-McNally G, Arbuckle JG and Tyndall JC (2017) What would farmers behavioural response. Journal of Risk Research 11(3), 351–374. doi:
do? Adaptation intentions under a Corn Belt climate change scenario. 10.1080/13669870701552235.
Agriculture and Human Values 32(2), 333–346. Zahran S, Brody SD, Grover H, Vedlitz A, Zahran S, Brody SD, Grover H,
Running K, Burke J and Shipley K (2017) Perceptions of environmental change Vedlitz A, Brody SD and Grover H (2006) Climate change vulnerability
and climate concern among Idaho’s farmers. Society & Natural Resources, and policy support. Society & Natural Resources 19(9), 771–789. doi:
Taylor & Francis 30(6), 659–673. doi: 10.1080/08941920.2016.1239151. 10.1080/08941920600835528.
Downloaded from https://www.cambridge.org/core. 13 Apr 2021 at 09:25:55, subject to the Cambridge Core terms of use.You can also read