Attainable Housing Challenges, Perceptions, and Solutions - Urban Land Institute
←
→
Page content transcription
If your browser does not render page correctly, please read the page content below
Attainable Housing Challenges, Perceptions, and Solutions
Cover photo: Meritage Homes.

© 2019 by the Urban Land Institute
2001 L Street, NW
Suite 200
Washington, DC 20036-4948

All rights reserved. Reproduction or use of the whole or any part of the contents of this
publication without written permission of the copyright holder is prohibited.

Recommended bibliographic listing:

Ducker, Adam, Kelly Mangold, and Lorry Lynn. Attainable Housing: Challenges,
Perceptions, and Solutions. Washington, DC: Urban Land Institute, 2019.

ISBN: 978-0-87420-450-6
Attainable Housing
Challenges, Perceptions, and Solutions
About the Urban Land Institute
     The Urban Land Institute is a global, member-driven organization comprising more than
     42,000 real estate and urban development professionals dedicated to advancing the
     Institute’s mission of providing leadership in the responsible use of land and in creating
     and sustaining thriving communities worldwide.

     ULI’s interdisciplinary membership represents all aspects of the industry, including
     developers, property owners, investors, architects, urban planners, public officials, real
     estate brokers, appraisers, attorneys, engineers, financiers, and academics. Established in
     1936, the Institute has a presence in the Americas, Europe, and Asia Pacific regions, with
     members in 81 countries.

     The extraordinary impact that ULI makes on land use decision making is based on
     its members sharing expertise on a variety of factors affecting the built environment,
     including urbanization, demographic and population changes, new economic drivers,
     technology advancements, and environmental concerns.

     Peer-to-peer learning is achieved through the knowledge shared by members at
     thousands of convenings each year that reinforce ULI’s position as a global authority on
     land use and real estate. In 2018 alone, more than 2,200 events were held in about 330
     cities around the world.

     Drawing on the work of its members, the Institute recognizes and shares best practices in
     urban design and development for the benefit of communities around the globe.

     More information is available at uli.org. Follow ULI on Twitter, Facebook, LinkedIn, and
     Instagram.

iv   Attainable Housing: Challenges, Perceptions, and Solutions
About the ULI Terwilliger Center for Housing
The ULI Terwilliger Center for Housing conducts research, performs analysis, and develops
best practice and policy recommendations that reflect the land use and development
priorities of ULI members across all residential product types. The center’s mission is to
facilitate creating and sustaining a full spectrum of housing opportunities—including
workforce and affordable housing—in communities across the United States. The center
was founded in 2007 with a gift from longtime ULI member and former ULI chairman
J. Ronald Terwilliger.

About RCLCO
Since 1967, RCLCO has been the “first call” for real estate developers, investors, the        Since we first opened our doors, RCLCO has been governed by our core values. We
public sector, and non–real estate companies and organizations seeking strategic and          believe that excellence, integrity, honesty, respect, exceeding expectations, and quality
tactical advice regarding property investment, planning, and development. RCLCO               are great goals that all firms must possess. These goals and values shape the culture
leverages quantitative analytics and a strategic planning framework to provide end-to-end     and define the character of our firm. They guide how we behave and make decisions. Our
business planning and implementation solutions at an entity, portfolio, or project level.     extensive network provides us with a unique and comprehensive outlook on the industry,
With the insights and experience gained over a half-century and thousands of projects—        not to mention unmatched access to the best minds in real estate.
touching over $5 billion of real estate activity each year—RCLCO brings success to all
product types across the United States and around the world.

RCLCO has expertise in five major areas: real estate economics, management consulting,
investment strategy, asset management, and legal support. Our multidisciplinary team
combines real world experience with the analytical underpinnings of thousands of consulting
engagements. We develop and implement strategic plans that strengthen your position in
a market or sector, add value to a property or portfolio, and mitigate value erosion.

                                                                                                                                      Attainable Housing: Challenges, Perceptions, and Solutions   v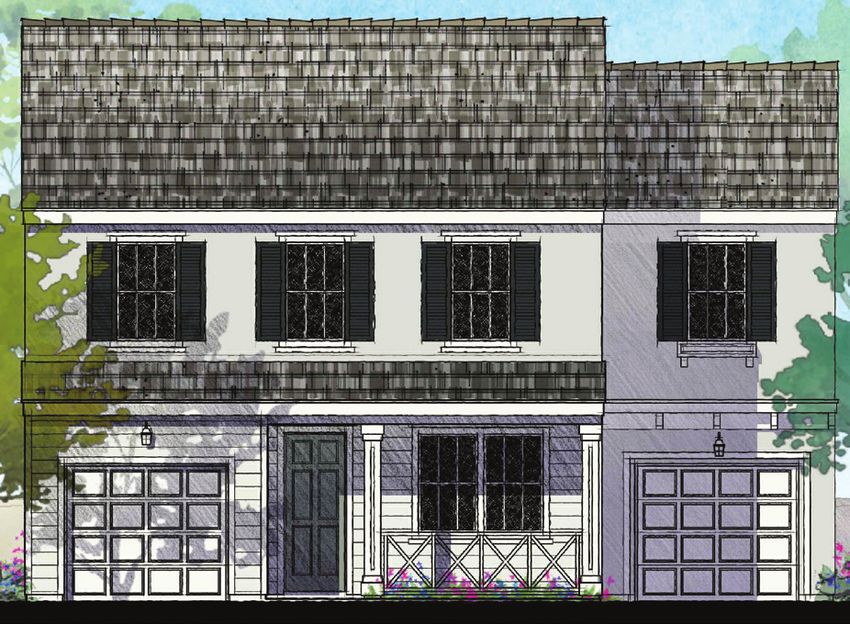
Project Staff
     Authors                                               ULI Report Staff                             Laura Glassman, Publications Professionals LLC
     Adam Ducker                                           Christopher Ptomey                           Manuscript Editor
     Managing Director                                     Executive Director, Terwilliger Center
                                                                                                        Brandon Weil
     RCLCO Real Estate Advisors                            for Housing
                                                                                                        Art Director
     Kelly Mangold                                         Rosemarie Hepner
                                                                                                        Kurt Wisthuff, Arc Group Ltd
     Vice President                                        Director, Terwilliger Center
                                                                                                        Graphic Designer
     RCLCO Real Estate Advisors
                                                           Lisa Sturtevant
                                                                                                        Craig Chapman
     Lorry Lynn                                            Senior Visiting Fellow, Terwilliger Center
                                                                                                        Senior Director, Publishing Operations
     Principal
     RCLCO Real Estate Advisors                            James A. Mulligan
                                                           Senior Editor

     Acknowledgments
     Funding support for this report was generously provided by Bob Sharpe, managing partner
     of Rancho Sahuarita Company and a ULI trustee and ULI Foundation governor.

     Thank you also to the ULI Community Development Council members who shared their
     insights through participation in the survey used as the basis for this publication.

vi   Attainable Housing: Challenges, Perceptions, and Solutions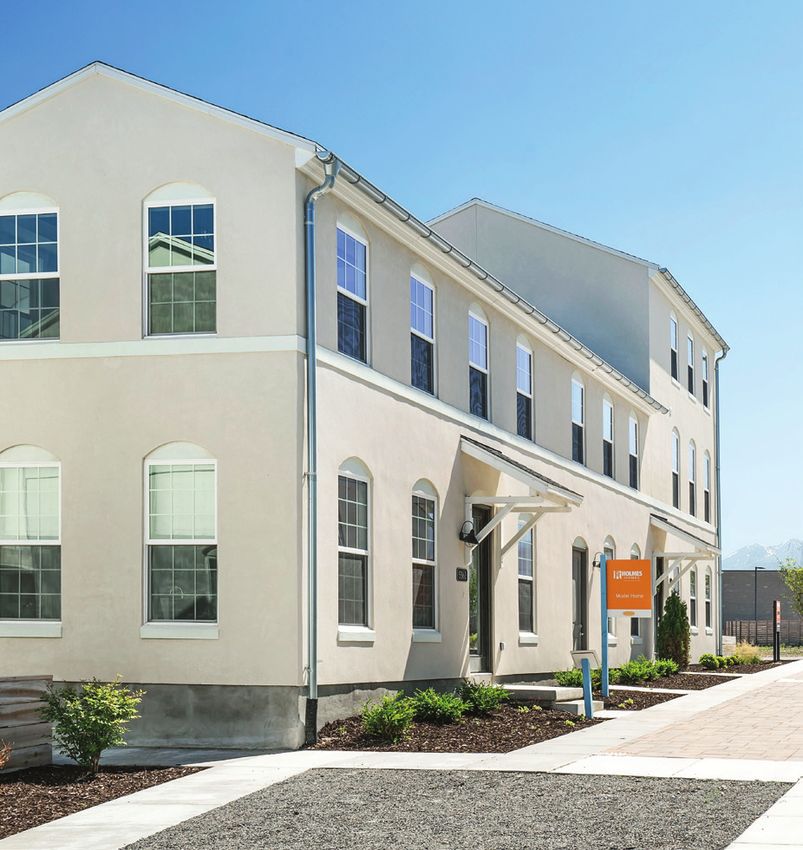
Contents
Letter from the Sponsor................................................................2

Attainable Housing: America’s Missed Opportunity.........................3

Introduction.................................................................................4

Findings......................................................................................9

Product Solutions.......................................................................13

Conclusion................................................................................24

                                                                                                  Attainable Housing: Challenges, Perceptions, and Solutions   1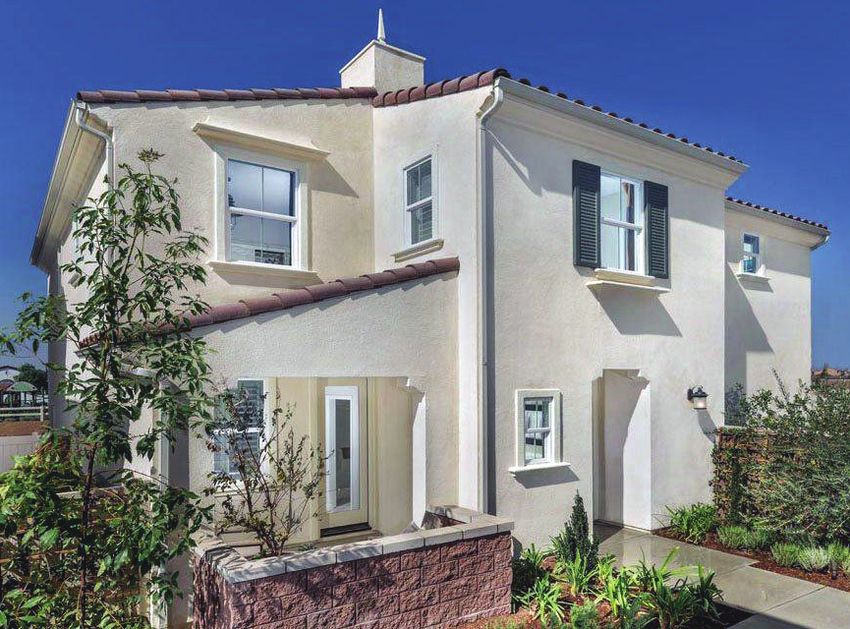
Letter from the Sponsor
    Over the years, we have worked on and supported a number of research projects to share
    best practices and ideas in community development and land use. Our focus has always
    been about highlighting member thought leaders and projects that provide insight into
    innovative solutions for the challenges facing our industry.

    As master-planned community developers focusing on first-time homebuyers, we have
    experienced many of those challenges firsthand—rising labor and material costs, lack of
    available labor, and increased regulations, to name a few; yet we have also heard many
    practical solutions shared among our colleagues at ULI meetings.

    This report attempts to highlight best practices and ideas on attainable housing, which
    we’ve defined as for-sale housing serving moderate-income working families. We understand
    the depth of this market and the importance of serving it, from both a business and social
    need perspective, and have experienced the headwinds that make doing so difficult. The
    findings in this report include insights from Community Development Council members and
    other practitioners in the field who are actively exploring solutions to serve this demographic.

    We would like to thank all the ULI members who participated in the research. In addition,
    we extend our appreciation to the staff at the ULI Terwilliger Center for Housing and
    RCLCO for the many hours spent on this project, specifically Rosemarie Hepner, director of
    the ULI Terwilliger Center for Housing, and Adam Ducker, managing director of RCLCO.

    Sincerely,

    Bob Sharpe                                            Jeremy Sharpe
    ULI Trustee and Governor                              ULI Governor
    Founder, Rancho Sahuarita                             Chief Operating Officer, Rancho Sahuarita

2   Attainable Housing: Challenges, Perceptions, and Solutions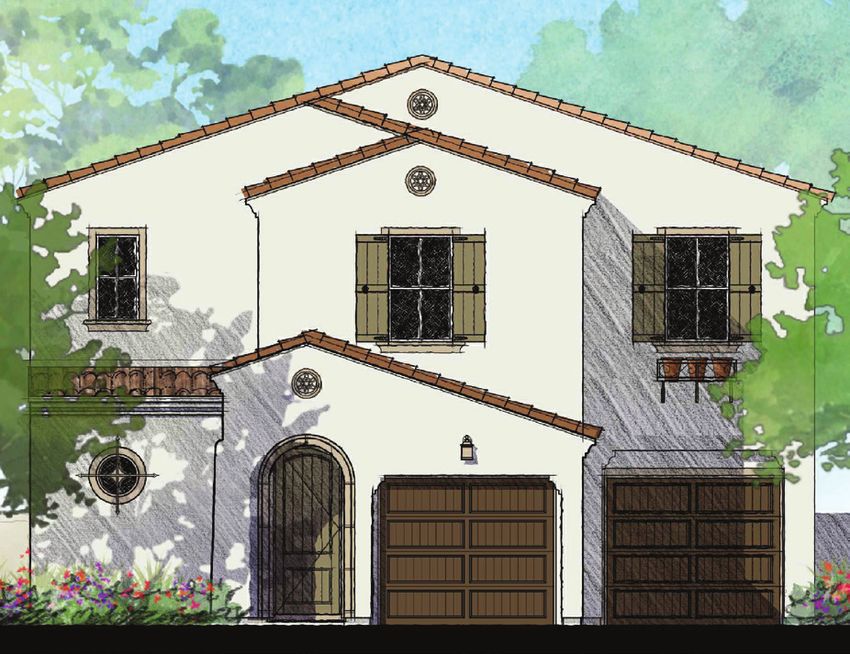
Attainable Housing: America’s Missed Opportunity
A largely untold chapter in the story of America’s housing
affordability challenge is the near disappearance in most
areas of modestly priced new for-sale homes—what ULI
members who participated in this study call “attainable.”
Although the homebuilding sector in the United States once built for the middle class,
this strategy has shrunk dramatically during the past decade, and today very little
nonsubsidized homebuilding activity is oriented to the middle-class price point.

Many factors combine to create this shortfall, but evidence indicates that industry
leaders are starting to respond with new products aimed at a growing and underserved
market. Innovations are coming from publicly held homebuilders, developers of master-
planned communities, neighborhood-based real estate investors, and a new breed of
entrepreneurs from other industries.

It is important that ULI members understand these emerging approaches because they
                                                                                           (Garman Homes)
shed light on new potential business opportunities and suggest a path toward a better-
balanced housing supply in communities that need choices to remain competitive.

This report provides an overview of attainable housing in the United States derived
from a survey of members of the ULI Community Development Council conducted in
fall 2018.

Presented here is an assessment of the market opportunity, the barriers to homebuilders
responding to it, an overview of ULI members’ outlook on the space, and a series of case
studies that may provide strategies for delivering to this market segment in the future.

                                                                                                            Attainable Housing: Challenges, Perceptions, and Solutions   3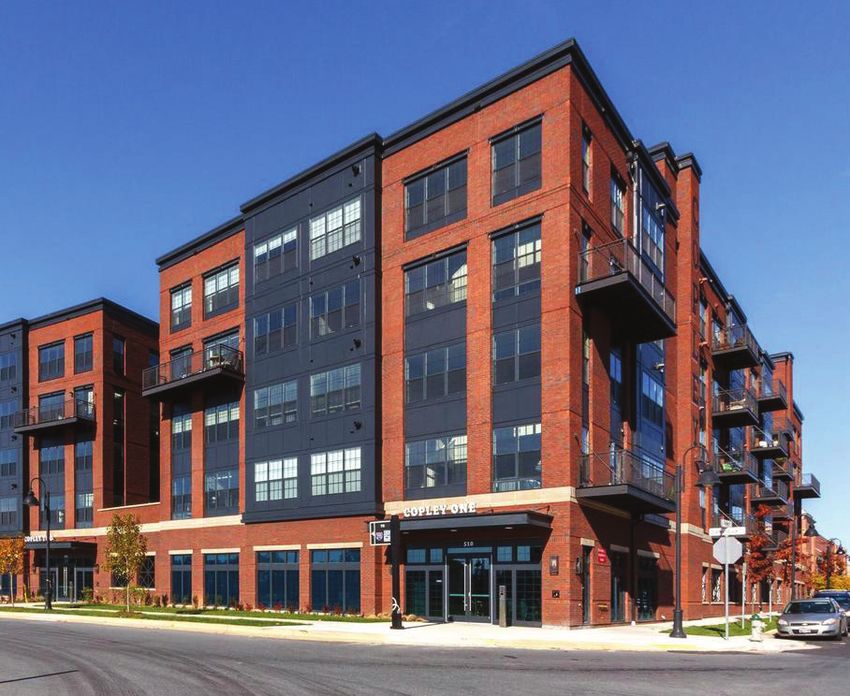
Introduction
There is no universal definition of “attainable housing.” Since at least the mid-1980s, household incomes have Portland, Oregon. The price-to-income ratio approaches
For the purpose of this report, attainable housing is increased at a slower rate than home prices. However, the and even exceeds 10 in California cities such as San Jose
defined as nonsubsidized, for-sale housing that is divergence between household incomes and home prices (10.9), Los Angeles, and San Francisco.
affordable to households with incomes between 80 and widened dramatically during the housing market boom
120 percent of the area median income (AMI). So, for in the mid-2000s, and the widening of the gulf between Uneven Income Growth Contributes to For-Sale
example, in the Washington, D.C., region, this would be home price growth and income growth has accelerated Housing Affordability Challenges
for-sale housing affordable to a household with an income in the years since the recovery. According to data from Although a few occupations, such as teachers or
of $119,400 or less. In Phoenix, attainable housing Zillow, the price-to-income ratio in the United States has firefighters, are often the focus of professions that support
would be for-sale housing affordable to households with increased from 2.95 in 1980 to 3.58 in 2018. The ratio is demand for attainable housing, the need for attainable
incomes of $71,000 or less. over 5 in some markets, including Boston, Santa Fe, and housing is broad. In fact, over the past 30 years, the top
Median Home Price vs. Median Household Income U.S. Median Income, by Quintile
900 $250,000
$225,000 $221,850
800
Median home price/household income (1975 = 100)
Top 20% of household incomes
$200,000
700
$175,000
600
$150,000
500 3.5 times median income
$114,650
$125,000
400 $100,000
2.5 times median income
300 $75,000
200 $50,000 $61,550
$45,550
Middle 40%–60% of household incomes
$25,000
100
$0
0
1967
1968
1969
1970
1971
1972
1973
1974
1975
1976
1977
1978
1979
1980
1981
1982
1983
1984
1985
1986
1987
1988
1989
1990
1991
1992
1993
1994
1995
1996
1997
1998
1999
2000
2001
2002
2003
2004
2005
2006
2007
2008
2009
2010
2011
2012
2013
2014
2015
2016
2017
1975 1980 1990 2000 2010 2017
Median home price Median household income Sources: U.S. Census Bureau; RCLCO.
Sources: U.S. Census Bureau; RCLCO.
4 Attainable Housing: Challenges, Perceptions, and Solutions20 percent of household income earners have seen U.S. New Residential Starts, 1960–2017
much more significant income increases when compared
2,500 100%
with the middle tier. The top 20 percent now have
90%
incomes that are 3.6 times more than the median
2,000 80%
income, up from 2.5 times in 1967. The top 20 percent
70%
New starts (thousands)
of households have incomes of at least $221,850 per
% single family
year, compared with the median income of $61,500, 1,500 60%
which is the difference between affording a $680,000 50%
home and a $278,000 home. 1,000 40%
30%
Overall Supply Constraint Creates Pricing 500 20%
Pressure on All For-Sale Housing 10%
In addition to greater income discrepancy, housing prices 0 0%
1960 1970 1980 1990 2000 2010 2017
have accelerated rapidly as a result of limited new supply.
The pace of residential construction activity has rebounded New starts % single family
since the economic downturn, but new housing starts Source: U.S. Census Bureau.
still remain below long-term averages (see upper chart).
In many places around the country, new housing New Home Sales by Prices Relative to Pre-Recession Levels
construction is not keeping up with household growth
and housing demand. The lack of overall supply—and
the next to zero growth in new construction at attainable 100%
Sales (2003–06 average = 100%)
price points—has led to significant challenges among
80% $750,000 and over
many young adult households and others with moderate
$500,000–$749,999
incomes who are looking to become homeowners. 60% $400,000–$499,999
$300,000–$399,999
40%
Lower Price Point All But Gone $200,000–$299,999
The supply of attainable housing is a nationwide 20% Under $200,000
challenge. According to the National Association of Home
0%
Builders, the median price of a new home in October
2003–06
2007Q2
2007Q4
2008Q2
2008Q4
2009Q2
2009Q4
2010Q2
2010Q4
2011Q2
2011Q4
2012Q2
2012Q4
2013Q2
2013Q4
2014Q2
2014Q4
2015Q2
2015Q4
2016Q2
2016Q4
2017Q2
2017Q4
2018Q2
2018 was $325,100, compared with a median price of
$257,500 for existing homes. Assuming a household
spends three times its income on a home (a longer- Source: U.S. Census Bureau.
Note: Prices not adjusted for inflation.
term income-to-price ratio), a household would need an
income of $107,000, nearly double the median household
income nationwide, to afford a median-priced new home.
Attainable Housing: Challenges, Perceptions, and Solutions 5Historically, housing has been diversified, providing America Is Missing Housing for Middle-Income unlike during most recovery cycles, multifamily permits
housing options in all price bands, but that has not been Levels and Density have shifted dramatically from product intended for sale
happening during this recovery. Fifteen years ago, 54.6 to product intended for rent. Multifamily for-sale housing
Historically, multifamily for-sale product has served as an
percent of new homes sold were priced under $200,000. historically represented about 20 to 25 percent of total
attainable price point for homebuyers. At first glance, the
Today, only 12.9 percent are priced under $200,000. multifamily permits, but it has represented 6 to 7 percent
supply of multifamily housing appears to be stronger than
During the same period, homes priced under $400,000 in the past eight years (since the recovery began).
historical trends, increasing from about one-third of total
have fallen from 90.8 percent to 67.4 percent of new
permit activity to nearly 45 percent in 2015. However,
home sales.
Multifamily Permits as Percentage of Total Permits Multifamily Permits by Intention: For Rent vs. For Sale
2,500,000 60% 800,000 50%
45%
700,000
Multifamily for-sale permits as a % of total multifamily permits
50%
2,000,000 40%
600,000
Attached permits as % of total permits
35%
40%
500,000
Total multifamily permits
Total residential permits
1,500,000 30%
30% 400,000 25%
1,000,000 20%
300,000
20%
15%
200,000
500,000 10%
10%
100,000
5%
0 0% 0 0%
1974
1977
1980
1983
1986
1989
1992
1995
1998
2001
2004
2007
2010
2013
2016
1974
1977
1980
1983
1986
1989
1992
1995
1998
2001
2004
2007
2010
2013
2016
Detached single family Attached % attached For sale For rent % for sale
Sources: U.S. Census Bureau; RCLCO. Sources: U.S. Census Bureau; RCLCO.
6 Attainable Housing: Challenges, Perceptions, and SolutionsThe Rise of Smaller Households Should Mean propensity for marriage to end in divorce (estimated Household Types, 1967–2017
a New For-Sale Market Opportunity between 30 percent within 10 years and up to 50
100%
percent overall), the window to start and grow a family
Developers and builders are seeing demand shift as 90%
is further compressed and diminished. Moreover, active
a result of the rise of the small household, which has
baby boomers are choosing to retire differently from the 80%
implications for denser, smaller homes at attainable
generation before them, which is adding to demand for 70%
price points. The traditional family household has been
small homes in closer-in, well-amenitized locations. 60%
declining and smaller households have been increasing
since the mid-1960s. Contributing factors include delayed 50%
But Even as Household Sizes Have Decreased,
marriage, fewer children, more women in the workforce, 40%
Bedroom Count Has Increased
more divorces and later-in-life remarriages, healthy life 30%
longevity, and more aging in place. Despite the distribution shift in household size, new
construction has focused on delivering larger homes with 20%
Americans are delaying marriage, on average, to their late more bedrooms. Although one- or two-person households 10%
20s or early 30s and delaying the birth of their first child make up more than 60 percent of total households, nearly 0%
until the early to mid-30s. With a delayed start and a 50 percent of the homes delivered are four bedrooms 1967 1977 1987 1997 2007 2017
two-person working household, creating and managing a or more. Less than 10 percent of the homes offer fewer 1–2 persons 3 persons 4+ persons
large family becomes less viable and less desirable. If bedroom options like one and two bedrooms. Sources: U.S. Census Bureau; RCLCO.
delayed marriage and family is combined with an increased
New Construction by Bedroom Count, 1977–2017
U.S. Household Growth by Number of Household Residents
100%
50,000
Total U.S. households (thousands)
45,000 90%
40,000
35,000 80%
30,000
25,000 70%
20,000
15,000 60%
10,000
5,000 50%
0
40%
1960
1962
1964
1966
1968
1970
1972
1974
1976
1978
1980
1982
1984
1986
1988
1990
1992
1994
1996
1998
2000
2002
2004
2006
2008
2010
2012
2014
2016
30%
1 person 2 persons 3 persons 4+ persons
20%
Sources: U.S. Census Bureau; RCLCO.
10%
0%
1977 1987 1997 2007 2017
1–2 bedrooms 3 bedrooms 4+ bedrooms
Sources: U.S. Census Bureau; RCLCO.
Attainable Housing: Challenges, Perceptions, and Solutions 7And Larger, Less-Affordable Homes Distribution of U.S. New Homes by Size, 1999–2017
Represent a Growing Share of the Market 100% 18%
Also contributing to a lack of housing supply at lower 90% 16%
price points is the lack of small housing. Small housing,
% of homes under 1,400 square feet
80% 14%
Distribution of new homes by size
under 1,400 square feet, has historically represented
70%
about 16 percent of new construction but in the last cycle 12%
60%
has averaged closer to 7 percent. When combined with 10%
the next size category, 1,400 to 1,800 square feet, the 50%
8%
overall distribution of “small homes” has declined from 40%
6%
just under 40 percent to 22 percent, whereas homes 30%
over 2,400 square feet have increased from 32 percent 20% 4%
to 50 percent of new construction since 1999. 10% 2%
0% 0%
1999 2000 2001 2002 2003 2004 2005 2006 2007 2008 2009 2010 2011 2012 2013 2014 2015 2016 2017
Under 1,400 sq ft 1,400–1,799 sq ft 1,800–2,399 sq ft 2,400–2,999 sq ft 3,000 or more sq ft
% of homes under 1,400 sq ft
Sources: U.S. Census Bureau; RCLCO.
8 Attainable Housing: Challenges, Perceptions, and SolutionsFindings
Following are findings generated from a survey of Challenges to Delivering Attainable Housing
members of ULI’s Community Development Council as 3.24
3.5 3.00
well as outside research. 3 2.50 2.50 2.50 2.53 2.60 2.64
2.5 2.08 2.14
2 1.60 1.67 1.80
ULI Members Cite Challenges to Delivery 1.5
and Changes in Attainable Housing 1
0.5
When ULI members are asked what the biggest 0
challenges are to delivering attainable housing, the
al
s
g
s
in g
ip
er
r
it y
ism
s
d
y
he
ial
cie
fe e
ili t
c in
ir e
r sh
pit
lo p
ns
us
Ot
ter
ab
BY
qu
ien
an
ca
de
nd
de
ve
ho
a il
ma
re
M
fin
top four reasons are cost of capital, lack of building
fic
de
of
na
le a
of
av
NI
ble
el
ef
er
st
of
ck
PC
s/
tio
lev
tr y
na
Co
uy
in g
st
ice
La
ul a
fM
us
t ai
ish
fb
Co
efficiencies, availability of buyer financing, and cost of
il d
pr
eg
in d
at
so
yo
F in
bu
nd
tr
of
nt
ili t
of
en
of
La
me
in g
ab
ck
materials. On a scale of one to four, with one being most
nm
ck
a il
La
ir e
nd
La
er
Av
qu
st a
ov
Re
important, seven additional reasons scored as very
er
lg
nd
ca
su
Lo
Mi
important, including understanding attainable housing in
Source: ULI Attainable Housing survey.
general, with specific references to industry leadership; Note: 1 = most important; 4 = least important. MPC = master-planned community.
NIMBYism (not in my backyard); and government
regulations and fees. Members believe that builders need
Factors for Attaining Housing Success
to be more efficient when building but should also be
supported with financial incentives or subsidies as well 4
3.00 3.00
3.56
2.50 2.67
as local community and government support. 3 2.26
2
1
0
Building Financial Other Local Relief from Increased density
efficiencies/design incentives/subsidies community support local requirements
Source: ULI Attainable Housing survey.
Note: 1 = most important; 4 = least important.
Attainable Housing: Challenges, Perceptions, and Solutions 9Attainable Housing Solutions Are Not What Attainable Housing Solutions Appeal to Diverse Household Types
Industry Thinks They Are 100% 88% 83% 85%
78%
The survey revealed that ULI members recognize that 80% 71%
attainable housing is a segment of demand for a variety 60%
of buyer types and for a range of reasons. The opinion 40%
of the industry is that the top three solutions are limiting
20% 7%
community amenities, providing lower-quality finishes,
0%
and locating homes in less desirable areas. In contrast, an First-time Prospective buyer with Families Singles and Retirees on Other
RCLCO consumer preference survey and the case studies homebuyer limited downpayment (households with children) couples fixed Income
reveal buyers prefer better locations and amenities over Source: ULI Attainable Housing survey.
lower density and larger home size.
Acceptable Consumer Solutions for Attainable Housing, Based on Industry’s Opinion
4
3.38
3.5 3.20
2.85
3 2.46
2.5
2 1.71 1.71 1.71
1.5
1
0.5
0
Limited community Less desirable Lower-quality Attached vs. Smaller Other Smaller
amenities location finishes detached product lot size home size
Source: ULI Attainable Housing survey.
Note: 1 = most important; 4 = least important.
10 Attainable Housing: Challenges, Perceptions, and SolutionsConsumer Preference for Location and package receiving (for e-commerce) and art and culture
Amenities such as food, wine, and farmers markets are ranked as
very or somewhat important by 75 percent of respondents.
A national consumer preference survey conducted by
The best practices case studies further demonstrate that
RCLCO reveals that all buyers, regardless of income, want
the most successful attainable housing projects achieve
to be in a convenient location with a mix of houses, shops,
lower pricing while developing in desirable locations and
and businesses. In addition, although typical amenities
prioritizing amenities—especially walkability to food and
such as a fitness center and trails still topped the list,
beverage amenities.
Consumer Preferences for Location Consumer Preferences for Amenities
0% 25% 50% 75% 100%
Suburban area with a mix of houses,
shops, and businesses Fitness centers
Gated entry
Suburban area with mostly Trails
residential uses Package receiving
Resort pool (lounge)
City near a mix of offices, apartments,
and shops Art and culture, such as concerts, food, wine
Farmers market
City in a mostly residential
Dog park
neighborhood
Sports courts
Pocket parks
Rural area
Virtual services, such as community intranet
Lap pool
Small town Children’s pool
Maker spaces
Resort area Community garden
Golf
0% 10% 20% 30% 40%
Households with incomes over $100,0000 Households with incomes of $50,000–$100,000 Very important Somewhat important Not important
Source: 2018 RCLCO Housing Consumer Preference Survey. Source: 2018 RCLCO Housing Consumer Preference Survey.
Attainable Housing: Challenges, Perceptions, and Solutions 11ULI Members See the Opportunity But Have Survey Response to “What Share Does ‘Attainable’ Represent
of All For-Sale Housing Demand?”
Not Yet Determined How to Act on It
The majority of ULI members who participated in 35%
this survey believe the attainable housing price points
30%
represent between 20 and 60 percent of market demand,
with 25 percent believing it represents more than 60 25%
percent of the market. Despite their perception of the
high housing demand, over 35 percent of members are 20%
providing no attainable housing, and only 15 percent
15%
believe that 20 percent or more of their housing production
serves the attainable market segment.
10%
5%
0%
0–20% 20–40% 40–60% 60–80% 80–100%
Source: ULI Attainable Housing survey.
Survey Response to “What Share of the Housing You Build
Qualifies as ‘Attainable’?”
40%
35%
30%
25%
20%
15%
10%
5%
0%
0%
0–5%
5–10%
10–20%
20–30%
30–40%
40–50%
50% or more
Source: ULI Attainable Housing survey.
12 Attainable Housing: Challenges, Perceptions, and SolutionsProduct Solutions
The decrease in for-sale housing supply and lower-priced elevations, and aesthetic preferences. Many of the • Entitlement and design commitment: Developers
homes has translated into a mismatch between income most successful attainable housing developments and builders entitle, retrofit, and design into current
and home price, in household size and home size and bed/ combine product types in developments with two or development opportunities. Attainable housing can
bath counts. Successful developers, builders, and creative three product types (e.g., dense-detached and work anywhere for any builder from the smallest
architects are evolving attainable housing from four missing-middle typologies) in addition to providing micro-pod to the largest master-planned community.
product design strategies: “value” and reduced square footage (small homes). To start the process, they look for entitlement deals
• Small homes (reducing square footage); • Design within, between, and around homes: As in older, desirable walkable neighborhoods; revisit
density increases, design within the home, between current assets and retrofit the product offering for
• Value housing (brand segment);
the homes, and within the neighborhood becomes increasing demand and new solutions; and look at
• Missing middle (attached); and how future land deals can provide multiple segments
increasingly important. With creative density
• High-density detached (cluster). architecture informing the land plan more than with of attainable housing within neighborhoods to
traditional product, architects plan the homes and maximize absorption, create move-up demand in
On the basis of in-depth interviews within the industry, the land harmoniously. Open floor plans, great room early phases, and offer move-down opportunities
developer or builder who successfully executes attainable volume, and orientation to the outdoors improve in later phases. These developers and builders are
housing advocates as follows: natural light and make the home feel larger and more documenting strategic initiatives that set intentions
• Similar margins and greater price elasticity: open. The spaces in between should protect privacy, for providing attainable housing and are achieving
Attainable housing yields similar margins to enhance openness, and create appealing community great success.
higher-priced homes because of faster turnover space. Lifestyle amenities—particularly walkability
driven by pent-up demand combined with limited to everyday conveniences and large outdoor Strategy 1: Small Homes
supply, which creates greater price elasticity and gathering spaces—become increasingly important. Baby boomers and an influx of wealthy foreign capital,
more upside revenue potential than any other • Lifestyle-choice messaging: Messaging is even combined with a shrinking first-time homebuyer market,
segment. As prices rise, continual product innovation more critical when product is denser and smaller. have supported large, luxury home development during the
is needed for the next solution that meets the same For density tradeoffs to work, the site and product past 10 years. As a result, the building of smaller homes
needs, and those interviewed continue to redesign should offer something more than just a lower price. declined significantly despite the increase in smaller
and improve their offerings. Although price is generally a motivator, the buyer households and an emerging consumer preference for
• Segmentation beyond density, size, and price: should feel he or she is making a lifestyle choice for experiences over possessions.
High-density detached and missing-middle walkability, maintenance-free living, and financial
Small homes, defined as those with less than 1,400 square
segmentation strategies are moving beyond size, price, flexibility without sacrificing function, style, or
feet, offer first-time homebuyers, downsizers, and small
and density into space choices, finishes, exterior lifestyle amenities.
Attainable Housing: Challenges, Perceptions, and Solutions 13households of any age and income level an alternative “Maintenance-Free Living,” are universally appealing
Characteristics of Small Homes
housing option. The mistaken idea that “attainable” to both younger and older smaller households.
translates into lower-quality, less-desirable locations is Definition Less than 1,400 sq ft (Tier 1)
• Smaller housing can feel larger with appropriate
disproved by the following examples that deliver high-quality Less than 1,800 sq ft (Tier 2)
emphasis on spaces inside and outside the homes.
finishes within desirable, highly amenitized, master- Examples include creating first-floor volume in Unit type 1 to 3 bedrooms, 1 or 2 baths
planned communities. Two of the examples are detached the great room with adjacency to outdoor space; Unit size 700 to 1,400 sq ft
alley-load configurations while Azure offers a carriage/ minimizing view corridors into neighboring homes; Density 8 to 20 dwelling units/acre
townhouse attached combination; however, attainable and providing outdoor spaces with staggered
products can come in any density solution. placement of door entries, great rooms, windows, Land plan All
• A large segment of small households is looking for and outdoor spaces. Most effective with density stated above
smaller, high-quality homes near lifestyle amenities
and is decidedly uninterested in large homes with The growing number of nontraditional homebuying
lower-quality finishes in isolated suburban locations households consisting of one, two, and three people, but at a reduced overall square footage, generally less
far from services and employment. combined with a need to create housing at lower price than 1,800 square feet. They challenge traditional room
points, is spurring developers and builders to design sizes (like master bedrooms and kitchens) as well as “must
• Messaging, such as “Smaller Home, Bigger Life” have” room functions and count, revitalizing one and two
developments with smaller home sizes. These designs
or “Downsizing Is an Upgrade” (by wee-Cottage) or bedrooms, one bathroom, and one-car garages.
accommodate traditional windows, doors, and appliances
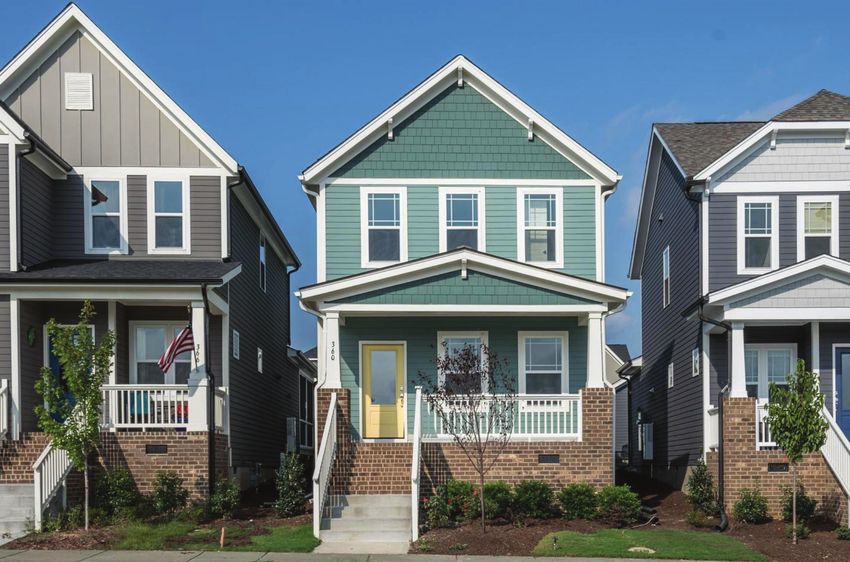
Boulder Creek Neighborhoods, wee-Cottage, Stapleton, The Cottage Company, Danielson Grove, Kirkland, Washington. New Home Company, Azure at Escencia, Mission Viejo, California. (New Home Company)
Colorado. (Boulder Creek Neighborhoods) (The Cottage Company)
14 Attainable Housing: Challenges, Perceptions, and SolutionsStrategy 2: Value Housing
Many homebuilders are introducing an additional brand
segment to specifically address attainable housing and
create an alternative product offering. Similar to a hotelier
(e.g., St. Regis, West, W, Sheraton—one company with
multiple “flags”) or an automotive company (BMW 7,
5, and 3 series), homebuilders are creating “simplified”
versions of their core brand. Value housing does not have
to mean a “stripped” or lower-quality home. The evolved
definition of value housing is one of simplicity, in terms
of both option packages and structural choices, that
enables the homebuilder to deliver product more efficiently
and ultimately more cost-effectively while providing
homebuyers a stylish home with a sense of dignity and
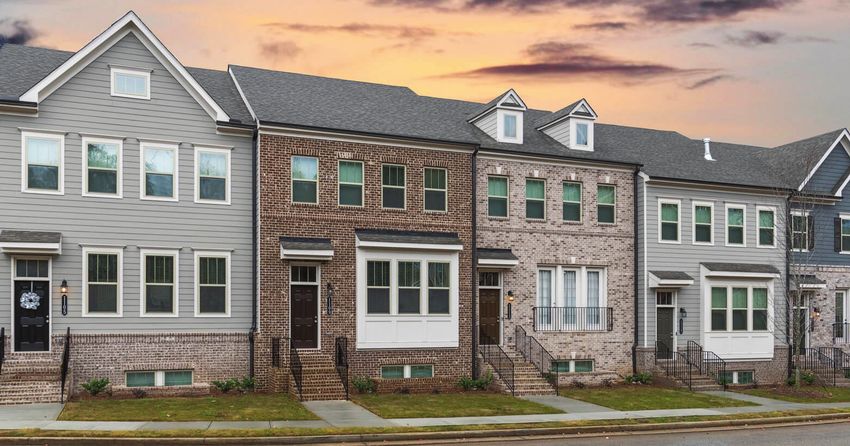
Fresh Paint by Garman Homes, Briar Chapel, Chapel Hill, North Carolina. DR Horton Express, Windermere Townhomes, Shakopee, Minnesota.
pride in ownership. (Garman Homes) (DR Horton)
• Value housing does not have to mean lower quality.
Fewer but well-articulated styles and structural
options allow buyers a simplified homebuying
preference that meets the needs of many segments.
Fresh Paint’s marketing message is creative, stylish,
and fun, ultimately communicating to buyers, “You
Don’t Have to Compromise.”
• Repeated iterations of fewer, simple selections
create economies of scale; make for fewer errors Meritage, LiVE.NOW. “starter communities” focused on the first-time LGI, Mirror Lake, Lehigh Acres, Florida. (LGI Homes)
buyer market. (Meritage Homes)
and delays, ultimately creating greater efficiencies;
and mean reduced costs that can be passed on to
the homebuyer. • Margins can be lower for value housing, given the
Characteristics of Value Housing
• Lower price points are in demand by all buyer overall lower price points, but pent-up demand
often pushes prices significantly between phases, Definition Streamlined structural and interior
segments. These lower price points can be finish options
addressed in all buyer segments—from small creating more upside pricing elasticity. In addition,
value housing essentially creates a second business Unit type Any housing type can be streamlined
households to large families—that need to maximize
bedrooms. Toll Brothers’ T Series defines its own model for homebuilders—one of lower margins but Unit size Any size
nomenclature as “attainable luxury”: still luxurious, faster turnover to balance out higher-margin, lower-
Density All densities
just dialed back in size, finishes, and structural turnover segments.
Land plan Attached and detached
options from the core Toll Brothers’ Homes brand.
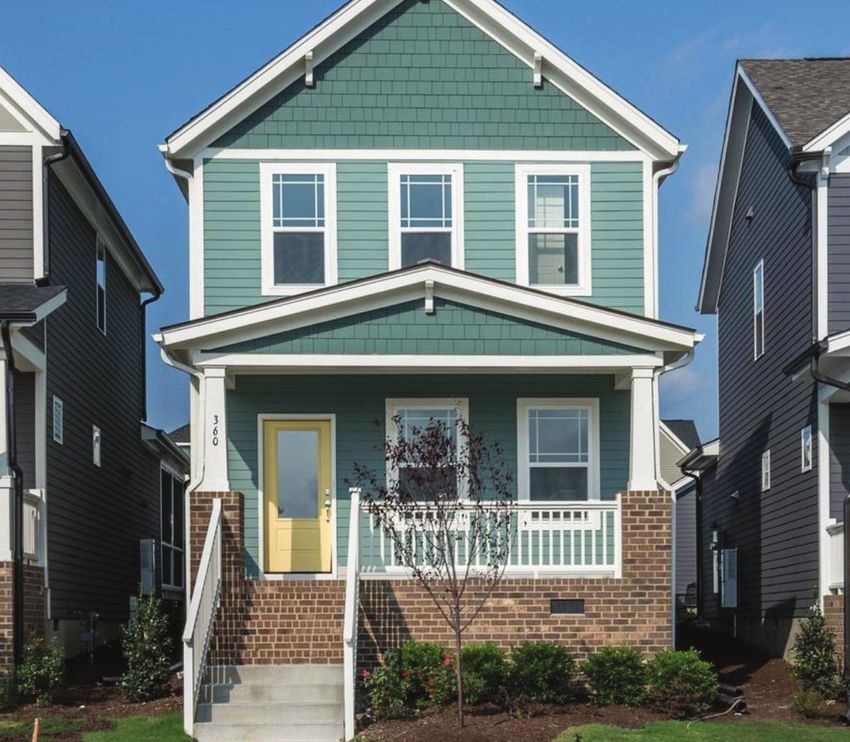
Attainable Housing: Challenges, Perceptions, and Solutions 15Briar Chapel: Fresh Paint by Garman Homes
Based in North Carolina, Fresh Paint is a Garman Homes centers such as the Research Triangle Park, and top-rated
brand with a mission to deliver high-quality homes at schools, Briar Chapel is popular with buyers of all age groups.
attainable price points. This product required delivering
homes in the low $200,000s, a challenge given the high Alaina Money, founder and CEO of Fresh Paint, was building
cost of land. As part of Garman’s strategy, the Fresh Paint another community in Briar Chapel when she saw another
brand will buy only finished lots from top-in-class master- builder creating value housing that was a completely
planned-community developers. Teaming with world-class stripped-down product. She thought she could do a better
master developers allows the company to specialize and job in achieving the price points of value housing while
focus on delivering a special product. creating a project that would excite homebuyers. This idea
helped launch Fresh Paint, and Money collaborated with
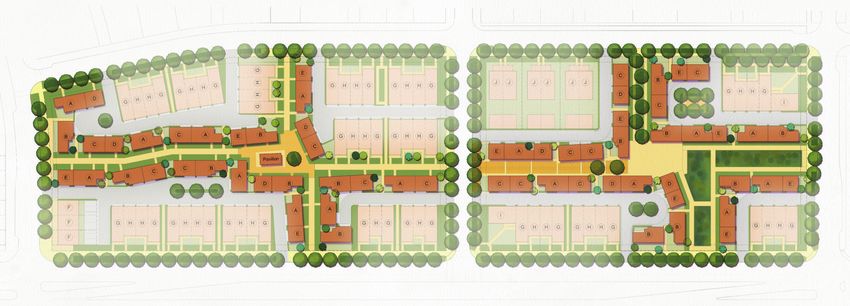
Briar Chapel, developed by Newland Communities, is a Newland, the master developer, to carve out a segment of
900-acre master-planned community in Chapel Hill, North the community for her to test the concept. (Garman Homes)
Carolina. With 50 percent of the community dedicated to
natural open space, convenient access to employment Planning and Design Money is quick to note that providing the correct amount
The company identifies a price point to target and works of options for customization is very important: too many
backward from there to deliver a home attainable to buyers. choices lead buyers to become frustrated and confused.
Characteristics According to Money, the traditional way to create value The members of this target market want to feel their home
Project address 32 Cardinal Ridge housing is either to keep the square footage and strip out is unique and affordable, and they want a streamlined,
Chapel Hill, North Carolina the usual features or to reduce the square footage and memorable experience. Briar Chapel has also been popular
Homebuilder Fresh Paint by Garman Homes keep the usual features. Efficiency is the key to reaching with first-time homebuyers, single-parent households, and
www.freshpaintbygarman.com this target, so the company emphasizes listening to empty nesters.
Architect Michelle Huffman, Garman Homes trades about processes, investing in those relationships,
and ensuring that design aesthetics are predictable and Challenges and Takeaways
Land planner in house
repeatable. Money has designed several finish packages • Understand that you cannot be everything to everybody,
Product type 2 to 3 bedrooms, 2.5 baths and allows buyers to choose among all-inclusive options and design your product around whatever makes
Home size range 1,516 to 1,820 sq ft with a rule of no changes or special requests. This strategy you most competitive with your target market.
Parking 2-car garage
allows consumers to attain a custom-designed home while
• Value housing does not mean cheap housing, so
simplifying the construction process.
Price range $233,000 to $310,000 design your product with the end user’s pride in
Target Market homeownership in mind. Because of variable land
Lot dimensions 26 ft × 110 ft
prices, this strategy will not work everywhere.
Lot size 2,660 ft The Fresh Paint brand was developed with the goal of
making homebuying accessible to more buyers while not • Choose the communities that you want to be in
Density 10 to 14 dwelling units/acre wisely, and work creatively and collaboratively to
creating a product that was completely stripped of any
Percent attiainable 100% (at 120% AMI)
character. The initial target market was millennials, and the get to your desired result.
idea was to take the stress out of the homebuying process.
16 Attainable Housing: Challenges, Perceptions, and Solutions(All images: Garman Homes)
Attainable Housing: Challenges, Perceptions, and Solutions 17Strategy 3: Missing-Middle Housing an attainable price point. One of the key attractive features gravel on common drives as well as hardscape
Missing-middle housing, a term coined by Opticos Design, of missing-middle housing is that because of its scale, and landscape features to create desirable shared
is defined as housing typologies at densities between those entrances to individual units feel more like those of single- outdoor spaces. The two-story volume of the great
of single-family homes and mid-rise communities whose family homes than large condominium complexes with room along with architectural features (such as more
scale would be compatible with single-family homes. shared elevators and long corridors. windows for natural light) further reduces perceived
This includes duplexes, triplexes, fourplexes, courtyard • Missing middle can be built less expensively density once inside the home.
buildings, bungalow courts, townhouses, multiplexes, and when third-floor options, which are often more
live/work buildings. expensive to build than two stories, are minimized;
Characteristics of Missing-Middle Housing
using a simple rectangular form with simple roof
Missing-middle housing comes in a variety of building lines is optimal. Definition Defined by Opticos Design as
typologies between detached and
types and densities, but because of its lower height (at • Missing-middle units can be smaller with fewer mid-rise buildings
most three or four stories) and width (at most 50 feet), it off-street parking spaces and preferably less
does not look dense. The scale of these buildings can be Unit type 1 to 3 bedrooms, 1 or 2 baths
parking overall (close to one car space per unit).
attractive to communities that might otherwise believe 1 to 3 stories
This concept is more palatable when the development
attached housing will diminish home values in their is near public transportation and has ride-sharing Unit size 700 to 1,900 sq ft
neighborhoods. options more readily available (including autonomous Density 12 to 20 dwelling units/acre
vehicles in the future). Land plan Duplex to multiplex (stacked, side by
Unit sizes in missing-middle buildings are typically smaller
than those offered in traditional for-sale product, and this • To reduce perceived density, the space between side), row townhouse, bungalow cluster,
homes is purposely designed with pavers and combinations
scale can help keep costs down while delivering homes at
Holmes Homes, Mews Collection, South Jordan, Utah. (Holmes Homes and Onyx & East, Switchyard at Fletcher Place, Indianapolis. (Onyx & East) Michael Harris Homes, the Copley at Crown, Gaithersburg, Maryland.
Opticos Design) (Michael Harris Homes))
18 Attainable Housing: Challenges, Perceptions, and SolutionsMews Collection: Holmes Homes
Holmes Homes is a single-family homebuilder based
in Sandy, Utah, with a long history in the area. The
homebuilder historically built traditional single-family
homes but realized the market was shifting because
income levels had not kept pace with home values. Holmes
Homes had been building townhouses for years but wanted
to think more creatively about product type to be able to
deliver new construction at an entry-level price point.
At Daybreak, Holmes had a challenging site, and traditional
lots would have left the proposed community with
Neighborhood Context
underused space in the middle of the block. The Mews Characteristics
Collection at Daybreak is a community of 64 homes on a Daybreak is a 4,000-acre community in South Jordan, Utah,
Project address 5222 South Jordan Parkway
3.2-acre site. The townhouses feature two bedrooms and that was the site of a former Rio Tinto mining operation. In South Jordan, Utah
one and a half to two bathrooms in floor plans ranging 2004, construction began on the community designed to
Site size 3.2 acres/64 units
from 968 to 1,416 square feet on 26- by 50-foot lots. evoke the traditional neighborhood development mode, which
promotes compact development so that retail, recreation, Density 20 dwelling units/acre
or schools are located within a five-minute walk or bike Developer Daybreak by Kennecott Land
ride of homes. At buildout, the community is expected to www.kennecott.com
include more than 20,000 residential units and over 9 Homebuilder Holmes Homes
million square feet of commercial space. www.holmeshomes.com
Architect/ Opticos Design
Site Specifics
land planner www.opticosdesign.com
At Daybreak, Holmes Homes acquired two sites, but they
Product type 1 to 3 bedrooms
were too deep to build a traditional townhouse product
facing a perimeter street. The solution was to break Home size range 968 to 1,416 sq ft
up the site into four micro-scale blocks, oriented along Parking 1- or 2-car garage
a pedestrian passageway to create a European feel to Price range $180,000 to $280,000
the community.
Lot dimensions 26 ft × 50 ft
Planning and Design Lot size Attached
To deliver at an entry-level price point, Holmes Homes needed Percent attiainable 100%
to design a product with lower construction costs than a
traditional home. As a multigenerational homebuilder, the
(All images: Holmes Homes and Opticos Design) firm knew that it had a brand reputation to maintain and
Attainable Housing: Challenges, Perceptions, and Solutions 19would not accept a stripped-down product. The solution
was to design buildings with simple, rectangular forms and
rooflines while keeping a high interior finish level. Nearly all
the homes were two stories, eliminating expensive third
floors on all but one floor plan. With the Daybreak TRAX
light-rail station about a 10-minute walk away, Holmes
found it viable to build homes with one-car garages and
adjacent parking pads. Because of this reduced parking,
the firm was able to build at a density of 20 units per acre.
Target Market
Holmes Homes expected its product to be popular with
a millennial entry-level buyer but instead found a broad
market of support for the product type and price point.
Single-person households, including a large percentage of
single female buyers, purchased a significant portion of the
homes at the Mews Collection. Older, downsizing boomers
were another key segment of buyers. These groups were
attracted to the Daybreak master-planned community and
the Mews sense of community and security. Although the
units may have been smaller, buyers indicated that the
double-story living space feels like a loft and enjoyed the
large amount of natural light that streams into the homes.
Challenges and Takeaways
• Keep forms and building designs simple to reduce
construction costs.
• For challenging sites, do not be afraid to get
creative in your product offering to achieve your
required returns.
• Locate in established communities to get over
the first hurdle when introducing a new, unproven (All images: Holmes Homes and Opticos Design)
product in the market.
20 Attainable Housing: Challenges, Perceptions, and SolutionsStrategy 4: High-Density Detached A green court and a motor court can attract completely
Characteristics of Cluster Housing
(Cluster) Housing different buyer types despite similar footprints and
densities, depending on where space is prioritized. For Location Suburban, rural
In many areas of the country, detached living is the
example, a motor court can provide a full driveway and Unit type 1 to 3 bedrooms, 1 or 2 baths
preferred housing type for potential homebuyers. According
traditional rear yard that appeal to families, while a green Two story
to RCLCO consumer research, over 55 percent of
court might maximize the interior of the home with volume
households, regardless of age, would prefer a single-family Unit size 700 to 1,500 sq ft
and more of a patio feel that appeals to couples.
detached home over other housing types. In areas with Lot Typical 6-court module:
high land costs, developers may not be able to meet this dimensions 125 ft × 150 ft
These designs have been around since the early 2000s
demand without a little creativity. Detached cluster homes
in California, and they are gaining acceptance in master- Lot size 2,500 (50 × 50) sq ft
allow higher density than traditional single-family homes
planned communities near major metropolitan areas as Density 8 to 20 dwelling units/acre
but create the traditional feel that many homebuyers are
well as in-town locations in Middle America. Builders,
looking for. Depending on site shape, setbacks, parking Land plan Green court
by nature, are risk averse and not typically focused on
requirements, and the like, detached cluster housing can Motor court
research and development, but they respond if solid
generally be built in the range of eight to 15 units per acre. Alley load
evidence exists for demand in the market. In California,
architects such as WHA, KTGY, Bassenian Lagonia, and
Courts generally have four to 10 homes per module with
Kevin L. Crook Architect are designing with smaller along the spine street. The parking goal is to provide two-
the alignment of the front door and garage distinguishing
footprints (i.e., small homes), using larger cluster thirds of the parking requirements on the home site (with
motor and green courts. The front entrance for a motor
modules, blending attached at the rear of the cluster, and a two-car garage and at least a one-car driveway) and the
court is off the driveway, next to the garage, whereas green
experimenting with parking, including detached parking, additional spaces located along spine streets.
courts have unit entries off a common interior greenbelt,
staggered parking with single driveways, and single-car
similar to an alley load. These configurations often require
garages, to continue to push overall density. Potential privacy issues can be addressed by
making choices for front door and yard orientations,
driveway aprons, and yard space while balancing the contemplating how the homes and outdoor spaces sit
High-density detached housing should look to minimize adjacent to each other and laying out multiple modules
streetscape and common spaces between homes.
garage-facing streetscapes with houses fronting elevations throughout the neighborhood.
From left:
Lennar, Olive Grove, Chino, California. (Lennar, KTGY,
and Kevin L. Crook Architects)
Lennar, Autumn Field, Chino, California. (Lennar, KTGY,
and Kevin L. Crook Architects)
Bela Flor Communities, Bella Rosa, Mesa, Arizona.
(Bela Flor Communities)
Attainable Housing: Challenges, Perceptions, and Solutions 21Olive Grove: The Preserve
High land prices in Southern California have forced Neighborhood Context community in the Inland Empire region of Southern California.
developers to get creative in their product offerings to The Preserve is an approximately 5,400-acre master- The city has proven popular with homebuyers attracted to
make deals pencil. Olive Grove is a single-family detached planned community in Chino, California, developed by the its safe, family-friendly environment and convenient access
home community by Lennar, part of the Preserve master- Lewis Company on a former and existing farm property. At to employment centers throughout the region.
planned community in Chino, California. Its detached completion, the community will be home to about 10,000
cluster site plan allows a higher density than traditional Site Specifics
dwelling units, 620 acres of business and commercial uses,
development. and nearly 3,000 acres of open space. Chino is a bedroom Olive Grove consists of two irregularly shaped tracts within
the Preserve, separated by another Lennar community,
Characteristics
Project address 8688 Celebration Street
Chino, California
Site size 6.59 acres
Units 57
Developer Lewis Community Developers
www.lewisgroupofcompanies.com
Homebuilder Lennar
www.lennar.com
Architect KTGY
www.ktgy.com
Land planner L.D. King Engineering
www.ldking.com
Product type 3 to 4 bedrooms, 2.5 to 3.5 baths
Home size range 1,829 to 2,462 sq ft
Parking 2-car garage
Price range $468,000 to $555,000
Lot dimensions 35 to 45 ft × 50 ft
Lot size 1,750 to 2,250 sq ft
Density 8 to 11 dwelling units/acre
Percent attiainable 50% (at 120% AMI)
(All images: Lennar, KTGY, and Kevin L. Crook Architects)
22 Attainable Housing: Challenges, Perceptions, and SolutionsAutumn Field. Given that the home design informs the
land plan, the architect plans the modules and layouts to
maximize yield on the site. The solution was a six-pack
module in a blend of green and motor courts.
Target Market
With two court types, Lennar attracted two different market
segments. Specifically, at Olive Grove, the development
appealed to family buyers with a more traditional feel in
terms of a full driveway, a front home entrance, and a
traditional yard. The alternative court, Autumn Field, designed
by Kevin L. Crook Architect, appeals to couples who value
the volume living space and patio home feel. The density
tradeoffs are also complemented by amenities at the
Preserve by Lewis Communities, which appeals to all buyer
segments, including trails, pools, fitness center, high-
quality schools, playgrounds, baseball fields, and tot lots.
Planning and Design
Olive Grove was designed to maximize the density of
detached housing while keeping a single-family home feel
to the community. With the target family demographics,
building with higher bedroom counts and two-car garages
was important. Given the higher building density of the
community, Lennar needed to orient the homes in a
way that maximized the privacy of the key living spaces,
including the great room and rear yard.
Challenges and Takeaways (All images: Lennar, KTGY, and Kevin L. Crook Architects)
• In areas with high land costs and strong demand • Different design criteria, such as full driveways, two- • A staggered driveway maximizes density and
for detached living, cluster housing can provide car side-by-side parking vs. tandem or staggered, provides a driveway parking option while creating a
higher density while maintaining a single-family stacked vs. volume over the great room, patio vs. variety in streetscape. Olive Grove was also able to
neighborhood feel. yards, finishes, and style, can appeal to different provide floor plans with a secondary and NextGen
buyers, creating segmentation within a similar suite downstairs in the cluster module.
density and home size.
Attainable Housing: Challenges, Perceptions, and Solutions 23Conclusion
The housing needs in this country are great. Many factors have played a role in limiting
the options for middle- and lower-income households to secure housing that is affordable
at their income levels. It is as important as ever for the industry to build all types of housing,
and especially to find ways to build nonsubsidized housing for middle-class buyers.
Ultimately, this type of housing—attainable housing—will relieve the current downward
pressure on the market that has kept renters from becoming homeowners and that has
made housing increasingly unaffordable for Americans at lower income levels.
Although the current industry perception may be that meeting this demand means
builders need to limit amenities, use lower-quality finishes, and locate in less desirable
areas, research for this report reveals that consumers would prefer better locations and
amenities over bigger homes or lower-density housing. In response, the report offers a
range of housing typologies with strategies and examples for building to meet this demand
while keeping costs low. Solutions include smaller homes, value housing, missing-middle
attached housing, and high-density detached cluster housing.
The ULI Terwilliger Center for Housing and RCLCO hope the information presented in this
report helps our members and others understand and meet the market opportunities for
building more attainable housing.
24 Attainable Housing: Challenges, Perceptions, and SolutionsU.S. $12.95
I S B N 978-0-87420-450-6
51295
2001 L Street, NW
Suite 200
Washington, DC 20036-4948 9 780874 204506You can also read