Environmental variables influence the developmental stages of the citrus leafminer, infestation level and mined leaves physiological response of ...

Page created by Samuel Conner
 
CONTINUE READING
Environmental variables influence the developmental stages of the citrus leafminer, infestation level and mined leaves physiological response of ...
www.nature.com/scientificreports

                OPEN             Environmental variables
                                 influence the developmental
                                 stages of the citrus leafminer,
                                 infestation level and mined leaves
                                 physiological response of Kinnow
                                 mandarin
                                 Rab Nawaz1*, Nadeem Akhtar Abbasi1,2, Ishfaq Ahmad Hafiz1, Muhammad Faisal Khan1 &
                                 Azeem Khalid2

                                 Climate change has not only exacerbated abiotic stress, but has also rendered external conditions
                                 more feasible for pests to spread and infest citrus fruit. Citrus leafminer (Phyllocnistis citrella) is a
                                 potential pest that directly feeds the newly sprouted leaves and twigs of all three spring, summer and
                                 autumn flushes. Increasing temperatures in spring and autumn, leafminer accrued more heat units
                                 or developmental degree days to accelerate the biological stages of its life-cycle, thereby increasing
                                 the pressure of infestation. Present work was conducted at three different environmental conditions
                                 in Sargodha, Toba Tek Singh (TTS) and Vehari districts of the Punjab province, Pakistan; all three
                                 experimental sites were located in different agro-ecological zones. More infestation was recorded
                                 in all three flushes at TTS and Vehari than in Sargodha. Overall, more damage was observed due to
                                 higher temperatures in TTS and Vehari than in Sargodha. After May–June heat stress, spontaneous
                                 vegetative growth continued from July to November, produced newly spouted tender leaves for
                                 feeding the leafminer larvae, and was seen more in TTS and Vehari. Leafminer larva prefers to enter
                                 young and tender leaves with a maximum entrance in leaves up to 1 ­cm2 in size while observing no
                                 entrance above 3 ­cm2 of leaf size. Physiological response of leaves primarily attributed to chlorophyll
                                 and carotenoid contents, both of which were recorded lower in the mined leaves, thereby reducing
                                 leaf photosynthetic activity. Similarly, lower levels of polyphenols and antioxidant activity were
                                 also recorded in the mined leaves. The on-tree age of mined leaves of three vegetative flushes of
                                 Kinnow plant was also less counted than non-mined leaves. Climate change has affected vegetative
                                 phenology and become feasible for pests due to extemporaneous leaf growth, particularly leafminer,
                                 and eventually causes economic loss by supplying low carbohydrates either to hanging fruits or next-
                                 season crops.

                                 Citrus fruit ranks first in the area and production among fruit growing in Pakistan, and the province of Punjab
                                 holds a dominant 95 percent share of area under citrus cultivation with the same production ­level1. Among the
                                 citrus cultivars in the Punjab plain, Kinnow mandarin grows 91% in three major clusters in the central-north,
                                 central and southern regions of the p ­ rovince2. The central-north cluster representing Sargodha and the adjacent
                                 districts of M.B Din and Chiniot leads the citrus area (60–62%), the central cluster area (8–10%) comprising the
                                 districts of TTS, Faisalabad and Jhang, and the southern cluster area (15–18%) including the districts of Sahiwal,
                                 Khanewal and Vehari, all three clusters are located in the irrigated canal ­area3.
                                     Approximately 34 insects and mite pests have infested various citrus c­ ultivars3,4, including citrus leafminer
                                 (CLM) or leafminer (LM) Phyllocnistis citrella Stainton (Lepidoptera: Gracillariidae), which has emerged as a

                                 1
                                  Department of Horticulture, Pir Mehr Ali Shah- Arid Agriculture University Rawalpindi, Rawalpindi,
                                 Pakistan. 2Department of Environmental Sciences, Pir Mehr Ali Shah- Arid Agriculture University Rawalpindi,
                                 Rawalpindi, Pakistan. *email: rnkahut@yahoo.com

Scientific Reports |   (2021) 11:7720                | https://doi.org/10.1038/s41598-021-87160-8                                                 1

                                                                                                                                             Vol.:(0123456789)
www.nature.com/scientificreports/

                                                    Weather data (2017 and 2018) of three research sites
                                                    Average temperature     Average relative
                                                    (°C)                    humidity (%)               Rainfall (mm)               Actual sunshine (h)
                                                    SGD     TTS     VEH     SGD      TTS       VEH     SGD        TTS      VEH     SGD      TTS      VEH
                                             Jan    12.17   12.76   14.13   80.05    81.05     73.68    18.84       5.41    7.50   114.60   145.70   155.25
                                             Feb    16.34   16.80   17.26   65.93    63.48     61.65    14.02       6.41    5.50   188.80   190.95   198.75
                                             Mar    21.62   22.13   24.94   63.68    65.32     57.98    26.30      13.96    3.50   222.15   219.65   234.31
                                             Apr    27.56   28.73   31.24   53.67    51.27     41.03    73.59      44.73    1.00   250.70   237.15   250.80
                                             May    31.56   32.39   35.83   49.35    46.98     32.85    39.03      21.37    2.00   256.05   230.65   255.31
                                             Jun    32.59   32.80   35.78   59.00    62.85     40.70    58.84      48.96   38.50   215.25   189.05   255.25
                                             Jul    31.57   32.96   33.20   72.47    71.37     55.22   167.17     102.46   81.00   211.75   218.80   230.45
                                             Aug    31.98   32.62   33.03   70.87    68.76     55.73    52.53      79.06    1.00   214.95   208.45   238.75
                                             Sep    29.66   30.78   33.88   70.63    67.13     51.87    49.02      20.96    0.00   230.95   222.55   233.90
                                             Oct    25.56   26.93   29.65   63.76    64.60     61.00       3.01     0.01    0.00   225.10   219.55   229.40
                                             Nov    18.03   18.84   19.78   80.02    82.40     64.42       1.53     2.51    0.00   187.40   131.20   138.75
                                             Dec    13.43   14.56   16.65   72.23    72.94     71.60       7.52     4.06    4.00   199.95   181.45   193.80
                                             Avg    24.34   25.19   27.11   66.80    66.51     55.64   42.61      29.15    12.00   209.80   199.60   217.89

                                            Table 1.  Weather data of three districts.

                                              direct leaf damaging citrus pest and associated ornamental p      ­ lants5. It is a destructive p
                                                                                                                                              ­ est6, with 16 generations
                                              overlapping in one ­year and likely to attack nurseries, young plantations and tender ­leaves8. The leafminer larva
                                                                        7

                                             makes serpentine mines in the tender leaf epidermis, and during the pupation period fold leaves to avoid external
                                             ­threats9. Average infestation of leafminer ranges from 17 to 57%10 and mostly spring and summer flushes are more
                                              infested than autumn. Fruit development is dependent on spring flush photoassimilates, while summer flush
                                              encourages citrus canker ­entry11,12. Leafminer infestation directly reduced yield and caused stunted plant growth
                                             and an early drop of infested leaves on all three vegetative ­flushes13. Henceforth, mined leaves have imperfect
                                             physiological ­response14 with low photosynthetic ­activity15,16 and also possess less polyphenols and antioxidant
                                            ­activity17 by directly reducing on-tree age of infested leaf.
                                                  Changes in climatic factors not only caused abiotic stress on plants, but also increased biotic i­ ncidence18. In
                                              the climate change scenario, temperature ­rise19 has become suitable for invasive ­species20 and optimized condi-
                                              tions for insects ­migration21,22. The distribution of the insect population depends on ­temperature23 and the tem-
                                              perature increase in early spring optimized the oviposition of the leafminer and the highest oviposition rate was
                                              recorded at 3 °C and the lowest at 20 °C24 and the oviposition period was shortened during high temperatures.
                                              The life cycle of the leafminer lasted 13 to 45 days depending on the t­ emperature25,26, the egg, larval and pupal
                                              periods squeezed with rising ­temperature8 and shortened during the ­summer27. Temperature, average relative
                                              humidity, and sunshine period are used to count agrometeorological indices of a specific a­ rea28–31 with year-round
                                              fluctuating patterns in different ­seasons32 by counting more in warm ­regions33,34. Insect-pest developmental stages
                                              are affected by agrometeorological indices such as developmental degree days (DDs)35 and ­photoperiod36,37,
                                              while climate variables also affect the developmental stages of l­ eafminer38. Meteorological indices determine the
                                             duration of the life ­cycle39,40 and the number of generations of leafminer per ­year41,42 by indicating population
                                              pressure on citrus in a particular a­ rea40,43 and also availability of new ­flush25,44.
                                                  Climate change in Pakistan has elevated temperature, extended summer spell, squeezed autumn and spring
                                              seasons, and caused erratic weather in the winter ­months2. On the one hand, insect-pests accelerated the life
                                              cycle by the accumulation of more heat units/degree days (DDs) and, on the other hand, caused serious environ-
                                              mental stress to the plant. Prior to this, research has been carried out on citrus pests pertaining to Integrated Pest
                                              Management (IPM), but the impact of climate change on citrus fruit remains to be explored. In this context, the
                                              present study was conducted in the main citrus groves/clusters of the Punjab province in three districts, namely
                                              Sargodha, Toba Tek Singh (TTS) and Vehari, all of which have different levels of meteorological/agrometeoro-
                                              logical indices affecting the developmental stages of the leafminer. Similarly, an evaluation of leafminer damaged
                                              percentage on citrus (Kinnow mandarin) three vegetative flushes, leaf size damaged percentage, physiological
                                              response, chlorophylls, carotenoids, polyphenols contents and antioxidant activity of non-mined and mined
                                              leaves under varying environmental conditions was conducted.

                                            Materials and methods
                                            The present study was conducted in three major citrus growing regions of the province of Punjab, Pakistan,
                                            during the 2017–18 and 2018–19 seasons.

                                            Weather data of three locations. Weather data from the respective experimental sites were taken from
                                            the Pakistan Meteorological Department and the average data for two years (2017 and 2018) is shown in Table 1.

                                            Selection of orchards for data collection. The selected orchards were located at Sargodha (32.0837°
                                            N, 72.6719° E and altitude 189 m), Toba Tek Singh (30.9727° N, 72.4850° E and altitude 161 m) and Vehari

          Scientific Reports |   (2021) 11:7720 |                   https://doi.org/10.1038/s41598-021-87160-8                                                         2

Vol:.(1234567890)
www.nature.com/scientificreports/

                                  (30.0452° N, 72.3489° E and altitude 140 m) in Pakistan. Plants of identical features like age (12–15 years),
                                  healthy, vigorous with planting density (250–260 plants/ha) in block form having 2 hectares area were selected
                                  from three sites. Total 36 branches/twigs of lead pencil size were marked at different canopy positions of the
                                  ­plant44. Tagged branches represented three canopy positions (lower, middle and upper) from plant four direc-
                                  tions and at each canopy position (inner, middle and outer) sides were used. Uniform cultural practices were
                                  followed in experimental sites. Data were recorded on a monthly basis during the growing season 2017–2018
                                  and 2018–201931.

                                  Agrometeorological/Thermal indices calculation. Leaf miner threshold temperature and thermal con‑
                                  stant. Threshold temperature of the leaf miner developmental stages (10.57, 7.31 and 7.42 °C) and thermal
                                  constant/developmental degree days (50.76, 109.89 and 136.98 DDs) of eggs, larvae and pupae, respectively,
                                  were used in the calculation of agrometeorological/thermal i­ ndices42.

                                  I‑Developmental degree days (DDs). Threshold temperature of each developmental stage of leafminer (egg to
                                                                                                                              ­ ay28,30,45.
                                  pupa) was subtracted on a monthly basis from the mean daily temperature and expressed as °C d
                                                                      Tmax + Tmin
                                                              DDs =               − T threshold of individual stage
                                                                           2

                                  II‑Hydrothermal units (HYTUs). Leafminer’s individual developmental stages DDs were multiplied with each
                                  month’s average relative humidity (RHa) for the calculation of HYTUs and expressed as °C day%30,46,47.
                                                               HYTUs = DDs × average relative humidity (RHa)

                                  III‑Photothermal index (PTI). Individual stage developmental degree days (DDs) of leafminers were divided
                                  on the respective month time taken in days to complete the cycle of different phases and expressed in °C30,48,49.
                                                               Monthly basis days taken by individaul stage
                                                                            Montly accumulated DDs
                                                                 =
                                                                    Individual stage DDs (threshold constant)
                                                                 × No. of days in respective month
                                                                              Monthly accumulated DDs
                                                               PTI =
                                                                     Monthly basis days taken by individual satge

                                  IV‑Helio thermal unit (HTU).    Actual bright sunshine hours were multiplied by DDs and value articulated in
                                         ­ ours30,44.
                                  °C day h
                                                              HTU ◦ C day = DDs × actual bright sunshine hours
                                                                        

                                  Different level DDs counted in climate change. Historical temperature data (1983–2016) of experi-
                                  mental sites (available on Agroclimatology Parameters on NASA website) was used to count developmental
                                  degree days (DDs) of leafminer by keeping developmental stage (egg to pupa) threshold temperature (8.43 °C).
                                  Average temperature based DDs were calculated for the study period (2017 and 2018) and compared to previous
                                  data (1983–2000) and (2001–2016) to obtain monthly basis differences in the availability of DDs to leafminer.
                                  A gradual mean daily temperature has risen due to global warming by endowing more DDs to leafminer. Addi-
                                  tional accumulation of DDs indicates rapid wrapping of leafminer developmental stages, which were counted
                                  more under warm Vehari and TTS conditions indicating increased population pressure. Data are shown in
                                  Table 2.

                                  Quantification of flushes and leafminer mined leaves.                The number of leaves in each flush was cal-
                                  culated from the tagged branches and the percentage of flush was quantified by adding three flush l­eaves50.
                                  Similarly, in each flush, the mined leaves were also counted, and their percentage was calculated from the total
                                  number of mined leaves of each flush.
                                                                                                                               
                                                                Total No. of leaves of three flushes spring + summer + autumn
                                            Flush leaves % =                                                                      × 100
                                                                                   Respective flush No. of leaves

                                  Monthly sprouting and leafminer larva entrance. Non-mined and mined leaves were calculated on
                                  a monthly basis from tagged branches, and the newly sprouted and leafminer larva entry leaves were also cal-
                                  culated.

Scientific Reports |   (2021) 11:7720 |               https://doi.org/10.1038/s41598-021-87160-8                                                 3

                                                                                                                                            Vol.:(0123456789)
www.nature.com/scientificreports/

                    Monthly available developmental degree days (DDs) of leafminer (egg to pupation stages)
                    Sargodha                                              T.T Singh                                     Vehari
                    Average         Average         Average         Average         Average         Average         Average         Average         Average
                    (2017–2018) (°C (2001–2016) (°C (1983–2000) (°C (2017–2018) (°C (2001–2016) (°C (1983–2000) (°C (2017–2018) (°C (2001–2016) (°C (1983–2000)
                    day)            day)            day)            day)            day)            day)            day)            day)            (°C day)
           Jan       116.07            110.65             80.84            134.17            121.56            100.29    176.67      190.68          137.53
           Feb       221.46            194.52            145.86            234.29            228.61            167.12    247.21      249.01          169.09
           Mar       408.95            399.63            327.58            424.82            441.03            361.41    511.67      473.50          384.35
           Apr       571.25            570.22            501.70            608.98            615.79            530.06    684.35      643.19          599.87
           May       716.92            710.3             673.29            742.72            735.65            698.14    849.42      830.58          747.38
           Jun       721.60            765.35            750.78            731.08            765.36            758.08    820.35      864.13          787.35
           Jul       717.85            730.25            720.59            760.32            748.35            735.5     768.67      770.35          758.81
           Aug       730.05            757.18            620.08            749.97            758.65            691.73    762.67      775.81          714.95
           Sep       636.83            659.31            592.90            670.43            689.31            610.6     763.35      691.21          676.66
           Oct       531.05            563.6             476.23            573.47            545.60            500.79    657.67      603.33          548.10
           Nov       287.98            316.5             306.33            312.28            325.25            317.04    340.60      408.67          348.30
           Dec       154.95            165.35            147.05            189.93            175.36            168.33    254.67      259.28          196.31
           Total    5814.96           5942.86           5343.23           6132.46           6150.52           5639.09   6837.30     6759.74         6068.70

                                                Table 2.  Monthly basis DDs computation of three sites.

                                                                              Monthly newly sporuted leaves%
                                                                                Total No. of leaves sprouted in each month in year
                                                                              =                                                    × 100
                                                                                     Respective month No. of sprouted leaves

                                                Leaf size entrance by larva after egg‑hatching. Leaf area meter (Model: Li-3100C Area Meter, Li-
                                                COR, Biosciences) was used to measure Kinnow leaves by size of leafminer infestation/mining. Damaged/mined
                                                leaves (1 cm) of mining length (1st instar larva) were detached from the plant and the leaf area was measured.
                                                1 cm of mining leaves were detached in order to count the size of the leaf, which 1st instar larvae prefer to
                                                enter for feeding just after the egg-hatching. Mining length (1 cm) represents first instar larva which has taken
                                                4–5 days after egg ­hatching51.

                                                Chlorophylls and carotenoids measurement. The method followed b­ y52,53 was used to measure the
                                                                                                                                                   ­ y54.
                                                chlorophyll and carotenoid levels of the mined and non-mined leaves, using the equations described b
                                                                              Total Chlorophyll = 20.2 A645 + 8.02 A663
                                                                             Chlorophyll a (Ca) = 11.75 A663 − 2.350 A645
                                                                             Chlorophyll b (Cb) = 18.61 A645 − 3.960 A663
                                                                              Total carotenoids = 1000 A470 − 2.270 Ca − 81.4 Cb/227

                                                Polyphenols and anti‑oxidant measurement. Antioxidant activity (DPPH inhibition %) and total
                                                phenolic contents were measured using t­he55 method, while total flavonoids and flavonol contents were also
                                                determined using ­the36,56 procedure. The standard gallic acid curve used b­ y57 to calculate the total phenolic
                                                                                              58
                                                contents and the standard quercetine curve ­of was used to estimate the total flavonoids and flavonol contents.

                                                Physiological response of non‑mined and mined leave. Portable Photosynthesis System (Model:
                                                PP-Systems, CIRAS-3, Amesbury, U.S.A) was used to measure physiological response of non-mined and mined
                                                leaves. Net assimilation rate, stomatal conductance, sub-stomatal conductance/intercellular C­ O2 concentration,
                                                transpiration rate and water use efficiency parameters were measured. Ambient sunlight and cuvette tempera-
                                                ture with a standard reference of C­ O2 (390 μmol ­mol−1) have been fixed (manual of the instrument available at
                                                www.​ppsys​tems.​com) for measuring data of different mining lengths and intact leaves. The selected leaves were
                                                removed after taking photosynthetic activities to measure mining length. Mined area of the leaf was removed
                                                to measure percentage of damaged leaf. Data recorded on the PP-System/Infrared Gas Analyzer (IRGA) of dif-
                                                ferent leaves with mining damage ranged from 10 to 60 per cent compared to non-mined leaves. Matured two-
                                                month-old (mined and non-mined) leaves were used to estimate physiological response. Similarly, different age
                                                in ­months1–8 of both non-mined and mined leaves physiological response was also checked through IRGA. Leaf
                                                cuvette dimension (18 × 25 mm) was set to cover an area of 4.5 ­cm2. Whole chamber was covered with leaf by
                                                inserting middle side of non-mined and infested portion of mined leaves to attain accuracy. Similarly identical
                                                features leaves free from insect-pests except LM of both non-mined and mined were used.

          Scientific Reports |      (2021) 11:7720 |                    https://doi.org/10.1038/s41598-021-87160-8                                                4

Vol:.(1234567890)
www.nature.com/scientificreports/

                                           Leafminer different stages monthly developmental degree days(DDs)
                                           Sargodha                                T.T Singh                              Vehari
                                                        Larva (°C     Pupa (°C     Egg (°C      Larva (°C      Pupa (°C   Egg (°C   Larva (°C   Pupa (°C
                                           Egg (°C day) day)          day)         day)         day)           day)       day)      day)        day)
                                   Jan       49.73       150.79        147.38        67.83       168.89         165.48     110.33    211.39      207.98
                                   Feb      161.54       252.82        249.74       174.365      265.645        262.565    187.29    278.57      275.49
                                   Mar      342.605      443.665       440.255      358.48       459.54         456.13     445.33    546.39      542.98
                                   Apr      507.025      604.825       601.525      544.775      642.575        639.275    620.15    717.95      714.65
                                   May      650.58       751.64        748.23       676.38       777.44         774.03     783.08    884.14      880.73
                                   Jun      657.4        755.2         751.9        666.875      764.675        761.375    756.15    853.95      850.65
                                   Jul      663.705      764.765       761.355      683.63       784.69         781.28     696.33    797.39      793.98
                                   Aug      572.625      670.425       667.125      606.225      704.025        700.725    699.15    796.95      793.65
                                   Sep      572.625      670.425       667.125      606.225      704.025        700.725    699.15    796.95      793.65
                                   Oct      464.705      565.765       562.355      507.13       608.19         604.78     591.33    692.39      688.98
                                   Nov      223.775      321.575       318.275      248.075      345.875        342.575    276.4     374.2       370.9
                                   Dec       88.605      189.665       186.255      123.63       224.69         221.28     188.33    289.39      285.98
                                   Total   4954.92      6141.56       6101.52      5263.62      6450.26        6410.22    6053.02   7239.66     7199.62

                                  Table 3.  Leafminer developmental degree days (DDs).

                                  Leaf sclerophylly. Leaf sclerophylly parameters like leaf area, fresh weight (FW), dry weight (DW), specific
                                  leaf area (SLA = LA/DW: in c­ m2 ­g−1 DW), specific leaf weight (SLW = DW/LA: in g ­cm2 LA), density of foliar tis-
                                  sue (D = DW/FW X 1000: in g k­ g−1) and succulence [S = (FW-DW)/LA: in mg H2O c­ m−2] were used in all three
                                  flushes having (10–60 days) leaf ­age59.

                                  Leaf age calculation of non‑mined and mined leaves of three flushes. At different times of both
                                  mined and non-mined leaves of each flush leaf age was counted from labeled branches from the sprouting date
                                  to the leaf-shedding.

                                  Statistical analysis. The research was designed in randomized complete block design using factorial analy-
                                  sis on the Statistix 8.1 software. Analysis of variance of the individual parameter was performed using LSD
                                  while keeping P value at P ≤ 0.05. In tables data are shown in means ± standard deviation (M ± SD) and in figures
                                  means ± standard error (M ± SE). In each replicate, three plants of uniform features like age, health and canopy
                                  volume were used by tagging 36 branches of uniform size at analogous canopy positions of individual tree in all
                                  three experimental sites to attain uniformity.

                                  Results
                                  Data analysis regarding leafminer damage and physiological response of mined leaves reflected significant influ-
                                  ence under varying environmental conditions, which were explained and discussed under.

                                  Agrometeorological/Thermal indices. Agrometeorological/thermal indices availability in different
                                  developmental stages of leafminer is presented in Tables 3, 4, 5, 6 and 7. Mean daily temperature was observed
                                  higher in warm districts of Vehari, followed by TTS and lower in Sargodha, and the availability of leafminer
                                  developmental degree days (DDs) was computed accordingly. Maximum DDs (884.14 °C day) were calculated
                                  during May at Vehari in the larva stage and minimum (49.73 °C day) at Sargodha in the egg-hatching stage
                                  during the month of January. More time was taken at Sargodha in the cool month of January (31.64 days) and
                                  less time in the warm month of May at Vehari (2.01 days) in the egg-hatching stage. Leafminer egg-hatching
                                  stage took more number of days in cool months at Sargodha and less was counted at Vehari in summer months.
                                  More photothermal indexes were recorded in May at Vehari (389.7 °C) and less in Sargodha (1.57 °C) during
                                  January at the egg-hatching stage. PTI level was increased in warm months and more availability was observed
                                  during the egg-hatching stage. Maximum helio thermal unit was available at Vehari (225,729.78 °C day hours)
                                  during the developmental stage of the larva and minimum was computed at Sargodha (5699.06 °C day hours)
                                  during the egg-hatching stage in January. Hydrothermal units (HYTUs) were more available in July at TTS
                                  (56,340.74 °C day percent) at the developmental stage of larvae and less in January at Sargodha (3980.89 °C day
                                  percent) at the egg-hating stage. Significant differences in agrometeorological indices were observed on a
                                  monthly basis in the developmental stages of leafminer and districts.

                                  Kinnow flushes and leafminer damage. Estimation of vegetative flush and leafminer damage on each
                                  flush was measured in three different ecological zones of Punjab, with a substantial statistical difference as shown
                                  in Fig. 1. Spring flush was recorded as maximum in Sargodha (60%) and minimum at TTS (52%) during 2017
                                  season. Summer flush was quantified higher in TTS (36%) and lower at Sargodha (23.67%) in season 2017.
                                  Autumn flush was counted more at Sargodha (16.67%) in growing year 2018 and less in TTS (12%) during 2017.

Scientific Reports |   (2021) 11:7720 |                  https://doi.org/10.1038/s41598-021-87160-8                                                        5

                                                                                                                                                    Vol.:(0123456789)
www.nature.com/scientificreports/

                                                            Monthly number of days taken in leafminer different developmental stages
                                                            Sargodha                                           T.T Singh                                                Vehari
                                                            Egg (days)    Larva (days) Pupa (days)             Egg (days)         Larva (days) Pupa (days)              Egg (days)     Larva (days) Pupa (days)
                                                    Jan     31.64         22.59             28.81              23.20              20.17              25.66              14.26          16.12             20.42
                                                    Feb      8.80         12.17             15.36               8.15              11.58              14.61               7.59          11.05             13.92
                                                    Mar      4.59           7.68                9.65            4.39               7.41               9.31               3.53           6.23              7.82
                                                    Apr      3.00           5.45                6.83            2.80               5.13               6.43               2.46           4.59              5.75
                                                    May      2.42           4.53                5.68            2.33               4.38               5.49               2.01           3.85              4.82
                                                    Jun      2.32           4.37                5.47            2.28               4.31               5.40               2.01           3.86              4.83
                                                    Jul      2.37           4.45                5.58            2.30               4.34               5.44               2.26           4.27              5.35
                                                    Aug      2.75           5.08                6.37            2.60               4.84               6.06               2.25           4.27              5.35
                                                    Sep      2.66           4.92                6.16            2.51               4.68               5.86               2.18           4.14              5.18
                                                    Oct      3.39           6.02                7.55            3.10               5.60               7.02               2.66           4.92              6.16
                                                    Nov      6.81         10.25             12.91               6.14               9.53              12.00               5.51           8.81             11.08
                                                    Dec     17.76         17.96             22.80              12.73              15.16              19.19               8.36          11.77             14.85
                                                    Avg      7.38           8.79            11.10               6.04               8.10              10.20               4.59           6.99              8.79

                                                    Table 4.  Leafminer developmental stages time taken in days.

                                                            Leafminer different developmental stages monthly photothermal index (PTI)
                                                            Sargodha                                      T.T Singh                                          Vehari
                                                            Egg (°C)     Larva (°C)      Pupa (°C)        Egg (°C)     Larva (°C)         Pupa (°C)          Egg (°C)     Larva (°C)     Pupa (°C)
                                                    Jan       1.57          6.67           5.12              2.92          8.37               6.45             7.74        13.12             10.19
                                                    Feb      18.36        20.77           16.26            21.39          22.93            17.97              24.68        25.22             19.79
                                                    Mar      74.59        57.78           45.64            81.67          61.99            49.00             126.03        87.64             69.43
                                                    Apr     168.82       110.96           88.05           194.89       125.25              99.45             252.55       156.35         124.28
                                                    May     268.98       165.84          131.84           290.74       177.42             141.09             389.70       229.47         182.67
                                                    Jun     283.80       173.00          137.58           292.04       177.37             141.06             375.47       221.20         176.09
                                                    Jul     279.94       171.69          136.51           297.00       180.75             143.75             308.14       186.65         148.46
                                                    Aug     208.38       131.94          104.81           233.55       145.50             115.63             310.64       186.44         148.33
                                                    Sep     215.33       136.34          108.30           241.34       150.35             119.49             320.99       192.66         153.28
                                                    Oct     137.24        93.96           74.47           163.44       108.58              86.13             222.22       140.73         111.79
                                                    Nov      32.88        31.37           24.65            40.41          36.29            28.56              50.17        42.47             33.48
                                                    Dec       4.99        10.56            8.17             9.71          14.82            11.53              22.54        24.58             19.26
                                                    Avg     141.24        92.57           73.45           155.76       100.80              80.01             200.91       125.54             99.75

                                                    Table 5.  Leafminer developmental stages photothermal index.

                    Leafminer different stages monthly helio thermal unit (HTU)
                    Sargodha                                                  T.T Singh                                                               Vehari
                    Egg (°C day h)   Larva (°C day h)     Pupa (°C day h)     Egg (°C day h)           Larva (°C day h)     Pupa (°C day h)           Egg (°C day h)        Larva (°C day h)         Pupa (°C day h)
           Jan          5699.06         17,280.53           16,889.75                9882.83             24,607.27                24,110.44              17,128.73               32,818.30             32,288.90
           Feb        30,498.75         47,732.42           47,150.91               33,295.00            50,724.91                50,136.79              37,223.89               55,365.79             54,753.64
           Mar        76,109.70         98,560.18           97,802.65               78,740.13           100,937.96            100,188.95               104,345.27               128,024.64            127,225.64
           Apr       127,111.17       151,629.63           150,802.32              129,193.39           152,386.66            151,604.07               155,533.62               180,061.86            179,234.22
           May       166,581.01       192,457.42           191,584.29              156,007.05           179,316.54            178,530.02               199,928.15               225,729.78            224,859.18
           Jun       141,505.35       162,556.80           161,846.48              126,072.72           144,561.81            143,937.94               193,007.29               217,970.74            217,128.41
           Jul       140,539.53       161,938.99           161,216.92              149,578.24           171,690.17            170,944.06               160,469.25               183,758.53            182,972.69
           Aug       123,085.74        144,107.85          143,398.52              126,367.60           146,754.01            146,066.13                166,922.06              190,271.81            189,483.94
           Sep       132,247.74        154,834.65          154,072.52              134,915.37           156,680.76            155,946.35                163,531.19              186,406.61            185,634.74
           Oct       104,605.10        127,353.70          126,586.11              111,340.39           133,528.11            132,779.45                135,651.10              158,834.27            158,052.01
           Nov        41,935.44         60,263.16           59,644.74               32,547.44            45,378.80                44,945.84              38,350.50               51,920.25             51,462.38
           Dec        17,716.57         37,923.52           37,241.69               22,432.66            40,770.00                40,151.26              36,498.35               56,083.78             55,422.92
           Total    1,107,635.16     1,356,638.85         1,348,236.88         1,110,372.83            1,347,337.01         1,339,341.29              1,408,589.41          1,667,246.35             1,658,518.66

                                                    Table 6.  Leafminer helio thermal units (HTU).

          Scientific Reports |       (2021) 11:7720 |                        https://doi.org/10.1038/s41598-021-87160-8                                                                                                6

Vol:.(1234567890)
www.nature.com/scientificreports/

         Leafminer different stages monthly hydrothermal units (HYTUs)
         Sargodha                                                                            T.T Singh                                                         Vehari
         Egg (°C day %)   Larva (°C day %) Pupa (°C day %)                                   Egg (°C day %)            Larva (°C day %) Pupa (°C day %)        Egg (°C day %)    Larva (°C day %) Pupa (°C day %)
Jan        3980.89         12,070.74                                11,797.77                  5226.30                 13,012.97            12,750.23              8144.01           15,603.75         15,352.04
Feb      10,647.91         16,664.63                                16,461.61                 11,294.49                17,207.15            17,007.65          11,547.36             17,175.23         16,985.34
Mar      21,820.51         28,257.02                                28,039.84                 22,799.33                29,226.74            29,009.87          25,301.42             31,043.15         30,849.41
Apr      27,219.64         32,470.03                                32,292.87                 28,055.91                33,092.61            32,922.66          25,441.65             29,453.90         29,318.52
May      32,109.38         37,097.19                                36,928.89                 31,299.48                35,976.04            35,818.24          29,071.85             32,823.70         32,697.10
Jun      38,786.60         44,556.80                                44,362.10                 40,929.45                46,931.93            46,729.39          36,949.27             41,728.27         41,567.01
Jul      48,092.06         55,414.87                                55,167.78                 49,084.63                56,340.74            56,095.90          37,016.90             42,389.25         42,207.98
Aug      40,590.52         47,523.08                                47,289.16                 41,950.77                48,718.53            48,490.17          39,491.49             45,015.72         44,829.32
Sep      40,450.23         47,358.82                                47,125.71                 41,011.12                47,627.29            47,404.05          37,488.42             42,732.46         42,555.51
Oct      29,627.27         36,070.35                                35,852.94                 33,331.12                39,973.29            39,749.17          35,671.98             41,768.43         41,562.72
Nov      17,904.24         25,729.22                                25,465.18                 19,095.57                26,623.73            26,369.71          18,098.67             24,502.62         24,286.53
Dec        6398.61         13,696.66                                13,450.40                  8932.27                 16,233.85            15,987.48          14,840.40             22,803.93         22,535.22
Total    317,627.85       396,909.41                                394,234.26               333,010.46                410,964.88           408,334.52         319,063.44        387,040.40            384,746.70

                                         Table 7.  Leafminer hydrothermal units (HYTUs).

                                                                   70
                                                                          a                                Spring flush                       Summer flush
                                                                                                   a                                                                a
                                                                   60                                                                                                                  a
                                                                                                                                               ab
                                                                                                                            b
                                        Flush quantification (%)

                                                                   50

                                                                   40                                                               c
                                                                                                                                                      dc                dc
                                                                                                                                                                                           dc
                                                                   30            d                         d

                                                                   20                                              e                                       e                                       e
                                                                                         e                                                                                   e
                                                                                                                                        e
                                                                   10

                                                                    0
                                                                         SGD 2017                SGD 2018                  TTS 2017            TTS 2018         VEH 2017              VEH 2018
                                                                                                                          (A)Three sites and years

                                                                   30                Spring flush                      Summer flush               Autumn flush               Total
                                                                                                                                                           a
                                                                   25                                                                   b                                                      b
                                                                                                                                                                             c
                                                                   20
                                       LM damage (%)

                                                                   15                    d                         d                              d
                                                                                                                               de                                                de
                                                                                                                           e                  e                e
                                                                   10                                                                                               f                  f
                                                                          g g                          g                                              g                                    g
                                                                                                  g                                 g
                                                                    5                                                                                                   h
                                                                                     i                         i

                                                                    0
                                                                         SGD 2017                SGD 2018                 TTS 2017           TTS 2018          VEH 2017          VEH 2018
                                                                                                                                (B) Sites and years

                                         Figure 1.  (A) Quantification of three vegetative flushes (B) Leafminer damage of vegetative flushes (leaves
                                         percentage). Bars sharing dissimilar letters are significantly differed according to LSD test (P ≤ 0.05).

Scientific Reports |      (2021) 11:7720 |                                                   https://doi.org/10.1038/s41598-021-87160-8                                                                                 7

                                                                                                                                                                                                                   Vol.:(0123456789)
www.nature.com/scientificreports/

                                                                          45              a                   Feb                    Mar              Jul               Aug           Sep                 Oct                 Nov
                                                                                                                        a

                                              Newly sprouting leaves(%)
                                                                          40
                                                                          35                                                                                                                              b
                                                                                                                                                  b                           bc                                                       b
                                                                          30                                                                                                                          c                            c
                                                                                                                                                                             cd
                                                                          25                                        d                         d
                                                                                      e                                                                                               e                               e
                                                                          20                                                                              e
                                                                                                                                                                                                                  f                              ef
                                                                          15                      f                              f                                f                       f                                                    fg
                                                                                                                                                                                                                                                      g
                                                                          10                          ghg h                          g ggh            g               g hi        g           g                           g
                                                                                              h                             hi                                                                                c               hi                          hi
                                                                                                                                                                                                  i                                        i
                                                                              5
                                                                              0
                                                                                      SGD 2017                      SGD 2018                      TTS 2017                    TTS 2018                 VEH 2017                        VEH 2018
                                                                                                                                                  (A) Sites & years

                                                                      10
                                                                                                        Feb                  Mar             Jul                      Aug          Sep                Oct                 Nov          a
                                                                          9                                                                                                                               b
                                                                          8                                                                       c
                                           Monthly LM mining (%)

                                                                                                                                                                              c
                                                                          7
                                                                          6
                                                                                      d                                                                   d                         d
                                                                          5                                         de                                                               de
                                                                                                                                                                                  e                                   e                        e
                                                                          4                                                  e                        e           e                    e                                                           ee
                                                                                              e                                                                                                                   f       f        f
                                                                          3                                                                                   f
                                                                                                  fg                             fgfg                                                         fg                                                          fg
                                                                                                    fg                                                                fg fg
                                                                          2                                                                  fg                                                       g                                    g
                                                                                  i                      i      i        i              i                                                                     g               g
                                                                          1               j
                                                                          0
                                                                                  SGD 2017                      SGD 2018                      TTS 2017                       TTS 2018                 VEH 2017                     VEH 2018
                                                                                                                                                  (B) Sites & years

                                             Figure 2.  (A) Monthly newly sprouted leaves (B) Monthly leafminer mining on newly sprouted leaves. Bars
                                             sharing dissimilar letters are significantly differed according to LSD test (P ≤ 0.05).

                                             Mined leaves were seen in spring flush as higher in Vehari (10.39%) and lower at Sargodha (4.79%) in 2018 sea-
                                             son. In summer flush, maximum mined leaves were recorded at TTS (12.39%) in season 2018 and minimum in
                                             Sargodha (5.07%) during 2017. However, in autumn flush, mined leaves higher counting was recorded at TTS
                                             (5.29%) and lower in Sargodha (2.11%) during 2018 season. Overall mined leaves were counted as maximum at
                                             TTS (26.31%) and minimum in Sargodha (12.52%) during 2018. It was statistically insignificant differences in
                                             the vegetative flush of all three districts during 2017 and 2018. However, due to different levels of pest pressure,
                                             a marginal difference in leafminer infestation was observed during both years.

                                             Monthly sprouting and leafminer larva entrance. The perusal of data on monthly new sprouting
                                             leaves and damaged leaves from leafminer was shown in Fig. 2A,B, which showed significant impacts of different
                                             climatic conditions. Maximum newly sprouted leaves were recorded at Sargodha (41%) during March 2017 and
                                             minimum in TTS (3.33%) in the month of November 2018. In all three experimental sites, higher count of newly
                                             sprouting leaves were seen in March and lower during July and November. Similarly higher LM infestation was
                                             seen in March and lower in February and November in all three sites. However, maximum mined leaves were
                                             counted at Vehari (8.66%) in March 2018 and lower in Sargodha (0.25%) in the month of July 2017. In all three
                                             districts, no new sprouting was seen in January, April, May, June and December and henceforth, LM infestation
                                             was not recorded as such in these months, as larva just after egg-hatching prefer to feed or make zigzag entry in
                                             newly emerging leaves.

                                             Leaf size entrance by larva after egg‑hatching. Leaf size mined by leaf miner was presented in Fig. 3.
                                             Maximum larva entry/mining was recorded in leaf size (0–1 ­cm2), followed by leaf size (1–2 ­cm2) and least
                                             in leaf size (2–3 c­ m2) at all three districts. In leaf size (0-1cm2), maximum larva entry was found (63.33%) in
                                             spring flush and minimum (53.33%) in autumn flush at Sargodha. In leaf size (1-2cm2), higher larva mining was
                                             recorded at Sargodha (37.33%) in autumn flush and lower at Vehari (30.67%) in spring flush. However, least
                                             mining was recorded in leaf size (2-3cm2) by recording more in autumn flush at Vehari (9.67%) and less in sum-
                                             mer flush at Sargodha (4.33%). Leaf size above 3 ­cm2 was shown to be tolerant of newly hatched larva making
                                             mine or leaf entry in all three locations. In all three districts and flushes a significant differences were observed
                                             with respect to leaf size in the larva making mine or entry.

          Scientific Reports |   (2021) 11:7720 |                                                            https://doi.org/10.1038/s41598-021-87160-8                                                                                                        8

Vol:.(1234567890)
www.nature.com/scientificreports/

                                                      70                     Size (0-1)                      Size (1-2)                      Size (2-3)
                                                                     a                               a                                            a                a
                                                           ab                                                       ab             ab
                                                      60                                                                                                                          b
                                                                                   c

                                                      50

                                 Larva entrance (%)
                                                      40                                 d
                                                            de                                                                                                                        de
                                                                         e                               e               e              e              e               e
                                                      30

                                                      20
                                                                                             f                                f              f                                             f
                                                      10         h                                           fh                                            fh              fh
                                                                             h

                                                       0
                                                            SGD    SGD    SGD                         TTS     TTS   TTS                              VEH    VEH    VEH
                                                           Spring Summer Autumn                      Spring Summer Autumn                           Spring Summer Autumn
                                                                                                 Sites & vegetative flushes

                                   Figure 3.  Larva entrance after egg-hatching of leaf size. Bars sharing dissimilar letters are significantly differed
                                   according to LSD test (P ≤ 0.05).Leaf size in ­cm2.

                                                                     Spring flush leaf sclerophylly at different level of leaf age
                                                                     10th days                   20th days               30th days               40th days             50th days               60th days
                                        Leaf area ­(cm2)                  2.66 ± 0.52f.            4.93 ± 0.08e              6.24 ± 0.59d          8.03 ± 0.46c             9.67 ± 0.75b        11.86 ± 1.25a
                                        Leaf fresh weight (g)            0.065 ± 0.012e            0.13 ± 0.005d          0.161 ± 0.032c          0.194 ± 0.015b           0.214 ± 0.081b       0.254 ± 0.038a
                                        Leaf dry weight (g)              0.012 ± 0.002c           0.014 ± 0.003c          0.023 ± 0.002b          0.026 ± 0.001ab          0.028 ± 0.009a        0.03 ± 0.002a
                                        Specific leaf area ­(cm2
                                                                     231.87 ± 17.59f.            346.98 ± 6.14b          275.19 ± 25.11d         303.24 ± 11.31c       347.61 ± 22.26b         392.48 ± 18.96a
                                        ­g−1)
                                        Specific leaf weight
                                                                         0.004 ± 0.0006a          0.003 ± 0.00047a        0.004 ± 0.0006a 0.0033 ± 0.0007a             0.0029 ± 0.0004ab       0.0026 ± 0.0008b
                                        (g ­cm2)
                                        Density of foliar tissue
                                                                     162.61 ± 12.58a             149.31 ± 11.58b         146.59 ± 21.4b          136.77 ± 9.77bc       130.88 ± 11.44c         120.23 ± 13.72d
                                        (g ­kg−1)
                                        Succulence (mg ­H2O
                                                                     0.0245 ± 0.003a             0.0235 ± 0.007a         0.0219 ± 0.003b         0.0209 ± 0.008bc      0.0193 ± 0.008c         0.0188 ± 0.005c
                                        ­cm−2)

                                   Table 8.  Leaf sclerophylly parameters of spring flush.

                                                                     Summer flush leaf sclerophylly at different level of leaf age
                                                                     10th days                    20th days               30th days               40th days                50th days           60th days
                                        Leaf area ­(cm2)                  2.25 ± 0.2f.              3.75 ± 0.29e              4.73 ± 0.34d          6.14 ± 0.51c             7.95 ± 0.37b        9.36 ± 0.42a
                                        Leaf fresh weight (g)            0.070 ± 0.009e             0.12 ± 0.008d            0.155 ± 0.007c        0.188 ± 0.021b           0.212 ± 0.022ab     0.232 ± 0.025a
                                        Leaf dry weight (g)               0.02 ± 0.003d            0.038 ± 0.005c            0.048 ± 0.006bc       0.063 ± 0.0074a          0.055 ± 0.0047b      0.06 ± 0.0057a
                                        Specific leaf area ­(cm2
                                                                          98.1 ± 6.24c              96.6 ± 5.44c             99.11 ± 6.35c         98.63 ± 7.24c           144.17 ± 11.54b      158.1 ± 15.87a
                                        ­g−1)
                                        Specific leaf weight
                                                                          0.01 ± 0.0006a           0.001 ± 0.0005a            0.01 ± 0.0006a        0.01 ± 0.0006a          0.007 ± 0.0005b    0.0065 ± 0.008b
                                        (g ­cm2)
                                        Density of foliar tissue
                                                                     333.54 ± 14.56a              317.18 ± 16.65b         311.34 ± 18.55b         336.06 ± 13.76a          262.52 ± 16.73c      259.2 ± 14.92c
                                        (g ­kg−1)
                                        Succulence (mg ­H2O
                                                                     0.0206 ± 0.0025b             0.0221 ± 0.0016a        0.0227 ± 0.001a         0.0203 ± 0.0014b         0.0197 ± 0.001bc    0.0185 ± 0.0025c
                                        ­cm−2)

                                   Table 9.  Leaf sclerophylly parameters of summer flush.

                                   Leaf sclerophylly for leafminer larva feeding after entrance. Leaf sclerophylly of three flushes are
                                   presented in Tables 8, 9 and 10. In spring flush leaf area (2.66, 4.93, 6.24, 8.03, 9.67 and 11.86 ­cm2) and leaf succu-
                                   lence (0.0205, 0.0235, 0.0219, 0.0209, 0.0193 and 0.0188 mg ­H2O ­cm−2) were recorded at 10th, 20th, 30th, 40th,
                                   50th and 60th days of leaf age, respectively. Similarly, leaf area (2.25, 3.75, 4.73, 6.14, 7.95 and 9.36 ­cm2) and leaf
                                   succulence (0.0206, 0.0221, 0.0227, 0.0203, 0.0197 and 0.0185 mg ­H2O ­cm−2) were measured in summer flush at

Scientific Reports |   (2021) 11:7720 |                                  https://doi.org/10.1038/s41598-021-87160-8                                                                                               9

                                                                                                                                                                                                           Vol.:(0123456789)
www.nature.com/scientificreports/

                                                                      Autumn flush leaf sclerophylly at different level of leaf age
                                                                      10th days           20th days           30th days           40th days           50th days          60th days
                                             Leaf area ­(cm2)           2.03 ± 0.21f.       2.65 ± 0.09e         4.5 ± 0.21d          6.19 ± 0.27c      7.46 ± 0.32b       8.89 ± 0.26a
                                             Leaf fresh weight (g)     0.061 ± 0.01f.      0.086 ± 0.012e       0.14 ± 0.007d      0.188 ± 0.01c       0.222 ± 0.22b      0.262 ± 0.01a
                                             Leaf dry weight (g)       0.011 ± 0.004d      0.013 ± 0.0075d     0.024 ± 0.0047c        0.03 ± 0.003b    0.035 ± 0.009ab    0.039 ± 0.005a
                                             Specific leaf area
                                                                      193.04 ± 7.24d      201.62 ± 12.14bc    192.56 ± 13.69c     207.34 ± 18.67b     214.49 ± 18.42ab    229.9 ± 20.67a
                                             ­(cm2 ­g−1)
                                             Specific leaf weight
                                                                      0.0052 ± 0.0005a     0.004 ± 0.0004b     0.005 ± 0.00045a    0.005 ± 0.0004a 0.0047 ± 0.0006ab     0.0044 ± 0.0006b
                                             (g ­cm−2)
                                             Density of foliar tis-
                                                                      172.05 ± 14.56a     153.62 ± 12.85c     165.72 ± 11.56ab    159.71 ± 9.57b      159.02 ± 15.08b    150.02 ± 18.37c
                                             sue (g k­ g−1)
                                              Succulence ­(mgH2O
                                                                       0.025 ± 0.00025a    0.027 ± 0.00052a    0.026 ± 0.00054a    0.026 ± 0.0009a     0.025 ± 0.0009a    0.025 ± 0.0009a
                                             ­cm−2)

                                            Table 10.  Leaf sclerophylly parameters of autumn flush. Results were reported in means (± SD). Means
                                            sharing dissimilar letters are significantly differed according to LSD test (P ≤ 0.05) for three flushes leaves aged
                                            (10–60 days) in Tables 8, 9 and 10.

                                            10th, 20th, 30th, 40th, 50th and 60th days of leaf age, respectively. Whereas, leaf area was estimated (2.03, 2.65,
                                            4.5, 6.19, 7.46 and 8.89 c­ m2) and leaf succulence (0.025, 0.027, 0.026, 0.026, 0.025 and 0.025 mg H
                                                                                                                                                ­ 2O ­cm−2) were
                                            recorded in autumn flush at 10th, 20th, 30th, 40th, 50th and 60th days of leaf age, respectively. Both leaf area and
                                            succulence decide larva feeding/mining in a leaf while the rest of leaf sclerophylly parameters depend on leaf size
                                            and weight, which indirectly indicates the susceptible leaves.

                                            Chlorophyll and carotenoids contents of non‑mined and mined leaves. Chlorophyll and carot-
                                            enoids content of non-mined and mined leaves are shown in Fig. 4. Total chlorophyll contents were estimated in
                                            non-mined leaves (3.51, 3.81 and 3.3 mg/g FW) and in mined leaves (2.35, 2.36 and 1.96 mg/g FW) in Sargodha,
                                            TTS and Vehari, respectively. Chlorophyll a was recorded in non-mined leaves (1.56, 1.75 and 1.33 mg/g FW)
                                            and in mined leaves (1.04, 1.07 and 0.8 mg/g FW) in Sargodha, TTS and Vehari, respectively. Chlorophyll b was
                                            calculated in non-mined leaves (1.75, 1.84 and 1.77 mg/g FW) and in mined leaves (1.17, 1.15 and 1.05 mg/g
                                            FW) in Sargodha, TTS and Vehari, respectively. Similar trends in carotenoid levels were seen in non-mined
                                            leaves (0.68, 0.61 and 0.65 mg/g FW) and in mined leaves (0.54, 0.47 and 0.49 mg/g FW) in Sargodha, TTS and
                                            Vehari, respectively. Leaves samples were collected from two months old summer flush, which showed a signifi-
                                            cant declining trend of both chlorophylls and carotenoids in the mined leaves at all three locations.
                                                Total chlorophyll, chlorophyll a, chlorophyll b and carotenoid contents were recorded as maximum in non-
                                            mined leaf (5.01, 1.86, 2.44 and 0.38 mg/g FW) and minimum in mined leaves (3.45, 1.26, 1.74 and 0.29 mg/g
                                            FW), respectively in spring flush. In summer flush, total chlorophyll, chlorophyll a, chlorophyll b and carotenoid
                                            contents were maximum recorded in non-mined leaves (4.85, 1.94, 1.92 and 0.44 mg/g FW) and minimum in
                                            mined leaves (3.2, 1.16, 1.66 and 0.25 mg/g FW), respectively. Similarly, in autumn flush, total chlorophyll,
                                            chlorophyll a, chlorophyll b and carotenoid contents were recorded as higher in non-mined leaves (3.99, 1.41,
                                            2.2 and 0.28 mg/g FW) and lower in mined leaves (2.61, 0.87, 1.59 and 0.21 mg/g FW), respectively. Non-mined
                                            and mined leaves of spring and summer flushes were old while autumn flush leaves were young with low chlo-
                                            rophyll and carotenoid levels.

                                            Polyphenols and anti‑oxidant activities of non‑mined and mined leaves. Polyphenols and
                                            antioxidant activity of non-mined and mined leaves are presented in Table 11. Antioxidant activity {DPPH
                                            (1,1-diphenyle-1-2-picrylhydrazyle) inhibition} was recorded in non-mined leaves (27.66, 32.27 and 45.23 inhi-
                                            bition%) and in mined leaves (18.12, 18.07 and 32.40 inhibition%) respectively, in spring, summer and autumn
                                            flushes. Total phenolic contents were recorded in non-mined leaves (44.08, 68.08 and 41.73 mg of GAE/100 g)
                                            and in mined leaves (31.94, 56.01 and 28.17 mg of GAE/100gFW) in spring, summer and autumn flushes, respec-
                                            tively. Total flavonoid contents were recorded as maximum in non-mined leaves (16.97, 19.62 and 13.11 mg of
                                            quercetine equl/100 g FW) and minimum in mined leaves (10.74, 14.52 and 7.96 mg of quercetine equl/100 g
                                            FW) in spring, summer and autumn flushes, respectively. Similarly, total flavonols contents were found to be
                                            higher in non-mined (9.57, 10.71 and 8.24 mg of quercetine equl/100 g FW) and lower in mined leaves (5.85,
                                            7.97 and 5.79 mg of quercetine equl/100 g FW) respectively in spring, summer and autumn flushes.

                                            Physiological responses of non‑mined and mined leaves. Plant physiological activities of non-
                                            mined and mined leaves are presented in Table 12 and trend pattern in Fig. 5A,B. Physiological activity has
                                            shown a higher response in non-mined leaves than in mined leaves (10–60%) of damage levels. Maximum net
                                            assimilation rate (4.3 μmol C­ O2 ­m−2 ­s−1), stomatal conductance (58 mmol H­ 2O ­m−2 ­s−1), sub-stomatal conduct-
                                            ance (246.33 μmol ­mol−1) and water use efficiency (4.17 mmol CO2 m     ­ ol−1 ­H2O) were recorded in non-mined
                                            leaves. In contrast to other physiological activity, there was a lower rate of transpiration in non-mined leaves
                                            (1.03 mmol ­H2O ­m−2 ­s−1) than in mined leaves (10–60%) of damage.

          Scientific Reports |   (2021) 11:7720 |                      https://doi.org/10.1038/s41598-021-87160-8                                                                          10

Vol:.(1234567890)
www.nature.com/scientificreports/

                                                                                4.5                                                                 NML             ML
                                                                                 4                        a
                                                                                          b

                                          Chlorophyll & carotenoids (mg/g FW)
                                                                                3.5                                   c

                                                                                 3
                                                                                2.5           d               d
                                                                                                                          e                                                           a
                                                                                 2                                                             a                         a                        a
                                                                                                                                  b
                                                                                1.5                                                                         c
                                                                                                                                       d            d                                         d       d
                                                                                 1                                                                              e                                          a
                                                                                                                                                                                                               e      a           a
                                                                                                                                                                                                                          d           de
                                                                                0.5
                                                                                 0
                                                                                       SGD            TTS             VEH         SGD          TTS      VEH          SGD          TTS             VEH     SGD        TTS         VEH
                                                                                          Total Chlorophylls                           Chlorophyll a                          Chlorophyll b                      Carotenoids

                                                                                                                                   (A) Sites, chlorophyll & carotenoids
                                                                        6
                                                                                                                                                     NML            ML
                                 Chlorophyll & carotenoids (mg/g FW)

                                                                                  a               a
                                                                        5
                                                                                                                  b
                                                                        4
                                                                                      c
                                                                                                      c
                                                                        3                                             d
                                                                                                                                                                     de
                                                                                                                                                                                                  e
                                                                                                                              e            e                                      e
                                                                        2                                                                                                 e               f           f
                                                                                                                                  gh                    g
                                                                                                                                               gh
                                                                                                                                                            h
                                                                        1
                                                                                                                                                                                                           i j        i            i j
                                                                                                                                                                                                                           j
                                                                        0
                                                                                  Spring Summer Autumn Spring Summer Autumn Spring Summer Autumn Spring Summer Autumn
                                                                                      Total Chlorophylls                           Chlorophyll a                              Chlorophyll b                        Carotenoids

                                                                                                                      (B) Vegetative flushes , chlorophyll & carotenoids

                                     Figure 4.  Chlorophylls and carotenoid contents of non-mined and mined leaves (A) different environmental
                                     conditions (B) three vegetative flushes. Bars sharing dissimilar letters are significantly differed according to LSD
                                     test (P ≤ 0.05). FW = fresh weight.

                                                                                                                                       Spring flush                                   Summer flush                             Autumn flush
                                               Polyphenols and antioxidant activities                                                  NML                      ML                    NML                 ML                   NML             ML
                                               Anti-oxidant activities (DPPH inhibition
                                                                                                                                       27.66 ± 0.64c            18.12 ± 1.86d         32.27 ± 0.32b       18.07 ± 1.79d        45.23 ± 0.39a   32.40 ± 1.48b
                                               %)
                                               Total phenolic contents (mg of
                                                                                                                                       44.08 ± 0.93c            31.94 ± 1.99d         68.08 ± 2.18a       56.01 ± 0.60b        41.73 ± 0.25c   28.17 ± 1.23d
                                               GAE/100 g FW)
                                               Total flavonoid contents (mg of querce-
                                                                                                                                       16.97 ± 0.13ab           10.74 ± 0.1c          19.62 ± 0.36a       14.51 ± 0.13b        13.11 ± 0.15b    7.96 ± 0.12d
                                               tine/100 g FW)
                                               Total flavonols contents (mg of querce-
                                                                                                                                        9.57 ± 0.21ab            5.85 ± 0.22c         10.71 ± 0. 3a        7.99 ± 0. 25b        8.24 ± 0.25b    5.78 ± 0.2c
                                               tine/100 g FW)

                                     Table 11.  Antioxidant activity and polyphenols in non-mined leaves (NML) and mined leaves (ML) of three
                                     vegetative flushes. Results were reported in means (± SD). Means sharing dissimilar letters are significantly
                                     differed according to LSD test (P ≤ 0.05) for three flushes non-mined and mined leaves parameters.

                                     Photosynthetic activity of non‑mined and mined leaf at different age. Photosynthetic activities
                                     of non-mined and mined leaves are shown in Fig. 6A–C.
                                         Maximum photosynthetic activities such as net assimilation rate, stomatal and sub-stomatal conductance were
                                     recorded in non-mined leaves and minimum in mined leaves. Increased trends in carbon assimilation, stomata
                                     and sub-stomata conductance/intercellular ­CO2 concentration were observed in old leaves (1–5 months) and
                                     then slowed down and began to decline in both non-mined and mined leaves. Maximum carbon assimilation

Scientific Reports |   (2021) 11:7720 |                                                                       https://doi.org/10.1038/s41598-021-87160-8                                                                                                      11

                                                                                                                                                                                                                                                      Vol.:(0123456789)
www.nature.com/scientificreports/

                                                                                                         Different level of mined leaves damage %
                                              Physiological response                    NML              10% ML           20% ML             30%ML              40% ML           50% ML        60% ML
                                              Net assimilation rate
                                                                                           4.3 ± 0.26a    3.43 ± 0.21b        2.57 ± 0.06c     2.33 ± 0.15 cd     1.93 ± 0.31d 1.17 ± 0.06e     0.5 ± 0.10f.
                                              (μmol ­CO2 ­m−2 ­s−1)
                                              Stomatal conductance
                                                                                           58 ± 1.73a      39 ± 1.15b          31 ± 2.0c          22 ± 1.15d        19 ± 1.0de    15 ± 1.0e     13 ± 1.0e
                                              (mmol ­H2O ­m−2 ­s−1)
                                              Transpiration (mmol
                                                                                          1.03 ± 0.02e    1.11 ± 0.06d        1.31 ± 0.01c     1.49 ± 0.1bc       1.66 ± 0.02b 1.87 ± 0.01ab   2.08 ± 0.10a
                                              ­H2O ­m−2 ­s−1)
                                              Sub-stomatal conduct-
                                                                                        246.33 ± 11a     220.7 ± 10.2b    228.67 ± 3.51b     193.33 ± 11.24c    172.33 ± 8.5d    147 ± 5.29e   115 ± 7.0f.
                                                         ­ ol−1)
                                              ance (μmol m
                                              Water use efficiency
                                                                                          4.17 ± 0.20a    2.63 ± 0.17b        2.32 ± 0.08c     1.57 ± 0.22d       1.17 ± 0.18e 0.62 ± 0.03f.   0.24 ± 0.04 g
                                              (mmol ­CO2 ­mol−1 ­H2O)

                                            Table 12.  Physiological responses of non-mined and mined leaves. NML = Non-mined leaves and ML = Mined
                                            leaves (10%,20%,30%,40%,50% and 60% damaged leaves) Results were reported in means (± SD). Means
                                            sharing dissimilar letters are significantly differed according to LSD test (P ≤ 0.05) for non-mined and mined
                                            leaves different levels in Tables 8, 9 and 10.

                                               A                             5
                                                                         4.5
                                                                                                                  A               E             WUE
                                            WUE= ( mmol CO2 mol-1 H2O)

                                                                             4
                                              E= (mmol H2O m-2 s-1)
                                              A=(µmol CO2 m-2 s-1)

                                                                         3.5
                                                                             3
                                                                         2.5
                                                                             2
                                                                         1.5
                                                                             1
                                                                         0.5
                                                                             0
                                                                                  NML          ML 10%          ML 20%            ML30%         ML40%            ML50%           ML60%
                                                                                        Non-mined and mined leaves (10-60%) damage

                                                                      300
                                            B
                                                                      250                                                gs                  Ci
                                            gs =( mmol H2O m-2 s-1)
                                               Ci =( µmol mol-1)

                                                                      200

                                                                      150

                                                                      100

                                                                       50

                                                                         0
                                                                                 NML        ML 10%          ML 20%            ML30%          ML40%             ML50%        ML60%
                                                                                        Non-mined and mined leaves (10-60%) damage

                                            Figure 5.  (A) Net assimilation rate (A), transpiration (E) & water use efficiency (WUE)and (B) stomatal
                                            conductance (gs) & sub-stomatal conductance (Ci) of non-mined and mined (different % damaged level).

                                            (6.88 μmol ­CO2 ­m−2 ­s−1), stomatal conductance (59.33 mmol H­ 2O ­m−2 ­s−1) and sub-stomatal conductance
                                            (196.67 μmol ­mol−1) were observed in non-mined leaves of 5 months compared to mined leaves.

                                            Leaf age of non‑mined and mined leaves. The leaf-age of non-mined and mined leaves was shown in
                                            Table 13. In spring flush, non-mined leaf age was noted (292.67, 305, 320 days) and mined leaves (268.33, 276.33
                                            and 296.67 days), respectively, at Sargodha, TTS and Vehari. Non-mined leaves of summer flush were recorded
                                            (250, 265 and 260 days) and mined (215, 240 and 235 days) in Sargodha, TTS and Vehari, respectively. Similarly,

          Scientific Reports |   (2021) 11:7720 |                                      https://doi.org/10.1038/s41598-021-87160-8                                                                            12

Vol:.(1234567890)
www.nature.com/scientificreports/

                                              A
                                                                  8                                           NML            ML
                                                                  7
                                                                  6

                                              A=µmol CO2 m-2s-1
                                                                  5
                                                                  4
                                                                  3
                                                                  2
                                                                  1
                                                                  0
                                                                      1                 2           3            4        5                    6             7               8
                                                                                                              Leaf age (months)

                                      B
                                                             70                                                   NML            ML
                                                             60
                                    gs= mmol H2O m-2s-1

                                                             50

                                                             40

                                                             30

                                                             20

                                                             10

                                                                  0
                                                                      1                 2           3            4         5                   6                 7               8
                                                                                                           Leaf age (months)

                                   C
                                                          250                                                    NML            ML

                                                          200
                                 Ci= µmol mol-1

                                                          150

                                                          100

                                                             50

                                                                  0
                                                                      1              2              3           4        5                  6                7               8
                                                                                                             Leaf age (months)

                                  Figure 6.  Photosynthetic activity of non-mined and mined leaves in leaf-age1–8 months (A) net assimilation
                                  rate (An) (B) stomatal conductance (gs) (C) sub-stomatal conductance/intercellular ­CO2 concentration (Ci).

                                                                          Sargodha                            T.T Singh                            Vehari
                                                                          NML (days)        ML (days)         NML (days)     ML (days)             NML (days)        ML (days)
                                       Spring flush                       292.67 ± 8.9ab    268.33 ± 6.03c    305 ± 5.89a    276.33 ± 6.48bc       320 ± 5.89a       296.67 ± 6.01b
                                       Summer flush                       250 ± 5.89d       215 ± 4.65f.      265 ± 5.87c    240 ± 4.89de          260 ± 4.35c       235 ± 5.35e
                                       Autumn flush                       201.67 ± 5.41 g   170 ± 4.82i       195 ± 5.89 g   160 ± 4.74ij          185 ± 5.96 h      151.67 ± 3.67j
                                       LSD                                13.14             12.12             9.98           13.73                 9.99              9.11

                                  Table 13.  Leaf age of non-mined and mined leaves. Results were reported in means (± SD). Means sharing
                                  dissimilar letters are significantly differed according to LSD test (P ≤ 0.05) for both non-mined leaves (NML)
                                  and mined leaves (ML).

Scientific Reports |   (2021) 11:7720 |                                           https://doi.org/10.1038/s41598-021-87160-8                                                              13

                                                                                                                                                                                      Vol.:(0123456789)
www.nature.com/scientificreports/

                                            Figure 7.  Phenological growth trend of citrus (Kinnow mandarin).

                                            the autumn flush leaf-age of non-mined leaves were recorded (201.67, 195 and 185 days) and mined leaves (170,
                                            160 and 151.67 days) in Sargodha, TTS and Vehari, respectively. In all three flushes, the leaf-age of the mined
                                            leaves was significantly reduced and a further reduction was observed in warm conditions.

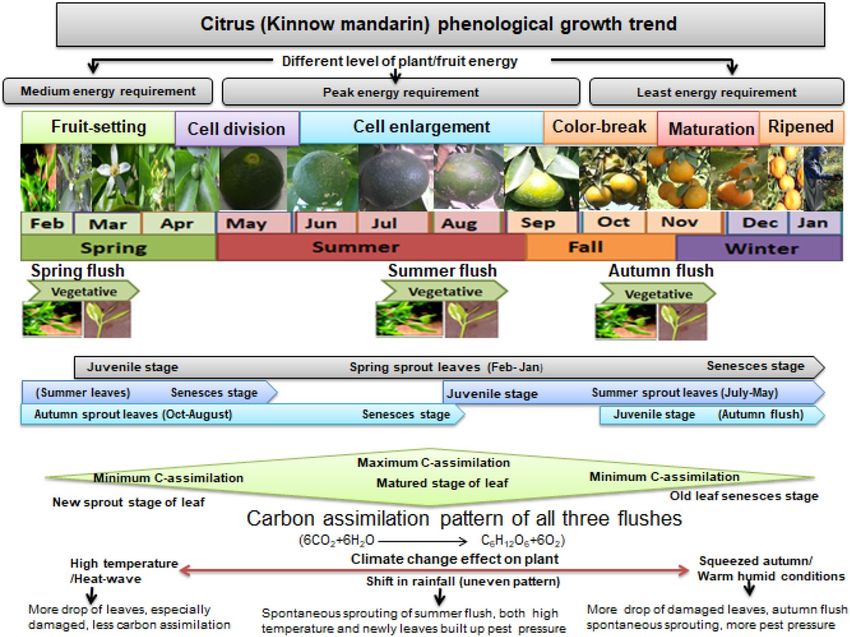
                                            Plant phenological growth trend in fluctuating weather conditions. Phenological growth trend is
                                            given in Fig. 7 and based on field based study.

                                            Discussions
                                            Agrometeorological/Thermal indices. Temperature was recorded more at Vehari and average relatively
                                            humidity (RHa) at ­Sargodha2, henceforth more DDs, PTI and HTU were available at Vehari. Similarly, in Sar-
                                            godha, DDs were counted less than in Vehari, but vice versa in the case of RHa; as a result, both districts had
                                            less HYTUs counts than TTS. Average relative humidity (RHa) was seen more at TTS than Vehari and mean
                                            daily temperatures were observed higher than Sargodha, henceforth more HYTUs were available at TTS on a
                                            monthly basis at different leafminer developmental stages. Bevington and Castle 32 reported that agrometeoro-
                                            logical indices were fluctuated location-wise due to climatic factors variation in changing seasons. Similar results
                                            for additional growing degree days (GDDs) of crops have been reported in warm r­ egions33,34. In the present
                                            work, mean daily temperature was recorded more at Vehari, followed by TTS and lower at Sargodha, therefore
                                            DDs were calculated by keeping different developmental stage threshold temperatures. The calculation of other
                                            agrometeorological indices were based on DDs and climate variables that also influenced the developmental
                                            stages of insect-pests35. Just as plant growth phases are directly linked to agrometrological indices, as in the case
                                            of citrus fruit growth ­phases44, the developmental stages of leafminer are also affected by climate ­variables38. DDs
                                            availability can determine the span of life cycle of leafminer and the number of generations all year ­round42. In
                                            addition, leafminer population pressure on citrus in a specific area is directly linked to the availability of agrome-
                                            teorological ­indices40 and emerging fl ­ ush25. More climate variations have been observed in citrus-growing three
                                            sites, and henceforth fluctuating agrometeorological indices have been c­ omputed31, while global warming has
                                            increased ­temperatures20 and biotic ­stress19. As a result, more DDs and other agrometeorological indices were
                                            available to leafminer at different developmental stages. More infestation was observed in TTS and Vehari in the
                                            present work to indicate that the leafminer egg to pupa stages took less time with more generations in a year.
                                            The developmental stages of leafminer (egg, larva and pupa) squeeze at high t­emperatures25,43. Nevertheless,
                                            different developmental process of leafminer ceases below threshold t­emperature42. Singh 51 also reports that
                                            leafminer has shown more growth and rapidly completed egg to pupa stage at high temperatures and prolongs
                                            developmental process in cool months while studying Kinnow and rough lemon plants. In current work, more
                                            DDs, PTI, HTU were computed in warm districts and summer months, so more pest infestation was observed

          Scientific Reports |   (2021) 11:7720 |                https://doi.org/10.1038/s41598-021-87160-8                                                    14

Vol:.(1234567890)
www.nature.com/scientificreports/

                                  in summer flush at TTS and Vehari. Pinto and Fucarino 36 and Santos et al. 37 report rapid developmental rates
                                  of different stages of leafminer (egg to pupa) in high photoperiod areas, while more HTU and PTI were avail-
                                  able in warm regions and summer months in the current work to demonstrate that rising temperatures not only
                                  increased DDs but also increased agrometeorological indices in changing climate scenarios. Weather conditions
                                  decide on the available monthly basis agrometeorological i­ndices45 to indicate the number of generations of
                                  leafminer throughout the ­year41 and the seasonal life cycle in a given ­area39,40. Fluctuating agrometeorological
                                  indices were computed in Kinnow growing three districts in climate change scenario, which has changed plant
                                  growth patterns in summer flush and also hastened the developmental process of leafminer as this work is justi-
                                  fied by population model of insect pests based on meteorological factors and availability of r­ esources38.

                                  Kinnow flushes and leaf miner damage. Newly sprouted leaves have thin epidermis and leafminer
                                  attacks are seen ­higher60. Similar results were observed in all three flushes in this study. In Kinnow mandarin,
                                  spring flush was counted 55–60%, followed by summer 25–30% and autumn 10–15%50 which justified current
                                  work on flushes. The highest oviposition rate of leafminer was recorded at 30 °C25 while similar temperatures
                                  were observed in the three districts during March. Relatively higher temperatures were recorded at Vehari and
                                  TTS during the last week of February to the end of March; more leafminer infestation was counted on newly
                                  sprouted spring flush leaves as this pest had overcome winter hibernation earlier. At high temperatures, more
                                  agrometeorological indices were available to leafminer and can quickly complete life cycle while squeezing the
                                  developmental stages (egg to pupa). Abo-Kaf et al. 61 report leafminer oviposition period 2.28 days at 30 °C
                                  which changes its duration in the changing temperature ­regime25. In current work, more agrometeorological
                                  indices were available to leafminer during the summer months, which produced overlapping generations. As
                                  a result, more larva mining was observed at TTS and Vehari, because in summer flush more growing degree
                                  days were accumulated to produce spontaneous vegetative growth. In autumn flush, less damage was seen due
                                  to low temperatures and no oviposition of the leafminer occurred at or below 15 °C25. Egg, larva and pupal
                                  developmental cycles were shortened with rising t­ emperatures25. In warm conditions and summer months, more
                                  agrometeorological indices were available, while leafminer accelerated the life cycle by producing overlapping
                                  generations. As a result, more infestation was recorded in warm districts of Vehari and TTS than in Sargodha.
                                  Similarly, less agrometeorological indices were available in Sargodha in autumn and spring flushes, therefore
                                  less pest infestation was observed. In addition, heavy rainfall also slowed the growth of leafminer in the summer
                                  months, and more rainfall was reported in Sargodha, resulting in less infestation in the summer flush.

                                  Monthly sprouting and leaf miner larva entrance. Due to the winter hibernation of the leafminer, less
                                  infested leaves were reported on a monthly basis in February, but a sudden rise in temperature during March
                                  coincided with heavy spring flush, resulting in higher damage in all three districts as the optimal oviposition
                                  temperature ­available25. More agrometeorological indices were available in the warm districts of TTS and Vehari,
                                  with an increase in the pest population due to the rapid rate of developmental stages resulting in more infesta-
                                  tions. High temperature in July to October optimized conditions for leafminer by recording more infestation in
                                  warm districts due to additional accretion of DDs, PTI and HTU. In the same way, the increase in the growing
                                  degree days (GDDs) in warm months led to spontaneous slow vegetative growth. As a result, newly sprouted
                                  leaves ensnared adult female for oviposition and hastily completed egg-hatching stage with more first instar larva
                                  population to feed tender young leaves. No vegetative growth occurred in the months of January, April, May,
                                  June and December, and henceforth no infestation was seen on mature leaves as the female preferred young
                                  leaves to lay ­eggs62. These findings are substantiated by the work ­of63 who reported that the peak mining period
                                  was February–March and July–October. Rainfall in Sargodha was higher than TTS and Vehari during the spring,
                                  summer and winter periods and has adverse effects on leafminer. Similar adverse effects of rainfall on the devel-
                                  opmental stages of leafminers are observed during monsoon in ­Bangladesh64 justifying this study.

                                  Leaf size entrance by larva after egg‑hatching. Mostly, the leafminer prefers young and tender l­ eaves8
                                  of a size (10–25 mm long) for ­oviposition62. The first instar larva hatched from the eggs immediately feeds on
                                  tender epidermis tissues and begins to mine zigzag in newly sprouted ­leaves10 while the first instar larva to the
                                  pupal stage continues to mine leaves to feed on spongy parenchymatous ­cells60. Maximum 60–63 percent of the
                                  larva entry was seen on a leaf size of up to 1 c­ m2, while 30 percent larva mining in the leaf size (1–2 c­ m2) was
                                  observed symmetrically in three districts. The larva making leaf size (2–3 ­cm2) mine was recorded to be the low-
                                  est in all districts (4–8%). Leaf size larger than 3 c­ m2 reached hardness for the entry of larvae or mine formation,
                                  suggesting that the small leaves (1–5 days) were more infested than the larger leaves. Leaf aged 11–15 days is
                                  resistant to entry/mining of larvae and leafminer population pressure on citrus is influenced by the availability
                                  of young leaves and weather f­ actors51. Similar trends in newly emerging leaves have been observed in the present
                                  work, indicating that the larva preferred young, tender and emerging sprouts of all three flushes. Vercher et al. 65
                                  also observed that the first instar larva feeds on young leaves (10–20 mm long) justifying extra attacks on small
                                  leaves in the present work.

                                  Leaf sclerophylly for leaf miner larva feeding after entrance. Female leafminer tends to lay eggs
                                  on emerging tender ­leaves62 and larvae enter epidermis soft ­tissues10 and make zigzags to feed on parenchy-
                                  mal spongy ­cells60. Among citrus leaf sclerophylly parameters, succulence determines leaf ­tenderness50. Citrus
                                                                                                                                ­ 2O ­cm−2) which
                                  leafminer feeds on tender tissues of young leaves and prefers succulence value above 0.02 (mg H
                                  was recorded in spring and summer flushes up to 40 days of age. Succulence greater than 0.02 (mg ­H2O ­cm−2)
                                  was recorded in the autumn flush for up to 60 days. The leaf succulence in Kinnow mandarin allowed the larva
                                  to feed on the tissues for up to 40 days in spring and summer, while for 60 days in autumn. It suggested that

Scientific Reports |   (2021) 11:7720 |                https://doi.org/10.1038/s41598-021-87160-8                                                    15

                                                                                                                                                 Vol.:(0123456789)
You can also read