High Temperature Equal Channel Angular Pressing of a T6 Al Cu Li Mg Ag Zr Sc Alloy - MDPI
←
→
Page content transcription
If your browser does not render page correctly, please read the page content below
Article

High‐Temperature Equal‐Channel Angular Pressing of a
T6‐Al‐Cu‐Li‐Mg‐Ag‐Zr‐Sc Alloy
Marcello Cabibbo and Chiara Paoletti *

                                         Department of Mechanical Engineering and Mathematical Sciences (DIISM), Università Politecnica delle
                                         Marche, Via Brecce Bianche 12, 60131 Ancona, Italy; m.cabibbo@staff.univpm.it
                                         * Correspondence: c.paoletti@pm.univpm.it

                                         Abstract: Equal‐channel angular pressing (ECAP) is known to induce significant grain refinement
                                         and formation of tangled dislocations within the grains. These are induced to evolve to form
                                         low‐angle boundaries (i.e., cell boundaries) and eventually high‐angle boundaries (i.e., grain
                                         boundaries). On the other hand, the precipitation sequence of age hardening aluminum alloys can
                                         be significantly affected by pre‐straining and severe plastic deformation. Thus, ECAP is expected to
                                         influence the T6 response of aluminum alloys. In this study, a complex Al‐Cu‐Mg‐Li‐Ag‐Zr‐Sc al‐
                                         loy was subjected to ECAP following different straining paths. The alloy was ECAP at 460 K via
                                         route A, C, and by forward‐backward route A (FB‐route A) up to four passes. That is, ECAP was
                                         carried out imposing billet rotation between passes (route A), billet rotation by +90° between passes
                                         (route C), and billet rotation by +90° and inversion upside down between passes (FB‐route A). The
                                         alloy was also aged at 460 K for different durations after ECAP. TEM microstructure inspections
                                         showed a marked influence of the different shearing deformations induced by ECAP on the alloy
                                         aging response. The precipitation kinetics of the different hardening secondary phases were af‐
                                         fected by shearing deformation and tangled dislocations. In particular, the T1‐Al2CuLi phase was
                                         the one that mostly showed a precipitation sequence speed up induced by the tangled dislocations
                                         formed during ECAP. The T1 phase was found to grow with aging time according to the
                                         Lifshitz‐Slyozov‐Wagner low‐power regime.

Citation: Cabibbo, M.; Paoletti, C.
                                         Keywords: ECAP; Al‐Cu‐Mg‐Li‐Ag‐Zr‐Sc alloy; secondary‐phase precipitates; tangled disloca‐
High‐Temperature Equal‐Channel
                                         tions; alloy aging; transmission electron microscopy
Angular Pressing of a
T6‐Al‐Cu‐Li‐Mg‐Ag‐Zr‐Sc Alloy. J.
Manuf. Mater. Process. 2021, 5, 6.
https://doi.org/10.3390/jmmp5010006
                                         1. Introduction
Received: 8 December 2020                      Al‐Cu and Al‐Cu‐Mg alloys are widely used in the aircraft industry due to their
Accepted: 31 December 2020               excellent mechanical properties, which depend on the fine dispersion of secondary phase
Published: 5 January 2021
                                         strengthening precipitates [1–4].
                                               Al‐Cu‐Li based alloys are recognized as important metallic materials for structural
Publisher’s Note: MDPI stays neu‐
                                         applications requiring a combination of high strength, low density, high fracture tough‐
tral with regard to jurisdictional
                                         ness, and good corrosion resistance [3,5–8]. All these mechanical and physical character‐
claims in published maps and insti‐
tutional affiliations.
                                         istics are particularly relevant for aerospace applications [5–7]. Moreover, weight reduc‐
                                         tion is now widely considered as a primary means to lower fuel cost in the aeronautics
                                         and aerospace industry [7]. A reduction in aircraft weight reduces fuel consumption,
                                         thus increasing the payload capability [3]. Accordingly, lithium, as the lightest metal
Copyright: © 2021 by the authors.        known, was used as an additional element in a number of aluminum series alloys. An
Licensee MDPI, Basel, Switzerland.       addition of 1 wt.% Li reduces the Al density by 3%, and usually increases the alloy elastic
This article is an open access article   modulus by some 6% [9].
distributed under the terms and                Thus, starting from the first generations of Al‐Li alloys, developed in the 1980s, the
conditions of the Creative Commons       current alloy developments concern low Li contents balanced by addition of other ele‐
Attribution (CC BY) license              ments such Mg, Mn, Zr, Ca, Ag, RE, and so forth. These alloying modifications greatly
(http://creativecommons.org/licenses     helped to improve some of the weak points of the Al‐Li alloys, such as the limited
/by/4.0/).

J. Manuf. Mater. Process. 2021, 5, 6. https://doi.org/10.3390/jmmp5010006                                             www.mdpi.com/journal/jmmp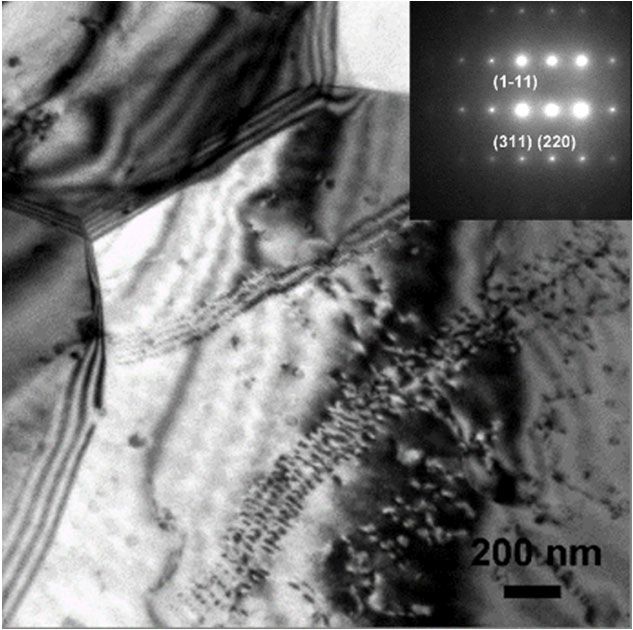
J. Manuf. Mater. Process. 2021, 5, 6 2 of 26
long‐term stability [10,11]. In the last three decades, scientific research on Al‐Li‐based
alloys mostly focused on Al‐Cu‐Li, Al‐Cu‐Mg, and Al‐Mg‐Li alloys [12,13].
In fact, the mechanical properties, together with most of the physical properties of
Al‐Cu‐Li alloys are driven by the fine scale distribution of precipitate phases. These are
favored to form by solutioning followed by aging at different temperatures and duration,
depending on the specific alloying elements added to the Al‐Cu‐Li base alloy. In the base
Al‐Cu‐Li system, the two secondary phase precipitates that are induced to form belong to
the binary Al‐Cu and Al‐Li, and ternary Al‐Cu‐Li systems. Thus, the precipitating phases
are GP‐I, GP‐II zones, θ″, θ′ phase, to end at the stable θ (Al2Cu), and with a similar
formation process of the ó′ to ó (Al3Li) and T1 (Al2CuLi) phases [14–19].
Addition of other alloying elements (especially Mg, Mn, Ag, Zn, Zr) results in a
wider variety of precipitating secondary phases. As for the role of Ag, in the complex
Al‐Cu‐Li‐X alloy, it was widely documented that it tends to segregate in the T1‐Al2CuLi
phase and in the S′‐Al2CuMg phase, thus contributing to their microstructure strength‐
ening effects [20].
Together with the above‐mentioned strengthening fine‐dispersed precipitation
phases, the lithium‐containing aluminum alloys are engineered in terms of ductility. In
this respect, the refining processes of both grains and cells are important microstructure
features for improving the alloy mechanical properties. Hence, alloying elements, heat
treatments and plastic deformation are the three major means to tailoring a sound and
technologically interesting Li‐bearing complex aluminum alloy [21–23].
The AA2198 (Al‐Cu‐Li‐Mg‐Ag‐Zr), and similar alloys, sometimes referred to as
Weldalite® alloys [24], are known to be characterized by the formation of all the
above‐mentioned secondary phases that are induced to precipitate under annealing and
peak ageing.
In particular, the θ (Al2Cu) phase is tetragonal with lattice parameters a = 4.04, and c
= 5.80 Å, and a disc‐like or platelet morphology typically oriented along Al100 crystallo‐
graphic plane, which is similar to a [001]‐precipitate plane Al100 matrix [25,26]. The ef‐
fective hardening compound is the GP‐II/θ′ phase, which is essentially a semi‐coherent
precipitate. This forms by vacancy releasing and GP‐I agglomerate formation via Cu
atoms short‐range diffusion [27,28]. This is the alloy‐strengthening phase for Al‐Cu bi‐
nary alloys.
On the other hand, by adding Li to the alloy, nucleation of the T1 phase constitutes
the highest nanometric scale alloy‐strengthening feature. This phase has a hexagonal
(hcp) structure with lattice parameters a = 4.97, and c = 9.35 Å, and plate‐like morphology
with large aspect ratio of which the longer edge (needle) lying on [111]Al planes and ori‐
entation relationship (0001)‐T1 (100)Al. In particular, this phase shows its maximum
strengthening effect when the needle‐shaped edge of the precipitates lye as to have
(0001)T1 habit planes (111)Al, and a [10,11]T1 Al110 matrix plane. The T1 phase has a space
group P6/mmm [29] and it has been shown to be shearable by dislocations introduced
during plastic deformation techniques [29–31]. In particular, the precipitate shearable
planes are as to have [10,11]T1 [110]Al planes, i.e., a [10,11]T1 crystallographic direction.
When Mg and Ag are added to the Al‐Li based alloys, these are known to easily cluster
within grain and cell interiors eventually accelerating the nucleation of the T1 phase upon
aging [29‐31].
Moreover, a number of research findings showed that the generation of the hard‐
ening T1 phase is promoted by the addition of minor solute elements, such Mg and Ag
[32–35]. Although Ag addition alone does not harden the alloy to a great extent, the effect
of Mg + Ag gives a synergic effect in the alloy [35,36]. In general, Mg and (Mg + Ag) ad‐
dition promotes the precipitation of the T1 phase at the expense of the θ″ and θ′ precipi‐
tates [21,28,30,32]. The typical size and distribution of the T1 phase was shown to be
generally finer and finely dispersed than the θ″ and θ′ precipitates [35–38].
On the other hand, it was shown that by Mg addition, precursor Mg‐Cu phases are
formed along with tangled and/or free dislocations [32]. This process actually starts very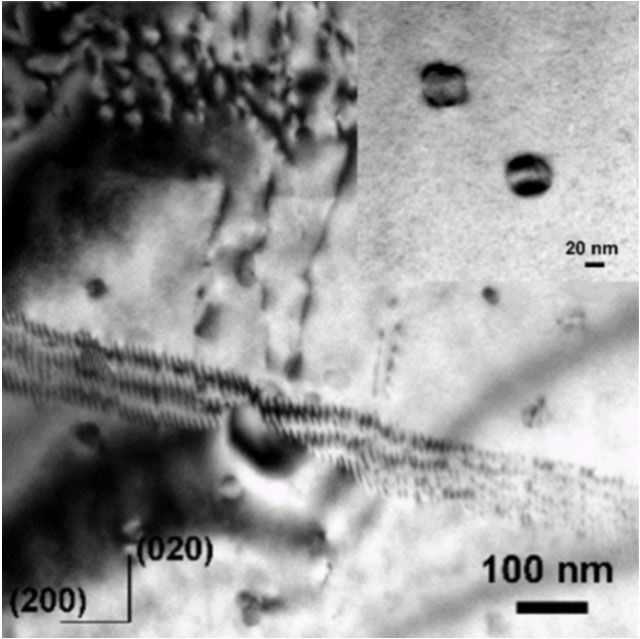
J. Manuf. Mater. Process. 2021, 5, 6 3 of 26
early upon aging, and further develops to GP zones and then an S′ phase together with a
high density of T1 precipitates. These two phases usually dominate the microstructure of
the T6 tempered Al‐Cu‐Li‐Mg‐X alloys. A threshold Mg content of ~0.1 at.% was found to
be necessary to activate the combined precipitation of both S′and T1 phases [32]. The ad‐
dition of Ag was found not to change significantly the precipitate sequence upon T6
tempering.
Precipitation of ordered δ′ and δ precipitate phases generally occurs at the earliest
stages of age hardening. These are fcc spherical or lenticular shaped precipitates, oriented
to have the (111)δ (111)Al planes [15,16,27]. It is worth to mention that, according to Duan
et al. [39], the lenticular δ′ precipitates generally start forming after and grow at the ex‐
pense of the θ′ precipitates, thus preventing and inhibiting the side lateral growth of
these latter precipitates.
The S′/S phase is orthorhombic with crystallographic parameters of a = 4.0 Å, b = 4.6
Å, c = 7.1 Å, Pmm2 space group symmetry, and a typical lath‐ or rod‐like morphology.
This phase has a lath habit plane (100)S (100)Al matrix, and a crystallographic relation‐
ship of [001]S′ [210]Al [40]. This phase was debated to change in stoichiometric composi‐
tion when it reaches the stable and coarser form of S, possibly being (Al5Cu2Mg2) or
(Al13Cu7Mg8) ([37] and references therein).
Recently, Decreus et al. [17] studied the effect of the Cu/Li ratio on the precipitation
sequence of Al‐Cu‐Mg‐Li–X alloys. They found that at the earlier stages of aging, the
microstructure was dominated by Cu‐rich clusters, when Li addition is low, and by the δ
phase, as Li increases in the alloy composition. Yet, the peak‐aging microstructure was
characterized by a large number fraction of the T1 phase.
In fact, the three major phases usually formed in aged Al‐Cu‐Mg‐Li‐X alloys are θ, δ,
and T1 [39]. The Ω phase is reported to form when Ag is added to quaternary
Al‐Cu‐Mg‐X alloys, whose exact chemical composition, habit planes, and crystallo‐
graphic symmetry strongly depend on the amount of the added elements and the nature
of the elements added in the Al‐Cu‐Mg‐based alloy [41–43].
On the other hand, the addition of scandium to aluminum alloys, and specifically to
AA2000 series, is known to effectively pin cell and grain boundaries under plastic de‐
formations and recrystallization processes [44–51]. In fact, scandium is generally added
to promote the formation of thermally stable nanometric Al3Sc dispersoids, which effec‐
tively act as grain recrystallization inhibitors with a cell/grain boundary pinning effect. It
is known that scandium addition to aluminum alloys, during solidification processes,
forms fine precipitates of the type Al3Sc, whose typical size is well within 100 nm [52].
These are generally called dispersoids, as they precipitate at the grain boundary. In gen‐
eral, following post‐solidification processes, such as homogenization, hot rolling, cold
rolling, and solution heat treatment, a large fraction of Al3Sc particles dissolve into the Al
matrix, except for some retained fraction. For instance, solution treatment, followed by
artificial aging, can favor re‐precipitation of very fine Al3Sc particles. There main ad‐
vantages in adding Sc to Al‐alloys, especially the age‐hardenable alloy series, is to
strongly contribute to strengthen the alloy during casting or welding processes, and to
promote the resistance to recrystallization and enhanced superplastic properties, through
the presence of the fine Al3Sc dispersoids. In fact, Al3Sc exerts a significant and effective
pinning action, i.e., a Zener‐drag effect, chiefly at the grain boundaries. The Al3Sc dis‐
persoids have an fcc L12‐type phase structure mainly coherent with the aluminum ma‐
trix. The pinning action is responsible for an extremely high effectiveness of reducing
alloy recrystallization. In particular, during all the rolling processes, also including se‐
vere plastic deformation such as Equal‐Channel Angular Pressing (ECAP), the presence
of the Al3Sc dispersoids affects the way in which the rolling and extrusion processes in‐
teract with the aluminum matrix.
According to the here reported complex precipitation sequences and second‐
ary‐phase precipitation variety, it is considered of primary importance the identification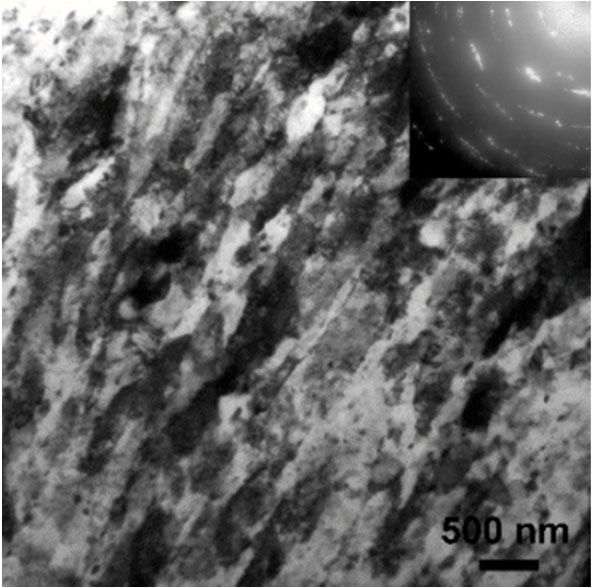
J. Manuf. Mater. Process. 2021, 5, 6                                                                                             4 of 26

                                       of the existing differences between the precipitates, and to determine their specific alloy
                                       hardening contributions.
                                             On the other hand, it is well known that pre‐strain, or even plastic deformation
                                       techniques applied before or after annealing and aging to peak hardness is able to influ‐
                                       ence the whole secondary‐phase precipitation sequences in aluminum alloys [53–58]. In
                                       this respect, severe plastic deformation techniques applied to aluminum alloys was re‐
                                       ported to significantly modify the alloy response to T6 temper. Thus, more specifically,
                                       due to the variety of hardening phases induced by the T6 treatments in Al‐Cu‐Mg‐Li‐X
                                       alloys, severe plastic deformation (SPD) are likely to significantly change the precipita‐
                                       tion kinetics of most, if not all, the secondary phases [14,59]. Among the different SPD
                                       techniques, the equal‐channel angular pressing (ECAP) is surely one of the most im‐
                                       portant cost‐effective techniques [58,60–64]. During ECAP, the material is forced to plas‐
                                       tically deform by shearing at the intersection of the angular channels. The sample retains
                                       the same cross‐sectional area after pressing, so that it is possible to repeat the pressing
                                       several times.
                                             In this respect, previous works by one of these authors showed that the different
                                       strain paths to which tempered aluminum alloys can be subjected by ECAP are able to
                                       effectively influence the secondary‐phase precipitates volume fraction [65,66]. Indeed,
                                       this did not induce a marked deterioration of other important properties such as corro‐
                                       sion resistance, as reported by Vicerè et al. [67,68]. In ECAP, samples are usually in form
                                       of cylindrical or square‐section rod billets that are continuously forced to follow a linear
                                       path into a L‐shaped equal‐channel [69–78]. Strain paths in ECAP correspond to different
                                       processing routes [70,71]. Among these, here, routes A and route C were taken into con‐
                                       sideration. Route A involves no specimen rotation between consecutive ECAP passes,
                                       while in route C, the billet is continuously rotated by 180° between passes. In addition, an
                                       evolution of the ECAP process included a further different pathway, consisting of re‐
                                       versing the billet path direction between consecutive passes. This is called a for‐
                                       ward‐backward ECAP (FB‐ECAP) process [79–81]. In particular, a forward‐backward
                                       cycling shear deformation by ECAP, or similar techniques, was shown to induce ul‐
                                       trafine‐grained aluminum alloys in a more effective way [80,81]. This would mean that
                                       the shear deformation path in FB‐ECAP is potentially able to refine the aluminum mi‐
                                       crostructure already by few passages into the die. It is, thus, expected that the recombi‐
                                       nation of tangled dislocations to form cell boundaries, and in turn, the cell boundary
                                       evolution to grain boundary, is likely to be faster in FB‐ECAP with respect to conven‐
                                       tional ECAP shear paths.
                                             In the present work, an Sc‐added Al‐Cu‐Li‐Mg‐Ag‐Zr alloy was subjected to ECAP
                                       with different strain paths (i.e., routes and modes). More specifically, billets were pro‐
                                       cessed up to four passes by route A, C, and FB‐ECAP route A. These two routes and dif‐
                                       ferent processing modes introduced tangle dislocations (TDs), cell (low‐angle bounda‐
                                       ries, LABs), and grain (high‐angle boundaries, HABs) at different crystallographic
                                       planes. It was, thus, possible to determine the role of the specific shear strains to which
                                       the alloy was subjected on the precipitation kinetics of the alloy hardening second‐
                                       ary‐phase precipitates.

                                       2. Experimental Details and Methods
                                             The chemical composition of the alloy object of the present study is reported in Table
                                       1; this is an Sc‐modified Weldalite® ‐type alloy.

                                       Table 1. Chemical composition (wt.%) of the studied Sc‐modified Weldalite®‐type alloy.

                                            wt.%          Cu       Li        Mg           Ag            Zr          Sc          Al
                                                          5.4      1.3       0.40         0.40         0.20        0.50         bal.
                                          ECAP samples were prepared as cylindrical billets of 9.8 mm in diameter and 100
                                       mm long by machining from extruded bars. The billets were then solution‐treated in an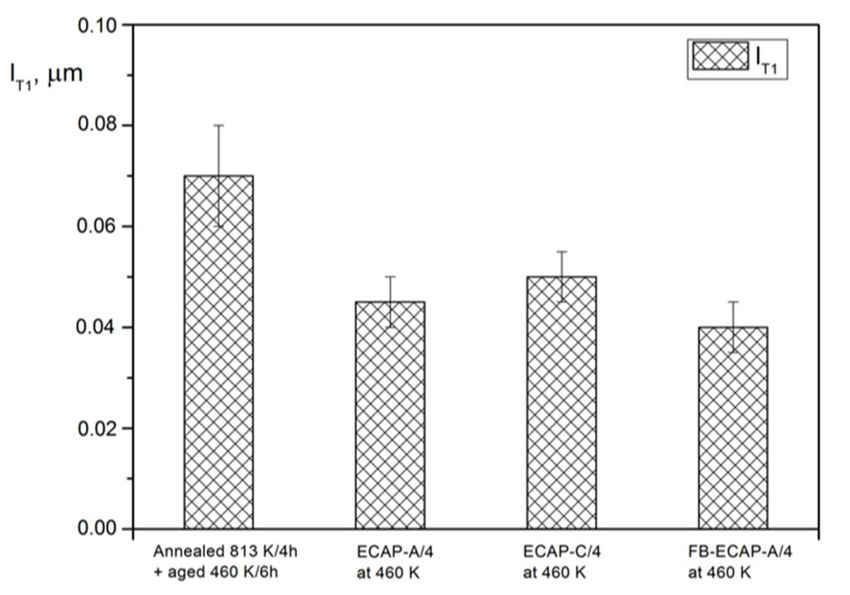
J. Manuf. Mater. Process. 2021, 5, 6 5 of 26
air standard convection furnace at 815 K for 4 h, followed by water quenching. To de‐
termine the aging hardness peak, the alloy was aged at 460 K for duration ranging from
10 to 2880 min (10 min to 2 days).
ECAP was performed on annealed billet at the same aging temperatures of 460 K.
An open die, consisting of a block of SK3 tool steel (Fe‐1.1 %C) and fastened with steel
bolts, was used. ECAP was carried out under uniaxial pressing forces ranged between
40–80 kN and a pressing speed of 100 mm/min. The ECAP L‐shaped channel had a cir‐
cular cross‐section diameter of 10 mm, consisting of two linear parts intersecting at an
angle = 90° with a curvature extending over an angle = 20°. Based on this
two‐channels geometry, a cumulative shear strain εeq = 1.08 was imposed to the billet at
each pass [62,70,76]. Microstructure inspections and microhardness tests were performed
along the ECAP y‐plane by cutting slices of the billet as to make measurements at the
center zone of the billet. This plane is the one containing the extruded and the plastic
shear directions, as depicted in Figure 1. ECAP route A does not involve any billet rota‐
tion between passes, route C consists of rotating the billet by +90° at each consecutive
passage into the die, and the variant forward‐backward consists of inverting the billet
head at each ECAP pass during route C. Microstructure inspections were carried out af‐
ter ECAP‐A/4, ECAP‐C/4, and FB‐ECAP‐A/4. Inspections were carried out both after
ECAP and after ECAP followed by aging at 460 K. In this latter case, the inspections were
carried out at the T6 alloy metallurgical state, and at the annealing time to reach the
hardness peak after, respectively, ECAP‐A/4, ECAP‐C/4, and FB‐ECAP‐A/4.
(a) (b)
Figure 1. (a) Characteristic deformation directions in the Equal‐Channel Angular Pressed (ECAP)
billet. The Y‐plane contains the shear deformation bands induced by ECAP and it is the one se‐
lected for TEM inspections. ECAP direction is along the billet X direction; (b) scheme of the acti‐
vated shear planes in routes: A, FB‐A, C.
Transmission electron microscopy (TEM) samples were ground and polished to ~150
μm, punched into discs of 3 mm diameter, and then electropolished by a GatanTM
Tenupol‐5® (Struers, Westlake, OH, USA) working at 12 V and using a solution of 1/3 ni‐
tric acid in methanol at T = −35° C.
TEM discs were examined in a PhilipsTM CM20® (Philips electron Microscopy sec‐
tion, now FEI, Hillsboro, OR, USA) operated at 200 kV, using a double‐tilt specimen
holder equipped with a liquid nitrogen cooling stage. Secondary‐phase precipitates were
identified by using selected area electron diffraction (SAED). Thin foil thickness, t, was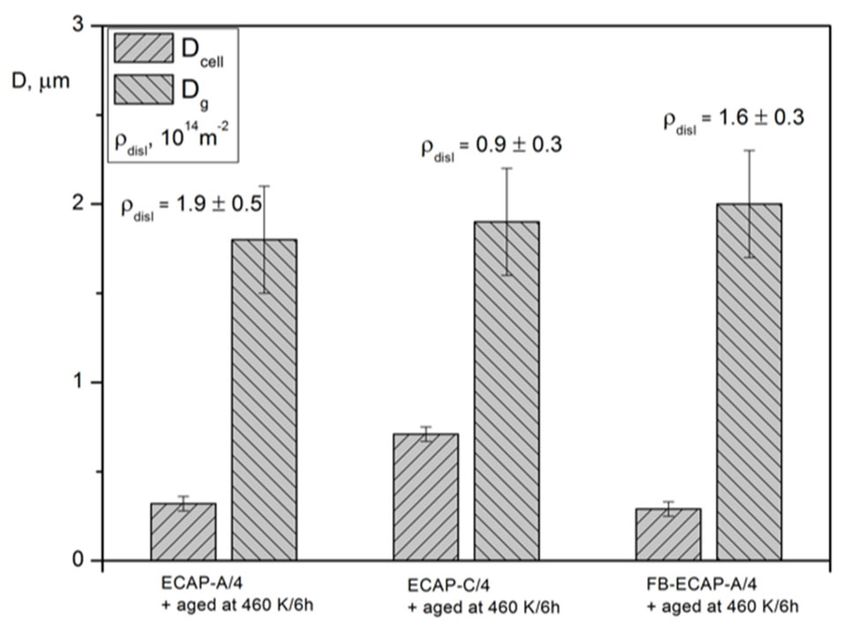
J. Manuf. Mater. Process. 2021, 5, 6 6 of 26
measured on TEM by diffracted beam intensity variation under dual beam conditions,
using converged electron beam diffraction (CBED) patterns. This way, by plotting the
linear interpolation of data points in a Sf2/nfringes2 vs. nfringes−2 graph, where Sf is the fringe
spacing, and nfringes the number of counted fringes, tTEM−2 was determined at y‐axis line
intercept. The error due to the invisible dislocations (i.e., the ones oriented as to have bg =
0, where b is the Burgers vector and g refers to the crystallographic dislocation plane) is
within the experimental error of the foil thickness evaluation.
Tangled dislocation (TD) density, TD, was calculated through the count of intercep‐
tion points between the mesh and the existing dislocations, ndisl, in the TEM micrographs.
This was evaluated by TD = 2ndisl/(lmeshtTEM), where lmesh is the total length of the mesh and
tTEM is the thickness of the TEM foil. Cell (low‐angle boundary, LAB) and grain boundary
(high‐angle boundary, HAB) misorientation were measured by Kikuchi band patterns.
The misorientation angle measurement procedure by Kikuchi pattern on TEM is fully
described elsewhere in a previous published work by this author [75,76,82,83]. TEM
quantitative analyses of secondary phase precipitates were carried out on crystallo‐
graphic Al002, Al111, and Al210 planes, depending on the habit plane of the different existing
phase; tangled dislocation density was measured along the crystallographic Al002 planes.
All the statistical evaluations were carried out according to conventional stereology
methods [82] with the help of Image pro‐plus® (Media Cybernetics, Inc., Rockville, MD,
USA) analysis software.
Polarized optical microscopy was carried out by surface polishing and elec‐
tro‐chemical etching at room temperature using a solution of 4% HBF4 in methanol at 20
V for few seconds.
A RemetTM HX‐1000® (Remet S.A.S., Casalecchio di Reno, BO, ITALY) microhard‐
ness tester was used to carry out at least 12 measurements per each experimental condi‐
tion. To determine the curve peak, hardness was measured on the ECAP y‐plane surfaces
after ECAP‐A/4, ECAP‐C/4, and FB‐ECAP‐A/4, and post‐ECAP aging at 460 K for times
ranging from 10 to 2880 min (2 days).
3. Results
3.1. T6 Temper Microstructure
The T6‐hardening treatment consisted of annealing at 813 K/4 h, water quenching,
and aging at 460 K for time, t, of 10, 20, 30, 60, and 90 min, 2, 4, 6, 8, 10, and 16 h, and 1
and 2 days. Figure 2a shows the T6 hardness, H, vs. aging time. It resulted a marked
hardness peak at 460 K/6 h. This T6‐peak condition corresponded to the formation of
different nanometric precipitates, such GP zones, T1‐(Al2CuLi), δ′‐(Al3Li), and
θ″/θ′‐(Al2Cu) precipitates. Boundary pinning β‐(Al3Zr) dispersoids also characterized the
T6 alloy microstructure. These hardening secondary‐phase precipitates were observed by
TEM inspections and Figure 2b,c shows representative bright‐filed (BF)‐TEM micro‐
graphs; in particular, Figure 2b,c are TEM micrographs showing the Al111 and Al002
planes, respectively. On the Al002 plane (Figure 2b), GP zones, a nanometric θ′ disc, and δ′
spherical precipitates were found within the grains. Grain boundaries were decorated
with larger rounded β′‐Al3(Zr,Sc) dispersoids. On the Al210 plane (Figure 2d), GP zones
and a few θ′ disc precipitates were detected.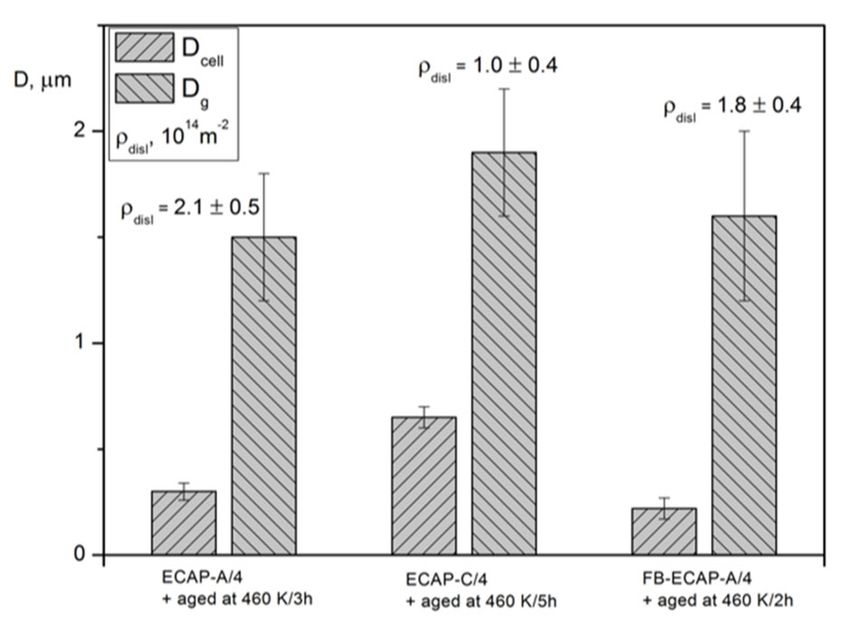
J. Manuf. Mater. Process. 2021, 5, 6                                                                                              7 of 26

                                   (a)                                    (b)                               (c)

                                             (d)                                                   (e)
      Figure 2. Hardness, H, vs. aging time, t, of the alloy annealing at 813 K/4 h and aging at 460 K, (a), BF‐TEM showing the
      microstructure at T6 hardness peak condition (aging at 460 K/6 h), [002]Al, (b), [111]Al, (c), and [210]Al, (d). Polarized op‐
      tical micrograph showing the alloy T6 grained structure, (e).

                                               T6 treatment showed a significant mean grain size reduction, from the as‐received
                                         Dg = 36 ± 3 μm, down to Dg = 24 ± 2 μm, with an aspect ratio of 0.94. Correspondingly,
                                         equiaxed grained structure was also induced to form (Figure 2e). It resulted that under
                                         annealing at 813 K/4 h, alloy grain size reduced by almost 30%. This is essentially due to
                                         the presence of the Sc‐ and Zr‐dispersoids that effectively pinned the grain boundary
                                         coarsening tendency during annealing. In fact, it is well known that Sc and Zr form
                                         thermally stable β′‐Al3(Sc,Zr) spherical dispersoids that effectively pin the grain and cell
                                         boundaries [44,45,82–86]. In particular, in [83], it was reported that Sc diffusion becomes
                                         significant from 523 K, and that the Al3(Sc1−x,Zrx) dispersoid particles formation is con‐
                                         trolled by Sc diffusion below 623 K, where Zr diffusion becomes effective. Then, at the
                                         annealing temperature of 813 K Al3(Sc1−x,Zrx), dispersoids are formed and they remain
                                         stable upon further aging. The effectiveness of the grain, cell boundary, and dislocation
                                         pinning effect exerted by the nanometric size Al3(Sc1−x,Zrx) dispersoids not only comes
                                         from their stability at the aging temperatures, but also originates from their crystallo‐
                                         graphic coherency with the Al‐matrix. This latter aspect is documented in Figure 3,
                                         where the Ashby‐Brown strain contrast characterizes the shown β‐Al3(Sc1−x,Zrx) disper‐
                                         soids.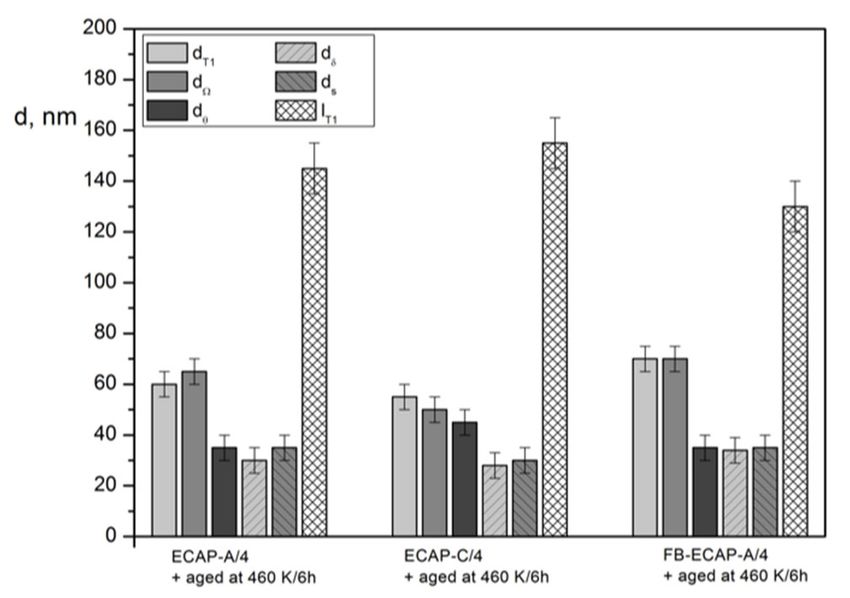
J. Manuf. Mater. Process. 2021, 5, 6                                                                                               8 of 26

                                         Figure 3. Al3(Sc1−x,Zrx) dispersoids showing Ashby‐Brown strain contrast in the alloy tempered at
                                         813 K/4 h + aging at 460 K/6 h. Inset is a detail of two β′ dispersoids (dark rounded particles)
                                         showing an Ashby‐Brown contrast.

                                         3.2. Microstructure after ECAP
                                               ECAP was carried out at 460 K by three different routes: route A (no rotation be‐
                                         tween passes), route C (180° rotation between passes), and forward‐backward pressing
                                         (FB‐ECAP) following route A. In all the three modes, the billets were pressed four times
                                         into the ECAP die (respectively, ECAP‐A/4, ECAP‐C/4, and FB‐ECAP‐A/4). The alloy
                                         was ECAP after annealing at 813 K/4 h and water quenching to room temperature. The
                                         main purpose for comparing the three SPD ECAP shearing modes was to correlate the
                                         specific shear path and deformation to the induced different Al‐Cu‐Li‐Mg‐Ag‐Zr‐Sc alloy
                                         secondary‐phase precipitates evolution. In fact, it is well‐known that during ECAP, the
                                         alloy is subjected to a thermo‐mechanical stress in terms of both shear bands that run at a
                                         typical angle of 40–42° with respect to the exit direction (x direction in Figure 1) [62,72,74]
                                         and adiabatic heating [76].
                                               TEM inspections showed a significant influence of the ECAP shear deformation on
                                         the secondary‐phase precipitation kinetics. In particular, ECAP was able to multiply the
                                         sites of GP zone agglomeration and secondary phase precipitation through tangled dis‐
                                         locations and cell boundary formation. Figure 4 reports representative TEM micrographs
                                         of the ECAP‐A/4, ECAP‐C/4, and FB‐ECAP‐A/4 conditions. The figure clearly shows that
                                         the tangled dislocations act as preferential sites of GP and secondary phase formation.

                                   (a)                                    (b)                               (c)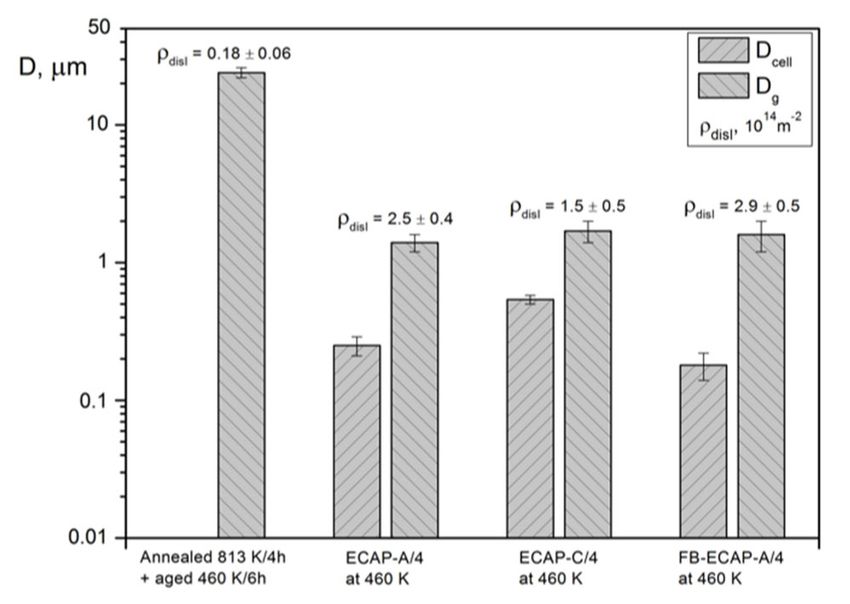
J. Manuf. Mater. Process. 2021, 5, 6 9 of 26
(d) (e) (f)
(g) (h) (i)
Figure 4. BF‐TEM of ECAP‐A/4, where the crystal is oriented to show (100)Al, (a), (110)Al, (b), and (111)Al, (c); ECAP‐C/4
along (100)Al, (d), (110)Al, (e), and (111)Al, (f); FB‐ECAP‐A/4 along (100)Al, (g), (110)Al, (h), and (111)Al, (i). Al‐Cu clusters and
GP zones were detected along the three planes; tiny needle‐like θ‐Al2Cu phase particles were detected along [100]Al;
coarser needle‐like T1‐Al2CuLi phase particles were detected along [110]Al; rounded and somewhat quasi‐equiaxed
δ‐Al3Li phase particles were detected along [111]Al.
Evaluation of the tangled dislocation density in the three experimental cases allowed
correlating them with the ECAP‐induced GP and secondary‐phase precipitation. It
showed that the tangled dislocation density, disl, was the highest in the FB‐ECAP‐A/4, a
little lower in the ECAP‐A/4, and the lowest in ECAP‐C/4 (Figure 4). That is, the follow‐
ing hierarchy of tangled dislocation density can be drawn: FB‐ECAP‐A/4 > ECAP‐A/4 >
ECAP‐C/4. The highest dislocation density corresponded to the highest amount of GP
agglomeration along the dislocation line defects and to a clear initiation of second‐
ary‐phase formation sequence. Thus, the early precipitation sequence of secondary‐phase
precipitation started homogeneously both at dislocation lines and within the Al grains
(Figure 4). These are: θ at the Al100 plane, T1 at the Al110 plane, and δ at the Al111 plane.
Thus, the shear deformation during ECAP at 460 K, the added adiabatic heating to which
the alloy was subjected during the four passes, was responsible for the formation of GP
zones and initial precipitation sequence along tangled dislocations of θ, T1, and δ sec‐
ondary phases.
On the other hand, it is well‐known that ECAP is able to significantly refine the
grained structure of aluminum already at the early stages of plastic deformation. In the
present case, the mean grain size, after all the three ECAP routes, was measured by a
statistical meaningful number of individual measurements. These were at least 250 per
condition, and the identification of grain and cell structures was carried out by means of
Kikuchi band analyses. This is fully described elsewhere in previously published works
by the present author ([76,82,83] and references therein). A grain was identified as a por‐
tion of the crystal all‐around surrounded by high‐angle boundaries (HABs). On the other
hand, a cell was identified as a matrix portion surrounded by at least one low‐angle
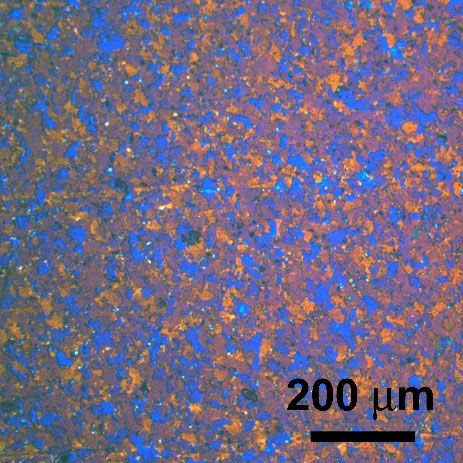
boundary (LAB) line. Figure 5 reports representative low‐magnification BF‐TEM micro‐
graphs showing the refined grained structure after ECAP‐A/4, ECAP‐C/4, and
FB‐ECAP‐A/4.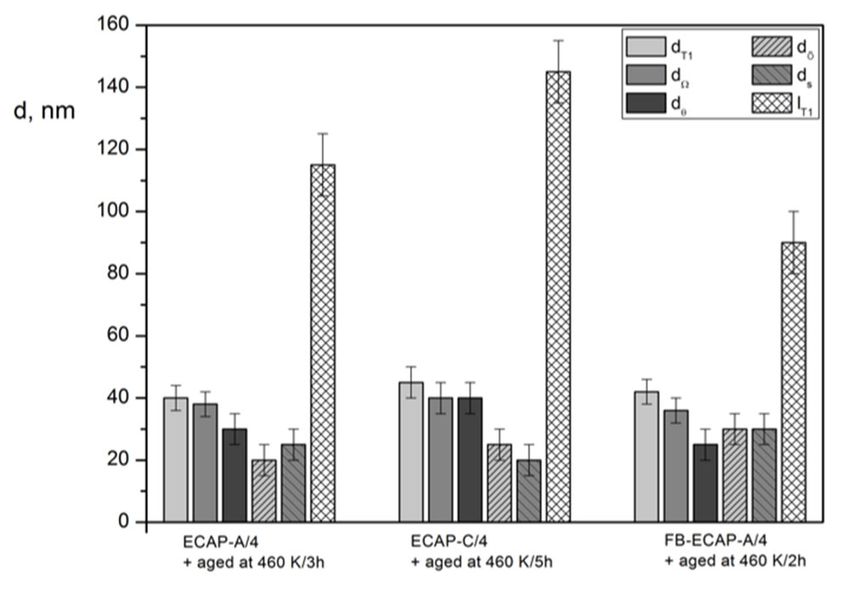
J. Manuf. Mater. Process. 2021, 5, 6                                                                                     10 of 26

                                (a)                                   (b)                               (c)
      Figure 5. LM BF‐TEM showing the alloy grain structure along [110]Al after ECAP‐A/4, (a), ECAP‐C/4, (b), and
      FB‐ECAP‐A/4, (c). Insets are Selected Area Diffraction Patterns (SAEDPs) showing the process of grain refinement
      through formation of concentric diffraction rings.

                                            As reported in the histograms of Figure 6, mean grain size was significantly reduced
                                       to 1 to 3 μm, depending on the ECAP route. That is, the strongest grain size reduction
                                       was obtained after ECAP‐C/4, with ECAP‐A/4 being the one with the coarser refined
                                       grained structure. Thus, the following hierarchy of grain size reduction can be drawn:
                                       ECAP‐C/4 > ECAP‐A/4 > FB‐ECAP‐A/4. This means that the ECAP‐C/4 resulted to be the
                                       most effective path for grain size reduction, with minimal dislocation dispersion to form
                                       tangled dislocations, rather than cell boundaries. Cell boundary density in ECAP‐A/4
                                       was lower with respect to the other ECAP route microstructures, since most of them
                                       contributed to form both cell and grain boundaries. This finding agrees well with other
                                       previously published results [56–58,60–62] and with results reported by the present au‐
                                       thor elsewhere in other aluminum alloys [75,76].

                                       (a)                                                     (b)
J. Manuf. Mater. Process. 2021, 5, 6 11 of 26
(c)
Figure 6. Tangled dislocation density, disl, cell, Dcell, and grain, Dg, size, after ECAP‐A/4, ECAP‐C/4, and FB‐ECAP‐A/4 at
460 K, (a); measured mean number density of GP zones and precipitates, nV, of all detected secondary phases T1, θ, and δ
induced to form under ECAP‐A/4, ECAP‐C/4, and FB‐ECAP‐A/4 at 460 K, (b); mean longer edge lengths of the T1 plate‐
lets, lT1, at alloy T6‐condition and after ECAP at 460 K are also reported, (c).
The Al‐Cu‐Mg‐Li‐Ag‐Zr‐Sc alloy was subjected to ECAP at 460 K by the same routes
and by post‐ECAP aging at the same T6 conditions as obtained by the plot of Figure 2a,
that is, at 460 K/6 h. Figure 7 shows the microstructure post‐ECAP aging at 46 0 K/6 h,
and in all the three SPD routes, a certain amount of secondary‐phase coarsening with
respect to the case of the undeformed T6‐tempered alloy was observed (see Figure 2b–d).
In particular, quite few traces of GP zones are visible. All the agglomerations and element
clustering grew up to eventually precipitate as nanometric secondary phases.
(a) (b) (c)
(d) (e) (f)J. Manuf. Mater. Process. 2021, 5, 6 12 of 26
(g) (h) (i)
Figure 7. Microstructures of the post‐ECAP 460 K/6 h annealed alloys, showing the different secondary‐phase precipi‐
tates. BF‐TEM of ECAP‐A/4 along (100)Al, (a), (110)Al, (b), and (111)Al planes, (c); ECAP‐C/4 along (100)Al, (d), (110)Al, (e),
and (111)Al planes, (f); FB‐ECAP‐A/4 along (100)Al, (g), (110)Al, (h), and (111)Al planes, (i).
Thus, the alloy microstructure was mostly characterized by the co‐presence of small
(few nanometric in size) to coarser (few tens of nanometer in size) secondary‐phase pre‐
cipitates. These were identified by SAEDPs as T1‐Al2CuLi, Ω‐Alx(CuLi)y‐type, θ′‐Al2Cu,
and S′‐Al2CuMg (Figure 8). That is, the microstructure of all the three ECAP path condi‐
tions is similar to an overaged metallurgical condition rather than a T6 hardness peak
one.
(a) (b) (c) (d)
Figure 8. Secondary‐phase precipitates identified by SAEDPs: T1, (a), Ω and T1, (b), δ and θ, (c), S and T1, (d).
Thus, these microstructure findings confirmed that both tangled dislocation and, to
some extent, cell boundaries contributed to accelerate the precipitation sequences of most
of the detected secondary‐phase precipitates.
During post‐ECAP aging, two other secondary‐phase precipitates formed, Ω and S′.
These two phases were detected to form at the same crystallographic planes of, respec‐
tively, T1 and δ′.
The T1‐Al2CuLi are platelet precipitates lying on Al110 planes with matrix coherency
along Al100 planes and (100)Al directions. This phase has a hexagonal crystallographic
structure with P6/mmm space group; thus, the [0001]T1 [110]Al, and the [1–100]T1 [110]Al.
This phase is considered as one of the most effective alloy strengthening in the
Al‐Mg‐Cu‐Li‐X systems [87]. The Ω phase has an orthorhombic crystallographic struc‐
ture (a = 0.496 nm, b = 0.859 nm, c = 0.848 nm) with orientation relationship to the
Al‐matrix lattice as (001)Ω (111)Al. The θ phase has a tetragonal structure with a precip‐
itation sequence of GP‐I zone to GP‐II zone (θ″), θ′, before reaching the final equilibrium
form θ‐Al2Cu. It lays along Al100 planes, and it has an orientation relationship with the
[001]‐longer tetragonal edge [100]Al. The δ‐Al3Li precipitates have a spherical mor‐
phology fully coherent with Al002 planes and Al002 directions. This is a relatively thermally
stable phase, as dissolution of the δ phase generally occurs at grain and cell boundaries
only for temperatures higher than the ones typically used for aging [42].J. Manuf. Mater. Process. 2021, 5, 6 13 of 26
Figure 9 shows the statistical data of all the detected secondary‐phase precipitates
induced to form during ECAP at 460 K followed by aging at 460 K/6 h (T8 temper). As
already documented by Figures 7 and 8, the overaged T8 ECAP + aging at 460 K/6 h
conditions favored the formation of Ω and S′ phases. These two phases were not re‐
ported to form upon alloy T6 condition (Figure 2).
(a) (b)
(c)
Figure 9. Tangled dislocation density, disl, cell, Dcell, and grain, Dg, size, (a); secondary‐phase precipitate mean number
density, nV(T1), nV(Ω), nV(θ), nV(δ), and nV(S), (b); and size, dT1, dΩ, dθ, dδ, and dS (c) formed after ECAP‐A/4, ECAP‐C/4, and
FB‐ECAP‐A/4 and subsequent aging at 460 K/6 h (overaged T8 condition). Mean longer edge length of the T1 platelets, lT1,
is also reported, (c).
The figure does not include the β‐Al3(Sc1−x,Zrx) dispersoids, as they are thermally
stable at the post‐ECAP aging temperatures and they act as grain boundary‐pin elements,
rather than phase‐hardening.
The T8 metallurgical condition induced a number density rise, nV(T1) and nV(Ω),
from ECAP‐C/4 to ECAP‐A/4 and to FB‐ECAP‐A/4. This means that the shear path in‐
fluenced the precipitation of the T1 and Ω phases. The other strengthening phases did not
change their number fraction with different ECAP routes. The size of all the second‐
ary‐phase precipitates was not affected by the specific ECAP shear path, as they did not
change from ECAP‐A/4, ECAP‐C/4, and FB‐ECAP‐A/4.
It resulted in that the tangled dislocation density, disl, was almost double the
FB‐ECAP‐A/4, and ECAP‐A/4, with respect to the ECAP‐C/4 condition. In particular,
FB‐ECAP‐A/4 reported a tangled dislocation density quite close to the one measured in
the ECAP‐A/4, and thus, the shear deformation process seemed to induce a similar dis‐
location rearrangement during ECAP passes through these two processing routes. On theJ. Manuf. Mater. Process. 2021, 5, 6 14 of 26
other hand, the cell and grain structure also appeared to be quite similar, contributing to
confirm the microstructure evolution similarities between ECAP‐A/4 and FB‐ECAP‐A/4.
On the contrary, the lower dislocation density measured in the ECAP‐C/4 is most likely
due to the dislocation crystallographic recombination phenomenon induced during the
180° billet rotation between ECAP passes. Accordingly, as well‐documented in hundreds
of research contributions so far ([53–58,60–63,65,66,69–76,79–81,88,89], and references
therein), the grain refining efficiency differences between namely route A and route C is
particularly sensitive to the ECAP shear path. Thus, FB‐ECAP‐A/4 and ECAP‐A/4 re‐
sulted to be more grain size refining‐effective than ECAP‐C/4.
4. Discussion
The microstructure findings of Figure 4 to Figure 7, and the quantitative analysis of
secondary‐phase precipitates (Figures 6 and 9), referring, respectively, to the ECAP and
ECAP + aging at 460 K/6 h, showed a clear influence of ECAP and ECAP paths on the
phase precipitation sequences. In fact, the ECAP shear deformations to which the alloy
was subjected before aging to the T6 hardness peak were responsible for a significant
multiplication of precipitation sites of all the secondary‐phase precipitates. Indeed, it
resulted that ECAP accelerated the precipitation sequence and favored the precipitation
and formation of phases typically observed for longer annealing times.
In this regard, Cassada et al. [59] and Huang and Zheng [38] reported that in the
presence of heterogeneous nucleation sites, such vacancies and dislocations were able to
speed up the kinetics of secondary‐phase precipitation in Al‐Cu‐Li alloys. The introduced
tangled and free dislocations within grains reduced the strain energy associated with the
precipitate matrix interface of the secondary phases thus promoting their nucleation and
growth. The presence of Ag in the alloy particularly promoted the precipitation of the T1
phase [38]. This silver effect is driven by its atomic segregation, which reduces the misfit
energy between matrix and precipitate interface. Thus, the Ag nucleation and growth of
T1 phase is activated by the co‐presence of Mg and it is promoted by a retarding of GP/θ′
formation. The T1 phase was detected to grow preferentially along [100]Al and [111]Al di‐
rections [90]. Limited lateral growth occurred, and the T1 precipitates simply grew along
the platelet longer edges (i.e., the [0001]T1 [100]Al and [11‐10]T1 [111]Al).
In a microstructure study of a similar Al‐Li‐X alloy, Jiang et al. [91] reported a T1
precipitates coarsening reduced rate and even a dissolution process of the two other alloy
characteristic θ and δ′ phases for prolonged aging times. Anyhow, in the present case, the
occurrence of these two microstructure phenomena did not occur, due to a combined ef‐
fect of pre‐deformation and aging that was not as drastic as a prolonged aging duration.
In this sense, as reported by Shi et al. [50] with a similar Al‐Cu‐Mg‐Li‐Ag‐Zr alloy, the
location, number fraction, and size of the T1 phase have a significant role on the me‐
chanical properties, such as fracture toughness, of the alloy. This effect is controlled by
the alloy aging conditions.
Another key microstructure aspect that was observed in the present study is nucle‐
ation and growth of a further secondary phase, quite similar to the T1‐Al2CuLi. This is the
Ω phase, which is hexagonal, similar to T1 with the Al210 habit plane, and has a chemical
composition quite close to the T1 phase. This phase was found to preferentially grow
along [111]Al. These findings were in good agreement with other previously published
works [90,93,94]. In this respect, Garg et al. reported that the combined presence of little
amount of Mg and Ag is able to stimulate the precipitation of the Ω phase in
Al‐Cu‐Mg‐Ag alloys [92], and both T1 and Ω phases in Al‐Cu‐Li‐Mg‐Ag alloys [93].
Likewise, the combined additions of Mg and Ag in the present alloy are believed to be
responsible for the precipitation of these phases. Ag and Mg are recognized to preferen‐
tially segregate along [111]Al, leading to a minimum strain energy. Thus, Mg‐Ag atomic
co‐clusters are assumed to preferably segregate along the [111]Al, that is, on the disloca‐
tion lines and cell boundaries aligned along the Al111 crystallographic directions. On the
other hand, Cu atoms are known to preferentially segregate at grain boundaries, andJ. Manuf. Mater. Process. 2021, 5, 6 15 of 26
thus, secondary‐phase precipitation at grain boundaries is expected to be saturated by
the presence of the θ′‐Al2Cu phase. In addition, Ω phase preferentially nucleates along
[111]Al instead of θ’, as Ω greatly reduces the matrix strain energy [92].
The combined presence of both T1 and Ω is recognized as the major strengthening
phases in Al‐Cu‐Li‐X alloys, such as the Weldalite® 049‐type alloys [94]. The Ω phase was
reported as a phase responsible for improving the strengthening in Al‐Cu‐Mg‐Ag and
Al‐Cu‐Mg‐Ag‐X alloys [94].
As for the detected δ′ precipitates and β′ dispersoids, these both have a spherical
morphology. They are almost evenly distributed within the grains, and the latter is es‐
sentially present as a grain sliding pinning dispersoid, and thus, located at cell and grain
boundaries. These two phases were detected to be thermally stable. That is, they were
insensitive to the ECAP shearing paths, as their number fraction and size did not change
significantly with different ECAP routes. As for the δ′‐Al3Li phase, it was found to be
subjected to slight modification during shearing strain, as shearing bands were able to
cut these spherical precipitates. This precipitate‐cutting phenomenon is shown by the
representative BF‐TEM micrograph of Figure 10a. The ability of the ECAP shear band
deformations to cut some of the secondary‐phase precipitates was already documented
by the present author in previously published works [65,66,96]. Other authors also re‐
ported dislocation cutting and bypassing processes during thermo‐mechanical treat‐
ments of similar Al‐Cu‐Li‐X alloys [95].
(a) (b)
Figure 10. δ′/S′ precipitate cutting from shearing deformation induced by ECAP, (a), and the heli‐
coid dislocation pinning phenomenon occurring at δ′/S′ precipitates, (b). TEM micrographs refer to
FB‐ECAP‐A/4 + aging at 460 K/2 h (T8 hardness peak condition).
The S was slightly induced to grow by the ECAP shearing. The lath‐like precipi‐
tate‐growing rate was significantly lower than the one observed for the T1 platelet pre‐
cipitates. The S precipitate growth occurred along the longer lath edge, which was typi‐
cally oriented along [111]Al. This phase is able to effectively pin the sliding dislocations.
The strengthening mechanism is well‐documented by the dislocation helicoid‐like pin‐
ning of the S′ nanometric precipitates (Figure 10b).
One of the S′ phase characteristic features is that these nanometric precipitates typ‐
ically pin the sliding dislocations, thus forming helical dislocations or dislocation loops.
That is, the S’ phase can be numbered as a strengthening phase for the present
Al‐Cu‐Mg‐Li‐Ag‐Zr‐Sc alloy. Regarding the formation of this S′‐Al2CuMg phase,
Schneider and co‐workers [90], proposed the following precipitation sequence in
AA2195: GP zones—θ′ T1 + θ′ T1 + δ′ T1 + θ + δ; for Cu/Li = 3, a precipitation se‐
quence of GP zones + δ′ + β′ θ″ + θ′ + δ′ + β′ + T1 T1 + θ + δ + β was reported in [59]. BaiJ. Manuf. Mater. Process. 2021, 5, 6 16 of 26
et al. [51] also reported presence of all these secondary phases in Al‐Cu‐Mg‐Li‐Ag‐Zr
alloy.
In the present case the precipitation sequence in the ECAP and aged
Al‐Cu‐Mg‐Li‐Ag‐Zr‐Sc alloy was found to be as follows: GP zones + β T1′ + θ″ + θ′ + δ′ +
β T1 + Ω + θ + δ + S + β. That is, the following phases were here detected in the T8 ECAP
+ T6 aging condition and in the overaged ECAP + aged condition: Al2CuLi‐(T1),
Alx(CuLi)y‐type‐(Ω), Al2Cu‐(θ), Al3Li‐(δ), and Al2CuMg‐(S) precipitates, and the
Al3(Sc1−x,Zrx)‐(β) dispersoids.
Micro‐hardness, H, was measured along the y‐plane of the three ECAP‐A/4,
ECAP‐C/4, and FB‐ECAP‐A/4 conditions after ECAP and after subsequent aging at 460 K
for the same times selected to determine the T6 temper hardness peak of the
un‐deformed alloy (Figure 2a). The plots of the H vs. aging time of the ECAP‐A/4,
ECAP‐C/4, and FB‐ECAP‐A/4 conditions are reported in Figure 11. It appeared that the
hardness peak was induced to anticipate significantly by the four ECAP passes. In par‐
ticular, route A anticipated the peak to lesser extent with respect to both route C and the
FB‐route A.
Figure 11. Aging curves after ECAP‐A/4, ECAP‐C/4, and FB‐ECAP‐A/4 and subsequent aging at
540 K for 10, 20, 30, 60, and 90 min, 2, 4, 6, 8, 10, and 16 h, and 1 and 2 days (same times of the un‐
deformed alloy T6‐heat treatment). Experimental errors are essentially within the datapoint.
The four ECAP passes had a similar hardness effect. It is expected that these modi‐
fications of the hardness curves with respect to the undeformed T6‐temper condition are
driven by a microstructure rearrangement of the grained structure and in particular by a
sort of acceleration on the secondary‐phase precipitation under post‐ECAP aging.
Thus, based on the aging curves of Figure 11, TEM inspections were carried out at
the ECAP + aging hardness peak conditions. That is, the microstructures of the ECAP‐A/4
+ aging at 460 K/3 h, ECAP‐C/4 + aging at 460 K/5 h, and FB‐ECAP‐A/4 + aging at 460 K/2
h were characterized in terms of the secondary‐phase precipitation (Figure 12).J. Manuf. Mater. Process. 2021, 5, 6 17 of 26
(a) (b) (c)
(d) (e) (f)
(g) (h) (i)
Figure 12. Microstructures of the post‐ECAP 460 K aged alloys, with aging duration set at the maximum alloy hardness
peak obtained after ECAP and subsequent aging at 460 K (3 h for ECAP‐A/4, 5 h for ECAP‐C/4, and 2 h for
FB‐ECAP‐A/4). BF‐TEM of ECAP‐A/4 at [002]Al, (a), [111]Al, (b), and [210]Al, (c); ECAP‐C/4 at [002]Al, (d), [111]Al, (e), and
[210]Al, (f); FB‐ECAP‐A/4 at [002]Al, (g), [111]Al, (h), and [210]Al, (i).
Figure 13 reports the meaningful statistics of the detected secondary‐phase precipi‐
tates, and the mean cell and grain size. The microstructure of the T8 hardness peak aged
condition by all the three ECAP routes here analyzed is characterized by the presence of
both GP zones, secondary‐phase precipitates at their early stage of formation and evolu‐
tion, and some larger precipitate. The marked difference between the ECAP + aged at
hardness peak (T8) and the undeformed T6 microstructures is represented by the pres‐
ence of two more phases in the T8 condition. These are the Ω‐Alx(CuLi)y platelet‐shaped
phase lying at Al111 planes which are quite similar to T1 precipitates, and S′‐Al2CuMg
lath‐shaped phase lying at Al210 planes showing a regular geometric planar morphology.
The quantitative data reported in Figure 13 show little differences of the number fraction
of T1, θ′, and ö′ phases.J. Manuf. Mater. Process. 2021, 5, 6 18 of 26
(a) (b)
(c)
Figure 13. Tangled dislocation density, disl, cell, Dcell, and grain, Dg, size (a), secondary‐phase precipitate mean number
density, nV(T1), nV(Ω), nV(θ), nV(δ), nV(S) (b), and size, dT1, dΩ, dθ, dδ, dS (c) formed after ECAP‐A/4, ECAP‐C/4, and
FB‐ECAP‐A/4 and subsequent aging at 460 K to reach alloy hardness peak (3 h, for ECAP‐A/4, 5 h, for ECAP‐C/4, and 2 h,
for FB‐ECAP‐A/4). Mean longer edge lengths of the T1 platelets, lT1, are also reported in (c).
On the other hand, as expected, little differences of the mean grain and cell size was
found between the ECAP + aged at hardness peak, and ECAP + aged at 460 K/6 h condi‐
tions. Moreover, the little microstructure differences among the different ECAP routes
(A, C, and forward‐backward route A) can be considered not significant.
To better understand the secondary‐phase evolution induced during T6 and the two
T8 (ECAP + aging) conditions, a cumulative histogram of all the four meaningful phases,
that is, (T1 + Ω), θ, δ, S, is reported in Figure 14. Here, histogram bars, referring to all the
strengthening secondary phase volume fraction, were obtained by normalizing detected
phases number fraction to unity. That is, in each experimental condition reported in the
x‐axis of Figure 14, the calculated volume number, nV, of each existing secondary phase
was added and then normalized to 1. These were determined by TEM statistical analysis.
A histogram plot like this one directly shows how each of the detected and existing sec‐
ondary phase particle changes in volume number as the experimental conditions change,
from undeformed, to ECAP, and then to ECAP + peak aging treatments.J. Manuf. Mater. Process. 2021, 5, 6 19 of 26
Figure 14. Relative frequency of the strengthening secondary‐phase precipitates in T6 undeformed
alloy, after ECAP‐A/4, ECAP‐C/4, and FB‐ECAP‐A/4 at 460 K, after ECAP‐A/4 + aging at 460 K/3 h,
ECAP‐C/4 + aging at 460 K/5 h, FB‐ECAP‐A/4 + aging at 460 K/2 h, and after ECAP‐A/4, ECAP‐C/4,
and FB‐ECAP‐A/4 + aging at 460 K/6 h. In the histogram, E stands for ECAP.
It appeared that the T1 phase tends to slightly reduce in favor of the S′ phase as the
aging time increases. The two other phases, θ′ and δ′, did not seem to be influenced by
the post‐ECAP aging duration. In fact, they appeared not to change in number fraction
from ECAP at 460 K to ECAP at 460 K followed by overaging at 460 K/6 h. Thus, ECAP
shearing favored the formation of S′, while it left unaltered the kinetics of the two other
phases, θ′ and δ′. The kinetic evolution of the most abundant T1 phase was slightly af‐
fected by the shear strain‐induced formation of the S′ phase. Thus, the S′ phase only
formed by the combined effect of tangled dislocations introduced by the pre‐aging ECAP
shear deformation, and this was not found to form upon T6‐aging at 460 K/6 h.
The here reported results need to be properly discussed with previously published
works and reported TEM inspections on similar alloys. Different precipitation sequences
and, sometimes, different secondary‐phase precipitations were reported to occur in sim‐
ilar Al‐Cu‐Li‐Mg‐Zr‐X alloys. These findings are somehow contradictory. However, most
of the Al‐Cu‐Li‐Mg‐Zr‐X alloy secondary‐phase precipitation findings can be summa‐
rized as follows.
In some works, precipitation of the S‐Al2CuMg was reported to occur at aging
temperatures ranging from 393 to 440 K and at quite long aging times. This is the case of
an Al‐Cu‐Mg‐Li alloy where the S phase was reported to precipitate at 440 K/168 h [96],
or in an Al‐Cu‐Li‐Mg‐Zr‐Sc alloy, where it formed at 450 K/32 h [97,98]. Moreover [27],
high aging temperatures (433–450 K) of a quite similar Al‐Cu‐Li‐Mg‐Ag‐Zr alloy with
respect to the present alloy induced little amounts of S precipitates, and only for a dura‐
tion longer than 50 h. Lower aging times (20 to 60 h, at 393–450 K) to induce S phase
precipitation were reported for Al‐Cu‐Li‐Mg‐Zr‐(Ag)‐X in [13,97–99]. These aging times
are still significant longer than the here reported T6‐aging condition of 460 K/6 h. On the
other hand, some other authors reported that by pre‐aging straining
Al‐Cu‐Li‐Mg‐Ag‐Zr‐X alloys, the formation of the S phase was induced [11,100]. In these
cases, the T6‐aging time reduced significantly to 10–20 h. These latter findings can be
considered in good agreement with the here reported results. Yet, several other TEM
inspections on similar Al‐Cu‐Li‐Mg‐X alloys did not report the precipitation of S′ phase
upon T6 temper [17,91,100–102]. In particular, no formation of an S phase was reported inJ. Manuf. Mater. Process. 2021, 5, 6 20 of 26
an Al‐Cu‐Li‐Mg‐Zr+SiC alloy aged at 435 K for up to 50 h [103], and for the duration of
up to 200 h in an Al‐Cu‐Li‐Mg‐Mn‐Zr [91]. No S′ formation was observed in another
similar alloy (Al‐Cu‐Li‐Mg‐Ag‐Zr, where Cu/Li = 4) for aging ranging from 373 to 450 K
and times above 30 h [104]. Other research papers accounted for the preferential for‐
mation of a different phase instead of S, namely, σ‐Al5Cu6Mg2 in an
T6‐Al‐Cu‐Li‐Zn‐Mg‐Mn‐Zr alloy [104,105] and the Ω phase in an T6‐Al‐Cu‐Li‐Mg‐Ag
alloy with a large Cu/Li ratio of 8. In this latter case, the alloy was subjected to a mul‐
ti‐aged T8 condition of a 6% pre‐straining [105]. The post‐strain aging was carried out at
temperatures ranging from 410 to 455 K and duration of 12 to 60 h. Even at these extreme
aging conditions of a pre‐strained similar alloy, S was not found. A similar but chemi‐
cally different σ‐Al5Cu6Mg2 phase formation was reported instead.
The above‐mentioned works refer to alloys with Cu/Li ratio typically varying from 1
to 4. Thus, the Cu/Li ratio seems not to influence the S phase precipitation sequence,
contrarily to what was stated in [100]. The here reported findings, according to what was
reported in [11,98–100], seem to indicate that the precipitation of S’ phase is favored by a
sequence of alloy straining and aging, or by quite long aging durations ([13,97–99] and
references therein).
Moreover, Ma et al. [106], in an Al‐Cu‐Mg‐Li‐Ag‐Zr‐X alloy, showed a marked T1
phase number fraction rise at the expense of θ phase by increasing the alloy aging
pre‐straining rate. Yet, two major differences can be identified in the comparison of the
present findings with those reported in [106]. A first aspect consists of the different aging
conditions of temperature and duration. In the present case, the alloy was subjected to
both T8 and T8‐overaged conditions. A second aspect refers to the significantly different
pre‐aging plastic deformation. In the present case, a severe plastic deformation technique
was used with a cumulative strain εeq = 4.32, while a simple straining of up to 8% of
thickness reduction was used in [106]. Finally, Ma et al. did not report the statistic eval‐
uation of the S′/S phase.
In other words, the key microstructure feature that was here identified was the
ECAP + aging‐driven formation of a significant amount of S′ phase and a small amount
of Ω phase, which formed at the expense of a small amount of T1. Thus, these second‐
ary‐phase precipitation modifications induced by ECAP + aging involve a lithium redis‐
tribution. In fact, the T1 phase is constituted by Al2CuLi, while the S′ phase is Al2CuMg.
Thus, the induced formation of S′ at the expense of a fraction of T1 was chemically ac‐
companied by an equally stoichiometric substitution of Li with Mg. The Li, now available
in the Al‐matrix, is thermally favored to form a further secondary phase. This is chemi‐
cally constituted by Al + Cu + Li, and most likely as Alx(CuLi)y, which is the Ω phase.
Based on these findings and comparison with previously published results, the ECAP +
aging precipitation sequence of the present Al‐3.0Cu‐1.0Li‐0.4Mg‐0.4Ag‐0.2Zr‐0.5Sc alloy
was GP zones + β − θ″ + θ′+ δ’ + β + T1 β +θ + δ + T1 + (Ω + S − T1).
The statistical data calculated for the T1 phase after ECAP + aging at hardness peak
and after ECAP + T6 aging (where T6 aging refers to the hardness peak of the unde‐
formed alloy) allowed a clear identification of a precipitate‐coarsening rate. The data and
linear interpolation are reported in Figure 15. The figure is a plot of the mean lateral size
of the T1 precipitates (platelet edge lT1,Ω aligned along the Al111 directions) vs. aging time,
t1/3 for the ECAP‐A/4, ECAP‐C/4, and FB‐ECAP‐A/4 followed by hardness peak aging
and by alloy T6 aging. A linear interpolation was drawn with a sufficiently sound accu‐
racy. This plot indicated a power‐law coarsening rate of the type: lT1,Ω = KLSW t1/3. Here,
KLSW = (8/9) (CsoluteV2γDinter/RT), where Csolute is the phase solute concentration of Cu and Li,
V is the molar volume of both Cu and Li, γ is the phase/alloy interfacial energy, Dinter is
the interdiffusion element coefficient (Cu, Li), R is the Rayleigh constant, and T is the
temperature in Kelvin. This kind of power‐law precipitate growth is in agreement with
different previous models, such as the one very recently proposed by Jiang and
co‐workers [91]. This power‐law phase growth was indeed first introduced by Lifshitz,
Slyozov, and Wagner, and thus named after them as the LSW theory [107,108]. Moreover,You can also read