Variation in Manduca sexta Pollination-Related Floral Traits and Reproduction in a Wild Tobacco Plant - Frontiers
←
→
Page content transcription
If your browser does not render page correctly, please read the page content below
ORIGINAL RESEARCH
                                                                                                                                             published: 13 July 2021
                                                                                                                                     doi: 10.3389/fevo.2021.680463

                                            Variation in Manduca sexta
                                            Pollination-Related Floral Traits and
                                            Reproduction in a Wild Tobacco Plant
                                            Julia Bing 1† , Xiang Li 2† , Alexander Haverkamp 3 , Ian T. Baldwin 1 , Bill S. Hansson 2 ,
                                            Markus Knaden 2 and Felipe Yon 4*
                                            1
                                             Department of Molecular Ecology, Max Planck Institute for Chemical Ecology, Jena, Germany, 2 Department of Evolutionary
                                            Neuroethology, Max Planck Institute for Chemical Ecology, Jena, Germany, 3 Laboratory of Entomology, Department of Plant
                                            Sciences, Wageningen University, Wageningen, Netherlands, 4 Grupo Entomología, Instituto de Medicina Tropical,
                                            Universidad Peruana Cayetano Heredia, Lima, Peru
                           Edited by:
               Casper J. Van Der Kooi,
 University of Groningen, Netherlands       Most flowering plants depend on animal pollination for successful sexual reproduction.
                        Reviewed by:        Floral signals such as color, shape, and odor are crucial in establishing this (often
                     Anna Lisa Stöckl,
                                            mutualistic) interaction. Plant and pollinator phenotypes can vary temporally but also
          Julius Maximilian University
               of Würzburg, Germany         spatially, thus creating mosaic-like patterns of local adaptations. Here, we investigated
                     Katarzyna Roguz,       natural variation in floral morphology, flower volatile emission, and phenology in four
         University of Warsaw, Poland
                                            accessions of a self-compatible wild tobacco, Nicotiana attenuata, to assess how these
                   *Correspondence:
                              Felipe Yon    traits match the sensory perception of a known pollinator, the hawkmoth Manduca
                  felipe.yon.t@upch.pe      sexta. These accessions differ in floral traits and also in their habitat altitudes. Based
                   † Present  address:      on habitat temperatures, the accession occurring at the highest altitude (California) is
                             Julia Bing,
                                            less likely to be visited by M. sexta, while the others (Arizona, Utah 1, and Utah 2)
   Department for Systematic Botany,
   Institute for Ecology and Evolution,     are known to receive M. sexta pollinations. The accessions varied significantly in flower
     Friedrich Schiller University, Jena,   morphologies, volatile emissions, flower opening, and phenology, traits likely important
                               Germany
                                Xiang Li,   for M. sexta perception and floral handling. In wind tunnel assays, we assessed the
      PartiQla GmbH, Jena, Germany          seed set of emasculated flowers after M. sexta visitation and of natural selfed and
                                            hand-pollinated selfed flowers. After moth visitations, plants of two accessions (Arizona
                  Specialty section:
        This article was submitted to       and Utah 2) produced more capsules than the other two, consistent with predictions
 Behavioral and Evolutionary Ecology,       that accessions co-occurring with M. sexta would benefit more from the pollination
               a section of the journal
   Frontiers in Ecology and Evolution
                                            services of this moth. We quantified flower and capsule production in four accessions
           Received: 14 March 2021
                                            in a glasshouse assay without pollinators to assess the potential for self-pollination.
            Accepted: 10 June 2021          The two Utah accessions set significantly more seeds after pollen supplementation
            Published: 13 July 2021         compared with those of autonomous selfing flowers, suggesting a greater opportunistic
                               Citation:    benefit from efficient pollinators than the other two. Moreover, emasculated flowers of
            Bing J, Li X, Haverkamp A,
   Baldwin IT, Hansson BS, Knaden M         the accession with the most exposed stigma (Utah 2) produced the greatest seed set
             and Yon F (2021) Variation     after M. sexta visitation. This study reveals intraspecific variation in pollination syndromes
 in Manduca sexta Pollination-Related
    Floral Traits and Reproduction in a
                                            that illuminate the potential of a plant species to adapt to local pollinator communities,
                    Wild Tobacco Plant.     changing environments, and altered pollination networks.
           Front. Ecol. Evol. 9:680463.
      doi: 10.3389/fevo.2021.680463         Keywords: Manduca sexta, Nicotiana attenuata, floral trait, pollination, plant reproduction, local adaptation

Frontiers in Ecology and Evolution | www.frontiersin.org                          1                                             July 2021 | Volume 9 | Article 680463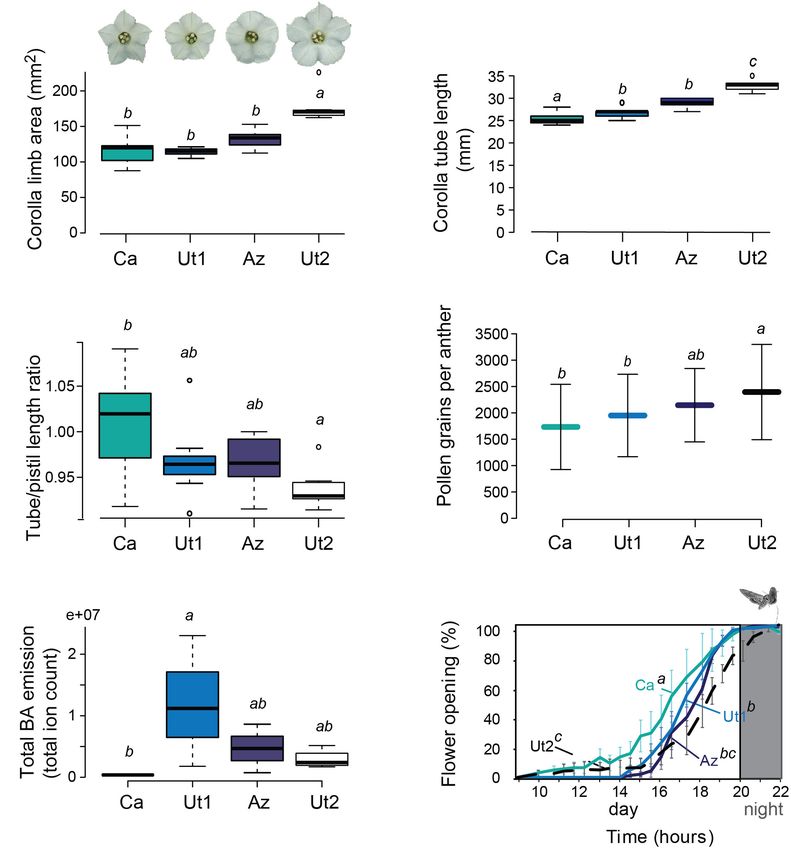
Bing et al.                                                                                                      Floral Trait Variation and Reproduction

INTRODUCTION                                                                reduction of investment on floral advertisement can lead to a
                                                                            shorter flower presentation time and faster self-pollination.
Flowers exploit the sensory bias of insect pollinators to improve               Additionally, there are physical–mechanical–morphological
their chance of receiving outcrossed (Balamurali et al., 2015)              floral traits that can facilitate the visualization of certain traits
or at least geitonogamous pollinations (Vaughton and Ramsey,                such as the timing of flower opening and flower movement
2010; Sukumaran et al., 2020), the opportunities for which                  (Aizen, 2003; van Doorn and Van Meeteren, 2003; Hodges et al.,
differ considerably depending on plant densities, interpopulation           2004; Yon et al., 2016). Flower opening conditions the perception
distances, and phenologies (Carvalheiro et al., 2014; Kantsa                of a corolla display by a pollinator, as the pigments located in
et al., 2018). Attracting (or luring) pollinators is achieved via           the front and back of the petals can be different, as well as
different types of rewards or attractants offered by the plant. In          allowing the visualization of anthers, pollen, and pistil. As studies
some cases, these signals can vary among plants from different              have shown on Aquilegia and artificial flowers (Hodges et al.,
habitats and populations in response to the specific needs of               2004; Sprayberry and Suver, 2011), the orientation of flowers can
pollinators that can maximize the reproductive output of the                render the visual organs of many pollinators useless. In these
plant (Gómez et al., 2009a).                                                cases, the obverse of the corolla and its features are not exposed
   Most species are assemblages of different genotypic and                  to the pollinator, due to particular flying and foraging approaches
phenotypic populations within an ecologically complex                       to the flowers (Hodges et al., 2004; Ushimaru and Hyodo, 2005;
landscape. The geographic mosaic theory of coevolution                      Haverkamp et al., 2019).
incorporates this fact and postulates that populations are                      Nicotiana attenuata is a solanaceous plant species mainly
under different evolutionary selective pressures over large                 occurring in the Southwest United States, where it inhabits a
geographic distances due to spatial variation (Thomson, 2005).              broad range of elevations at least between 800 and 2,300 meters
In a pollinator community context that would mean that due to               above sea level (masl) (Haverkamp et al., 2018). This represents a
spatial variations over the habitats of its range, a plant species          temperature variation between locations at the warmest month
can be either adapted or maladapted to certain pollinator(s). This          July of 7.5◦ C at high elevation to 19.9◦ C at lower elevation
suggests that when a plant species with a specialized pollination           during the night (WorldClim database). N. attenuata is assumed
syndrome occurs outside the range of the optimal pollinator,                to have a hawkmoth pollination syndrome, with white long
many of the adaptations might become maladaptations as they                 tubular flowers, night opening, night upright orientation, and
could hinder the attraction of other potential pollinators. In              strong night scent that exploit the sensory bias of the hawkmoth
contrast, if a plant has a generalist pollinator community, certain         M. sexta. Previous studies examining the interaction between
floral traits can be considered as local adaptations over its range         M. sexta and N. attenuata have shown the importance of one
to maximize the service of the most optimal local pollinators               particular floral volatile compound, benzyl acetone (BA; Kessler
(Gómez et al., 2009a).                                                      et al., 2015; Haverkamp et al., 2016b). The presence of this
   Scent is an important factor for speciation or pollinator                compound increases the foraging success of the moth, as well as
fidelity to a certain plant species (Balamurali et al., 2015;               the reproductive output of the plant (Haverkamp et al., 2016b).
Kantsa et al., 2018; Souto-Vilarós et al., 2018) in relation to                 At the same time, the larvae of this hawkmoth is a voracious
the pollinator community. The loss of a specific major scent                herbivore on N. attenuata, and its attraction as pollinator
compound can be interpreted as a release from a main pollinator,            therefore brings a risk of damage (Kessler et al., 2010, 2015;
particularly if the scent at high concentrations acts also as a             Reisenman et al., 2010; Kessler, 2012). This might select against
repellent to herbivores (Baldwin et al., 1997; Kessler et al., 2019).       exploiting M. sexta sensory bias and pollination service in
Furthermore, pollinators can also act as herbivores for the same            some natural populations under less beneficial growth conditions
plant species. For example, besides searching for nectar, female            (Gómez et al., 2009b). Besides M. sexta, also other hawkmoths
moths are also in the search of oviposition sites. Both nectaring           such as Hyles lineata or Manduca quinquemaculata, but also day-
and oviposition behavior have been shown to be linked in the                active hummingbirds (e.g., Archilochus alexandri) and bee species
hawkmoth Manduca sexta, bearing the risk for the plant to be                (e.g., Apis mellifera, Lasioglossum spp.) have been observed
consumed by the caterpillars of its pollinator (Kessler et al., 2012;       to visit flowers of N. attenuata, which feed on nectar and
Smith et al., 2017).                                                        pollen, respectively. In field experiments, emasculated flowers
   Other studies addressing outcrossing versus selfing point out            open during the day produced capsules, thus showing the
that self-compatible populations at edges of a native range will            capability of day-active pollinators to provide the plant with
have a larger proportion of selfing compared with outcrossed.               pollen (Kessler et al., 2015), especially when plants are attacked
Plants growing at the edges of the native range may have fewer              by M. sexta caterpillars (Kessler et al., 2010). N. attenuata
pollinators available that can perceive and interact successfully           plants that are under attack of M. sexta caterpillars produce
with the flowers, this being even more so for specialist plant–             flowers with reduced BA emissions that open in the morning
pollinator systems. Thus, in order to colonize new habitats                 and are preferred by day-active hummingbirds (Kessler et al.,
and avoid Allee effects (Morgan et al., 2011), plants in edge               2010). Thus, plants reduce herbivore pressure by switching from
populations would have to rely more on selfing rather than                  M. sexta pollination, which involves the risk of caterpillar-feeding
outcrossing. Over time, different floral traits can be (de)selected         damage, to hummingbird pollination.
as those are no longer exploiting a specialized perception of a                 We recently showed that N. attenuata originating from
pollinator to increase the reproductive output of the plants. The           different populations are differentially attractive to the pollinator

Frontiers in Ecology and Evolution | www.frontiersin.org                2                                        July 2021 | Volume 9 | Article 680463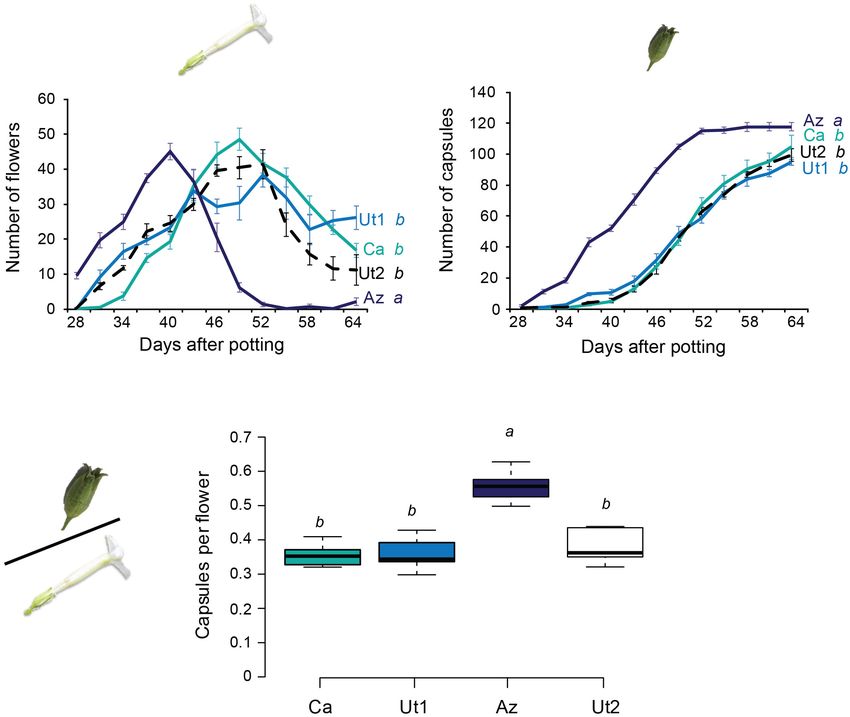
Bing et al.                                                                                                    Floral Trait Variation and Reproduction

M. sexta (Haverkamp et al., 2018). In this follow-up study,                N. attenuata (Kessler et al., 2012), we used male moths to exclude
we investigate how this relates to the reproductive success of             the oviposition behavior from our experiments.
four N. attenuata accessions. Moreover, we propose that some
accessions are more specialized on M. sexta pollination than               Flower Morphology and Opening
others, following the idea of local specialization.                        Flower morphology and opening of four N. attenuata accessions
                                                                           was investigated by measuring corolla limb diameter and area,
                                                                           pistil and corolla tube length, and flower opening of single freshly
MATERIALS AND METHODS                                                      open flowers from seven independent plants per accession. The
                                                                           corolla limb diameter was measured between the most outer
                                                                           tips after flowers fully opened, and the area was measured from
Seed Germination and Plant Cultivation
                                                                           scanned calibrated images of the surfaces of corollas.
The N. attenuata Torr. (Solanaceae) seeds for all experiments
                                                                              Flowers from seven independent plants per accession were
were sterilized and germinated on Petri dishes with Gamborg’s
                                                                           cut open using forceps to measure the pistil and corolla tube
B5 media as described in Krügel et al. (2002). The seeds were
                                                                           length by hand with a ruler. The length of the pistil was measured
maintained under 16 h:8 h light:dark conditions in a growth
                                                                           from the flower base to the stigma. The corolla tube length was
chamber with temperature set to 28◦ C in light and 26◦ C in
                                                                           measured from the flower base to the tip of the open corolla
dark (Percival, Perry, IA, United States) for 10 days. Afterwards,
                                                                           petals. The length ratio of the corolla tube and the pistil within a
seedlings were transferred to TEKU pots (TEKU JP 3050
                                                                           flower was calculated by dividing the first over the second, where
104 pots, Poppelmann, Lohne, Germany) with Klasmann plug
                                                                           values above 1 means the pistil is shorter and the stigma is within
soil (Klasmann-Deilmann, Saterland, Germany) in a glasshouse
                                                                           the corolla tube and values below 1 means that the stigma is
[16 h:8 h light:dark, humidity: 50–60%, temperature: 23–
                                                                           protruding from the corolla tube.
25◦ C (light), and 19–21◦ C (dark)]. After 10 days, plants were
                                                                              Flower opening (flower aperture) was recorded at 1/h
transferred from TEKUs to 1 L pots for glasshouse and wind
                                                                           acquisition intervals using a time-lapse imaging setup,
tunnel experiments at the Max Planck Institute for Chemical
                                                                           composed of a webcam (Logitech Europe S.A., Lausanne,
Ecology (MPI CE), Jena, Germany.
                                                                           Vaud, Switzerland) connected to a laptop to automatically
   In this study, we focused on genetically fixed differences
                                                                           acquire and store the photos. To quantify the opening, the inner
among different accessions rather than phenotypic plasticity.
                                                                           distance between opposite lobes was measured in pixels and
Therefore, plants were inbred for several generations and raised
                                                                           converted to millimeter using the software IMAGE TOOLS v.3.0
under uniform growth conditions in the glasshouse. Plants
                                                                           (UTHSCSA, San Antonio, TX, United States). Later, the aperture
originated from four different wild-type N. attenuata native
                                                                           values were converted to percentage of opening by taking the
populations: “Ut1” from the D.I. Ranch (Santa Clara, UT,
                                                                           maximum value in millimeters from the fully open flower as
United States; inbred for 31 generations), “Az” from Townsend
                                                                           denominator for all other intermediate values.
Winona Road (east Flagstaff, AZ, United States; inbred for five
generations), “Ca” from Benton Crossing Road (west Benton
Hot Springs, CA, United States; inbred for five generations), and          Pollen Count
“Ut2” from Lytle Ranch Preserve (Lytle Ranch Preserve Rd, UT,              For evaluating the number of pollen grains for four different
United States; inbred for seven generations). The locations from           natural accessions, anther heads were collected separately before
which the seeds of the different accessions originated are shown           anthesis (8–10 a.m.) into 2 ml reagent tubes and stored in a
in Figure 2.                                                               desiccator for 24 h until opening. For each accession, all five
                                                                           anthers from nine flowers of five plants were collected. After
                                                                           anthers opened, 250 µl of 2% sodium chloride solution was added
Manduca sexta Rearing                                                      to each tube and vortexed for approximately 1 min. The number
Manduca sexta moths used for wind tunnel experiments were                  of pollen grains per anther was counted under a microscope
obtained from a colony maintained at the MPI CE. Moths were                using a Neubauer cell counting chamber with a depth of 0.1 mm
reared as previously described in Koenig et al. (2015). Eggs               (Neubauer improved, Superior Marienfeld, Lauda-Königshofen,
for the colony were collected from female moths, which were                Germany). To ensure an equal distribution of pollen within
allowed to freely oviposit on N. attenuata plants. Caterpillars were       the sample, we shortly vortexed each tube again directly before
fed on artificial diet at 27◦ C ambient temperature, 70% relative          adding 10 µl to the chamber. For each sample, five large squares
humidity, and 16:8 light:dark regime. As soon as caterpillars              (5 × 1 mm2 ) were counted for estimation of the total number
reached the wandering stage and stopped feeding, they were                 of pollen grains per anther following the Neubauer chamber
transferred into wooden blocks for pupation. Pupae were sexed              formula:
1 week before hatching, and male and female pupae were
                                                                                                            pollen counted × 250 µ l
                                                                                                         P
transferred in separate flight cages (15.5 h daylight with 25◦ C                  Number of pollen
                                                                                                      =
and 70% relative humidity, 7.5 h dim light at 0.5 lx with                          grains per anther         5 mm2 × 0.1 mm
20◦ C and 60% relative humidity). Between both phases (daylight
and dim phase), a transition time of 30 min each was used.                 Floral Benzyl Acetone Emissions
For experiments, male moths were used 3 days after hatching.               Benzyl acetone was measured as described in Haverkamp
Since M. sexta females frequently lay eggs while foraging on               et al. (2018) using polydimethylsiloxane (PDMS) as traps and

Frontiers in Ecology and Evolution | www.frontiersin.org               3                                        July 2021 | Volume 9 | Article 680463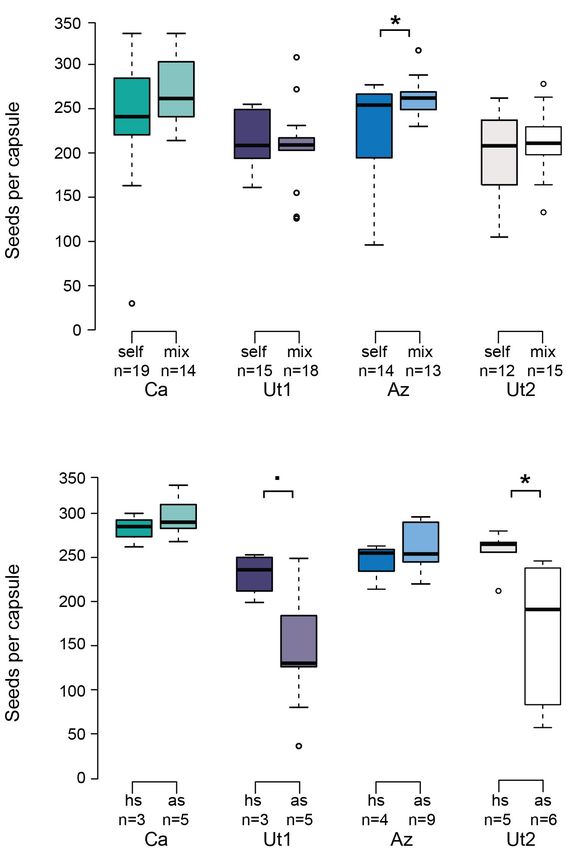
Bing et al. Floral Trait Variation and Reproduction
GC-MS for quantification. Here, we compare total overnight self-pollination (Kessler et al., 2008), and all other flowers were
emissions of four flowers from different plants of the Ut2 removed. Pollen of fresh flowers from plants not used in the wind
accession with data for Ut1, Az, and Ca accessions taken from tunnel was collected in the corresponding morning. In order to
Haverkamp et al. (2018). measure the output of pollen delivery, pollen was gently rubbed
on the hawkmoth proboscis using a fine brush prior to its release
Nectar and Sugar Measurements in the wind tunnel (Haverkamp et al., 2016b). For each trial,
The amount of nectar was measured by carefully removing the another plant was placed at one side of the wind tunnel with
corolla tube and collecting the nectar with a capillary (Brand, the flower at a position 25 cm from the front end, 45 cm distant
Wertheim, Germany) and measuring the length and dividing by from both side walls, and approximately 70 cm from the ground
its conversion factor 3.2. We used six plants per accessions and of the wind tunnel. Moths were kept in individual mesh cages
one flower per plant. The composition of sugars in the nectar was (15 cm × Ø13 cm) until being placed on a platform at the rear
measured on a LC-Triple Quadrupole-MS instrument, Bruker end of the wind tunnel opposite of the plant (10 cm from the rear
EVOQ Elite (Bruker, Billerica, MA, United States), employing end, 45 cm from both side walls, and 30 cm from the wind tunnel
an HESI ion source as described in Schäfer et al. (2016). The floor). Moths, which did not initiate wing fanning within 5 min,
quantification of glucose, fructose, and sucrose was done relative were excluded from the experiment. After the moths were taking
to the internal standard sorbitol. off, they were allowed to fly freely for 4 min in the wind tunnel.
The foraging behavior was observed via a video camera situated
Phenology Measurements behind the flower at the beginning of the wind tunnel (Logitech
To examine the total number of flowers and capsules produced C615, United States, infrared filter removed). The camera was
over the lifespan of the plants, we used five plants of each wild- recording at 30 Hz with a resolution of 800 × 600 pixels.
type accession in the glasshouse. Since flowers remain open for Flower approach was scored as flower contact of the moth
approximately 3 days, the number of open flowers was recorded with its proboscis or front legs. Flower handling time was
every 3 days in the morning (8–10 a.m.) to avoid multiple counted from the first contact until the moth had no more
counting of the same flower. Additionally, all capsules were contact with the flower for more than 1 s. Only the first flower
counted at each time point. At the end, the number of flowers approach was used for statistical analyses in order to exclude
from all time points was summed to estimate the total number learning effects. Foraging success was evaluated by measuring
of flowers and capsules as well as the total flower to total capsule the amount of residual nectar after an apparent successful moth
ratio produced for each plant. Flower and capsule counts were contact with the flower, where a foraging event was scored
recorded until plant senescence. as successful when nectar was fully removed as described in
Haverkamp et al. (2018, 2019).
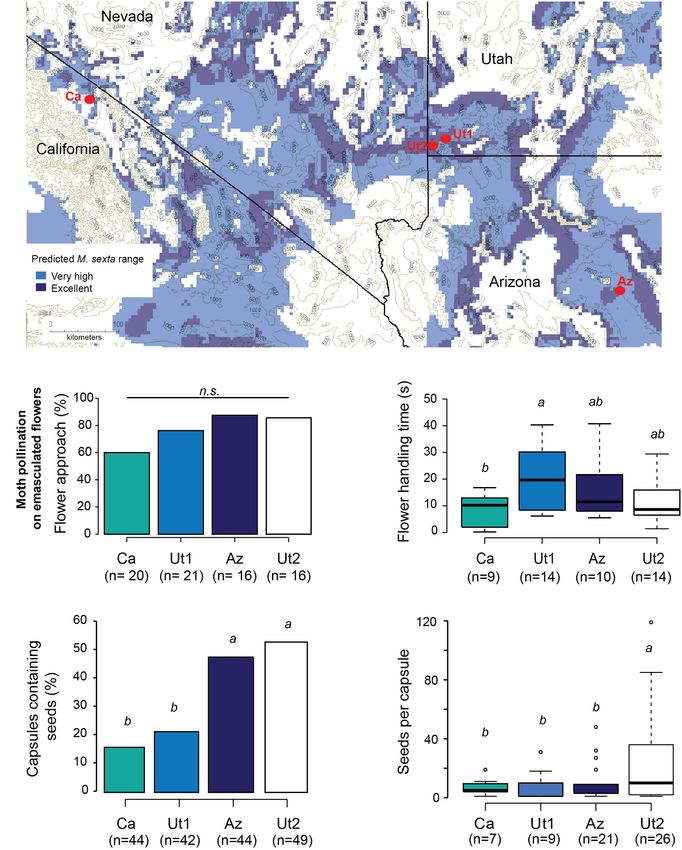
Map of Accessions and M. sexta Pollination Experiments
Presence Prediction All hand pollinations were performed in the evening between
The map of accessions was generated using the WorldClim 7 and 9 p.m. with freshly open flowers, and the pollen was
database, referenced location of the accessions, M. sexta collected immediately before the start of the experiment from
referential presence data in Utah (Yon et al., 2017b), and freshly open flowers. Hand pollinations with pollen of the same
environmental temperature required for flying of M. sexta accession (self) and a pollen mixture of all four accessions
(Heinrich, 1971). The digital elevation model was used to (mix) were performed using emasculated flowers on five plants
generate altitude contour lines at 500 masl intervals using QGIS per accession. Therefore, anthers have been removed before
v.2.18. The predicted distribution map of M. sexta was generated anthesis in the morning between 5 and 6 a.m. of the day
using temperature as the proxy parameter for determining the of flower opening as described in Kessler et al. (2008). For
likeliness of presence in southwestern United States using the self hand pollination, we collected freshly open anthers of the
function Bioclim modeling of the software DIVA-GIS v.7.5. accessions in separate 0.5 ml PCR reaction tubes. For mix hand
pollination, the same number of freshly open anthers from the
Wind Tunnel Bioassays different accessions was collected with clean forceps into a 0.5-
Behavioral assays with M. sexta moths were performed in a ml PCR reaction tube and mixed by tapping multiple times
plexiglass wind tunnel (250 × 90 × 90 cm) at the MPI CE. against the walls. Anther heads were carefully removed from
The laminar flow of charcoal-filtered air was set to 0.37 m/s, the reaction tube prior to avoid any damage when applying
which is similar to those conditions that hawkmoths commonly pollen to the stigma. For each hand pollination treatment (self
experience while foraging (Riffell et al., 2008). Climate conditions and mix), we used 20 flowers on five plants per accession. The
were adjusted to 25◦ C air temperature and 70% relative humidity. same plants were used for pollen collection, self and mix hand
At the latest 1 h before the experiment, plants and moths were pollination. Only capsules that produced seeds have been used
transferred to separate chambers with similar climate conditions for statistical analysis.
as the wind tunnel. Additionally, we used nonemasculated flowers to evaluate
To measure pollination rates of flowers of four natural if the seed set of autogamously selfing flowers (autogamous
accessions after M. sexta visitation, one flower per plant was selfing) differs from that of flowers supplemented with pollen
emasculated before anthesis (daylight morning cycle) to exclude from the same flowers (selfing hand). Therefore, we removed
Frontiers in Ecology and Evolution | www.frontiersin.org 4 July 2021 | Volume 9 | Article 680463Bing et al. Floral Trait Variation and Reproduction
all open flowers in the morning of the experiment to ensure tested with the Fligner tests (corolla limb area p = 0.5315, tube
the use of fresh flowers. For both treatments, 10 flowers on length p = 0.9891, tube/pistil length p = 0.2999).
five plants per accession were used, whereas only flowers that Flowers of Ut2 and Ca started opening earlier but slower than
produced capsules containing seeds have been considered for Ut1 and Az, which results in a similar flower opening when
statistical analysis. M. sexta activity period starts at 20 h (Figure 1F). The progressive
In all hand pollination experiments, pollen was applied to opening of the corolla limb (millimeters open expressed as
experimental flowers by homogeneously covering the stigma percentage of its full opening) was analyzed with a GLM
using a wooden tooth pick. Afterwards, the flowers’ pedicels [accessions F = 16.736, p < 0.0001; time (as factor) F = 146.059,
were carefully labeled using a colored string with each treatment p < 0.0001] followed by post hoc least square means Tukey
being assigned to a different color. Capsules of all pollination for pairwise comparison between accessions (Supplementary
experiments were collected shortly before opening approximately Table 1). We observed that flowers of Ca and Ut2 started opening
14–20 days after pollination and dried in a desiccator for 2 days significantly earlier than flowers of Az or Ut1, while the latter two
before being further processed. The number of seeds from were not different between themselves.
capsules obtained from hand and wind tunnel pollinations have
been automatically counted using ImageJ2 (Fiji; Schindelin et al., Pollen Count
2012; Rueden et al., 2017). The number of pollen grains per anther (Figure 1D and
Supplementary Table 1) was compared between the accessions.
Statistical Analysis Due to its normal distribution, ANOVA followed by the HSD test
The data were analyzed using the software R version 4.0.4 (The was performed, showing that Ut2 has significantly more pollen
R Foundation for Statistical Computing, 2021) and, additionally, grains per anther than Ca (p = 0.0007) and Ut1 (p = 0.0445), but
the following R packages “pairwiseCI” v.0.1-27, “lsmeans” v.2.3, does not differ from Az (p = 0.4514). No significant difference was
“multcomp” v.1.4-16, and “agricolae” v.1.3-3. Data normality found between the variance size with the Fligner test (p = 0.752).
was evaluated with Shapiro tests and additionally visualized with
Q-Q plots. When data were normally distributed, we employed Floral Benzyl Acetone Emissions
an analysis of variance (ANOVA) model; when data were not Furthermore, analysis of total BA emission in flowers of the
normally distributed, we employed a generalized linear model, four accessions was performed using a GLM followed by a
with family adjustments depending on data type (Gaussian multicomparison HSD test (Figure 1E). Flowers of Ut1 emit the
for continuous values and quasi-binomial for proportions). greatest amount of BA, being only significantly different from
Direct pairwise comparisons, when not required one of the Ca (p = 0.0221), which is originating from a population outside
previous models, were analyzed with a Holm-corrected Fisher’s of the predicted M. sexta range (Figure 2A). No significant
exact test for normally distributed data and a Wilcoxon test difference was found between the variance size with the Fligner
for non-normally distributed data. Additionally, in order to test (p = 0.3208).
evaluate difference in floral trait variance among accessions,
we used the Fligner test for pairwise variance analysis with Nectar and Sugar Measurements
Holm adjustment. Nectar volume differed significantly among the four accessions
(GLM p < 0.0001) and was the highest in Ca, followed by
Ut2. The other two accessions presented similar low nectar
RESULTS volumes (Supplementary Figure 1A). When analyzing the sugar
composition, Az had the highest concentrations of glucose,
Flower Morphology and Opening fructose, and sucrose compared with the other accessions
The corolla limb area was analyzed using the “Momocs” R (GLM followed by a multicomparison HSD test, glucose:
package and compared between accessions using a generalized p = 0.0044, fructose: p = 0.0031, sucrose: p = 0.0139), but
linear model followed by post hoc Tukey with Holm adjustment was not significantly different for each pairwise comparison
for multiple comparison showing the greatest corolla limb area (Supplementary Figures 1B–D).
(Figure 1A and Supplementary Table 1) and corolla tube length
with an ANOVA followed by the honestly significant difference Flower and Capsule Count
(HSD) test (Figure 1B and Supplementary Table 1) for flowers Five plants per accessions were observed regarding their flower
of the accession Ut2. To evaluate differences in the position of and capsule kinetics. Az plants started flowering around 28 days
the stigma relative to the corolla tube, the ratio of tube/pistil after potting, which is 2.4 to 4.8 days earlier than the other
length was compared between the accessions (GLM followed by accessions. Moreover, Az plants attained their flowering peak
pairwise Wilcoxon test), whereas values 1 a stigma was analyzed with a GLM with factors accession and a four
located inside the corolla tube (Ut1, Az, and Ca). The tube/pistil term polynomial fitting for days after potting (dap) (accession
length ratio differed significantly between Ca and Ut2, whereas p = 0.0014 and dap p < 0.0001). Followed by a least square means
Ut1 and Az did not differ from any accession (Figure 1C and analysis for pairwise comparison, overall, the flowering kinetic of
Supplementary Table 1). For these three morphological traits, Az differed significantly from all other accessions (Figure 3A and
the size of their variance was not significantly different when Supplementary Table 2).
Frontiers in Ecology and Evolution | www.frontiersin.org 5 July 2021 | Volume 9 | Article 680463Bing et al. Floral Trait Variation and Reproduction FIGURE 1 | Floral morphology and pollen number of four native Nicotiana attenuata accessions. (A) Boxplot showing the corolla limb area analyzed using the R package “Momocs” [N = 7, generalized linear model followed by post hoc Tukey with Holm adjustment, different letters indicate significant differences (p < 0.001)]. (B) Boxplot of corolla tube length [N = 7, ANOVA model followed by HSD test with Holm adjustment, different letters indicate significant differences (p < 0.005)]. (C) Boxplot showing the corolla tube/pistil length ratio. Values above 1 indicate a stigma which is shorter than the corolla tube, whereas a value below 1 indicates a stigma located outside of the corolla tube [N = 7, generalized linear model followed by pairwise Wilcoxon test with Holm adjustment, different letters indicate significant differences (p < 0.05)]. (D) Number of pollen grains (mean ± SD) per anther [N = 45, ANOVA followed by HSD test, different letters indicate significant differences (p < 0.05)]. (E) Boxplot showing the total BA emission of flowers [N = 4, generalized linear model followed by HSD test, different letters indicate significant differences (p < 0.05)]. (F) Flower opening (mean ± SEM) between 9 and 22 h [N = 4, generalized linear model followed by HSD test with Holm adjustment, different letters indicate significant differences (p < 0.05)]. The flower opening refers to the flower aperture measured in millimeters and expressed as percentage of opening. The gray bar represents the activity period of M. sexta within the time span measured. Boxplots show the median (thick bar), the first and the third quartiles [box and 1.5 times the interquartile range (whiskers)]. Abbreviations for accessions: Az, Arizona; Ca, California; Ut1, Utah 1; Ut2, Utah 2. Furthermore, the capsule kinetic, with the same statistical showed a significantly greater capsule-to-flower ratio, being approach as the flower kinetic, showed significant differences approximately 20% higher than those of the other accessions. between Az and all other accessions (Figure 3B and Supplementary Table 2), with Az starting to set capsules 4.2 to 8.4 days ahead of Ca, Ut1, and Ut2. The number of Manduca sexta Flower Handling and capsules produced per flower over the lifespan of the plant Pollination Output was compared as capsule-to-flower ratio between accessions The duration of flower contact was measured for the first flower (Figure 3C and Supplementary Table 1). Arizona plants approached by M. sexta. Solely, Ut1 and Ca showed a statistically Frontiers in Ecology and Evolution | www.frontiersin.org 6 July 2021 | Volume 9 | Article 680463
Bing et al.                                                                                                                       Floral Trait Variation and Reproduction

  FIGURE 2 | Map of Manduca sexta predictions based on temperature range and pollination output of four natural accessions. (A) Predicted distribution map of
  M. sexta with temperature as the proxy parameter in the Great Basin Desert, United States. Red circles show the seed collection sites. (B) Total percentage of
  emasculated flowers of N. attenuata approached by M. sexta moths in a wind tunnel assay [p = 0.1326, Holm-corrected Fisher’s exact test, data published for Ca,
  Az, and Ut1 (Haverkamp et al., 2019)]. (C) Flower contact time (mean ± SD) for first flower approached [ANOVA followed by Holm-corrected least significant
  differences, data published for Ca, Az, and Ut1 (Haverkamp et al., 2019)]. (D) Total percentage of capsules containing seeds formed after M. sexta visitation (ANOVA
  followed by pairwise HSD test with Holm adjustment). (E) Seed output of emasculated flowers resulting from moth pollination (generalized linear model followed by
  least squares pairwise comparison). Numbers below the x-axis represent replicate numbers. Different letters indicate significant differences (p < 0.05). n.s.,
  non-significant difference. Whiskers of the boxplots in panels (C,E) indicate 1.5 times the interquartile range; boxes depict first and third quartiles.

significant difference in flower contact time, while Az and Ut2                        accessions (Ut1: 66.67%, Az: 56.25%, and Ut2: 50%), although in a
did not differ from any accession (Figure 2C and Supplementary                         pairwise comparison, only Ca and Ut1 were significantly different
Table 1). When foraging on flowers of Ca, moths have the                               (Supplementary Figure 2). The foraging success of the moth did
lowest foraging success (20%) compared with the other three                            not differ between Ut1, Ut2, and Az.Manduca sexta approached

Frontiers in Ecology and Evolution | www.frontiersin.org                           7                                              July 2021 | Volume 9 | Article 680463
Bing et al.                                                                                                                       Floral Trait Variation and Reproduction

  FIGURE 3 | Flower and capsule count over the lifespan of four N. attenuata accessions. (A) Mean ± SEM number of flowers per plant (N = 5, generalized linear
  model with polynomial fitting with four terms, followed by least square means for pairwise comparison with Tukey adjustment). (B) Mean ± SEM accumulative
  number of capsules produced per plant (N = 5, generalized linear model with polynomial fitting with four terms, followed by least square means for pairwise
  comparison with Tukey adjustment). (C) Proportion of capsules formed per total number of flowers per plant [N = 5, generalized linear model (quasi-binominal family)
  followed by a least square mean pairwise comparison]. Error bars of the boxplot in panel (C) indicate 1.5 times the interquartile range; boxes depict first and third
  quartiles. Different letters indicate significant differences (p < 0.05).

a similar percentage of emasculated flowers in the wind tunnel                         Fligner test comparison (with Holm adjustment) of the size of
(p = 0.1326 Holm-corrected Fisher’s exact test, Figure 2B).                            variances, a difference was found only between the pair Az–Ut2
We used the capsules formed by the approached flowers for                              (p = 0.022).
seed counts to estimate the output of M. sexta pollination on
emasculated flowers. Not all of the capsules contained fully                           Hand Pollination Experiments
formed seeds and the accessions differed in this percentage                            We compared the seed set of emasculated flowers hand pollinated
of capsules, where Az and Ut2 formed a significantly greater                           either with self pollen or with mix pollen containing all four
number of capsules containing seeds than Ca and Ut1 (Figure 2D                         accessions (Figure 4A). The number of seeds produced per
and Supplementary Table 1; Ca: 15.91%, Ut1: 21.43%, Az:                                capsule did not differ significantly between both treatments in
47.73%, and Ut2: 53.06%).                                                              Ca (p = 0.096), Ut1 (p = 0.680), and Ut2 (p = 0.449). Only
   To analyze the number of seeds per capsule that result from                         Az produced a significantly greater amount of seeds per capsule
M. sexta pollinations, we only used capsules containing fully                          when pollinated with mix pollen (p = 0.024). No significant
formed seeds. Capsules of Ut2 contained a greater number of                            difference was found for the variance size between accessions
seeds than Ca, Ut1, and Az, even though being only significantly                       either for self pollen or mix pollen with the Fligner tests
different with Az (Figure 2E and Supplementary Table 1). The                           (p = 0.6127 and p = 0.3775, respectively).
seed output presented a significant difference of the variance                            To assess possible pollen limitation resulting from the lack
size with the Fligner test (p = 0.0061). Followed by a pairwise                        of autogamous selfing, we used nonemasculated flowers. We

Frontiers in Ecology and Evolution | www.frontiersin.org                           8                                               July 2021 | Volume 9 | Article 680463
Bing et al.                                                                                                                         Floral Trait Variation and Reproduction

                                                                                               DISCUSSION
                                                                                               Specializing on a certain pollinator guild has been argued to
                                                                                               restrict the range distribution of a plant due to limited pollination
                                                                                               service outside the habitat of the optimal pollinators. Here,
                                                                                               we investigated this hypothesis for N. attenuata by measuring
                                                                                               flower traits and the ability for self-pollination and outcross
                                                                                               pollination in plant populations with full access to one of
                                                                                               their major pollinators and in a population at the edge of the
                                                                                               habitat of pollinators.
                                                                                                   Nicotiana attenuata is a plant species with high phenotypic
                                                                                               plasticity of floral traits involved in pollinator attraction (Kessler
                                                                                               et al., 2015; Zhou et al., 2017; Guo et al., 2020), and many of
                                                                                               its flower characteristics seem to point toward a specialization
                                                                                               for hawkmoth pollination. Previous studies have, for example,
                                                                                               shown that flowers of N. attenuata are synchronized in flower
                                                                                               opening, flower movement, and BA emission (Yon et al., 2017a;
                                                                                               Haverkamp et al., 2019) with the activity of M. sexta. Therefore,
                                                                                               the question can be raised if N. attenuata accessions varying in
                                                                                               the prediction of M. sexta occurrence differ in floral traits that
                                                                                               are playing a major role in the synchronization with the activity
                                                                                               period of the moth and its ability to perceive the flowers.
                                                                                                   Abiotic factors such as, for example, soil composition,
                                                                                               temperature, water, and light availability can influence plant
                                                                                               traits. Here, the accessions were grown under uniform conditions
                                                                                               in the greenhouse to focus on genetically fixed differences and
                                                                                               to avoid, e.g., herbivory, which has been shown to influence
                                                                                               flower phenology (Kessler et al., 2010). Nevertheless, the growing
                                                                                               conditions in the greenhouse differ from those in the natural
                                                                                               habitat of accessions (e.g., temperature, soil, light). To what
                                                                                               extent abiotic factors can alter traits that were measured in our
                                                                                               study is not known for N. attenuata, and our conclusions were
  FIGURE 4 | Seed output after natural selfing and hand pollination with self
  and mixed pollen. (A) Seed output of emasculated flowers hand pollinated
                                                                                               made based on the data collected from plants raised under the
  with self pollen (“self,” left box) or a pollen mixture of all four accessions (“mix,”       same conditions.
  right box). (B) Seed output of natural selfing flowers (autogamous selfing “as,”                 The floral volatile compound BA has been shown to be crucial
  right bars) in comparison with nonemasculated flowers hand pollinated with                   to ensure a successful plant–pollinator interaction between
  additional self pollen (selfing hand “hs,” left bars). Whiskers of the boxplots              N. attenuata and M. sexta, i.e., the presence of that compound
  indicate 1.5 times the interquartile range; boxes depict first and third quartiles;
  centerline indicates median. Statistics for both data sets were performed using
                                                                                               is not only necessary to enable the moth to remove the nectar
  a generalized linear model followed by a pairwise Wilcoxon test to compare                   from the flowers, but it also increases the female reproduction
  between both treatments of the same accession. Numbers below the x-axis                      success of the plant (Kessler et al., 2015; Haverkamp et al., 2016b).
  represent the number of replicates. Asterisks indicate statistically significant             Interestingly, BA, which is a species-specific volatile compound of
  differences (p < 0.05); dot indicates near statistically difference (p < 0.051).
                                                                                               N. attenuata (Euler and Baldwin, 1996; Guo et al., 2020), can be
                                                                                               perceived by the moth via olfactory receptors on its antennae but
                                                                                               furthermore through specific chemical receptors on its proboscis
compared the seed set between flowers allowed to naturally self                                (Haverkamp et al., 2016b). Thus, the presence of BA is not only
(autogamous selfing) and flowers supplemented with pollen of                                   important for long-distance attraction, but also increases flower
the same plant (selfing hand, Figure 4B). In Ut2 (p = 0.0173),                                 handling time. Flower handling time directly correlated with the
nonemasculated flowers additionally hand pollinated with self                                  foraging success of the moth and the reproductive output of the
pollen (selfing hand) showed a significantly greater seed set                                  plant in experiments were BA emissions had been genetically
compared with naturally selfing flowers (autogamous selfing),                                  silenced, but other flower traits were left unaltered (Haverkamp
whereas no difference was detected for Ca (p = 0.5714) and                                     et al., 2016b). Among the four N. attenuata accessions, BA
Az (p = 0.7857). In Ut1, we observed the same tendency as                                      emission ranged from high levels in Ut1 to no detectable emission
in Ut2, even though the difference between both treatments                                     for Ca (Figure 1E). Interestingly, Ca originated from a population
was not significant (p = 0.0503). No significant difference was                                at above 2,000 masl, where M. sexta is not expected to be present
found for the variance size between accessions either with self                                as a potential pollinator (Figure 2A). The lack of BA in Ca seems
pollen or mix pollen with the Fligner tests (p = 0.1699 and                                    to be associated with a lower foraging success (Supplementary
p = 0.9517, respectively).                                                                     Figure 2) and is to a certain degree also associated with a

Frontiers in Ecology and Evolution | www.frontiersin.org                                   9                                         July 2021 | Volume 9 | Article 680463
Bing et al. Floral Trait Variation and Reproduction
decreased reproductive success of flowers visited by M. sexta do not report such high proportions of sucrose for moth-
(Figures 2D,E). pollinated flowers (Galetto et al., 1998; Perret et al., 2001).
During foraging on N. attenuata flowers, M. sexta moths Differences in the perception of the nectar reward could then
are hovering in front of the flower and have to navigate their further impact the way moths learn and remember the flowers
approximately 7.5-cm-long proboscis (Haverkamp et al., 2016a) of a certain accession (Wright et al., 2009). In contrast to our
into the much shorter corolla tube for reaching the nectar at prediction, the largest volume of nectar was found in the Ca
its base (Figure 1B). This challenging task might be facilitated accession (Supplementary Figure 1); however, this nectar was
by a greater corolla limb area, which offers more surface for also the most diluted (Haverkamp et al., 2018), which might
the proboscis of the moth to land and, therefore, increases make these flowers less attractive to nectar-robbing carpenter
handling effectiveness (Deora et al., 2021). In our study, the bees, which often damage flowers during foraging (Kessler et al.,
flowers of Ut2 have the greatest corolla limb area (Figure 1A). 2008). Besides sugars, secondary metabolites are often found
Interestingly, Ut2 also had a relatively low flower handling in floral nectar and have been argued as a mechanism to
time (Figure 2C), while maintaining a relatively high foraging exclude unwanted flower visitors (van der Kooi et al., 2021).
success rate (Supplementary Figure 2). This suggests that the Nicotine is the most important defensive secondary metabolite
moths are able to handle these flowers rather effectively in in N. attenuata and is also found in the flower nectar; however,
spite of its low BA emissions (Figure 1E). In addition to the in a previous study, no differences in the nicotine concentration
corolla limb size, also the corolla tube length affects foraging between N. attenuata accessions were found (Haverkamp et al.,
efficiency in M. sexta. Haverkamp et al. (2016a) tested the 2018). In addition to this, many more secondary compounds
energy balance of M. sexta when foraging on flowers of different have been detected in the nectar of the Ut1 accession, some
Nicotiana species varying in corolla tube length. The results of of which differentially attracted or repelled hawkmoth and
this study revealed a close correlation between the energetic hummingbird pollinators (Kessler and Baldwin, 2007), and it
foraging costs and the match between the proboscis length to could be speculated that these compounds are also regulated as
the flower tube length, with better matching flowers leading an adaption to the local pollinator community.
to lower energetic costs. Consequently, it can be assumed that Assuming that N. attenuata is specialized on M. sexta
M. sexta would forage energetically and more efficiently on (Haverkamp et al., 2016b), plant populations at higher elevations,
N. attenuata accessions with longer corolla tubes. In our study, where the nights are colder and the warm periods are shorter,
flowers of the four accessions varied significantly in corolla tube face a dilemma concerning their reproductive strategy since
length (Figure 1B) with the shortest flowers being measured M. sexta moths require temperatures not lower than 12.5◦ C
for the accession originating from a population outside of the to fly (Heinrich, 1971). Under these circumstances, switching
M. sexta range prediction (Ca, Figure 2A). The longest flowers to generalist pollinators available during day time would be
were measured for Ut2, which does not only originate from a strategy to loosen the dependence on M. sexta. Alternative
a location with excellent prediction of M. sexta (Figure 2A) pollinators for N. attenuata are day-active bees (e.g., A. mellifera,
but also produced the highest seed set after M. sexta visitation “sweat bees” such as Lasioglossum spp.) or hummingbirds. When
in the wind tunnel (Figure 2E). In spite of its relatively using transgenic N. attenuata lines altered in circadian clock or
low BA emissions, the Ut2 accession might therefore be an in BA emission, hummingbirds were identified as pollen vectors
attractive flower for M. sexta due to its morphological properties, (Kessler et al., 2015; Yon et al., 2017b), showing the possibility
which likely facilitate a higher energy gain for the moths of N. attenuata to switch to these generalist pollinators. Most
during foraging. of these day-active pollinators have been observed to be able
After having successfully reached the flower nectar, its quality to access the flowers as soon as the corolla starts opening.
and quantity are being evaluated by taste receptors on the Additionally, H. lineata, a generalistic hawkmoth active at dusk,
proboscis and stretch receptors in the gut (Dethier, 1976). has been shown to pollinate N. attenuata flowers, although BA
The outcome of this assessment will decide whether the moth does not seem to be crucial in establishing the interaction with
will learn the particular flower and subsequently visit other H. lineata or hummingbirds (Kessler et al., 2015).
flowers of the same type. Hawkmoth pollination has often been The flowers of the Ca and Ut2 accessions open earlier during
linked to high sucrose concentrations in the nectar followed the day compared with those of Az and Ut1 (Figure 1F),
by a preference for fructose but not for glucose (Kelber, 2003). which might allow for an early recruitment of day pollinators.
Interestingly, sucrose amounts in the nectar of N. attenuata N. attenuata flowers already contain nectar before they are fully
were very low for all accessions in comparison with glucose and open and keep producing it throughout the night until 4 a.m.
fructose (Haverkamp et al., 2018). In spite of these low amounts, (Kessler, 2012). Although the timing of nectar production seems
we did find a tendency for higher sucrose concentrations in those to be synchronized with M. sexta activity period, due to the
accessions that occur in the range of M. sexta (Supplementary early nectar production, it is possible that hummingbirds visiting
Figure 1). Taste neurons on the moth proboscis respond to earlier open flowers, such as Ca and Ut2, would be rewarded.
sucrose concentration as low as ≤5 mM, potentially enabling Furthermore, Bhattacharya and Baldwin (2012) showed that the
the moths to discriminate between the nectar of the different stigma is already receptive to pollen before flowers are fully open
accessions tested here (Haverkamp et al., in prep.). Baker and in the evening. Thus, pollen deposited on the stigma during
Baker (1983) found sucrose contents of about 50% of the total the day could result in successful fertilization. We observed that
sugars in hawkmoth-pollinated flowers. Nonetheless, later studies hummingbirds and sweat bees can visit flowers shortly after they
Frontiers in Ecology and Evolution | www.frontiersin.org 10 July 2021 | Volume 9 | Article 680463Bing et al. Floral Trait Variation and Reproduction
start opening; subsequently, it could be assumed that flowers of When testing for the capacity for self-pollination, the flowers
Ca and Ut2 are accessible already in the morning hours, whereas of Ut1 and Ut2 produce less seeds in the absence of pollen
flowers of Ut1 and Az could be accessed from around 15 h supplementation (Figure 4B). One possible explanation for this
onwards (Figure 1F). However, it is unknown if flowers that are could be that autogamous selfing flowers are pollen limited.
less open are pollinated as efficiently as fully open flowers by In Ixiolirion songaricum, for example, the distance between the
the different day-active pollinators. At the time when M. sexta is anther and stigma has been shown to negatively correlate with
active, the flower opening is not different among the accessions autonomous self-pollen deposition on the stigma (Jia and Tan,
(Figure 1F); therefore, we would rather expect differences in 2012). Here, Ut2 has a protruding stigma (Figure 2C), which may
flower accessibility for day pollinators such as sweat bees and limit the ability to autogamously self-pollinate. An alternative
hummingbirds. Whether accessions whose flowers open earlier hypothesis for the difference in seed set between autogamous
(Ut2, Ca) really benefit from early visitations during the day selfing and pollen supplementation could be that flowers of Ut1
remains to be tested. and Ut2 only invest in realizing their full reproductive potential
Plants of the Az accession start earlier to produce flowers when flowers have been visited. For example, flowers of Heliconia
and seed capsules and, furthermore, show the highest flower- tortuosa use the capacity of tropical hummingbirds to extract
to-capsule ratio in the absence of pollen vectors (Figure 3C). nectar as a cue to turn on their reproduction (Betts et al., 2015).
The flowers of Az invest more into seed production in the When using emasculated flowers, subsequently disabling
presence of outcross pollen, resulting in a higher seed set the possibility of flowers to autonomously self-pollinate, Ut2
(Figure 4A). The same is observed for Ca flowers that show produces the greatest number of seeds after visitation by a moth
a similar tendency for investing into a higher seed production carrying pollen on the proboscis (Figure 2E). The protruding
when outcross pollen is present (Figure 4A). This opportunistic position of the stigma of Ut2 compared to a location inside
behavior might optimize the reproduction cost of the plant by the corolla tube (Ut1, Ca, Az; Figure 1C) might enhance
investing more only in the presence of outcross pollen. This the possibility of successful pollen deposition by pollinators,
could be beneficial, since not every pollinator visit might result particularly with pollinators that do not dive inside the flower.
in the deposition of outcross pollen but rather in the transfer Furthermore, this exposes the stigma to receive outcross pollen
of pollen from flowers within the same plant (geitonogamy). instead of self-pollen after the foraging interaction. The fact that
Especially if outcrossing occurs only occasionally, resources can flowers of Ut2 open earlier during the day (Figure 1F) could
be saved by investing not all energy in every flower, but rather increase the chance to receive outcross pollen by both day and
in those that contribute to a greater genetic diversity of the night pollinators.
offspring. Opposite to that, Ut1 and Ut2 seem to always invest Besides the differences found in floral traits that can indicate
in seed production (Figure 4A). This strategy would make certain local adaptations, the variance range of the plant traits
sense, if an ample abundance of pollinators can be expected can give us information about the degeneration by drift of a
that provide the flower with outcross pollen. This might be particular trait. Higher trait variation will relate to either release
true for Ut1 and Ut2 since previous studies performing field from pollinator-mediated selection or a switch to generalist
experiments with N. attenuata plants in Utah have identified pollinators that do not necessarily impose selective pressure
outcrossing rates of above 30% (Sime and Baldwin, 2003; Kessler in a particular direction for a plant trait. In our analysis of
et al., 2008, 2012). The pollination service of hummingbirds variance range, we found almost no difference with the exception
might be restricted, for example by requirements such as nesting of the seed output after M. sexta interaction. Based on the
sites, and also most bees forage within a small radius, whereas presented results, we cannot conclude that the floral traits
hawkmoths are assumed to travel over long distances (Kawahara degenerate by drift of pollinator release or multidirectional
et al., 2013). It could be speculated that bees and hummingbirds generalist pollinator pressures.
might provide mainly pollination service within plants due to Spatial (and temporal) variation in plant and pollinator traits
visiting multiple flowers on the same plant. Pollinators who visit as well as abundance can result in a geographic mosaic of
multiple flowers within one plant might mainly contribute to coevolution, and previous studies have reported geographic
geitonogamy instead of transferring pollen between conspecific covariation of different flower and pollinator traits (e.g.,
plants (Vaughton and Ramsey, 2010; Sukumaran et al., 2020). In Thompson and Cunningham, 2002; Anderson and Johnson,
other words, they may be efficient pollinators from a quantity, 2008; Brown et al., 2011; Gross et al., 2016). In N. attenuata,
but not necessarily from a quality perspective. Previous studies variation in flower angle (Yon et al., 2017b; Haverkamp et al.,
have shown that in N. attenuata, despite being a self-compatible 2019), flower opening (Figure 1F), and the specific volatile
species, not all pollen donors have the same chance of siring compound BA (Haverkamp et al., 2018, Figure 1E) might act
seeds and there are variations in mate selection preferences as a pollinator filter, with the result that certain accessions are
between accessions (Bhattacharya and Baldwin, 2012; Guo et al., more specialized toward M. sexta pollination than others as
2019). Given that, some pollinators might transfer pollen loads a local adaptation to the pollinator community. Besides BA
of high intraspecific diversity and therefore contribute more to emission (Figure 1E), M. sexta foraging success (Supplementary
a diverse pool of pollen mates available for competition on the Figure 2) and the reproductive success of the plant resulting from
stigma. It still remains to be tested to which extent M. sexta and M. sexta visitation (Figures 2D,E) indicate specialization. Despite
the other pollinators really contribute to outcrossing, and not its interaction with a broad pollinator community and its self-
only geitonogamy. pollination assurance, certain N. attenuata accessions (Ut1, Ut2,
Frontiers in Ecology and Evolution | www.frontiersin.org 11 July 2021 | Volume 9 | Article 680463Bing et al. Floral Trait Variation and Reproduction
and Az) seem to be more specialized by exploiting the sensory ACKNOWLEDGMENTS
abilities of M. sexta. Whether a specialization of N. attenuata
accessions toward M. sexta pollination could also entail the We are grateful to Danny Kessler for fruitful discussions.
possibility of receiving pollen loads of high intraspecific diversity, Furthermore, we want to thank Sascha Bucks for his
thus offering the stigma a broader pool of mates to choose from, support in maintaining the insect colony and the
remains to be tested in further studies. glasshouse team of the MPICE for maintaining the different
Taken together, our study highlights how the ability of a plant lines.
plant species to adapt to the sensory bias of the local pollinator
community or to resort to self-pollination might be crucial in
determining the geographic range of a particular plant species. SUPPLEMENTARY MATERIAL
Gathering more knowledge of population-specific differences
in the communication between flowers and pollinators might The Supplementary Material for this article can be found
therefore be of the highest importance for the conservation of online at: https://www.frontiersin.org/articles/10.3389/fevo.2021.
both plant and insect species across habitats. 680463/full#supplementary-material
Supplementary Figure 1 | Nectar properties of four Nicotiana attenuata
accessions. (A) Boxplot showing the nectar amount (p < 0.0001). (B) Boxplot of
DATA AVAILABILITY STATEMENT the amount of glucose in the nectar (F = 5.9857, p = 0.0044). (C) Boxplot of
fructose amount in the nectar (F = 6.4211, p = 0.0031). (D) Boxplot showing the
amount of sucrose in the nectar (F = 4.6708, p = 0.0139). Numbers below plot D
The raw data supporting the conclusions of this article will be
represent replicate numbers for all nectar property measurements. Boxplots show
made available by the authors, without undue reservation. the median, the 3rd and 4th quartile as well as the interquartile range. All data was
analyzed using GLM followed by post hoc HSD with Holm adjustment. Letters
indicate significant differences (p < 0.05).
AUTHOR CONTRIBUTIONS Supplementary Figure 2 | Manduca sexta foraging success on four N. attenuata
accessions. Plot shows the percentage of flowers on which M. sexta foraged
AH, FY, JB, and XL performed the experiments and analyzed successfully. Data was analyzed with GLM with a binomial family logit type for
binary data, followed by a pairwise comparison of marginal means. Asterisks
the results. JB and FY wrote the first draft of the manuscript. indicate statistically significant differences (p < 0.05), dot indicates p < 0.1.
All authors contributed to the revision and experimental
design of the study. Supplementary Table 1 | P-values after multicomparison of flower morphology
and opening, as well as flower and capsule production after Manduca sexta
visitation and flower contact time. Asterisks indicate statistically significant
differences (* = pYou can also read