LATEST DEVELOPMENTS IN STEELMAKING CAPACITY 2020 - OECD
←
→
Page content transcription
If your browser does not render page correctly, please read the page content below
LATEST DEVELOPMENTS
IN STEELMAKING CAPACITY
2020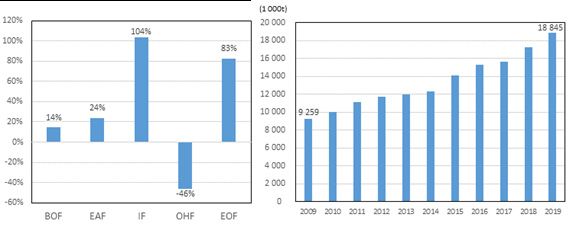
2 | LATEST DEVELOPMENTS IN STEELMAKING CAPACITY

This report was approved and declassified by written procedure by the OECD Steel Committee on 22 May
2020 and prepared for publication by the OECD Secretariat. The report and the underlying data on
steelmaking capacity for all steel producing economies will be made available on the Steel Committee
website: oe.cd/steelcapacity

                                          Note to Delegations:
                   This document is also available on O.N.E under the reference code:
                                        DSTI/SC(2020)3/FINAL

This document, as well as any data and any map included herein, are without prejudice to the status of or
sovereignty over any territory, to the delimitation of international frontiers and boundaries and to the name
of any territory, city or area.

© OECD 2020

You can copy, download or print OECD content for your own use, and you can include excerpts from
OECD publications, databases and multimedia products in your own documents, presentations, blogs,
websites and teaching materials, provided that suitable acknowledgment of OECD as source and
copyright owner is given. All requests for commercial use and translation rights should be submitted to
rights@oecd.org
LATEST DEVELOPMENTS IN STEELMAKING CAPACITY |3
Latest developments in steelmaking capacity
Tomohiro HIJIKATA
OECD Paris
ABSTRACT
The Secretariat of the OECD Steel Committee provides monitoring reports on crude
steelmaking capacity developments on a regular basis, using a wide range of publicly
available and commercial data sources. This paper presents an updated overview of
regional capacity trends, including an assessment of gross capacity additions in the period
until 2022, as well as information on cross-border capacity investments. The latest available
data suggest that global steelmaking capacity (in nominal crude terms) increased in 2019
by 1.5% from the levels of 2018. Moreover, many investment projects continue to take
place around the world and others are in the planning stages. Should these projects be
realized, global steelmaking capacity could increase by approximately 2-3% between 2020
and 2022 in the absence of closures. In the context of global excess capacity, it will be
important for policymakers to continue closely monitoring investments and closures that
take place in the steel industry.4 | LATEST DEVELOPMENTS IN STEELMAKING CAPACITY
Table of Contents
Latest developments in steelmaking capacity ..................................................................................... 3
1. Summary of the latest steelmaking capacity developments........................................................... 6
2. The latest developments in global steelmaking capacity ................................................................ 9
2.1. Global summary ............................................................................................................................ 9
2.2. Regional capacity developments................................................................................................... 9
2.3. The gap between global capacity and production ....................................................................... 11
3. A review of regional capacity developments ................................................................................. 12
3.1. Africa .......................................................................................................................................... 12
3.2. Asia and Oceania ........................................................................................................................ 12
3.3. CIS .............................................................................................................................................. 16
3.4. Europe ......................................................................................................................................... 16
3.5. Latin America ............................................................................................................................. 16
3.6. Middle East ................................................................................................................................. 17
3.7. NAFTA ....................................................................................................................................... 18
4. The latest developments in cross-border investments .................................................................. 19
Annex A. AVAILABLE EVIDENCE OF PLANT LEVEL INVESTMENTS AND OWNERS .. 22
Annex B. AVAILABLE EVIDENCE OF PLANT LEVEL CLOSURES ...................................... 31
Annex C. STEELMAKING CAPACITY DATA BY ECONOMY ................................................. 32
Annex D. DATA FOR GLOBAL CRUDE STEELMAKING CAPACITY AND CRUDE
STEEL PRODUCTION ...................................................................................................................... 37
Annex E. GLOBAL STEELMAKING CAPACITY OF INDUCTION FURNACES (IF) ........... 38
What is an IF? .................................................................................................................................... 38
Global IF capacities ........................................................................................................................... 38
Regional developments in IF capacities ............................................................................................ 40
The possible transfer of induction furnaces overseas ........................................................................ 41
Annex F. WORKING DEFINITION USED ..................................................................................... 44
Steelmaking capacity ......................................................................................................................... 44
Steelmaking equipment...................................................................................................................... 44
Assessing capacity developments ...................................................................................................... 44
Steelmaking capacity closures ........................................................................................................... 45
References ............................................................................................................................................ 46
Endnotes ............................................................................................................................................... 54
Tables
Table 1. Current nominal capacity and potential gross capacity additions by region ........................................ 10
Table 2. Domestic and cross-border investments in new steelmaking capacity projects................................... 20
Table 3. Cross-border and joint venture investments in new steelmaking capacity projects .............................. 21LATEST DEVELOPMENTS IN STEELMAKING CAPACITY |5
Table 4. Investment data ........................................................................................................................... 22
Table 5. Closure data................................................................................................................................ 31
Table 6. Crude Steelmaking capacity developments (in mmt) ....................................................................... 32
Table 7. Global crude steelmaking capacity and crude steel production (data from 2000) ................................ 37
Table 8. Unofficial estimates of steelmaking IF capacities in ASEAN ............................................................. 41
Figures
Figure 1. Revisions to steelmaking capacity .................................................................................................. 8
Figure 2. Evolution of crude steelmaking capacity in OECD/EU economies and non OECD/EU economies ........ 9
Figure 3. Global crude steelmaking capacity and crude steel production ........................................................ 11
Figure 4. The share of domestic and cross-border investments in new steelmaking capacity projects underway
or planned for 2019 or later ............................................................................................................... 19
Figure 5. Classification of major steelmaking processes ............................................................................... 38
Figure 6. Global expansion of steelmaking IF capacity (excluding China) ....................................................... 39
Figure 7. IF steelmaking capacity by region and economy (except China and ASEAN*) ................................. 40
Figure 8. Export of furnaces....................................................................................................................... 43
Boxes
Box 1. Revisions to the capacity aggregates based on the plant-level database ............................................... 7
Box 2. Actions for the elimination of illegal IF capacities in China .................................................................. 13
Box 3. IFs in ASEAN ................................................................................................................................. 416 | LATEST DEVELOPMENTS IN STEELMAKING CAPACITY
1. Summary of the latest steelmaking capacity developments
The Secretariat of the OECD Steel Committee provides monitoring reports on crude
steelmaking capacity developments to members of the Committee on a regular basis. The
Secretariat monitors capacity developments on an ongoing basis and updates its capacity
figures to reflect incoming publicly available information on capacity closures and new
information on the status of investment projects.
This paper presents an overview of steelmaking capacity developments taking place around
the world and provides an assessment of gross capacity additions that could come on stream
during the three-year period 2020-22, based on information available until December
2019 1. The document also includes a brief summary by region, identifying closures of
capacity and new investment projects, as well as information on cross-border capacity
investments. The latest available data suggest that global steelmaking capacity (in nominal
crude terms) increased in 2019 by 1.5% from the levels of 2018. Moreover, many
investment projects continue to take place around the world and others are in the planning
stages. Should these projects be realized, global steelmaking capacity could increase by
approximately 2-3% between 2020 and 2022 in the absence of closures. In the context of
global excess capacity, it will be important for policymakers to continue closely monitoring
investments and closures that take place in the steel industry.
The Secretariat has been working on the construction of a crude steelmaking capacity
database at the plant and firm level, in the context of Output Result 1.2.5.5.1 of the Steel
Committee’s 2019-20 Programme of Work and Budget that is helping to improve the
quality of the capacity aggregates by economy. The coverage of the database has increased
significantly since the interim capacity report discussed by the Steel Committee in
September 2019, particularly with the coverage now extending to include China but also
major steel-producing economies elsewhere in Asia, the Middle East, and other regions.
Because the plant-level data are used as the basis for the aggregate figures, this work is
leading to revisions in the aggregate figures for some economies and globally (see Box 1).
This report has been revised to take into account written comments from delegations
received until 10 April on the original version of the paper. As in the past, the Secretariat
invited comments from Steel Committee delegates on the original version of the report, and
in particular the investment, closure and existing capacity data provided in Annexes A-C.
This revised report is now submitted for declassification by the Steel Committee. Following
its declassification, the report will be made available on the OECD Steelmaking Capacity
portal at oe.cd/steelcapacity, and the updated aggregate capacity figures will be made
available on OECD.stat.LATEST DEVELOPMENTS IN STEELMAKING CAPACITY |7 Box 1. Revisions to the capacity aggregates based on the plant-level database The Secretariat has been working on the construction of a crude steelmaking capacity database at the plant and firm level, in the context of Output Result 1.2.5.5.1 of the Steel Committee’s 2019-20 PWB that is helping to improve the quality of the capacity aggregates by economy. The database, which uses a wide range of publicly available and commercial data sources, extends back to the year 2000. The database currently includes steel-producing economies that together account for 88% of global capacity, although it is important to note that the global capacity figure can change as more countries are added to the database. While the plant-level database currently includes major steel- producing economies including China, most OECD countries, and countries with steelmaking capacity across Africa, Latin America, the Middle East and Oceania, several important economies still need to be added to the database. These include India, Indonesia, Malaysia, Thailand, Turkey, as well as several smaller countries that have crude steelmaking capacity (see document DSTI/SC(2020)5 for further information on the current status and coverage of the database). The Secretariat plans to include the remaining major steel-producing countries into the database by September 2020, with the smaller countries to be added by the end of the year. The in-depth plant-level analysis conducted by the Secretariat now provides a more complete picture about capacity developments for economies. As the plant-level data become available, they are used to derive the aggregate capacity figures for the relevant economy. Aggregate figures for some economies, based on plant-level data, have already been introduced in previous steelmaking capacity reports since 2018, as the information became available in plant-level database. The plant-level data are also updated on a continuous basis, and thus the aggregates for those economies can also undergo revision from time to time. The major change in this report is the inclusion of plant-level data for China, several OECD countries in Asia and the NAFTA region, and for economies in the Middle East. As a result of the analysis, the aggregate steelmaking capacity figure for China was revised upwards by 96 mmt for 2019, compared to the September 2019 estimate, with more minor revisions being made to the aggregate figures for Japan, Korea, Mexico, the United States and some countries in the Middle East including Iran and Saudi Arabia. The global capacity figure for 2019 was revised upward by 72 mmt, with the upward revision China being partly offset by downward revisions in several other economies. As the plant-level data extend back to 2000, revisions were made to capacity aggregates going back in time, where necessary. Figure 1 shows the revisions for the last five years, indicating the difference (in mmt) between the March 2020 estimates and the estimates presented to the Steel Committee in September 2019 for the OECD, non-OECD and world capacity aggregates. As shown in the figure, major revisions were made to the non-OECD aggregate, reflecting the upward revision to Chinese capacity which averaged slightly more than 100 mmt per annum since 2015. This was partially offset by downward revisions mainly in non-OECD Middle East and CIS economies. The OECD aggregate was revised downwards by an average of 3 mmt per annum during the period, reflecting higher figures for some years within NAFTA and Japan that were more than offset by lower figures for Korea.
8 | LATEST DEVELOPMENTS IN STEELMAKING CAPACITY

       The revisions made to country aggregates after taking into account the plant-level
       information are due to the availability of more complete information. For China, the
       aggregate capacity levels were previously based on the aggregate figures published by
       official sources, complemented with more recent information collected by the Secretariat
       on closures and new capacity additions. The aggregate for China is now based solely on
       the sum of all the plants in existence for which information is available to the Secretariat.
       Similarly, for some other countries, previously available aggregate figures (provided
       earlier by delegations themselves or published by e.g. national steel associations) were
       complemented with more recent information on closures and new additions to derive
       aggregate figures for subsequent years. For those countries, too, the aggregate figures
       now reflect the population of plants in existence for which information is available to the
       Secretariat.

                            Figure 1. Revisions to steelmaking capacity
                         Difference between March 2020 and September 2019 estimates

                   140

                   120

                   100

                    80
                                                                                      OECD
             mmt

                    60
                                                                                      Non-OECD
                    40
                                                                                      Global
                    20

                     0

                   -20
                         2015      2016       2017       2018       2019

       Source: OECD.
LATEST DEVELOPMENTS IN STEELMAKING CAPACITY |9
2. The latest developments in global steelmaking capacity
2.1. Global summary
Global steelmaking capacity (in nominal crude terms) decreased from 2015 to 2018, but
the latest available information (as of December 2019) suggests that capacity increased in
2019 for the first time since 2014 (Figure 2). The OECD has revised its 2019 figures for
global steelmaking capacity to 2 362.5 million metric tonnes (mmt) to incorporate new
information on closures that was not previously available as well as updated information
on the status of certain investment projects. 2 Moreover, revisions to the aggregate capacity
figures for the People’s Republic of China (hereafter “China”), the United States, Mexico,
Japan, Korea, and several other economies on the basis of the plant and firm level data
contributed to the upward revision of the global steelmaking capacity figure for 2019 3 and
in previous years. The net capacity change in 2019, taking into account new capacity
additions and closures, brings current global steelmaking capacity up to 2 362.5 mmt,
representing a 1.5% increase from the level at the end of 2018.
Figure 2. Evolution of crude steelmaking capacity in OECD/EU economies and non OECD/EU
economies
A. Level (mmt) B. Annual % change
Note: Capacity data reflect information available to December 2019.
Source: OECD
2.2. Regional capacity developments
2.2.1. Latest developments
Table 1 provides recent capacity developments by region and presents potential additions
of capacity over the next three years. In 2019, most of the capacity additions took place in
Asia, where an additional 30.4 mmt of capacity (+1.9%) was deployed in 2019.
Steelmaking capacity also increased in Africa (2.4 mmt, i.e. 5.9%), the CIS (1.5 mmt, i.e.
1.1%), Europe (0.7 mmt, i.e. 0.3%) and the Middle East (2.8 mmt, i.e. 4.5%) On the other
hand, steelmaking capacity in the North American Free Trade Agreement (NAFTA) region10 | LATEST DEVELOPMENTS IN STEELMAKING CAPACITY
decreased in 2019, doing so by 3.8 mmt (-2.5%). In the Latin America and Oceania regions,
neither new investments nor permanent closures were observed during 2019 from the
sources used to update the OECD’s capacity monitoring databases.
Table 1. Current nominal capacity and potential gross capacity additions by region
Potential gross capacity % change
nominal nominal % Capacity in 2022
additions in 2020-22 expected
capacity(mmt) capacity(mmt) change (mmt)
(mmt) (2019 vs 2022)
2018 2019 2019- Underway Planned Low High Low High
(A) 2018 (B) (C) (A)+(B) (A)+(B)+(C)
Africa 41.4 43.9 5.9% 1.9 0.8 45.7 46.5 4.2% 6.0%
Asia 1 574.4 1 604.8 1.9% 27.7 3.0 1 632.5 1 635.5 1.7% 1.9%
CIS 139.3 140.8 1.1% 1.9 3.2 142.7 145.9 1.3% 3.6%
Europe 274.0 274.7 0.3% 3.7 0.0 278.4 278.4 1.3% 1.3%
EU 216.4 216.4 0.0% 0.2 0.0 216.7 216.7 0.1% 0.1%
Other Europe 57.5 58.2 1.2% 3.5 0.0 61.7 61.7 6.0% 6.0%
Latin America 74.2 74.2 0.0% 0.2 1.3 74.4 75.7 0.3% 1.9%
Middle East 62.3 65.1 4.5% 19.6 6.0 84.7 90.6 30.1% 39.3%
NAFTA 156.5 152.6 -2.5% 3.3 5.9 155.9 161.8 2.1% 6.0%
Oceania 6.4 6.4 0.0% 0.0 0.0 6.4 6.4 0.0% 0.0%
OECD/EU 644.6 641.4 -0.5% 7.0 5.9 648.4 654.3 1.1% 2.0%
economies
Total
Non OECD/EU 1 683.9 1 721.1 2.2% 51.2 14.2 1 772.2 1 786.4 3.0% 3.8%
economies
Total
World Total 2 328.4 2 362.5 1.5% 58.2 20.1 2 420.6 2 440.8 2.5% 3.3%
Note: Capacity data reflects all information on changes up to December 2019. In the table, "Europe" includes
both OECD/EU economies and non OECD/EU economies in Europe, as well as Turkey. Please see Annex C
for the detailed capacity data by economy. The European Union (EU) is a member of the Steel Committee and
accordingly this data includes all EU Member States.
Source: OECD
2.2.2. Gross capacity additions expected in 2020-2022
Information on announced investment projects suggests that, globally, 58.2 mmt of gross
capacity additions are currently underway and could come on stream during the three-year
period of 2020-22. An additional 20.1 mmt of capacity additions are currently in the
planning stages for possible start-up during the same period (see Table 1).
In particular, Asia and the Middle East region may experience a considerable increase in
steelmaking capacity over the next few years if all the projects current under way or planned
are ultimately realised. Over 27 mmt and 19 mmt of gross capacity additions are currently
underway for start-up during 2020-22 in Asia and the Middle East region, respectively,
with an additional 3.0 mmt and 6.0 mmt in the planning stages in these regions,
respectively. Europe, NAFTA, Africa, the CIS, and Latin America could also see an
increase in capacity, with 3.7 mmt, 3.3 mmt, 1.9 mmt, 1.9 mmt and 0.2 mmt of gross
additions currently underway in each region, respectively. Additionally, there are plans in
each of these regions to add several million tonnes of capacity during the 2020-22 period.
Currently, there are no capacity investment projects in Oceania.LATEST DEVELOPMENTS IN STEELMAKING CAPACITY | 11
2.3. The gap between global capacity and production
The gap between global capacity and production narrowed between 2016 and 2019 as a
result of the slight decrease in global crude steelmaking capacity (i.e. by -0.2% from 2016
to 2019) and the increase in world steel production (13.6% in the same period). In 2019,
global capacity was 2 362.5 mmt and production was 1 848.5 mmt, with the gap between
the two falling to 513.9 mmt in 2019, from 520.0 mmt in 2018 (Figure 3.A). World steel
production as a share of capacity has risen slightly, from 77.7% in 2018 to approximately
78.2% in 2019 (Figure 3.B).
Figure 3. Global crude steelmaking capacity and crude steel production
A. Capacity-Production gap (mmt) B. Crude steel production as a % of capacity
mmt Capacity-Production Gap (RHS) Capacity (LHS) Production (LHS) mmt Crude steel production as a % of capacity
2 500 1 500 100%
90%
1 250 80%
2 000
70%
1 000
1 500 60%
750 50%
1 000 40%
500 30%
500 20%
250
10%
0 0 0%
Note: Capacity data reflect information up to December 2019. Annual production data for 2019 are based on
the press release of 27 January 2020 by the World Steel Association (World Steel Association, 2020[1]). Annual
production data from 2000 to 2018 are from “Steel Statistical Yearbook 2019”, published by the World Steel
Association. See Annex D for a table with data on global crude steelmaking capacity and production from 2000
to 2019 (World Steel Association, 2019[2]).
Source: OECD for capacity and World Steel Association for production.12 | LATEST DEVELOPMENTS IN STEELMAKING CAPACITY
3. A review of regional capacity developments
3.1. Africa
Several new investment projects are already underway or planned in Africa, mainly in
North African economies. As a result, steelmaking capacity in Africa could grow from 43.9
mmt in 2019 to 45.7 mmt in 2022 (+4.2%), in view of projects that are already underway.
Qatari Steel (AQS), which is a joint venture between Algeria’s IMETAL and Qatar’s Qatar
Steel, started to operate a new Electric Arc Furnace (EAF) plant in Algeria with a capacity
of 2.2 mmt in November of 2019 (Metal Expert, 2019[3]). Morocco’s Riva Industries has
plans to install a new EAF with a capacity of 0.8 mmt, which are scheduled to begin
operation in 2020 (Metal Expert, 2019[4]). In addition, Namibia's Groot Group started the
construction of the country’s first steelmaking plant with a capacity of 1.0 mm in the
Ohangwena region, which is planned to be completed in 2022 (Metal Expert, 2020[5]).
Some new capacity installations are, however, facing delays in the region. The new EAF
facility which was planned to be built by Algeria’s ETRHB in 2020 has been delayed due
to internal issues (Metal Expert, 2019[6]). Also, Egypt’s Ezz Rolling Mills (ERM)
postponed the start of the operations of a new EAF plant with capacity of 0.85 mmt from
2019 to 2020 (Metal Expert, 2020[7]).
3.2. Asia and Oceania
Steelmaking capacity in Asia increased by 30.4 mmt to 1 604.8 mmt in 2019 (+1.9%), after
declining between 2015 and 2018. In addition, there are several investment projects
underway or planned which are expected to become operational during the period 2020-
2022. The projects that are now underway could add an additional 27.7 mmt of steelmaking
capacity by 2022 (in gross terms), bringing Asia’s total capacity to 1 632.5 mmt (+1.7%)
in the absence of closures. No new investments are underway or planned in Oceania,
according to information from the publicly available sources used to update the OECD’s
monitoring databases.
Steelmaking capacity in China has declined significantly in recent years. OECD data, as
reported in Annex C, show that capacity in China fell by 87.0 mmt between 2016 and 2018.
Government documents report that capacity reductions are taking place in line with the
targets set (NDRC, 2019[8]) and that efforts continued in 2019 (NDRC, 2019[9]). For
example, the Hebei provincial government, China’s largest steel producing province, has
announced targets for reducing steelmaking capacity by an additional 14 mmt per year in
2019 and 2020 (a total of 28 mmt of steelmaking capacity over the two years) on top of the
already achieved targets (Hebei Metallurgical Industry Association, 2019[10]). 4
As described in the last document covering steelmaking capacity developments
[DSTI/SC(2019)12/REV1], closures of illegal induction furnace equipment (IF) not
accounted for in the official steelmaking capacity statistics were reported to have reached
around 140 mmt (MIIT, 2018[11]). However, since almost all of these induction furnaces
operated illegally, official steelmaking capacity figures did not exist when they operated.
It is extremely difficutl to verify these figures because, to the Secretariat’s knowledge, there
are no other sources of hard data for capacity reductions of induction furnaces to compare
and verify this number with. Box 2, which updates the information provided in the last
document on steelmaking capacity developments, overviews actions reportedly taken forLATEST DEVELOPMENTS IN STEELMAKING CAPACITY | 13
the elimination of illegal IF capacity and Annex E provides detailed information and
updates on global IF steelmaking capacities.
Box 2. Actions for the elimination of illegal IF capacities in China
China has reportedly made many efforts to close illegal induction furnace (IF) steelmaking
capacity. According to the definition used by the Chinese government since 2002, these IF
steel production units, called “ditiaogang (地条钢)”in Chinese, which melt ferrous scrap
to produce steel, do not allow for effective control over the chemical composition and
quality of the steel produced. Furthermore, these IF producers usually do not have refining
and quality inspection equipment. Therefore, the steel produced can raise a number of
quality-related concerns, notably if their output is branded and sold as quality steel
products.
According to China Iron and Steel Association (CISA) guidelines, only three uses of IFs
are deemed legal: i) casting, ii) making high-quality steel and ferroalloys with specific
properties, and iii) stainless and high-alloy steelmaking. CISA has proposed that any IF
producers which are not included in these categories should be categorised as “ditiaogang”,
and should be eliminated, regardless of whether the IF is new, whether the IF producers
have equipment for environmental protection, and regardless of the scale of the company
(CISA, 2017).
The Chinese Ministry of Industry and Information Technology (MIIT) reported that China
had eliminated 140 mmt of “ditiaogang” capacities in 2017 (MIIT, 2018). Moreover, the
National Development and Reform Commission (NDRC) reportedly carried out
nationwide inspections in May and June 2018 to ensure the effective closure of these
capacities, including by preventing them from restarting operations and enforcing the
elimination of closed IFs (NDRC, 2019a). Furthermore, NDRC reports that it carried out
inspections to prevent the re-start of IFs in Guizhou and Yunnan provinces in September
2019 (NDRC, 2019[12]).
There are a number of new investments in greenfield projects, most of which are related to
China’s replacement measures for outdated and small steel plants, especially in the eastern
and southern coastal areas of China (OECD, 2019[13]). These investments are aimed at
facilitating access to imported raw materials, as well as enabling the production of high
value-added steel products to meet demand for flat products in, for example, the automotive
and home appliance industries. 5
With regard to investments in BOF capacity, Shandong Iron and Steel Group has
commissioned new BOF facilities with a capacity of 4.36 mmt at the Rizhao steelworks, in
Shandong province (Platts, 2019[14]). In addition, Shougang Group completed an expansion
project in its subsidiary, Shougang Jingtang United Iron and Steel (Shougang Jingtang).
This project entails the installation of BOF facilities with a capacity of 4.0 mmt in
Caofeidan port, Hebei province (Platts, 2019[14]). Moreover, Guangxi Liuzhou Iron and
Steel Group commissioned new BOF facilities with capacity of 14.7 mmt in the coastal city
of Fangchenggang, in Guangxi province (Guangxi Liuzhou Iron and Steel, 2019[15]). In
addition, Liu'an Steel Holdings in Anhui province installed a new BOF mill with a capacity
of 3.2 mmt (Platts, 2019[16]). In March 2019, Baosteel Zhanjiang Iron and Steel has started14 | LATEST DEVELOPMENTS IN STEELMAKING CAPACITY
the expansion of its BOF steelmaking capacity by an additional 3.6 mmt, which is
scheduled to become operational in March 2021 (ME, 2018[17]).
With regard to investments in EAF capacity, Fujian Dingsheng Iron and Steel is building
an EAF facility with capacity of 1.725 mmt that will be operational in 2020 (Henan
Province SME Public Platform, 2019[18]).
In addition to these projects, there are a number of projects reported in the interim capacity
report [DSTI/SC(2019)12/REV1] which were originally planned to start operations in
2019, but the Secretariat has not yet been able to confirm the start of operations at these
plants. These include: HBIS Laoting Steel with BOF capacity of 7.47 mmt, Shanxi Jinnan
Iron and Steel with BOF capacity of 3.4 mmt, Shaanxi Hanzhong Iron and Steel with EAF
capacity of 0.7 mmt, as well as Yaan Anshan Iron and Steel with EAF capacity of 0.83
mmt. 6
In November 2019, China’s National Development and Reform Commission, the Ministry
of Industry and Information Transformation, and the National Bureau of Statistics jointly
issued a notice requiring steel companies via local governments to conduct a study and
submit a report on the capacity status and production changes in their facilities over the last
three years. The aim of this investigation was to review the changes in capacity and
equipment in China’s steel sector since 2016, according to the notice. In these reports,
causes should be analysed for steel companies that have changes in production capacity,
growth in production volume of more than 10% in the first nine months of 2019, year-on-
year, or whose production capacity utilisation rate in the first nine months of 2019 reached
more than 100%. Indeed, information in the notice revealed that utilisation rates at some
steel companies had soared to over 150% in 2019 (Reuters, 2020[19]).
The China Iron and Steel Association (CISA) has noted that stronger-than-expected growth
in real estate activity was the main driver of steel demand growth in 2019, while also noting
that China's steel demand would plateau over the longer term. As such, CISA warned about
the risks of over-investment in the steel sector and associated industries (Platts, 2019[20]).
Steelmaking capacity in India has been expanding rapidly in recent years, and the country
has recently become the second largest economy in terms of capacity. Further growth is
expected in the short and medium term to meet steel demand for infrastructure projects.
For example, the National Mineral Development Corporation (NMDC) is constructing a
greenfield steelworks in the state of Chhattisgarh, with BOF capacity of 3 mmt, scheduled
to become operational in 2020 (Metal Expert, 2019[21]). JSW Steel is proceeding with an
expansion project of BOF facilities at its Dolvi works in Maharashtra, which is expected to
add 5.0 mmt of capacity by 2020 (JSW Steel, 2019[22]). JSW Steel has plans for other
greenfield projects in India to achieve additional capacity totalling 45 mmt in the period
until 2031, but further details are not available yet (JSW Steel, 2019[22]). In addition, Tata
Steel also started construction of an expansion project at its Kalinganagar works in Odisha
that will add 5.0 mmt BOF of capacity by 2022 (Tata Steel, 2019[23]). Luxembourg’s
ArcelorMittal has a plan to establish a greenfield steel mill in the state of Karnataka, with
a capacity of 6.0 mmt, but the construction schedule as well as the steelmaking technology
are still unknown. 7 Overall, India may see its capacity possibly reaching 142.1 mmt by
2022, based on projects currently underway (i.e., not including planned projects) and in the
absence of closures.
Crude steelmaking capacity has also expanded rapidly in the Association of South East
Asian Nations (ASEAN) region over the past decade and is expected to continue increasing
over the next three-year period. Steelmaking capacity in ASEAN-6 could increase fromLATEST DEVELOPMENTS IN STEELMAKING CAPACITY | 15 61.5 mmt in 2019 to 68.3 mmt by 2022 (+11.1%), based only on projects currently underway (excluding planned projects) and in the absence of closures. 8 In the Philippines, SteelAsia Manufacturing is constructing a new 0.8 mmt EAF plant at the Compostela Works in Cebu province, which is expected to begin operation in 2020 (Metal Expert, 2018[24]). SteelAsia Manufacturing also started the construction of a greenfield steelworks in Lemery, Batangas, with EAF capacity of 0.5 mmt that is expected to become operational in 2022 (Metal Expert, 2019[25]). Viet Nam’s Hoa Phat Group commissioned a new integrated steel plant with BOF capacity of 2.0 mmt in the Dung Quat Economic Zone, Quang Ngai province, in 2019 (Metal Expert, 2019[26]). Hoa Phat Group also has plans to add 2.0 mmt of BOF capacity at the same production site (Metal Expert, 2019[26]). There are also a number of investments in IF technology taking place in ASEAN- 6 economies. Although information about these investments is scarce and difficult to verify, Annex E includes an indication of IF capacities in the ASEAN region. Steel demand growth is attracting foreign investors to the ASEAN and South Asian regions, with several new investment projects supported by Chinese companies. For instance, in Indonesia, Gunung Gahapi Sakti (GGS) commissioned a new EAF plant with 0.5 mmt of capacity in 2019, as part of a joint venture with China’s Nanjing Iron and Steel, located at Medan in north Sumatra (Metal Expert, 2019[27]). Dexin Steel Indonesia, a joint venture between China's Delong Holdings Limited (45%), China’s Shanghai Decent Investment Group (43%) and Indonesia's PT Indonesia Morowali Industrial Park (12%), is proceeding with construction of a new 3.5 mmt BOF steel mill in Morowali Industrial Park, located in Central Sulawesi province, with the start of production scheduled for 2020 (Platts, 2019[28]). Moreover, Shaanxi Iron and Steel Group has plans to develop a new steel mill in Indonesia, with steelmaking capacity of 7.5 mmt. However, details about this project are still undisclosed (Metal Expert, 2018[29]). In the Philippines, China's HBIS Group, Huili Investment Fund Management, the Philippine's SteelAsia Manufacturing Corporation and PHIVIDEC Industrial Authority started the construction of a new steel plant in Misamis Oriental province, and steelmaking capacity would eventually reach 8.0 mmt after the two phases are concluded. However, the completion date of this project is still unknown (SteelAsia Manufacturing, 2019[30]). In Malaysia, Hebei Xinwuan Steel Group and Metallurgical Corporation of China (MCC) has plans to construct a new 5.0 mmt steel plant in Sarawak State (MCC, 2019[31]). Furthermore, Chinese investors Metallurgical Corporation, CCCC International Investment Holding and Wenan Iron and Steel Co. announced their plans to build a new integrated steel mill with a capacity of 6.5 mmt in Samalaju Industrial Park in Bintulu. This project is expected to start in 2020 (Metal Expert, 2019[32]). In Myanmar, the subsidiary of Kunming Iron and Steel Group Company signed an agreement with the Myanmar Steel Association to build a new 4.0 mmt steelmaking plant. The schedule of this project has not been specified yet (Metal Expert, 2019[33]). 9 Elsewhere in Asia, Bangladesh Steel Re-Rolling Mills (BSRM) and GPH Ispat commissioned new steelmaking facilities in 2019, namely an IF plant with 0.9 mmt of capacity and an EAF plant with 0.815 mmt of capacity (Metal Expert, 2019[34]). In Pakistan, Amreli Steels and Al-Haj Asia Star Steel commissioned new IF capacity projects with capacities of 0.2 mmt and 0.48 mmt, respectively, in 2019 (Metal Expert, 2019[35]) (Metal Expert, 2019[36]). Ittehad Steel is also expanding its IF capacity by an additional 0.6 mmt, with production scheduled to start in 2021 (Metal Expert, 2019[27]). Bhutan’s Druk Holding and Investments Limited (DHI) is working together with its Indian investor Mr. Dilip
16 | LATEST DEVELOPMENTS IN STEELMAKING CAPACITY

      Kumar Goenka to construct a greenfield steel plant with an IF capacity of 0.2 mmt in the
      Motanga Industrial Park of Bhutan. This project is scheduled to be completed by 2020 and
      could be the first-ever steelmaking plant established in Bhutan. According to DHI, this
      plant will produce for export to the northeast region of India (Druk Holding and
      Investments Limited, 2019[37]) (Metal Expert, 2018[38]).

3.3. CIS

      In the Commonwealth of Independent States (CIS) region, Russian steelmaker
      Tulachermet-Steel installed a BOF with 1.5 mmt of capacity in the Central Federal District
      in 2019 (Metal Expert, 2019[39]). Russian NLMK is proceeding with the expansion of BOF
      capacity by 1.5 mmt at its Lipetsk mill, which expected to be completed in late 2020
      (NLMK, 2019[40]). In addition, Azerbaijan's Baku Steel Company will install a new EAF
      facility in Ganja, Azerbaijan. The figure for steelmaking capacity is still unknown, but the
      construction is to be completed in 2022 (Metal Expert, 2019[41]). Taking only the projects
      that are underway into account, the CIS region’s steelmaking capacity could increase from
      140.8 mmt in 2019 to 142.7 mmt (+1.3%) in 2022 in the absence of any further closures.
      Meanwhile, Kyrgyz Metal in Kyrgyzstan cancelled the country’s first steelmaking plant
      with an EAF capacity of 0.12 mmt due to financial issues (Metal Expert, 2019[42]).

3.4. Europe

      Steelmaking capacity in the regional aggregate defined as Europe, which includes Turkey,
      could increase from to 274.7 mmt in 2019 to 278.4 mmt by 2022 (+1.3%), based on
      information available on investments that are underway but excluding planned projects.
      Several investments are underway in Turkey; for example, Kardemir installed a new BOF
      in Karabuk province in 2019, with a capacity of 0.7 mmt (Platts, 2019[43]). Mescier Iron
      and Steel is constructing a new EAF facility with capacity of 1.0 mmt in Bartin, in northern
      Turkey, which are now expected to start operating in 2020 (Metal Expert, 2019[44]). In
      addition, Tosyali Holding is proceeding with the construction of a new EAF plant located
      along the Iskenderun Bay, with the capacity to produce 2.5 mmt of crude steel (Tosyalı
      Holding, 2019[45]).
      In the European Union, voestalpine is seeing the construction of a new EAF in Kapfenberg,
      Austria. The capacity would be 0.2 mmt and the target completion date is 2021
      (voestalpine, 2020[46]). Liberty House Group is planning to install a new EAF in Newport,
      the United Kingdom, but the capacity and completion time is unclear (Liberty House
      Group, 2018[47]). Van Merksteijn International in the Netherlands intended to start
      construction of a new EAF with a capacity of 1.0 mmt in 2019, but they decided to postpone
      this plan and now the timeline is undecided (Metal Expert, 2019[48]).

3.5. Latin America

      In Latin America, Bolivia is seeing the construction of the country’s first steelmaking
      plants.Las Lomas has started the construction of the country’s first steelmaking plant with
      a capacity of 0.2 mmt in Buena Vista, Santa Cruz province. This plant was originally
      expected to start operations in 2019, but the actual completion time is unclear (Metal
      Expert, 2018[49]). In addition, Empresa Siderurgica del Mutun plans to install a new EAF
      plant with a capacity of 0.19 mmt in El Mutún, Santa Cruz. Construction of the plant started
      in 2019 and operations would begin in 2022 (Platts, 2019[50]). This project is supported by
LATEST DEVELOPMENTS IN STEELMAKING CAPACITY | 17
China’s Sinosteel Equipment, which would help with the construction of the facilities,
conduct trial runs and provide operational assistance (Sinosteel Equipment, 2016[51]).
Elsewhere in the region, Peru’s Aceros Arequipa has plans to replace its current 0.85 mmt
EAF with a new 1.2 mmt EAF by 2020 (Metal Expert, 2019[53]).
Taking into account the projects that are underway, steelmaking capacity in Latin America
may increase by 0.2 mmt (+0.3%) in the period 2020-22, to a level of 74.4 mmt in 2022, if
those projects are realised and in the absence of closures.
3.6. Middle East
Steelmaking capacity has increased rapidly over the past decade in the Middle East, from
33.1 mmt in 2010 to 65.1 mmt in 2019 (+96.7%). Rapid growth is expected to continue
over the next few years mainly due to capacity expansions in Iran. Steelmaking capacity
could increase by an additional 19.6 mmt (+30.1 %) by 2022 compared with the level of
2019 if all the projects that are underway come on stream and in the absence of closures.
Looking at developments in Iran, a total of 2.8 mmt of steelmaking capacity started
operations in 2019. The largest steelmaking project to come on stream was the Jahan
Foolad Sirjan Steel Complex, where 1.2 mmt of capacity was installed in 2019 (Metal
Expert, 2019[54]). Other notable projects include investments by Bistoun Steel, Arvand
Jahanara Steel, and Kabkan steel, each with steelmaking capacities of 0.25 mmt, 1.2 mmt,
and 0.15 mmt, respectively (Metal Expert, 2019[55]) (Metal Expert, 2019[56]) (Metal Expert,
2019[57]).
On the other hand, there have been some suspensions of projects, such as Aria Zob Steel
and Arian Steel, which had originally planned to add capacities in 2019 but stopped
construction due to financial issues (Metal Expert, 2019[58]). Furthermore, Kish South
Kaveh Steel, West Alborz Steel and Zarand Iron and Steel postponed to 2020 the start-up
of new EAF plants with capacities of 0.2 mmt, 1.0 mmt, and 1.7 mmt, respectively. (Metal
Expert, 2020[59]) (Metal Expert, 2019[60]) (Metal Expert, 2019[61]). Kavir Damghan Steel
has also postponed (indefinitely) the start-up of a new EAF plant with a capacity of 0.2
mmt, which was originally planned for 2019 (Metal Expert, 2019[62]).
These developments indicate the potential uncertainties surrounding the implementation of
investment projects. However, assuming that all projects that are currently underway are
completed as scheduled, Iran’s nominal crude steelmaking capacity would reach 54.4 mmt
by 2022, i.e. an increase of 51% when compared to the capacity level of 36.0 mmt observed
at the end of 2019. This would mean that Iran would become the seventh largest
steelmaking country in the world during this period. In view of the rapid capacity growth
being observed in Iran, the Secretariat will make efforts to investigate trends occurring in
that economy in more detail in subsequent reports.
Elsewhere in the region, Oman’s Moon Iron and Steel (MISCO) is building a new 1.2 mmt
EAF plant, which is expected to be operational in 2020 (Metal Expert, 2019[63]). At the
same time, the construction of a new EAF facility with a capacity of 0.6 mmt by Saudi
Arabia’s Gulf Tubing Company is facing delays due to financial issues (Metal Expert,
2019[58]). Iraq’s United Brothers Holdings is installing new EAF facilities in Basra with the
capacity to produce 0.5 mmt of crude steel, however, the completion time is unclear due to
political instability in the country (Metal Expert, 2019[64]).18 | LATEST DEVELOPMENTS IN STEELMAKING CAPACITY
3.7. NAFTA
In the NAFTA region, several new investments could lead to a slight increase in
steelmaking capacity in the coming years. In the United States, Nucor Corporation is
installing two new EAF facilities each with capacities of 0.3 mmt. One was installed in
Sedalia, Missouri, at the end of 2019, and the other will be located in Frostproof, Florida,
which is scheduled to start operations in 2020 (Nucor, 2019[65]). Nucor Corporation has
also announced plans to expand the steelmaking capacity of its Gallatin mill in Ghent,
Kentucky by 1.09 mmt, with a view to start operation in 2021 (Danieli, 2019[66]). In
addition, Big River Steel has launched the construction of a new EAF to expand
steelmaking capacity at the Arkansas mill by around 1.5 mmt, which expected to become
operational in 2020 (Big River Steel, 2018[67]). In February 2019, United States Steel
Corporation (U.S. Steel) restarted the construction of a new EAF facility with a capacity of
1.45 mmt at its Fairfield Works, Alabama, which is expected to start producing steel in
2020 (U.S. Steel, 2019[68]). Steel Dynamics has a plan to install a new EAF with a capacity
of around 2.7 mmt in Sinton, Texas in 2021 (Steel Dynamics, 2019[69]). Australia’s
BlueScope Steel has a plan to expand steelmaking capacity by installing a new EAF at its
subsidiary North Star in Delta, Ohio. The capacity additions would be 0.85 mmt and the
target commissioning is in mid-2022 (BlueScope Steel, n.d.[70]). Conversely, India’s JSW
Holdings has suspended a plan to install a new EAF facility at its subsidiary JSW USA in
Baytown, Texas (Metal Expert, 2019[71]). Moreover, AK Steel closed BOF facilities at its
Ashland Works in Kentucky, with capacity of 2.5 mmt (AK Steel, 2019[72]).
As a result of these changes, steelmaking capacity in the NAFTA region could increase by
3.3 mmt (+2.1%) in 2022 compared to the level in 2019, taking into account the projects
that are underway. This would lead to a rise in the level of NAFTA’s steelmaking capacity
to 155.9 mmt.LATEST DEVELOPMENTS IN STEELMAKING CAPACITY | 19
4. The latest developments in cross-border investments
Figure 4 shows the share of domestic and cross-border investments in steelmaking capacity.
In total, there are 110 new steelmaking capacity projects around the world, classified as
underway or planned, which are scheduled to become operational in 2019 or later. This
includes projects that have started operations in 2019, as well as projects for which the start
date is not available. Of these projects, domestic steelmakers are the investors/owners in
91 (82.7%) of the cases. Of the remaining steelmaking capacity projects, 8 (7.3%) entail
cross-border investments, representing an investment that is based wholly on one or on
several foreign investors/owners, and 11 (10.0%) are structured as joint ventures (JV)
between domestic and foreign investors/owners.
Figure 4. The share of domestic and cross-border investments in new steelmaking capacity
projects underway or planned for 2019 or later
Note: This figure includes all new investment projects that are underway or planned, and which are scheduled
to become operational in 2019 or later — including projects that have started operation in 2019, as well as
projects for which the start date is not available. It does not include cancelled projects. A cross-border
investment represents an investment that is based wholly on one or several foreign investors/owners. A joint
venture, on the other hand, involves both foreign investors/owners and domestic counterparts. Please see Annex
A for details on the plant-level investments and their respective investors/owners.
Source: OECD
Table 2 lists the cross-border investments by region. Asia is the largest investment
destination, accounting for five cross-border and nine joint venture (JV) investments
between domestic and foreign investors. Africa attracts one JV investment. Latin America
has one cross-border investment and one JV, while NAFTA is the destination of two cross-
border investments. The CIS, Middle East, Europe and Oceania regions currently do not
have any cross-border investments or JV investments.20 | LATEST DEVELOPMENTS IN STEELMAKING CAPACITY
Table 2. Domestic and cross-border investments in new steelmaking capacity projects
Underway and planned investments for 2019 or later
Region where Domestic Investments Cross-Border Joint-Venture
the investment Investments Investments
is taking place Number Capacity Number Capacity Number Capacity
(mmt) (mmt) (mmt)
Africa 6 4.6 0 0.0 1 2.2
Asia 33 99.1 5 27.1 9 27.2
CIS 6 6.6 0 0.0 0 0.0
Europe 6 5.4 0 0.0 0 0.0
Latin America 2 1.5 1 8.0 1 0.2
Middle East 31 32.7 0 0.0 0 0.0
NAFTA 7 8.7 2 0.9 0 0.0
Oceania 0 0.0 0 0.0 0 0.0
World Total 91 158.4 8 36.0 11 29.6
Note: This table includes all new investment projects that are, underway or planned, and which are scheduled
to become operational in 2019 or later — including projects that have started operation in 2019, as well as
projects for which the start date is not available. It does not include cancelled projects. A cross-border
investment represents an investment that is based wholly on one or several foreign investors. A joint venture,
on the other hand, involves both a foreign investor and a domestic counterpart. Please see Annex A for details
on the plant-level investments and their respective investors/owners.
Source: OECD
Table 3 provides a two-way matrix of the cross-border and joint venture investments by
economy. Chinese companies are involved in three cross-border investments and
participate in eight JV investments abroad. ASEAN is the most attractive region for
Chinese companies, followed by South Asia and Latin America. Cambodia and Malaysia
are destinations for one Chinese cross-border investment each, while Indonesia is the
location for three JV investments with Chinese companies. In the Philippines, there are two
JV investments with Chinese companies. Myanmar, Pakistan and Bolivia have one JV
investments with Chinese companies each, while Brazil is the destination for one Chinese
cross-border investment.
Regarding other investments, two Chinese Taipei companies and a Japanese company are
jointly investing in two cross-border projects in Viet Nam.10 An Indian company has one
cross-border investment in the United States. Another Indian company is involved in one
joint venture project with a Bhutanese counterpart. Investors from Luxembourg and
Australia have one cross-border investment each, respectively in India and in the United
States. Investors from Korea and Qatar have one joint venture project each, respectively
with companies in Indonesia and Algeria.11LATEST DEVELOPMENTS IN STEELMAKING CAPACITY | 21
Table 3. Cross-border and joint venture investments in new steelmaking capacity projects
A. Cross-Border Investments
Location of Investments
Asia Latin America NAFTA
Cambodia India Malaysia Viet Nam Brazil United States
Capacity Capacity Capacity Capacity Capacity Capacity
Number Number Number Number Number Number
Origins of Investments: firm based in (mmt) (mmt) (mmt) (mmt) (mmt) (mmt)
Asia China 1 3.1 0 0.0 1 5.0 0 0 1 8.0 0 0.0
Chinese Taipei / Japan 0 0.0 0 0.0 0 0.0 2 13.0 0 0.0 0 0.0
India 0 0.0 0 0.0 0 0 0 0 0 0.0 1 n/a
Europe Luxembourg 0 0.0 1 6.0 0 0 0 0 0 0.0 0 0.0
Oceania Australia 0 0.0 0 0.0 0 0 0 0 0 0.0 1 0.9
B. Joint Venture Investments
Location of Investments
Africa Asia Latin America
Algeria Bhutan Indonesia Myanmar Pakistan Philippines Bolivia
Capacity Capacity Capacity Capacity Capacity Capacity Capacity
Number Number Number Number Number Number Number
Foreign JV partner: firm based in (mmt) (mmt) (mmt) (mmt) (mmt) (mmt) (mmt)
China 0 0.0 0 0.0 3 11.5 1 4.0 1 0.5 2 8.0 1 0.2
Asia India 0 0.0 1 0.2 0 0.0 0.0 0.0 0 0.0 0 0.0 0 0.0
Korea 0 0.0 0 0.0 1 3.0 0.0 0.0 0 0.0 0 0.0 0 0.0
Middle East Qatar 1 2.2 0 0 0 0 0 0 0 0 0 0 0 0.0
Note: Capacity figures are in mmt (millions of metric tonnes). These tables include all new investment projects that are underway or planned, and which are scheduled to become
operational in 2019 or later — including projects that have started operation in 2018, as well as projects for which the start date is not available. It does not include cancelled
projects. A cross-border investment represents an investment that is based wholly on one or several foreign investors. A joint venture, on the other hand, involves both a foreign
investor and a domestic counterpart. Please see Annex A for details on the plant-level investments and their respective investors/owners.
Source: OECD22 | LATEST DEVELOPMENTS IN STEELMAKING CAPACITY
Annex A. AVAILABLE EVIDENCE OF PLANT LEVEL INVESTMENTS AND OWNERS
Table 4. Investment data
OWNER EQUIPME CAPA
REGION ECONOMIES LOCATION COMPANY STATUS START SOURCES
(ECONOMIES) NT CITY
IMETAL (Algeria), Qatar
Africa Algeria Bellara, Jijel Algerian Qatari Steel EAF 2 200 operating 2019 Company HP, Platts
Steel (Qatar)
The ETRHB HADDAD
Africa Algeria Berrahal ETRHB EAF 1 150 plan n/a Company HP, Metal Expert
Group (Algeria)
Meski Holding
Africa Morocco Jorf Lasfar Riva Industries EAF 800 plan 2020 Metal Expert
(Morocco)
Oshikango,
Africa Namibia Ohangwena Groot Group Groot Group (Namibia) EAF 1 000 underway 2022 Company HP, Metal Expert
region
Platts, Metal Expert, World
Africa Egypt Sokhna, Suez Ezz Rolling Mills (ERM) Ezz Steel (Egypt) EAF 850 underway 2020
Steel Capacities
Africa Egypt Qalyubia Delta Steel Mill Delta Steel Mill (Egypt) EAF 250 operating 2019 Metal Expert
Arabian Steel Industries
Africa Egypt Ain Sokhna Arabian Steel Industries EAF 500 underway n/a World Steel Capacities
(Egypt)
Masjiddah,
Kumira, GPH Ispat Ltd
Asia Bangladesh GPH Ispat Ltd EAF 815 operating 2019 Company HP, Metal Expert
Sitakunda, (Bangladesh)
Chittagong
Bangladesh Steel Re-
Asia Bangladesh Chittagong BSRM (Bangladesh) IF 900 operating 2019 Metal Expert
Rolling Mills (BSRM)
Druk Holding and
Motanga Industrial
Investments Limited Company HP, Platts, Metal
Asia Bhutan Park, Samdrup Druk Metallurgy Limited IF 200 underway 2020
(Bhutan), Mr. Dilip Expert
Jongkhar
Kumar Goenka (India)LATEST DEVELOPMENTS IN STEELMAKING CAPACITY | 23
OWNER EQUIPME CAPA
REGION ECONOMIES LOCATION COMPANY STATUS START SOURCES
(ECONOMIES) NT CITY
Baowu Iron and Steel Baowu Iron and Steel
Asia Cambodia Phnom Penh BOF 3 100 plan n/a Reuters, Metal Expert
Group Group (China)
Hebei Zongheng Fengnan
Fengnan district of Steel (河北纵横集团丰南钢 Sinogiant Steel Group Company HP, Platts, Metal
Asia China BOF 7 700 operating 2019
Tangshan (China) Expert, Wood Mackenzie
铁)
Shandong Iron and Steel Shandong Iron and
Asia China Rizhao, Shandong BOF 4 360 operating 2019 Platts
Group Steel Group (China)
Shougang Jingtang United Platts, Metal Expert, Wood
Caofeidian port, Shougang Group Mackenzie, China
Asia China Iron and Steel (首钢京唐公 BOF 4 000 operating 2019
Hebei (China) Metallurgical News (中国冶金
司) 报社)
Platts, Wood Mackenzie,
Fangchenggang, Liuzhou Iron and Steel (柳 Guangxi Liuzhou Iron 14
Asia China BOF operating 2019 Guangxi News(广西新闻网版),
Guangxi 州钢铁) and Steel Group (China) 700
Xinhuanet (新华网)
Liu'an Steel Holdings Co., Company HP, Platts, Wood
Ltd.(六安钢铁控股集团有限 Liu'an Steel Holdings Mackenzie, Government of
Asia China Liu'an City, Anhui BOF 3 200 operating 2019
Co., Ltd. (China)
公司) Huoquiu (霍邱县人民政府)
Fujian Dingsheng Iron and Henan Province SME Public
Steel (福建鼎盛钢铁有限公 Fujian Dingsheng Iron
Asia China Ningde, Fujian EAF 1 725 underway 2020 Platform(中小企业河南网),
and Steel (China)
司) Wood Mackenzie
Zhanjiang, Guangdong Shaoguan Iron Guangdong Shaoguan
Asia China BOF 3 625 underway 2021 Metal Expert
Guangdong & Steel Iron & Steel (China)
HBIS Laoting Steel(河钢乐 Company HP, Platts, Metal
Hebei Iron and Steel
Asia China Laoting, Hebei BOF 7 470 underway n/a Expert, Wood Mackenzie,
亭钢铁) (HBIS) (China)
Reuters
Shanxi Jinnan Iron and Company HP, Wood
Steel (山西晋南钢铁集团有 Shanxi Jinnan Iron and Mackenzie, worldmetals (世界
Asia China Shanxi BOF 3 400 underway n/a
Steel (China)
限公司) 金属导报)
Shaanxi Hanzhong Iron Wood Mackenzie, Shaanxi
Hanzhong, and Steel (陕钢汉中钢铁有 Shaanxi Steel Group Development Observation (陕
Asia China EAF 700 underway n/a
Shaanxi (China)
限责任公司) 西发展观察)You can also read