Understanding the Effectiveness of Video Ads: A Measurement Study
←
→
Page content transcription
If your browser does not render page correctly, please read the page content below
Understanding the Effectiveness of Video Ads:
                            A Measurement Study

                         S. Shunmuga Krishnan                                                  Ramesh K. Sitaraman
                              Akamai Technologies                                        University of Massachusetts, Amherst
                        sarumuga@akamai.com                                                     & Akamai Technologies
                                                                                             ramesh@cs.umass.edu

ABSTRACT                                                                            Categories and Subject Descriptors
Online video is the killer application of the Internet. Videos                      C.4 [Performance of Systems]: Performance attributes,
are expected to constitute more than 85% of the traffic on                          Measurement techniques; C.2.4 [Computer-Communication
the consumer Internet within the next few years. However,                           Networks]: Distributed Systems—Client/server
a vexing problem for video providers is how to monetize
their online videos. A popular monetization model pursued                           Keywords
by many major video providers is inserting ads that play
in-stream with the video that is being watched. Our work                            Online videos; Advertisements; Monetization; User behav-
represents the first rigorous scientific study of the key factors                   ior; Internet content delivery; Multimedia.
that determine the e↵ectiveness of video ads as measured by
their completion and abandonment rates. We collect and an-                          1.   INTRODUCTION
alyze a large set of anonymized traces from Akamai’s video                             Online video is the killer application of the Internet. Ac-
delivery network consisting of about 65 million unique view-                        cording to a recent Cisco study more than half of the con-
ers watching 362 million videos and 257 million ads from                            sumer traffic on the Internet today is related to videos and
33 video providers around the world. Using novel quasi-                             that fraction is expected to exceed 85% in 2016 [9]. As
experimental techniques, we show that an ad is 18.1% more                           all forms of traditional media such as news, entertainment
likely to complete when placed as a mid-roll than as a pre-                         and sports migrate to the Internet, video on-demand traffic
roll, and 14.3% more likely to complete when placed as pre-                         is expected to triple by 2016 from the levels seen in 2011.
roll than as a post-roll. Next, we show that completion rate                        Video providers who o↵er online videos include news chan-
of an ad decreases with increasing ad length. Further, we                           nels (such as CNN and Fox News), sports channels (such
show that the ad completion rate is influenced by the video                         as ESPN and MLB), movie outlets (such as Hulu and Net-
in which the ad is placed. An ad placed in long-form videos                         Flix), and entertainment providers (such as NBC, ABC, and
such as movies and TV episodes is more likely to complete                           CBS). Video providers bear the costs of acquiring and de-
than the same ad placed in short-form video such as news                            livering the videos to their audience of viewers. Acquisition
clips. Our analysis also shows that repeat visitors to a video                      costs may include production costs for original content or li-
provider’s site complete watching ads at a higher rate than                         censing costs and/or revenue sharing for third-party content.
one-time visitors to the site. And, viewers exhibit more pa-                        The delivery costs often involve contracting with a content
tience when watching ads than when faced with performance                           delivery service (such as Akamai [18]), who in turn incur the
problems such as a slow-loading video. The abandonment                              costs for the servers, software, bandwidth, colocation, and
rate for viewers waiting for a slow-loading video to start was                      power. The runaway success of online videos leaves video
more than three times higher than that for viewers watch-                           providers and the media industry with perhaps their single
ing an ad before their video starts. Finally, we show that                          most vexing problem. How can online videos be monetized?
about one-third of the viewers who abandon leave in the first                       How can they be made viable and profitable?
quarter of the ad, while about two-thirds leave at the half-                           While successful models for video monetization are still
way point in the ad.Our work represents a first step towards                        evolving, there are broadly three monetization models that
scientifically understanding video ads and viewer behavior.                         are gaining popularity in the industry. The subscription-
Such understanding is crucial for the long-term viability of                        based model requires users to pay a fee on a periodic basis
online videos and the future evolution of the Internet.                             (usually monthly) to watch videos. The pay-per-view model
                                                                                    requires users to pay a fee usually on a per-event basis. Fi-
                                                                                    nally, a popular model more relevant to our work is the ad-
                                                                                    based model where viewers do not pay a fee but are shown
                                                                                    ads that are placed in-stream in the video content.1
                                                                                       Driven by both the rapid increase in online video con-
                                                                                    sumption and the intense need to monetize that consump-
                                                                                    1
                                                                                      We use the term “video” to describe the video being
                                                                                    watched, such as a news clip, sports event, or movie. We
This is the full version of a paper that appeared in the ACM Internet Measurement   use the term “ad” to indicate the ad that is played in-stream
Conference (IMC) held from October 23–25, 2013 in Barcelona, Spain.                 with the video that is being watched.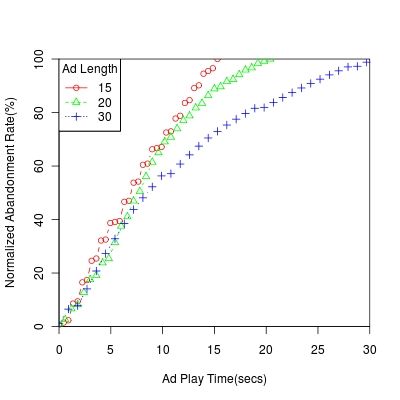
tion, it is perhaps not surprising that video ads were the          Our data set is one of the most extensive cross-sections
fastest growing category of online ads with spending increas-    of enterprise videos used in a scientific study of this kind.
ing by about 50% in 2012 [8]. But, how e↵ective are video        The data used in our analysis was collected from 33 video
ads? Are there general causal rules of viewer behavior that      providers over a period of 15 days consisting of 362 million
govern their e↵ectiveness? What key factors of the ad, of        videos and 257 million ad impressions that were watched by
the video, and of the viewer influence an ad’s e↵ectiveness?     65 million unique viewers located across the world.
These questions are of great importance to the long-term            The metrics that we study such as completion and aban-
viability of online videos that are a key part of the Internet   donment rates are critical in the media industry and are
ecosystem. However, to our knowledge, they have not been         widely tracked and reported by ad networks and analytics
studied in a rigorous scientific fashion, and hence our focus.   providers. We expect that the deeper scientific understand-
                                                                 ing that our work provides for these metrics will have a sig-
                                                                 nificant impact on the evolution of monetization models for
1.1   Understanding Ad Effectiveness                             video. We now list our specific key contributions below.
   The question of how to measure the e↵ectiveness of a video       (1) “Mid-roll” ads placed in the middle of a video had the
ad is complex. Ads convey a message to the viewer and the        highest completion rate of 97% while “pre-roll” ads placed
key metric for ad e↵ectiveness that is widely used in the        in the beginning and “post-roll” ads placed in end yielded
media industry is ad completion rates. Ad completion rate        drastically smaller completion rates of 74% and 45% respec-
is the percentage of ads that the viewer watched completely      tively. The intuitive reason is that viewers are more engaged
without abandoning in the middle. Completion rates are           with the video during a mid-roll ad causing them to be more
perhaps the most tracked metric in an ad campaign since          patient, while viewers are less engaged in the beginning and
a viewer watching an ad to completion is more likely to          at the end of the video. By designing a quasi-experiment, we
be influenced by it. A related metric is ad abandonment          verify the above intuition by showing that the position of an
rate that measures what fraction of viewers watched what         ad can causally impact its completion rate. We show that an
fraction of the ad. The goal in any advertising campaign is      ad is 18.1% more likely to complete when placed as mid-roll
to maximize completion rates and minimize abandonment.           than as a pre-roll, and 14.3% more likely to complete when
   In addition to ad completion, there are a few other met-      placed as pre-roll than as a post-roll.
rics that are tracked that attempt to measure the response          (2) 20-second ads had the least completion rate of 60%
of the viewer after watching the ad. Primary among those is      in our data set, with 15-second and 30-second ads complet-
the click-through rate (CTR) that measures the percentage        ing at higher rates of 84% and 90% respectively. However,
of users who click on a link associated with the ad dur-         using a quasi-experiment, we show that longer ads are in
ing or after watching the ad. CTR has the advantage over         fact less likely to complete. Our causal analysis bolsters our
ad completion rates of capturing an active user response.        intuition that viewers have less patience to wait for longer
Though many have argued that CTRs capture only a imme-           ads and would complete fewer of them, provided the other
diate response but not the long-term impact of the ad that       confounding factors are kept similar.
advertiser is hoping to achieve [12].                               (3) Ads played within long-form video such as TV episodes
   Another class of metrics for ad e↵ectiveness take the more    and movies completed at a higher rate of 87%. While ads
direct approach of surveying a sample of users who have          played within short-form video such as news clips completed
viewed the ad to determine how much the ad may have in-          at a lower rate of 67%. A plausible reason is that viewers are
creased brand awareness, brand loyalty, and the viewer’s         more willing to complete an ad that they view as a “cost” if
intent to buy. While the directness of the approach is an        they perceive a greater “benefit” in return from watching the
advantage, such surveys are difficult to do at scale and suf-    associated video. And, on average, viewers tend to perceive
fer from biases that relate to how the questions are framed      greater benefit from a long-form video than a short-form
and who opts to participate in the survey.                       one. Using a quasi-experiment, we confirm this intuition
   While the video ad industry is yet to evolve a consensus      by showing that an ad is 4.2% more likely to complete if
on how to integrate the di↵erent ways of measuring ad ef-        placed in a long-form video than if it is placed in a short-
fectiveness, there is consensus that a basic and important       form video, provided all other factors are similar. Note that
measure is ad completion rate. Thus, we focus on ad com-         the magnitude of impact of video length on ad completion
pletion rate and the associated metric of ad abandonment         rates is smaller when confounding factors are accounted for
rate as indicators of ad e↵ectiveness in our study. Our cur-     than what a simple correlation suggests (4.2% versus 20%).
rent data set does not currently allow us to measure CTRs           (4) Using information gain ratios, we show that the con-
or survey responses. But, comparing the di↵erent metrics of      tents of the video and the ad have high relevance for com-
ad e↵ectiveness is an interesting avenue for future work.        pletion rates, while the connectivity of the viewer had the
                                                                 lowest relevance.
1.2   Our contributions                                             (5) Industry folklore suggests that viewers are less likely
                                                                 to abandon ads when watching them in the evenings or week-
  To our knowledge, our work is the first in-depth scientific
                                                                 ends when they tend to be more relaxed and have more spare
study of video ads and their e↵ectiveness. We explore how
                                                                 time. However, we did not find any supporting evidence in
ad e↵ectiveness as measured by completion rate is impacted
                                                                 our data as we did not observe a significant influence of ei-
by key properties of the ad, of the video, and of the viewer.
                                                                 ther time-of-day or day-of-week on ad completion rates.
A key contribution of our work is that we go beyond simple
                                                                    (6) Repeat visitors to a video provider’s site had notice-
characterization to derive causal rules of viewer behavior
                                                                 ably higher ad completion rates than one-time visitors to
that are predictive and more generally applicable. To derive
                                                                 that site. In particular, repeat visitors had a completion
such rules we develop and use a novel technique based on
                                                                 rate of 84.9% and one-time visitors only 78%. Further, re-
quasi-experimental designs (QEDs).
peat visitors had higher ad completion rates for all major identify the viewer uniquely, the GUID2 value is generated
subcategories of ads, such as pre-rolls, mid-rolls, and post- to be distinct from other prior values in use.
rolls. A plausible reason for this phenomena is that repeat Views. A view represents an attempt by a viewer to watch
visitors to a site are more interested in the video content a specific video. A typical view would start with the viewer
o↵ered at the site and are hence more likely to complete ads initiating the video playback, for instance, by clicking the
on that site. play button of the media player3 (see Figure 1). During a
(7) Viewers are more impatient in waiting for a slow- view, the media player might first play an ad called a pre-
loading video to start than for a pre-roll ad to finish. For roll before the actual video content begins. (We use the
instance, at the 10-second mark, 45.8% of the viewers wait- term video to denote the actual video that the viewer wants
ing for a slow-loading video have abandoned, compared to to watch to distinguish it from the ad that the viewer is
only 13.4% of viewers watching a pre-roll ad. Waiting for also shown.) Further, the video may be interrupted in the
an ad to complete is less frustrating since it is an expected middle with one or more ads called mid-rolls. Finally, an ad
wait of a known duration. While slow-loading videos and might be shown when the video ends called a post-roll. Each
other performance issues are usually unexpected and are of showing of an ad, whether or not it is watched completely,
unknown duration, and hence they more frustrating to the is called an ad impression. Ad completion rate is the percent
viewer leading to greater abandonment. This result quanti- of ad impressions that were played to completion4 .
tatively suggests that if the media player can predict that a Typically, viewers do not have the ability to “skip” ads
video will start up late due to an underlying network prob- and must either watch the ad in order to watch the video
lem, one can likely reduce viewer abandonment by inserting content that follows, or just abandon the ad and the view
an ad of the appropriate length instead of showing a blank all together. Our data sets have such non-skippable ads
screen or a “spinning wheel”. that is the standard for enterprise video. Recently YouTube
(8) In our study of ad abandonment rates, we show that that has a large fraction of user-generated videos has been
a significant set of viewers abandon soon after the ad starts. experimenting with pre-roll ads that have a mandatory non-
The abandonment rate is initially higher but tapers o↵ over skippable part that must be viewed but can be skipped be-
time as the ad plays. About one-third of the viewers who yond that point. But, it is not yet common within enterprise
eventually abandon leave in the first quarter of the ad, while videos and is not represented in our data set.
about two-thirds leave at the half-way point in the ad.
2. BACKGROUND View
Player
2.1 The Video Ads Ecosystem States Ad
Pre-roll
Video Ad
Mid-roll
Video Ad
Post-roll
The video ad ecosystem consists of four types of entities. View View
Video providers own and manage video content, e.g., NBC, begins ends
CBS, CNN, Hulu, Fox News, etc. Advertisers o↵er ads that
can be played in-stream with the video. Ad insertion is More than
T minutes of
managed by an ad delivery network such as Freewheel [5], Visit inactivity Visit
Adobe Auditude [1], or Video Plaza [7]. The ad network
brings together the video providers (i.e., publishers) who
o↵er videos and the advertisers who o↵er ads. An ad net- Views
work has an ad decision component that decides what ads
to play with which videos and where to position those ads.
Both the ads from the advertisers and the videos from the Figure 1: Views and Visits
video providers need to be streamed to the viewer with high
performance. For that reason, both the ads and videos are
typically delivered to the viewers using content delivery net- Visits. A visit is intended to capture a single session of
works (CDNs) such as Akamai [10, 18]. Thus, CDNs are cog- a viewer visiting a content provider’s site to view videos. A
nizant of both the video content and ads embedded within visit is a maximal set of contiguous views from a viewer at a
them. The mechanism for inserting the ad is commonly specific video provider site such that each visit is separated
performed by the user’s media player when it is playing the from the next visit by at least T minutes of inactivity, where
video. When it is time to play an ad, the media player we choose T = 30 minutes5 (see Figure 1).
redirects to the ad network that chooses the ad and plays
it within an ad player.When the ad completes the control 2
In most implementations, the GUID is tied to the device
returns to the user’s media player that continues to play the or the desktop of the viewer. Thus, we cannot always detect
video content. cases where one user watches video on another user’s device.
3
In other cases, a view may be initiated automatically using
2.2 Views, viewers, and visits a play list or by other means.
4
We describe a user watching a video with ads, defining If an ad is played completely it is likely that it was watched
terms along the way that we will use in this paper. completely by the viewer. However, we are not able to mea-
Viewer. A viewer is a user who watches one or more videos sure whether or not a viewer is actually watching the ad or
if he/she has shifted focus elsewhere when the ad is playing.
using a specific media player installed on the user’s device. 5
Our definition is similar to the standard notion of a visit
A viewer is uniquely identified and distinguished from other (also called a session) in web analytics where each visit is
viewers by using a GUID (Globally Unique Identifier) value a set of page views separated by a period of idleness of at
that is set as a cookie when the media player is accessed. To least 30 minutes (say) from the next visit.Type Factor Description and more patient with video ads. However, as we show in
Content defined by unique name Section 5.3.3, we did not observe a significant influence of ei-
Ad
Position Pre-, mid-, post-roll ther time-of-day or the day-of-week on ad completion rates.
Length 15-, 20-, and 30-second Finally, it is possible that the frequency with which a viewer
Content defined by unique url visits a site could relate to ad completion rates, as viewers
Video
Length Short-form, Long-form who visit more frequently may likely have more interest in
Provider News, Movie, Sports, En- the videos o↵ered at that site. For instance, a football fan
tertainment visiting a sports site frequently to watch highlights might be
Identity defined by unique GUID more eager to complete watching the ads on that site.
Viewer
Geography Country and Continent It is worth noting that many of the video and viewer re-
Connection Type Mobile, DSL, Cable, Fiber lated factors considered here are known to significantly im-
Temporal Time of day, Day of week pact viewer behavior in the context of viewer tolerance to
Frequency Frequency of visits to a site performance degradation from our prior work [14]. So, it is
natural to consider these in the di↵erent behavioral context
Table 1: Potential factors that relate to or impact viewer of viewer tolerance to ads. The ad-related factors considered
behavior and ad completion. here, besides being natural to consider, are widely tracked
in industry benchmarks.
2.3 Potential factors that impact ad comple- 3. DATA SETS
tion The data sets that we use for our analysis are collected
We study three sets of key factors that potentially influ- from a large cross section of actual users around the world
ence ad completion that we list in Table 1 and discuss below. who play videos using media players that incorporate the
Ad-related factors. The actual ad and its contents as iden- widely-deployed Akamai’s client-side media analytics plug-
tified by its unique name is a first factor. Ad position relates in [2]. When video providers build their media player, they
where it was inserted in a video view and can either be pre- can choose to incorporate the plugin that provides an accu-
roll, mid-roll, or post-roll. The most common ad lengths in rate means for measuring a variety of video and ad metrics.
our study are 15-second, 20-second, and 30-second ads. When the viewer uses the media player to play a video, the
Video-related factors. The first factor is the video content plugin is loaded at the client-side and it “listens” and records
itself as identified uniquely by its url6 . Besides the actual a variety of events that can then be used to stitch together
content of the video itself, we isolate two important factors. an accurate picture of exactly what the viewer experienced
The video length can be used to di↵erentiate short-form from and what the viewer did.
long-form videos. The IAB (Interactive Advertising Bureau) When a view is initiated, say with the user clicking the
which is a major industry body for online video advertising play button, metrics such as the time when the view was
defines long-form video as videos lasting over 10 minutes initiated, the video url that uniquely identifies the content,
and short-form as those under 10 minutes [6]. We adopt video length, whether it is live or on-demand, the video
this standard definition in our work. Typically, short-form provider, the amount of video watched, the bitrate(s) at
and long-form videos are qualitatively di↵erent. Short-form which it was streamed, and several other detailed character-
video are usually smaller clips for news, weather, etc. Long- istics pertaining to the video are recorded. Likewise, when
form videos are typically TV episodes, movies, sports events, an ad is inserted, ad-related metrics such at what point in
etc. Most long-form videos possess a “content arc” with a the video the ad was inserted, the ad name that uniquely
beginning, middle and end. identifies the content of the ad, the ad length, the amount
Viewer-related factors. A viewer can be uniquely and of the ad that was actually played, and whether the ad
anonymously identified by their GUID. Besides their iden- completed or not are recorded. Further, detailed informa-
tity, we consider three important attributes of the viewer. tion about the viewer is recorded including the GUID that
The geographical location of the viewer at the country level uniquely identifies the viewer, current ip address, network,
encapsulates several social, economic, religious, and cultural geography, and connection type. Once the metrics are cap-
aspects that could influence his/her viewing behavior. In tured by the plugin, the information is “beaconed” to an
addition, the manner in which a viewer connects to the In- analytics backend that we use to process the huge volumes
ternet, both the device used and typical connectivity char- of data. From every media player at the beginning and end
acteristics can influence viewer behavior. The primary con- of every view, the relevant measurements are sent to the an-
nection types are mobile, DSL, cable, and fiber (such as alytics backend. Further, incremental updates are sent at
AT&T’s Uverse and Verizon’s FiOS). Further, it is plausi- a configurable periodicity as the video is playing, typically
ble that the time-of-day and the day-of-week7 when the ad once every 300 seconds. All relevant fields in the data set
was watched could potentially influence its completion rate. used in our study are measured and stored in an anonymized
For instance, folklore holds that people have more time in fashion so as to not include any PII or sensitive information.
the weekend and evenings, leading them to be more relaxed
3.1 Data Characteristics
6
Note that if two di↵erent providers are showing the same The Akamai CDN serves a significant fraction of world’s
movie with di↵erent urls, we consider them di↵erent videos. online videos and ads. We selected a large, characteris-
Detecting them to be the same content is intrinsically very
difficult as there is no universally accepted naming system tic cross-section of 33 video providers including news sites,
across video providers. sports sites, movie providers, and entertainment channels
7 who have an ad-based monetization model. We tracked all
Time-of-day and day-of-week is computed using the local
time for the viewer based on his/her geographical location. videos and ads for these providers over a period of 15 daysin April 2013. About 94% of the video views were for on-
demand content and the rest were live events. We only con-
sider on-demand videos that currently form the bulk of the
videos for our study.
Our data is among the most extensive ever studied for
video ads and consisted of 257 million ad impressions that
were watched by over 65 million unique viewers located in
all major continents of the world. On average, viewers spent
8.8% of their time watching ads as opposed videos. Table 2
summarizes some basic statistics of our data. The geography
Total Per Per Per
View Visit Viewer
Views 362 mil N/A 1.3 5.6
Ad 257 mill 0.71 0.92 3.95
Impressions
Video Play 777 mil 2.15 2.79 11.96
(in minutes)
Ad Play 75 mil 0.21 0.27 1.15
(in minutes)
Table 2: Key statistics of our data set.
Figure 2: CDF of ad length showing the three major clusters
of the viewer was mostly concentrated in North America, at 15-, 20- and 30-seconds.
and Europe that together originate the bulk of video traffic.
One continent where we could not obtain proportional rep-
resentation is Asia that accounts for significant video traffic
but where many video providers do not yet have the soft-
viewer behavior metric. To provide an example, a correla-
ware changes required in their media player to track ads.
tional analysis of the observed data will be able to say that
The connection types were dominated by cable, though the
mid-roll ads have a higher completion rate than pre-roll ads
other categories have a solid representation as well (cf. Ta-
in the observed data. However, this fact does necessarily im-
ble 3).
ply a causal rule that states that placing an ad as mid-roll
will likely cause higher completions than placing the same
Viewer Percent Connection Percent ad as a pre-roll. The value of causal inference over a purely
Geography Views Type Views correlational one is that it extracts general rules of viewer
North America 65.56% Fiber 17.14% behavior from the data that can be applied to a more general
Europe 29.72% Cable 56.95% or even di↵erent context. In our prior work [14], we intro-
Asia 1.95% DSL 19.78% duced an innovative tool called Quasi Experimental Design
Other 2.77% Mobile 6.05% (QED) that we adapted from the social and medical sciences
for use in network measurement research. In this work, we
take the next step and further evolve this technique to ex-
Table 3: Geography and connection type. tract causal rules pertaining to video ads. We describe our
technique in Section 4.2.
The ad length distribution is shown in Figure 2. The
ad lengths clustered around 15-, 20- and 30-second marks
and were clustered into those categories respectively. The 4.1 Correlational Analysis
distribution of the video lengths for short-form and long-
form videos are shown in Figure 3. The mean length of a To study the impact of a key factor X (say, ad length) with
short-form video is 2.9 minutes and that of long-form video a viewer behavioral metric Y (say, completion rate), we start
is 30.7 minutes. The most popular duration for long-form by visually plotting factor X versus metric Y in the observed
video was 30 minutes that is typical for a TV episode. data. Then, when relevant, we compute Kendall’s correla-
tion coefficient ⌧ that takes values in the interval [ 1, 1]
where ⌧ near 1 means that larger values of X are associated
4. ANALYSIS TECHNIQUES with larger values for Y , ⌧ near 1 means that larger values
We seek to understand how a set of key factors such as of X are associated with smaller values of Y , and ⌧ near 0
those in Table 1 impact viewer behavior metrics such as ad means that X and Y are independent.
completion and abandonment rates. We use correlational A key technique that we use to quantify the influence of
tools such as Kendall correlation and information gain de- factor X on metric Y is the information gain ratio [13]. In-
scribed in Section 4.1 to characterize the observed data. formation gain ratio measures the extent to which the vari-
While correlational analysis is important as a description ability of Y is reduced by knowing X. That is, information
of what is, they don’t necessarily have the ability to predict gain is the entropy of Y (denoted by H(Y )) minus the en-
what will be. The ability to predict often requires a deeper tropy of Y given X (denoted by H(Y |X)). Normalizing the
inference of a causal rule between the key factor and the information gain, we obtain the information gain ratio de-ular, we use a specific type of QED called the matched de-
sign [19] where a treated individual (in our case, a view or
viewer) is randomly matched with an untreated individual,
where both individuals have similar values for the confound-
ing variables. Consequently, any di↵erence in the outcome
for this pair can be attributed to the treatment. By creating
a large collection of matched pairs and assessing the di↵er-
ential outcome of the paired individuals, one can isolate the
causal impact of X on Y .
Adapting QEDs to our situation, our population typically
consists of views. The independent variable is one of the
factors in Table 1 (say, ad position). The treated and un-
treated sets have two di↵erent values of the independent
variable that we want to compare (say, mid-roll versus pre-
roll). Our outcome is a function of the behavioral metric
under study, such as ad completion. The confounding fac-
tors that need to be matched so that they have similar values
are typically other key factors in Table 1 except the inde-
pendent variable that is varied, since the other factors could
confound the outcome. We form comparison sets by ran-
domly matching each treated view with an untreated view
such that they have similar values for the confounding vari-
Figure 3: CDF of video length for long-form and short-form ables and di↵er only in the independent variable. For in-
videos. stance, to study the impact of ad position, we match views
that belong to similar viewers watching the same ad within
the same video, neutralizing the impact of the confounding
noted by variables. By forming a large number of such pairs and by
studying the behavioral outcomes of matched pairs one can
H(Y ) H(Y |X) deduce whether or not the treatment variable X has a causal
IGR(Y, X) = ⇥ 100.
H(Y ) e↵ect on variable Y , with the influence of the confounding
variables neutralized.
It is instructive to view the two extreme cases. Suppose
knowing X perfectly predicts Y , then H(Y |X) is zero since
there is no variability left in Y and IGR(X, Y ) is 100%. In Statistical Significance of the QED Analysis.
the other extreme, suppose that X and Y are statistically As with any statistical analysis, it is important to evalu-
independent. In that case, H(Y |X) simply equals H(Y ) ate whether the results are statistically significant or if they
since knowing X says nothing about Y and IGR(Y, X) is could have occurred by random chance. As is customary
0%. In all our results, IGR is somewhere in between and is in hypothesis testing [16], we compute the p-value which
a quantitative indicator of the extent of a factor’s influence evaluates the probability that the observed outcome from a
on a viewer behavioral outcome. QED happened by chance, assuming that the null hypothe-
sis holds. The null hypothesis states that there is no impact
4.2 Causal Analysis using QEDs of the treatment on the outcome. To evaluate the p-value
A correlational analysis of factor X (say, ad length) and a we use the sign test that is a non-parametric test that makes
viewer behavior metric Y (say, completion rate) could show no distributional assumptions and is particularly well-suited
that X and Y are associated with each other. A primary for evaluating matched pairs in a QED setting [21]. A low
threat to a causal conclusion that an independent variable X p-value means that our results are statistically significant.
causes the dependent variable Y is the existence of confound- The choice of the threshold is somewhat arbitrary and in
ing variables that can impact both X and Y . To take an medical sciences a treatment is considered e↵ective if the p-
example that we describe in greater detail in Section 5.1.3, value is at most 0.05. We can achieve much higher levels of
suppose we want to infer a causal rule that a longer ad causes significance owing to the large numbers of treated-untreated
viewers to complete the ad less often. Simply correlating pairs in our QEDs (order of 100,000) in relation to what is
completion rate and ad length is not sufficient. In fact, 20- typical in the medical sciences (in the 100’s). However, our
second ads complete less often than 30-second ads in the results are unambiguously significant and not very sensitive
observed data, apparently violating the rule. To derive a to the choice of significance level. We refer to our prior work
causal conclusion, one would need to account for the con- [14] for a more detailed treatment of QEDs.
founding factor of ad position, since 30-second ads are often
placed as mid-rolls and as we show mid-rolls have a higher Some Caveats.
completion rate independent of length. It is important to understand the limitations of our QED
A primary technique for showing that an independent tools, or for that matter any experimental technique of infer-
variable X (also called the treatment variable) has a causal ence. Care should be taken in designing the quasi-experiment
impact on a dependent variable Y (called the outcome vari- to ensure that the major confounding variables are explicitly
able) is to design a quasi-experiment. Quasi-experiments or implicitly captured in the analysis. If there exists con-
were developed by social and medical scientists and has more founding variables that are not easily measurable (example,
than 150 years of history in those domains [20]. In partic- the gender of the viewer) and/or are not identified and con-Type Factor IGR
Content 32.29%
Ad
Position l5.1%
Length 12.79%
Content 23.92%
Video
Length 18.24%
Provider 15.24%
Identity 59.2%
Viewer
Geography 9.57%
Connection Type 1.82%
Table 4: Information gain ratio (IGR) for ad completion
rate.
trolled, these unaccounted dimensions could pose a risk to a
causal conclusion, but only if they turn out to be significant.
Our work on deriving a causal relationship by systematically
accounting for the confounding variables must not be viewed
as a definitive proof of causality, as indeed there can be no
definitive proof of causality. But, rather, our work increases
the confidence in a causal conclusion by accounting for po-
Figure 4: The percent of ad impressions y attributed to
tential major sources of confounding. This is of course a
ads with ad completion rate smaller than x. 50% of the ad
general caveat that holds for all domains across the sciences
impressions are from ads with completion rate at most 91%.
that attempt to infer causality from observational data.
5. AD COMPLETION RATE from the figure that ads complete at varying rates with some
We study the ad completion rate metric that is a key mea- having low completion rates with others completing 90+%
sure of ad e↵ectiveness. The completion rate can be influ- of the time. Further, 25% the ad impressions come from ads
enced by the characteristics of three entities that we examine with completion rate under 66%, and 50% come from ads
in turn: the ads themselves, the videos that the ads are em- with completion rate under 91%.
bedded in, and the viewer who is watching the videos and 5.1.2 Ad Position
ads. We evaluate the relevance of each of these factors to the
completion rate by computing their information gain ratio We analyze the impact of ad position on the likelihood
shown in Table 4. Enormous e↵ort goes into creating the that a viewer watches the ad to completion. We first take
ad and video content to make it as captivating as possible. a simple correlational approach of categorizing the position
It is interesting that both show high information gain, per- in which the ad was played and computing the completion
haps indicating that content does matter.The information rates for each category. Our analysis shows that mid-roll
gain ratio of the viewer is very high. This is at least in part ads completed most often, followed by pre-roll and post-roll
due to the fact that 51% of the viewers watched only one ad ads (cf. Figure 5).
resulting in either a 0% or 100% completion rate. In those
cases, knowing the viewer perfectly predicts the completion Assessing Causal Impact.
rate. Information gain is known to be counter-intuitive for Our observational results support the intuition that ads
factors like viewer that can take millions of values each with placed in the middle of the content have the most likelihood
small individual weights. The information gain from con- of being watched, since the viewer is engaged with the con-
nection type was the least, as viewers showed lesser varia- tent when the ad is shown, wants to watch the rest of the
tions in their patience for completing ads across the di↵erent video, and is thus more willing to tolerate the ad. Whereas
connection types. This is in contrast with our earlier work ads placed as pre-roll run a greater risk of viewers aban-
on viewer patience in the context of video performance [14] doning and going elsewhere, since they have not yet started
where viewers with worse connectivity had more patience watching their content and hence are not yet engaged with
for a video to start up. it. Further, an ad placed at the end of the content as a
post-roll runs an even greater risk of viewers leaving since
5.1 Impact of Ad-related Factors the content that they wanted to watch has completed, and
We examine three factors that relate to the ad itself: the so they are less motivated to sit through an ad. Based on
ad’s content as identified by its unique name, the position our observational results, we assert the following causal rule.
in which the ad was played, and the length of the ad. Rule 5.1. On average, a viewer is more likely to complete
5.1.1 Ad Content watching an ad that is placed as a mid-roll than when the
same ad is placed as a pre-roll. In turn, a viewer is more
For each unique ad, we can define its completion rate likely to complete watching an ad that is placed as a pre-roll
as simply the fraction of ad impressions where the ad was than when the same ad is placed as a post-roll.
watched to completion by the viewer. We plot the percent
of ad impressions (y-axis) attributed to ads with completion Note that the correlational analysis in Figure 5 is not suffi-
rate smaller than some x-value (cf. Figure 4). We can see cient to show that the rule holds, as there are potential con-Matching Algorithm
Matched: similar viewer, same ad, same video.
Independent: ad position.
1. Match step. Let the treated set T be the set of all
views that had a mid-roll ad and let the untreated
set C be the set of all views that had a pre-roll ad.
For each u 2 T that had some ad ↵ as mid-roll,
we pick uniformly and randomly from the set of
candidate views v 2 C such that u and v belong
to similar viewers with the same geography and
connection type who are watching the same video
and the same ad ↵, except that the ad ↵ was
played as mid-roll in u but played as pre-roll in
v a . The matched set of pairs M ✓ T ⇥ C have
the same or similar attributes for the confounding
variables that are matched and di↵er only on the
independent variable.
2. Score step. For each pair (u, v) 2 M , we compute
an outcome(u, v) to be +1 if the matched ad was
Figure 5: Mid-roll ads complete most often as the viewer is completed in u but not completed in v, - 1 if the
already engaged by the video and wants to watch more. matched ad was completed in v but not in u, and
0 otherwise. Now,
P
(u,v)2M outcome(u, v)
founding factors such as the ad length, video length, content N et Outcome = ⇥ 100.
|M |
provider, viewer geography, and viewer connectivity that can
negate such an assertion. For instance, the following plausi- a
If no match v exists for a u, then no pair is formed.
ble scenario could be threat to our asserted rule. It could be
possible that mid-roll ads appear largely in longer content
Figure 6: The matching algorithm that compares ads placed
such as TV episodes and movies, and perhaps ads placed in
as mid-roll (treated) versus pre-roll (untreated) while ac-
longer content have higher completion rates than ads placed
counting for the other confounding variables such as the ad,
in shorter content irrespective of their position. Thus, mid-
video, and viewer characteristics.
roll ads could have a higher completion, not by virtue of
them being placed in the middle of the content, but simply
by being more likely to be placed in longer content. Treated/Untreated Net Outcome
QED. To carefully assess the impact of ad position in iso- mid-roll/pre-roll 18.1%
lation by accounting for other potential confounding factors, pre-roll/post-roll 14.3%
we design a quasi-experiment as described by the matching
algorithm in Figure 6. To compare the e↵ect of placing Table 5: Net QED outcomes support the rule that placing
an ad as mid-roll versus placing as pre-roll, the algorithm an ad as a mid-roll can cause greater completions than as a
finds matched views (u, v) from two similar viewers who have pre-roll or as a post-roll.
the same connection type and geography. Further, the two
matched views are for exactly the same video and the same
ad. The primary di↵erence between the matched views is tion for the same video content for a similar viewer. The
that the ad was played in di↵erent positions, i.e., one view u results confirm the causal impact of ad position on comple-
has the ad as a mid-roll while the other view v has the same tion rates and establish Rule 5.1 in a causal and quantitative
ad as a pre-roll. Note that a positive value for net outcome manner. Further, using the sign test, the p-value for each
provides positive (supporting) evidence for the rule that an quasi-experiment was at most 1.98 ⇥ 10 323 , confirming the
ad in mid-roll completes more often than the same ad as statistical significance of the results.
pre-roll, while a negative value provides negative evidence
for the asserted rule. The algorithm in Figure 6 can be used Discussion.
to compare any pair of ad positions with minor modifica- (1) Note that the impact of ad position on ad completion
tions. For instance, to compare pre-roll with post-roll, we rates turns out to be smaller (but still significant) when the
can apply the same algorithm with pre-roll as the treated confounding factors are accounted for than in the simpler
set T and post-roll as the untreated set C. correlational analysis of Figure 5.
QED Results. The results for the quasi-experiment are (2) If mid-rolls are so e↵ective, why not place only mid-roll
shown in Table 5. These results show that on average ads ads? While our results show that positioning an ad as mid-
run in the mid-roll position are 18.1% percent more likely to roll increases its likelihood of completion, it is not a recom-
complete than the same ad run in the pre-roll position for mendation for advertisers to place only mid-roll ads. If an
the same video content for a similar viewer. Further, ads ad network wants to achieve a certain number of completed
run in the pre-roll position are 14.3% percent more likely ad impressions one needs to worry about both the audience
to complete than the same ad run in the post-roll posi- size and the ad completion rate. Audience size for pre-rollgreater chance of being a post-roll than other ad lengths. We
have to compensate for the confounding e↵ect of variables
such as ad position to isolate the true impact of ad length
on ad completion rates. To that end, we design the quasi-
experiment described below.
Figure 7: The measured ad completion rates in our data set
did not decrease with ad length as expected. The 30-second
ad, while longer, had the highest completion rate in part due
to being placed more frequently in the mid-roll position.
Figure 8: 30-second ads are most commonly mid-rolls, and
15-second ads most commonly pre-rolls. 20-second ads are
ads are larger than mid-roll ads simply because viewers drop more often post-rolls than other lengths.
o↵ before the video progresses to a point where a mid-roll
ad can be played. Likewise, the audience size of a mid-roll
ad is typically larger than that of a post-roll ad. Thus, an Assessing Causal Impact.
ad positioning algorithm would have to carefully consider QED. We design a quasi-experiment where the indepen-
this tradeo↵ when deciding where to place ads. Our work dent variable is the ad length (15-second, 20-second, or 30-
provides an important input to such an algorithm, though second) and the other potential confounding variables are
designing optimal ad placement algorithms is beyond the matched. For a given pair of ad-lengths x 6= y and x, y 2
scope of our work. However, our results do show that post- {15, 20, 30} seconds, we design a quasi-experiment with the
roll ads are generally inferior to mid-roll and pre-roll ads, treated set consisting of videos that contained an ad of length
since post roll ads have both smaller audience sizes and lesser x and the untreated set consisting of videos that contained
ad completion rates. an ad of length y. The matching algorithm that we use is
similar to that in Figure 6 with the following di↵erences.
5.1.3 Ad Length When forming the matched pair of views (u, v) 2 M , we
We classify each ad into the three common categories, ensure that view u played an ad of length x and view v
15-second, 20-second, and 30-second ads, and compute the played an ad of length y. To account for the influence of
completion rate for each category (cf. Figure 7). Ads of ad position, we ensure that the ads were played in the same
30 seconds in length had the highest completion rate and position. Further, we ensure that the viewers of u and v
20-second ads have the least. A fundamental question is are similar with the same geography and connection type
how the ad length causally influences its completion rate. and are watching exactly same video. The scoring step is
With a purely correlational analysis such as that shown in identical to the matching algorithm of Figure 6.
Figure 7, one is liable to incorrectly conclude that 20-second QED Results. The results of the quasi-experiments are
ads are detrimental to ad completion and the sweet spots are shown in Table 6. Our results show that 15-second ads
15-second and 30-second ads. Further, the results appear to
contradict the intuition that longer ads are more likely to be Treated/Untreated Net Outcome
abandoned, since viewers are more likely to loose patience. 15 sec/20 sec 2.86%
To dig deeper, we analyzed the ad positions of the di↵erent 20 sec/30 sec 3.89%
ad lengths (cf. Figure 8). We noticed that 30-second ads are
placed most often as mid-rolls since advertisers intuitively Table 6: Net QED outcomes support the assertion that
realize what we quantified in Section 5.1.2 that the viewer is longer ads result in fewer completions.
more engaged in the middle of video and tend to place their
longest ads there. Thus, the observed high completion rate completed 2.86% more often than the 20-second ones in a
for 30-second ads could be an influence of its ad position head-to-head comparison that accounts for the confound-
that counteracts its larger length. Further, 15-second ads ing factors. Likewise, 20-second ads completed 3.89% more
are placed most often as pre-roll and 20-second ads have a often than the 30-second ones in the head-to-head compari-son. Further, using the sign test, the p-value for the quasi- completion rate of the videos in each bucket. (Each video
experiment is at most 8.52⇥10 30 , confirming the statistical is weighted by the number of ad impressions shown with
significance of the results. Thus we state the following rule. that video for computing the average.) We plot ad com-
pletion rate as a function of the video length in Figure 10.
Rule 5.2. On average, a shorter ad is more likely to com- The ad completion rate shows a positive correlation with
plete than a longer ad, when the other confounding factors video length with Kendall correlation of 0.23. One can fur-
are neutralized.
5.2 Impact of Video-related Factors
We examine two factors that relate to the video: its con-
tent as identified by its unique url, and its length.
5.2.1 Video Content
People typically watch ads so that they are allowed to
watch the video. Therefore, it is reasonable to ask what
influence the video itself has on the completion rate of the
ads embedded within it. Videos in our traces are uniquely
identified by their urls. A video could have been viewed
multiple times, and multiple ads could have been shown as
part of each view. The ad completion rate of a video is
simply the percentage of all ad impressions shown with that
video that completed. Ad completion rate of a video is not
to be confused with the unrelated metric of video completion
rate that relates to whether the video itself completed or not.
One could imagine that the ad completion rates vary from
video to video, with videos with compelling content having
high ad completion rates and videos with boring content
having lower ad completion rates. In Figure 9, we do indeed
see a large variation in ad completion rate across di↵erent
videos with half the ad impressions coming from videos that Figure 10: Ad completion rate and video length have a pos-
have an ad completion rates of 90% or smaller. itive correlation with a Kendall coefficient of 0.23.
ther bucket the videos according to whether they are short-
form or long-form and one can see that short-form video has
a smaller ad completion rate than the long-form (cf. Fig-
ure 11).
Our initial correlational results support the intuition that
a viewer exhibits more patience for an ad to complete if they
are watching long-form content such as a TV episode or a
movie that are often perceived to be of greater value than
short-form content. Such a phenomena is known to hold
in the physical world where researchers who study the psy-
chology of queuing [15] have shown that people have more
patience for waiting in longer queues if the perceived value
of the service that they are waiting for is greater. Dura-
tion of the service often influences its perceived value with
longer durations often perceived as having greater value. In
[14], we showed that viewers are more likely to wait without
abandoning for a longer video to startup than a shorter one.
Our current work implies that a similar phenomenon holds
for viewer patience for ads to complete.
Assessing Causal Impact.
Figure 9: The percentage of ad impressions y% from videos Based on our correlational evidence above, we would like
with ad completion rate at most x%, plotted in 5% buckets to establish the following causal rule by a carefully designed
of ad completion rate. Half the ad impressions belonged to quasi-experiment.
videos with completion rate 90% or smaller.
Rule 5.3. On average, placing an ad in long-form video
can cause a greater completion rate in comparison to placing
the same ad in a short-form video.
5.2.2 Video Length
We narrow our focus to the length of video to assess how QED. We conduct a quasi-experiment where the indepen-
it relates to the ad completion rate. We bucket the video dent variable is the video length (long-form versus short-
length into one minute buckets and compute the average ad form) and other potential confounding variables are matched.Figure 11: Ads embedded in long-form video such as a TV Figure 12: The percentage of ad impressions y% from view-
episode or a movie complete more often than ads embedded ers with completion rate at most x%.
in short-form video such as a news clip.
The matching algorithm that we use is similar to that in Fig-
ure 6 with the following di↵erences. Since the independent
variable is video length, the treated set consists of long-form
videos with ads, while the untreated set consists of short-
form videos with ads. When forming the matched pair of
views (u, v) 2 M , we ensure that the paired views played
the same ad in the same position, i.e., the ad was pre-roll,
mid-roll, or post-roll in both views. Further, the viewers of
u and v are similar in that they are from the same geography
and have the same connection type. Finally, even though u
and v are watching di↵erent videos, one long-form and the
other short-form, we ensure that they are watching videos
from the same video provider. The scoring step is identical
to the matching algorithm of Figure 6.
QED Results. The results of the quasi-experiment pro-
duced a net outcome of 4.2%. The positive net outcome
supports Rule 5.3 by showing that on average an ad that is
placed in long-form video is 4.2% more likely to complete
than the same ad placed in short-form video. Further, using
the sign test, the p-value for the quasi-experiment was at
most 9.9 ⇥ 10 324 , confirming the statistical significance of
the results. Figure 13: Europe has the smallest completion rate while
North America has the greatest.
Discussion.
The impact of video length on ad completion rate is con-
founded by factors such as ad position. For instance, mid- 5.3 Impact of Viewer-related Factors
roll ads that tend to have higher completion rates are more We examine three factors that relate to the viewer in more
commonly embedded in long-form video than in short-form depth: the viewer as identified by his/her unique GUID,
video. Thus, the influence of ad position must be neutral- the viewer’s geographical location, and the temporal factors
ized to get a clearer picture of the impact of video length when the ad was played.
in isolation. Accounting for such confounding factors in the
QED analysis shows a smaller (but still significant) impact 5.3.1 Viewer’s Identity
of video length, though that impact is smaller than what is We compute the ad completion rate of each viewer as sim-
implied by the simpler analysis of Figure 11. ply the percentage of ad impressions that the viewer watched
to completion. In Figure 12, we plot the percent of ad im-
pressions y% that were watched by viewers with completion
rate less than or equal to x%. One can notice the concen-trations of viewers around completion rates of 0%, 50%, and
100%. These concentrations are an artifact of the fact that
a large fraction of viewers see a small number of ads. For
instance, 51.2% see one ad contributing to concentrations
around 0% and 100%. And, 20.9% see only two ads, con-
tributing to concentrations around integer multiples of 1/2.
More generally, one can observe concentrations around inte-
ger multiples of 1/i, where i is a small integer.
5.3.2 Geography
In Figure 13, we show the ad completion rates across dif-
ferent continents in the world. Perhaps the most striking
contrast are between the two most trafficked continents with
Europe having the lowest completion rate and North Amer-
ica having the highest.
5.3.3 Temporal Factors
A plausible hypothesis that exists as a folklore is that
viewers are more likely to watch ads (and complete them)
in the weekend or in the evenings where they tend to be more
relaxed, more patient, and have more spare time. Indeed,
both video and ad viewership peaks in the late evening as
shown in Figures 14 and 15 respectively. However, as shown Figure 15: Ad viewership roughly follows the same trend as
in Figure 16, ad completion rates did not show much time- video viewership.
of-day variation and were nearly identical between weekday
and weekend.
Figure 16: However, ad completion rates do not show major
Figure 14: Video viewership is high during the day, dips weekday/weekend or time-of-day variations.
slightly in the evening, and peaks in the late evening.
site in the 15-day measurement period. Recall that a visit
5.3.4 Repeat Visitors versus One-time Visitors is single session of a viewer visiting a video provider’s site
to watch videos (and ads). Two consecutive visits to a site
It is likely that a viewer who repeatedly comes to a video
from the same viewer are separated by at least 30 minutes of
provider’s site is more interested in the video content of-
inactivity (cf. Figure 1). As shown in Figure 17, there is a
fered by that site than a viewer who comes only occasionally.
noticeable di↵erence in ad completion rates between repeat
Would the increased viewer interest translate to a higher ad
visitors and one-time visitors and that di↵erence persists in
completion rate? To quantitatively answer that question,
all three ad categories of pre-roll, mid-roll, and post-roll.
for each site we classified each viewer of that site into two
categories. A repeat visitor is a viewer who made two or
more visits to that site during the 15-day period of mea- 6. AD ABANDONMENT RATE
surement. A one-time visitor made exactly one visit8 to the While ad completion rates measure whether viewers com-
8 plete watching an ad or not, ad abandonment rates mea-
Note that if a viewer came back to the site after the 15-day
window, our measurements would not show it. sure what portion of the ad was played before the viewerFigure 17: Repeat visitors are more likely to watch ads to Figure 18: Normalized abandonment rate as a function of
completion than one-time visitors to a video provider’s site. ad play percentage has a concave form. Of the viewers who
eventually abandon the ad, about a third of the them have
abandoned before the quarter-way mark and two-thirds of
abandoned. Thus, abandonment rates provide more granu- them have abandoned before the half-way mark.
lar information than completion rates. We define metrics
we use to study abandonment. Suppose we have an ad of
length L time units. Ad play time x, 0 x L, refers to
the amount of time that the ad was played by the viewer the three abandonment curves reach the normalized aban-
during an ad impression. The abandonment rate at time x, donment rate of 100% at 15, 20, and 30 seconds respectively.
0 x L, is the percentage of ad impressions that have ad However, the normalized abandonment rates are nearly iden-
play time less than x, i.e., the percentage of ad impressions tical for the first few seconds and diverge beyond that point.
where the ad was watched for fewer than x time units. By This suggests that perhaps a significant fraction of viewers
definition, the abandonment rate of the ad at time x = L is abandon as soon as the ad starts independent of its length.
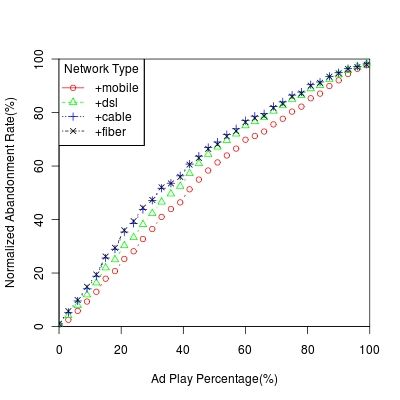
100 minus that ad’s completion rate, since viewers who did Finally, in Figure 20, we show the normalized abandon-
not abandon and watched all L time units completed the ment rate for the di↵erent connection types. Our results do
ad. When aggregating abandonment rates across ads with not show major di↵erences between the four major connec-
di↵erent lengths, we plot ad abandonment rate as a func- tion types for when viewers who eventually abandon stop
tion of a normalized value called ad play percentage which is watching the ad. One plausible explanation could be that
(ad play time/ad length) ⇥ 100. Further, we define normal- viewers have a similar expectations on how long they would
ized abandonment rate to be have to wait for an ad to complete, independent of their
connectivity. This could be contrasted with the situation
(ad abandonment rate/(100 ad completion rate)) ⇥ 100.
where viewers are waiting for a video to start up after a
play is initiated. In this situation, viewers with high-speed
Aggregated over all ad impressions in our study, the aban- connectivity (say, fiber) rightfully expect the video to start
donment rate when ad play percentage equals 100% is 17.9%, up sooner than viewers on a mobile connection. Indeed, in
which equals 100 minus the system-wide completion rate of this situation we showed in our prior work [14] that viewers
82.1%. In Figure 18, we plot the normalized abandonment with faster connectivity abandoned the video sooner than
rate as a function of the ad play percentage. Normalized ad those with slower connectivity, presumably because the for-
abandonment rate is a concave function with viewers aban- mer had greater expectations for a quicker startup and hence
doning at a greater rate initially that subsequently tapers showed less patience for the video to start up.
o↵. One can observe from the figure that when 25% of the
ad is played, the normalized abandonment rate is already
33.3%, i.e., one-third of the viewers who eventually aban- 6.1 Do viewers have more patience for ads than
don have abandoned on or before the quarter-way mark in slow-loading videos?
the ad. Likewise, at 50%, the normalized abandonment rate Consider two situations where a viewer must wait to watch
is 67%, i.e., two-thirds of the viewers who eventually aban- the video of his/her choice. Suppose the first set of viewers
don have abandoned on or before the half-way mark in the must wait for a video that is slow to load and start playing
ad. due to performance issues. While the second set of viewers
Next, in Figure 19, we plot the normalized abandonment must wait for a pre-roll ad to complete before the video be-
rate as a function of ad play time to examine how viewers gins. We compare the rate at which viewers lose patience
abandon for each of the three ad lengths. By definition, and abandon in both situations. Figure 21 shows the aban-You can also read