The distribution of sea-salt aerosol in the global troposphere - Atmos. Chem. Phys
←
→
Page content transcription
If your browser does not render page correctly, please read the page content below
Atmos. Chem. Phys., 19, 4093–4104, 2019
https://doi.org/10.5194/acp-19-4093-2019
© Author(s) 2019. This work is distributed under
the Creative Commons Attribution 4.0 License.

The distribution of sea-salt aerosol in the global troposphere
Daniel M. Murphy1 , Karl D. Froyd1,2 , Huisheng Bian3,4 , Charles A. Brock1 , Jack E. Dibb5 , Joshua P. DiGangi6 ,
Glenn Diskin6 , Maximillian Dollner7 , Agnieszka Kupc1,2,7 , Eric M. Scheuer5 , Gregory P. Schill1,2 ,
Bernadett Weinzierl7,8 , Christina J. Williamson1,2 , and Pengfei Yu1,2,9
1 Chemical   Sciences Division, NOAA Earth System Research Laboratory, Boulder, CO, USA
2 Cooperative   Institute for Research in Environmental Sciences (CIRES), NOAA Earth System Research Laboratory,
University of Colorado, Boulder, CO, USA
3 Joint Center for Environmental Technology, University of Maryland, Baltimore County, Baltimore, MD, USA
4 Laboratory for Atmospheres, NASA Goddard Space Flight Center, Greenbelt, MD, USA
5 Earth Systems Research Center, Institute for the Study of Earth, Oceans, and Space,

University of New Hampshire, Durham, NH, USA
6 NASA Langley Research Center, Hampton, VA, USA
7 Faculty of Physics, University of Vienna, Boltzmanngasse 5, 1090 Vienna, Austria
8 Institut für Physik der Atmosphäre, Deutsches Zentrum für Luft- und Raumfahrt (DLR), Oberpfaffenhofen, Germany
9 Institute for Environment and Climate Research, Jinan University, Guangzhou, China

Correspondence: D. M. Murphy (daniel.m.murphy@noaa.gov)

Received: 24 September 2018 – Discussion started: 7 November 2018
Revised: 5 February 2019 – Accepted: 18 March 2019 – Published: 2 April 2019

Abstract. We present the first data on the concentration of       1   Introduction
sea-salt aerosol throughout most of the depth of the tropo-
sphere and over a wide range of latitudes, which were ob-
tained during the Atmospheric Tomography (ATom) mission.          Sea-salt particles are the largest aerosol component in the at-
Sea-salt concentrations in the upper troposphere are very         mosphere by mass (Liao et al., 2006). They represent about
small, usually less than 10 ng per standard m3 (about 10 parts    30 % of global column optical depth due to aerosols (Bel-
per trillion by mass) and often less than 1 ng m−3 . This puts    louin et al., 2013), a somewhat smaller percentage than for
stringent limits on the contribution of sea-salt aerosol to       mass because of their relatively large size compared to other
halogen and nitric acid chemistry in the upper troposphere.       aerosols. Global climate models disagree on future changes
Within broad regions the concentration of sea-salt aerosol is     in sea-salt aerosol due to changes in wind speed and sea ice
roughly proportional to water vapor, supporting a dominant        in a warming climate (Liao et al., 2006; Jones et al., 2007;
role for wet scavenging in removing sea-salt aerosol from the     Boucher et al., 2013). Given the large contribution of sea
atmosphere. Concentrations of sea-salt aerosol in the winter      salt to the global aerosol optical depth, this could represent a
upper troposphere are not as low as in the summer and the         significant climate feedback, with uncertainty even between
tropics. This is mostly a consequence of less wet scaveng-        different scenarios in the same model (Hoose et al., 2008).
ing in the drier, colder winter atmosphere. There is also a       Sulfuric acid, nitric acid, and some other acids can displace
source of sea-salt aerosol over pack ice that is distinct from    halogens in salt particles. This provides both a sink for sul-
that over open water. With a well-studied and widely dis-         fate and nitrate and a source of reactive chlorine, bromine,
tributed source, sea-salt aerosol provides an excellent test of   and iodine to the atmosphere (Chameides and Stelson, 1992;
wet scavenging and vertical transport of aerosols in chemical     Finlayson-Pitts and Hemminger, 2000).
transport models.                                                    There is a large literature on the source of sea-salt aerosol
                                                                  as a function of wind speed (e.g., Gong, 2003; Lewis and
                                                                  Schwartz, 2004; Grythe et al., 2014). There has been in-
                                                                  creased recognition of the importance of submicron salt par-

Published by Copernicus Publications on behalf of the European Geosciences Union.
4094                                      D. M. Murphy et al.: The distribution of sea-salt aerosol in the global troposphere

ticles to aerosol number (Kreidenweis et al., 1998; Clarke           top of each profile. An extensive payload characterized
et al., 2003, 2006). These submicron sea-salt particles are          both gas-phase and aerosol species (ATom, 2017; https://
enriched in organics compared to sea water, although the             daac.ornl.gov/ATOM/guides/ATom_merge.html, last access:
amount of enrichment is not consistent and may vary under            25 September 2018). Two deployments are considered here:
differing conditions (Middlebrook et al., 1998; Modini et al.,       ATom1 from 29 July to 22 August 2016, in northern sum-
2010; Vignati et al., 2010; Ovadnevaite et al., 2011; Gantt          mer, and ATom2 26 January to 21 February 2017, in north-
and Meskhidze, 2013).                                                ern winter. Some preliminary data from one ATom3 flight
   Almost all of the sea-salt aerosol literature considers mea-      (14 October 2017) are included to extend the latitude range
surements within the marine boundary layer and even there            further south. During ATom1 and ATom2, PALMS acquired
consists mostly of surface measurements. There have been             about 510 000 positive ion spectra and 350 000 negative ion
few measurements of how sea salt varies with altitude. Shi-          spectra of individual particles.
nozuka et al. (2004) presented profiles of nonvolatile aerosol,         Particle size distributions were measured by an ultra-high-
presumed to be sea salt, up to about 2 km altitude for one re-       sensitivity aerosol spectrometer (UHSAS; Kupc et al., 2018)
gion in the Southern Ocean and one region in the tropical            and a laser aerosol spectrometer (LAS, TSI Incorporated). In
Pacific.                                                             the merged size distribution, UHSAS data were used for par-
   We present here the first measurements of the concentra-          ticles less than 0.51 µm diameter during ATom1 and 0.97 µm
tion of sea-salt aerosol over a wide range of altitudes and          during ATom2; the LAS was used for larger particles. The
latitudes. We consider the sea-salt vertical transport, wet          two instruments agreed extremely well in the overlap region
removal, and compositional variability. These data provide           (about 0.4 to 0.97 µm) for all of ATom1 and at low altitudes
strong constraints on aerosol transport efficiency out of the        during ATom2. A leak in the sheath flow of the LAS, traced
marine boundary layer and are a useful tool in evaluating            to the threads of the set screws that center the inlet inside
aerosol removal in large-scale models.                               the sheath flow, led to the LAS under-sampling particles dur-
                                                                     ing ATom2 at high altitudes, when the aircraft cabin pres-
                                                                     sure was much higher than the sample pressure. The extra
2   Methods                                                          sheath flow reduced the sampling rate but did not introduce
                                                                     false counts, as checked occasionally in-flight with filtered
We quantify sea-salt aerosol by merging measured size dis-           air. A correction was derived by comparing the LAS to the
tributions with the fraction of particles in each size range         UHSAS, a printed optical particle spectrometer (POPS), and
identified as sea salt by single particle mass spectrometry.         cloud aerosol spectrometer (CAS) data.
Sea-salt particles were identified from mass spectra of single          The PALMS instrument has substantial biases in sampling
aerosol particles using the Particle Analysis by Laser Mass          efficiency for different size particles, with higher efficiency
Spectrometry (PALMS) instrument (Thomson et al., 2000).              for particles about 1 to 3 µm diameter compared to about
Particles enter a vacuum and cross a split continuous laser          300 nm by a factor of about 10 and steeply falling efficiency
beam. The transit time between the beams provides the parti-         for sizes smaller than 300 nm. In addition, a custom virtual
cle velocity, used to determine its aerodynamic diameter. The        impactor in the PALMS sampling line deliberately enriched
aerosol inlet to PALMS is controlled to about 35 mbar, with          the concentration of super-micron particles in order to get
a small dependence on outside pressure because the pres-             better statistics for dust and sea salt. To some extent the bias
sure transducer used for control was not positioned to capture       toward sampling larger particles is beneficial because it en-
the full effect of a jet downstream of the first critical orifice.   hances the rate of sampling particles with more mass, but
Transit times were calibrated to known particle sizes at labo-       it complicates interpretation. Overall, PALMS is much bet-
ratory pressure (about 820 mbar) before and after every field        ter at measuring fractional rather than absolute abundances
deployment. An excimer laser is triggered when a particle            of species such as sea salt. Combining such fractions with
arrives at the second laser beam and ions are produced when          independently measured size distributions allows quantita-
the 193 nm pulse hits the particle. Either positive or negative      tive concentration measurements. Rather than directly cali-
ions are analyzed with a time-of-flight mass spectrometer,           brating the PALMS and virtual impactor sampling efficien-
with the polarity switched every few minutes. For these data,        cies, data here are normalized to the UHSAS and LAS par-
about 60 % of the time was spent acquiring positive ion spec-        ticle size distributions. Conceptually, if a given percentage
tra.                                                                 of, for example, 1 to 2 µm diameter particles are sea salt,
   The PALMS instrument was flown on the NASA DC-                    then the absolute concentration can be determined by mul-
8 during the Atmospheric Tomography Mission (ATom) as                tiplying the concentration of particles of that size from the
well as earlier missions. The ATom mission consisted of              LAS by the percentage of sea salt determined by PALMS. Al-
several series of flights between about 85◦ N and 65–80◦ S           though simple in concept, this normalization is complicated
latitude over both the Pacific and Atlantic oceans. Flights          in detail because the UHSAS and LAS measure optical di-
consisted of successive en route ascents and descents from           ameter, which depends on refractive index, whereas PALMS
about 160 m to 12 km with 5 to 15 min at the bottom and              measures aerodynamic diameter, which depends on density.

Atmos. Chem. Phys., 19, 4093–4104, 2019                                               www.atmos-chem-phys.net/19/4093/2019/
D. M. Murphy et al.: The distribution of sea-salt aerosol in the global troposphere 4095
The PALMS vacuum inlet is pressure-controlled so its trans- anomalous particles in clouds, both sea salt and other com-
mission is mostly independent of aircraft altitude. A separate positions, reinforcing the decision to exclude in-cloud data.
publication (Froyd et al., 2019) is in preparation with more Sea-salt particles were identified in the positive ion mass
details about the normalization. spectra using a combination of peaks, starting with a large
PALMS, the LAS, and the UHSAS all sampled from a Na+ peak (greater than at least 17 % or 30 % of the ion cur-
University of Hawaii inlet owned by NASA Langley on the rent from a particle, depending on other peaks in the spec-
DC-8 (McNaughton et al., 2007). About 1.5 m of 0.25 in. trum). Identification also required a potassium peak of ap-
outside diameter stainless steel tubing with a usual volumet- propriate size. Particles were excluded as sea salt if they con-
ric flow rate of 3.5 to 7 L min−1 led to a custom virtual im- tained aluminum (from clay minerals), barium (from fly ash
pactor with a 1 µm cut point mounted on the PALMS instru- and other minerals), or a variety of other metals. A hierarchi-
ment. The virtual impactor design closely followed Loo and cal cluster analysis (Murphy et al., 2003) was also used. Al-
Cork (1988) except it was slightly scaled for our flow and though the cluster analysis generated clusters of mass spec-
desired cut point. After the virtual impactor about 20 cm of tra that matched sea salt, criteria based on peak height were
0.125 in. stainless steel followed by 20 cm of 0.125 in. con- more reliable than the cluster analysis for identifying salt.
ductive Teflon tubing led to the PALMS focusing inlet. The Instead, the cluster analysis was most useful for excluding a
volumetric flow after the virtual impactor was 0.7 L min−1 . few uncommon clusters that passed the peak height criteria
The tubing was at aircraft cabin temperature except that but were not sea salt. For the great majority of sea-salt par-
about the last 5 cm was taped to a heat pipe connected to the ticles the identification was very clear. Figure 1 shows the
PALMS ion source region, which was temperature controlled mass spectrum of a single particle, chosen to be close to the
at 35 ◦ C. This slight warming to > 25 ◦ C was done to avoid average of all sea-salt mass spectra.
condensation in the aerodynamic focusing vacuum inlet on The main concern in identification is that at extremely low
PALMS at low altitudes in the tropics. With the inlet tubing concentrations of sea-salt aerosol, as found over land or at
warmer than outside the aircraft, the relative humidity in the high altitude, there may be a contribution from other parti-
inlet was less than 40 % for the majority of boundary layer cles, particularly dust from salt flats that is chemically similar
sampling so the water content of the sea-salt particles was re- to oceanic sea salt. A manual review was made of ∼ 100 par-
duced. Correlations between aerodynamic diameter and light ticles automatically classified as sea salt and a similar num-
scattering suggest that the salt particles did not effloresce in ber automatically classified as not sea salt. This was done
the inlet. There was probably insufficient residence time for for high-altitude coarse particles, the hardest region for the
efflorescence even when the relative humidity in the inlet was automatic classification. No definite sea-salt particles were
very low. For sea-salt aerosol mass concentrations we assume missed and there was one definite false positive. More than
that the sea-salt particles were deliquesced, except if the out- 20 particles were borderline, mostly classified as sea salt by
side relative humidity was less than 35 %, when we assume the automated algorithm. These were mostly spectra with
they were dry. At low temperatures sea salt partially efflo- sodium and potassium in a reasonable ratio for sea salt but
resces at about 40 % relative humidity (Koop et al., 2000). magnesium at the wrong ratio. Note that if particles efflo-
The University of Hawaii inlet on the DC-8 has been resce into inhomogeneous crystals, then the PALMS laser
shown to quantitatively transmit particles as large as 3.1 µm, can sometimes preferentially ionize just one region of a par-
at least at low altitude (McNaughton et al., 2007). Both the ticle with varying amounts of magnesium. There was a much
focusing inlet on PALMS and the LAS inlet tubing do not smaller percentage of borderline identification in the marine
transmit particles larger than about 4 or 5 µm, so results here boundary layer where higher humidity led to mostly liquid
represent particles smaller than about 3 µm (dry geometric particles that ionize more uniformly. The Na+ peaks from
diameter). Note that the measured size range of ∼ 0.18 to sea-salt particles were often sufficiently large that they ei-
3 µm often represents a minority of sea-salt aerosol by mass, ther saturated the detector or were broadened due to some
as indicated by the size distribution of large sea-salt particles sort of repulsion in the ion source. This tended not to affect
detected by the cloud probes in the cloud-free marine bound- the identification of a mass spectrum as sea salt but only the
ary. When comparing to other data or model results, the size quantification of the Na peak.
range must be considered. Sea-salt particles can also be identified from negative ion
In-cloud data are excluded from the results shown here. spectra using chloride ions and cluster ions containing Na.
Huebert et al. (1990) showed that up to 90 % of the largest Data in this paper are from positive ion spectra because in
sea-salt particles in the marine boundary layer can deposit to aged sea-salt particles the chloride can be almost entirely dis-
the walls of an inlet. Cloud droplets or ice crystals impacting placed by sulfate and nitrate, making identification more dif-
a forward-facing aircraft inlet can act like a high-pressure ficult with negative ions. In regions with fresh sea salt, results
washer to dislodge some of that salt, potentially leading to from negative ion spectra were nearly identical to those from
large sea-salt artifacts in clouds. During both ATom and positive ion spectra.
previous missions (Murphy et al., 2004), PALMS observed The number and mass of sea-salt particles were calculated
for every 5 min of flight time in order to acquire enough mass
www.atmos-chem-phys.net/19/4093/2019/ Atmos. Chem. Phys., 19, 4093–4104, 20194096 D. M. Murphy et al.: The distribution of sea-salt aerosol in the global troposphere Figure 1. Mass spectra of (a) a typical sea-salt particle and (b) a highly processed sea-salt particle where the chloride has been replaced by nitrate and sulfate. The spectrum in panel (a) is chosen to be similar to the average of all low-altitude spectra of sea salt. spectra for a statistically significant normalization to the UH- short cloud encounters without losing the data before and af- SAS and LAS size distributions. During climbs and descents, ter the cloud. The internal consistency of the data suggests 5 min represents about 2.5 km in altitude. Mass spectra of that the detection limit for sea salt is better than 10 ng m−3 sea-salt particles were typically acquired at a rate of more over a few minutes and better than 1 ng m−3 when hours of than one per second in the marine boundary layer and less data are available. Exact detection limits depend on the size than one per minute at high altitude. distribution and the amount of internal mixing. In favorable Figure 2 shows concentrations of sea-salt aerosol at low al- circumstances the detection limits can be 1 ng m−3 . titudes measured by the PALMS and LAS combination com- pared to filter measurements of sodium (Dibb et al., 1999). The filter samples indicate more sea-salt mass, which is ex- 3 Results pected because the inlet to the filter sampler transmitted larger particles than the inlet to PALMS. The good correla- The concentration of sea-salt aerosol in the marine bound- tion adds confidence to the PALMS measurements in the up- ary layer measured by PALMS was usually between 0.3 and per troposphere, which are much more sensitive than the fil- 3 µg m−3 . Such concentrations are reasonable considering ter sampler. Because PALMS samples each particle at a par- the upper cut point of about 3 µm diameter. The concentra- ticular time, its composition can be associated with a partic- tions in the marine boundary layer were highly variable and ular altitude, aerosol concentration, water vapor concentra- modestly positively correlated with the local wind speed at tion, and so forth. This allows for very long averaging times flight altitude. This is consistent with Shinozuka et al. (2004). in similar air. For example, the average concentration of sea- Although the sea-salt aerosol production rate can be closely salt aerosol in air with 10 to 20 ppmv of water can be calcu- related to wind speed, the correlation with local wind speed is lated from collecting many such stretches of flight data even modest because the concentration also depends on the wind though they are not contiguous in time and might even be on fetch and whether or not there has been recent precipita- different days. Furthermore, the PALMS single particle data tion. Sea-salt aerosol concentrations near the surface were are easier to screen for short periods of cloud and other arti- also correlated with relative humidity. This is expected since facts than the extended filter samples are. One can eliminate low relative humidity would indicate that the air was not well Atmos. Chem. Phys., 19, 4093–4104, 2019 www.atmos-chem-phys.net/19/4093/2019/
D. M. Murphy et al.: The distribution of sea-salt aerosol in the global troposphere 4097
trations measured during ATom will be discussed in future
publications.
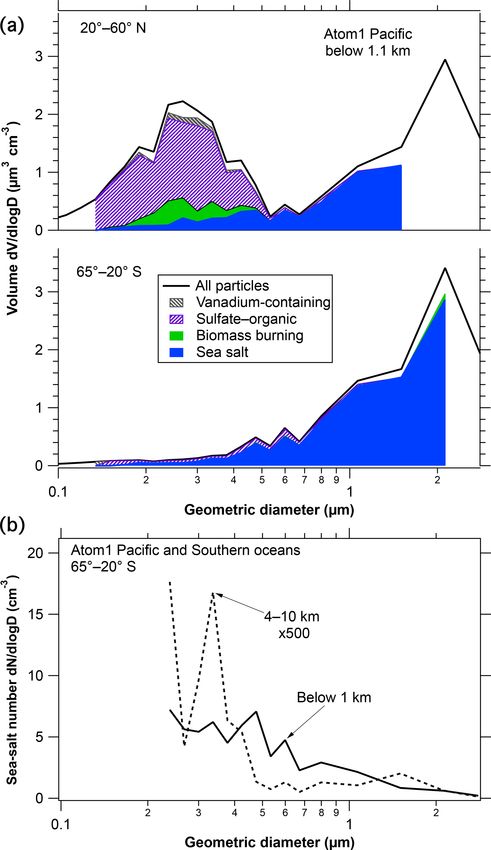
A salient property of the distribution of sea-salt aerosol
in Fig. 3 is that the concentration falls off rapidly with alti-
tude, by about a factor of 10 for every 2 km. Above 6 km, the
concentrations were almost always less than 10 ng m−3 . The
decrease at the top of the marine boundary layer was often
very sharp in individual profiles. This was more apparent on
past missions because the ATom mission ascents were rela-
tively rapid. During the 2002 Intercontinental Transport and
Chemical Transformation Experiment (ITCT) off the coast
of California, PALMS was on the NOAA P-3 that often flew
just above and below the top of the boundary layer. There,
the sea-salt aerosol concentration could change by more than
a factor of 10 in less than 100 m altitude at the top of the ma-
rine boundary layer. The few sea-salt particles in the upper
troposphere were similar in size and more chemically pro-
cessed than those in the marine boundary layer.
Figure 4 shows size distributions of sea-salt particles from
Figure 2. Sea-salt aerosol mass at low altitudes derived from PALMS during ATom1. Most of the sea-salt mass is in par-
PALMS compared to filter samples of aerosol sodium. The inlet ticles larger than 1 µm, most of the number is smaller than
for the filter sampler transmits larger particles than the PALMS in- 1 µm. In the lower panel the size distribution from the up-
let; hence, PALMS is expected to sample somewhat less mass. The per troposphere is multiplied by 500 to get it on the same
1 : 1 line is displaced because not all sea-salt mass is sodium. The scale as the size distribution in the marine boundary layer,
cutoff at 85 % relative humidity is imposed because comparing the emphasizing the strong removal of sea salt. The number dis-
different inlet cut points becomes especially problematic when the
tribution is shown from the Southern Hemisphere (SH) be-
particles are enlarged due to water uptake at high humidity.
cause for submicron particles in the Northern Hemisphere
(NH) both the number of particles and the fraction of sea salt
are very steep functions of diameter, leading to large uncer-
tainties when they are multiplied. The mass distributions and
mixed from the ocean surface up to the altitude of the DC-8. the Southern Hemisphere number distribution are less steep.
For example, during one boundary layer sampling leg over The high and low altitude size distributions (Fig. 4b) show
the ocean there was almost no sea salt at 160 m altitude, but some differences of a factor of ∼ 3 as a function of diam-
the relative humidity was much less than 50 %, indicating eter. Such detailed differences in the size distribution with
limited surface influence for that particular leg. altitude vary by region. We would emphasize instead that an
There are already extensive measurements of sea-salt overall large removal factor is present across the entire 0.3
aerosol in the marine boundary layer (Lewis and Schwartz, to 3 µm diameter range. This may indicate that much of the
2004). The novel data here are the concentrations at higher removal of sea-salt aerosol was by nucleation scavenging in
altitudes. Figure 3 shows a latitude–altitude cross section of cloud rather than impaction by precipitation. Particles large
sea-salt aerosol concentrations over the Pacific Ocean. Even enough to be measured by PALMS are all large enough to be
though they were in different seasons, systematic differences condensation nuclei, whereas impaction scavenging is much
between ATom1 and ATom2 are not visible on a log color more efficient for coarse particles than submicron particles
scale so they are combined in Fig. 3. More subtle differences (Pruppacher and Klett, 1997).
depending on season are discussed below. The Pacific Ocean
is shown because there was less mineral dust to complicate 3.1 Sea-salt aerosol over pack ice
the analysis of very low concentrations; concentrations over
the Atlantic Ocean were similar. Shinozuka et al. (2004) in- Sea-salt aerosols were not confined to areas with open wa-
ferred sea-salt aerosol concentrations from nonvolatile par- ter. Significant concentrations of sea-salt aerosol were also
ticles. The results shown here agree that this was valid for observed over ice-covered regions of the Arctic Ocean dur-
their measurements at < 2 km over the Pacific and South- ing ATom. For a portion of a flight north of Alaska on
ern oceans. However, it is not true in general that most non- 19 February 2017, the nearest large areas of open water
volatile particles are sea salt. For example, at higher altitudes were about 1000 km away. Yet significant concentrations of
(e.g., 10 km) than Shinozuka et al. (2004) measured, non- sea-salt aerosol (∼ 1 µg m−3 below 3 µm diameter) were ob-
volatile particles would be many times more likely to be dust served at altitudes below 400 m. The sea-salt aerosol was
than sea salt, even over the middle of the ocean. Dust concen- only at low altitude, supporting a local source. Similar con-
www.atmos-chem-phys.net/19/4093/2019/ Atmos. Chem. Phys., 19, 4093–4104, 20194098 D. M. Murphy et al.: The distribution of sea-salt aerosol in the global troposphere
Figure 3. Concentration of sea-salt aerosol during the ATom1 and ATom2 flights over the Arctic, Pacific, and Southern oceans. The blank
region between about 60 to 70◦ N is because of flying over land (Alaska). The color scale is from 2.5 ng m−3 to 2.5 µg m−3 (at standard
conditions). These concentrations include sea-salt particles between about 180 nm and 3 µm diameter. Data are averaged over bins of 750 m
vertically and about 4◦ latitude; points are plotted at the midpoint location of the data within each bin.
centrations were also observed by PALMS on flights north of served during ATom1, which was flown during August when
Alaska during the Aerosol, Radiation, and Cloud Processes much of the Arctic Ocean had some open water. Unfortu-
affecting Arctic Climate (ARCPAC) mission in March–April nately, occasional detector saturation by the Na+ peak, as
2008. Significant sea-salt aerosol concentrations have also well as changing ionization patterns (such as the presence or
been measured during winter at ground-based Arctic stations absence of cluster ions), makes it impossible to be more pre-
(Quinn et al., 2002). Data from Utqiaġvik (formerly Barrow), cise about the amount of Na depletion other than to say it was
Alaska, indicate some sea-salt aerosol production from leads between about 20 % and 50 %. During both ARCPAC and
but also show high concentrations of sea salt at times with no ATom, sea-salt particles were also somewhat smaller over the
nearby open water in leads (May et al., 2016). ice-covered Arctic Ocean than other regions.
Mass spectra of sea-salt particles over the ice-covered Arc- Na depletion in polar sea-salt aerosol is consistent with
tic Ocean were depleted in Na relative to Mg, K, and Ca com- Wagenbach et al. (1998) and Hara et al. (2012), who found
pared to particles at lower latitudes (Fig. 5). The Na depletion ≥ 10 % depletion of Na relative to Mg and K in sea-salt
over the Arctic was due to an increased population of parti- aerosol presumed to be formed from sea ice around Antarc-
cles with low Na rather than every particle having less Na. It tica. The PALMS data support the idea that some form of ice
is robust in the following sense: we used the NH Pacific as a brine, whether it be frost flowers and/or blowing briny snow,
reference case for ATom2 because that is the region with the is an important source of sea-salt aerosol in the Arctic and
most data in the marine boundary layer. We then compared Antarctic (Domine et al., 2004; Alvarez-Aviles et al., 2008;
data from other ocean regions with the NH Pacific. The mag- Huang and Jaeglé, 2017).
nitude of the difference in the average Na signal between the
Arctic Ocean and the NH Pacific was much larger than the 3.2 Sea-salt aerosol as a diagnostic for aerosol removal
differences between the NH Pacific and any of the other open
ocean regions, showing that the Arctic sea-salt aerosol is dis- Simple altitude profiles of PALMS sea-salt aerosol in vari-
tinct from open ocean sea-salt aerosol. ous latitude bands will be presented in model–measurement
Similar Na depletion was also observed during ARCPAC comparison papers (Yu et al., 2019; Bian et al., 2019; Zhang
when comparing mass spectra of particles over Arctic Ocean et al., 2019). An alternative way of presenting the concentra-
compared to test flights over the Gulf of Mexico. In contrast, tion of sea-salt aerosol is as a correlation with water vapor
significant Na depletion over the Arctic Ocean was not ob- (Fig. 6). Sea salt is water soluble, so one might expect that
its removal would approximately scale with removal of water
Atmos. Chem. Phys., 19, 4093–4104, 2019 www.atmos-chem-phys.net/19/4093/2019/D. M. Murphy et al.: The distribution of sea-salt aerosol in the global troposphere 4099
Figure 5. Average spectra of sea-salt particles larger than 1 µm di-
ameter for the Arctic and lower latitude regions during ATom2.
Na peaks were smaller over the Arctic Ocean than over the Pacific
Ocean in the Northern Hemisphere . The South Atlantic is included
to provide an estimate of consistency between regions that should be
similar. Spectra were selected that have ion intensities large enough
to measure minor peaks but that will not significantly saturate the
Na peak. n ≈ 5500 for the NH Pacific, 700 for the SH Atlantic, and
300 for the Arctic.
water is removed about 90 % of the sea-salt aerosol is re-
moved. Labels indicate water mixing ratios beyond which
most clouds are ice or most are liquid water, based on satu-
ration vapor pressures of −15 to −5 ◦ C at 850 to 500 mbar.
There is some indication, especially in the Northern Hemi-
sphere data, that sea-salt aerosol removal is more efficient
in liquid water clouds than in ice clouds. The log slopes are
greater than 1 at high water mixing ratios and close to or less
than 1 at low water mixing ratios. Some proportionality be-
tween sea-salt aerosol and water vapor continues to very low
water mixing ratios where the clouds must be ice rather than
liquid water. This is somewhat surprising, since the Bergeron
Figure 4. Size distributions of sea-salt particles in the marine process whereby ice crystals grow at the expense of water
boundary layer. Panel (a) shows how the total size distribution droplets in a mixed-phase cloud could leave many salt par-
(black line) is multiplied by PALMS composition at each size to ob- ticles behind even if those particles had originally acted as
tain the volume of sea-salt particles. White areas below the size dis-
condensation nuclei. There are several possible explanations
tribution curves represent unknown compositions or, at the largest
and smallest diameters, insufficient data to assign composition. The
for the continued removal of sea-salt aerosol at very low tem-
reduced concentration above about 3 µm diameter is because the peratures. Sodium chloride dihydrate can be an effective ice
aircraft inlet does not efficiently transmit larger particles. Panel (b) nucleus below 227 K (Wagner and Möhler, 2013). Nonspher-
compares the number size distributions at low and high altitudes. ical ice crystals can scavenge aerosols by impaction more ef-
ficiently than spherical droplets (Pruppacher and Klett, 1997,
chap. 17) A less microphysical explanation could be that
via precipitation. Figure 6 shows that this is the case, at least the driest air in the upper troposphere is the result of very
when considered as an average over many vertical profiles. deep convection. If such intense convective clouds scavenge
Because the concentration of water vapor falls off rapidly nearly all sea-salt particles, then the observed correlation of
with altitude, the correlations in Fig. 6 are in a sense verti- sea-salt aerosol with water vapor at low concentrations could
cal profiles. However, the concentration of sea-salt aerosol be due to mixing very dry air with nearly all of sea-salt
is often better correlated with water vapor than with altitude aerosol removed with mid-tropospheric air containing more
itself. of both water and salt.
The log–log slopes are not far from one, indicating that In many ways Fig. 6 shows a remarkably simple picture
sea-salt aerosol is removed with water: when 90 % of the of sea-salt aerosol concentrations by season and hemisphere.
www.atmos-chem-phys.net/19/4093/2019/ Atmos. Chem. Phys., 19, 4093–4104, 20194100 D. M. Murphy et al.: The distribution of sea-salt aerosol in the global troposphere
lower absolute humidity in the colder winter air. This sug-
gests two reasons more sea-salt aerosol can reach the upper
troposphere in winter than in summer. The main reason is
that more sea-salt particles can survive into the upper tropo-
sphere in winter simply because in winter there is less water
available to wash out the aerosol. Second, removal of sea-salt
aerosol in ice clouds may be less efficient than in liquid water
clouds.
Model results for the correlation between sea-salt aerosol
and water vapor are shown in Fig. 7. For simplicity only a
subset of the regions in Fig. 6 are shown. The Community
Earth System Model with the Continuous-time Autoregres-
sive Moving Average (CESM-CARMA) couples a sectional
aerosol model (Yu et al., 2015; Toon et al., 1988) with the Na-
tional Science Foundation and Department of Energy CESM.
CARMA uses 20 size bins for sea spray aerosols which are
composed of salt, marine sulfate, and marine organics. The
Goddard Earth Observing System Model version 5 (GEOS-
5) simulates meteorological fields to drive the online God-
dard Chemistry Aerosol Radiation and Transport (GOCART)
aerosol model (Colarco et al., 2010; Bian et al., 2013). GO-
CART sea-salt aerosol is emitted using an upgraded emission
algorithm (Gong, 2003; Bian et al., 2019) and removed by
warm cloud from convective updraft and large-scale rainout
and washout, as well as by dry deposition and sedimentation
(Chin et al., 2002). A humidified sea-salt particle size (Ger-
ber, 1985) is used for computations of particle fall velocity,
deposition velocity, and optical parameters. The detailed de-
scription of the GEOS-5–GOCART sea-salt aerosol simula-
tion for this work is given in Bian et al. (2019).
Both models reproduce the strong correlation between
sea-salt aerosol and water vapor. Both models also capture
Figure 6. Measured average sea-salt mass concentrations as a func-
the difference between the winter and summer hemispheres
tion of water vapor. Latitude bands for the Northern and Southern
hemispheres are 20 to 65◦ except for the labeled data over Antarc- in the correlation. The GEOS-5 model may be removing
tica. All data except those beyond 70◦ S are from the Pacific Ocean aerosol too slowly in ice clouds. The comparison to these
side of North and South America. Arrows in panel (a) show approx- data uncovered an error in aerosol removal in the CESM
imate water mixing ratios above which most clouds are liquid water model in which sea-salt aerosol was originally overestimated
and below which most clouds are ice. One way to view the graph is by a factor of over 100 in the upper troposphere. One ex-
to consider water vapor as a vertical scale with wet air at low alti- ample is shown in Fig. 7. The overestimate was traced to
tudes and dry air at high altitudes. In both hemispheres the winter aerosols not being properly removed from air transported in
data show more sea-salt aerosol in the upper troposphere at a given the sub-grid convective parameterization. A detailed analy-
amount of water vapor than either the summer hemisphere or the sis and new removal parameterization are described by Yu
tropics.
et al. (2019). An interaction between removal and entrain-
ment parameterizations was also identified as an issue in the
Community Atmosphere Model version 5 (CAM5) by Wang
Since the ATom1 and ATom2 deployments were roughly et al. (2013), based on black carbon data in the upper tropo-
6 months apart and covered both hemispheres, it is possi- sphere. The CARMA bin microphysics also reproduces the
ble to distinguish seasonal and hemispheric differences. Con- similar shape of the size distribution of sea-salt aerosol at dif-
centrations in the tropical atmosphere show little seasonal ferent altitudes (Fig. 4b). In the model, only particles larger
dependence. The two summer hemispheres are fairly simi- than about 3 µm decrease strongly with altitude due to gravi-
lar to the tropics. The two winter curves are shifted up and tational sedimentation.
to the left. Especially in the Northern Hemisphere, the sea-
salt concentration near the ocean surface (at the top right of
each curve) is not all that different in winter and summer. In-
stead, a similar amount of sea-salt aerosol is emitted into a
Atmos. Chem. Phys., 19, 4093–4104, 2019 www.atmos-chem-phys.net/19/4093/2019/D. M. Murphy et al.: The distribution of sea-salt aerosol in the global troposphere 4101
than the amount of sulfate in mixed sulfate and organic par-
ticles. Note that the minimal chemical importance of sea-
salt aerosol is for the upper troposphere only: in the marine
boundary layer reactions with sea-salt particles can signif-
icantly modify the gas-phase bromine, nitrate, and sulfate
budgets.
4 Summary
These are the first measurements of sea-salt aerosol over a
wide range of altitudes and latitudes. Data are available from
near the surface to about 12 km altitude from about 65◦ S to
80◦ N. The final ATom data set will add two more seasons
and extend the data to beyond 80◦ S. Detailed comparisons
with chemical transport models are underway (Bian et al.,
2019; Zhang et al., 2019). One of these comparisons iden-
tified a problem in aerosol vertical transport in the CESM
model (Yu et al., 2019).
Figure 7. Model correlations for the CESM-CARMA and GEOS- Sea-salt aerosol’s only source is at the surface and its only
5 models. ATom2 and tropical curves are omitted for simplicity. sink is by scavenging (i.e., sea-salt particles do not evapo-
GEOS-5 model output was sampled along the flight tracks and rate). That makes sea-salt aerosol a powerful tool to study
CESM-CARMA at all altitudes in a curtain along the flight tracks. wet removal of aerosol. The data here indicate that removal
Also shown is one curve from the CESM-CARMA model before a
of sea-salt aerosol is very approximately proportional to the
revised convective aerosol removal scheme was implemented (Yu et
al., 2019).
removal of water over a wide range of absolute humidity,
with possibly more efficient removal in liquid water clouds
than in ice clouds.
3.3 Implications for reactive gases
One consequence of the small concentrations of sea-salt Data availability. Data are publicly available at https://doi.org/
aerosol in the upper troposphere is that it contributes lit- 10.5067/Aircraft/ATom/TraceGas_Aerosol_Global_Distribution
(ATom, 2017) and http://esrl.noaa.gov/csd/projects/atom/data.php
tle to chemical reactivity. In particular, Wang et al. (2015)
(last access: 28 March 2019).
postulated an important role for upward transport of sea-salt
aerosol followed by release of bromine into the upper tropo-
sphere. These data show that de-bromination of sea salt can- Author contributions. KDF, GPS, and DMM provided PALMS
not be a significant source in the upper troposphere. There data. CAB, AK, MD, BW, and CJW provided size distribution data.
was almost always less than 10 ppt of sea-salt aerosol by JED and EMS provided filter data. JPD and GD provided water va-
mass and often less than 1 ppt. Given that sea salt is very por data. HB and PY provided model results. DMM wrote the paper
roughly 0.1 % by mole bromine, there would be parts per with assistance from all authors.
quadrillion of bromine available from transported sea-salt
aerosol. If bromine from sea-salt aerosol is to significantly
affect the upper troposphere, it would have to be released at Competing interests. The authors declare that they have no conflict
low altitude and transported in the gas phase, although it is of interest.
not clear if there are any suitable gas-phase bromine com-
pounds that would survive wet scavenging.
The small concentrations of sea-salt aerosol in the upper Acknowledgements. The participation of PALMS in the Atmo-
troposphere also provide a strong constraint on the influence spheric Tomography Mission flights (ATom1 and ATom2) was sup-
of salt on the gas-phase reactive-nitrogen budget. Even com- ported by NOAA climate funding. The mission as a whole was sup-
ported by NASA’s Earth System Science Pathfinder Program EVS-2
plete replacement at altitude of sea-salt chlorine by nitrate
funding. Charles A. Brock and Christina J. Williamson were sup-
would be a very small sink for nitrate compared to the hun-
ported by award NNH15AB12I and by NOAA’s Health of the At-
dreds of pptv of NOy in the upper troposphere (Weinheimer mosphere and Atmospheric Chemistry, Carbon Cycle, and Climate
et al., 1994; Emmons et al., 1997). NOy measurements are Programs. Agnieszka Kupc was supported by the Austrian Science
available as part of the ATom data set (ATom, 2017). A sim- Fund’s Erwin Schrodinger Fellowship J-3613. The CESM project is
ilar argument applies to sulfate: in the upper troposphere the supported by the National Science Foundation and the Office of Sci-
maximum amount of sulfate in sea-salt aerosol is far less ence (BER) of the US Department of Energy. Bernadett Weinzierl
www.atmos-chem-phys.net/19/4093/2019/ Atmos. Chem. Phys., 19, 4093–4104, 20194102 D. M. Murphy et al.: The distribution of sea-salt aerosol in the global troposphere
and Maximillian Dollner have received funding from the European Clarke, A., Kapustin, V. Howell, S., Moore, K., Lienert, B., Maso-
Research Council (ERC) under the European Union’s Horizon 2020 nis, S., Anderson, T., and Covert, D.: Sea-salt size distributions
research and innovation program under grant agreement no. 640458 from breaking waves: Implications for marine aerosol produc-
(A-LIFE) and from the University of Vienna. We thank the ATom tion and optical extinction measurements during SEAS, J. At-
team and crews for making the flights possible, and Bruce Anderson mos. Ocean. Tech., 20, 1362–1374, 2003.
of NASA Langley for the use of the University of Hawaii inlet. Clarke, A. D., Owens, S. R., and Zhou, Z.: An ultrafine sea-salt
flux from breaking waves: Implications for cloud condensation
nuclei in the remote marine atmosphere, J. Geophys. Res., 111,
Review statement. This paper was edited by Yafang Cheng and re- D06202, https://doi.org/10.1029/2005JD006565, 2006.
viewed by two anonymous referees. Colarco, P., da Silva, A., Chin, M., and Diehl, T.: On- line
simulations of global aerosol distributions in the NASA
GEOS-4 model and comparisons to satellite and ground
based aerosol optical depth, J. Geophys. Res., 115, D14207,
https://doi.org/10.1029/2009JD012820, 2010.
References Dibb, J. E, Talbot, R. W., Scheuer, E. M., Blake, D. R., Blake, N.
J., Gregory, G. L., Sachse, G. W., and Thornton, D. C.: Aerosol
Alvarez-Aviles, L., Simpson, W. R., Douglas, T. A., Sturm, M., chemical composition and distribution during the Pacific Ex-
Perovich, D., and Domine, F.: Frost flower chemical compo- ploratory Mission (PEM) Tropics, J. Geophys. Res., 104, 5785–
sition during growth and its implications for aerosol produc- 5800, 1999.
tion and bromine activation, J. Geophys. Res., 113, D21304, Domine, F., Sparapani, R., Ianniello, A., and Beine, H. J.: The ori-
https://doi.org/10.1029/2008JD010277, 2008. gin of sea salt in snow on Arctic sea ice and in coastal regions,
ATom: Measurements and modeling results from the NASA Atmo- Atmos. Chem. Phys., 4, 2259–2271, https://doi.org/10.5194/acp-
spheric Tomography Mission, https://doi.org/10.5067/Aircraft/ 4-2259-2004, 2004.
ATom/TraceGas_Aerosol_Global_Distribution, 2017. Emmons, L. K., Carroll, M. A., Hauglustaine, D. A., Brasseur, G.
Bellouin, N., Quaas, J., Morcrette, J.-J., and Boucher, O.: Estimates P., Atherton, C., Penner, J., Sillman, S., Levy II., H., Rohrer, F.,
of aerosol radiative forcing from the MACC re-analysis, At- Wauben, W. M. F., Van Velthoven, P. F. J., Wang, Y., Jacob, D.,
mos. Chem. Phys., 13, 2045–2062, https://doi.org/10.5194/acp- Bakwin, P., Dickerson, R., Doddridge, B., Gerbig, C., Honrath,
13-2045-2013, 2013. R., Hübler, G., Jaffe, D., Kondo, Y., Munger, J. W., Torres, A.,
Bian, H., Colarco, P. R., Chin, M., Chen, G., Rodriguez, J. M., and Volz-Thomas, A.: Climatologies of NOx and NOy : A com-
Liang, Q., Blake, D., Chu, D. A., da Silva, A., Darmenov, A. S., parison of sata and models, Atmos. Environ., 12, 1851–1904,
Diskin, G., Fuelberg, H. E., Huey, G., Kondo, Y., Nielsen, J. E., 1997.
Pan, X., and Wisthaler, A.: Source attributions of pollution to the Finlayson-Pitts, B. J. and Hemminger, J. C.: Physical chemistry of
Western Arctic during the NASA ARCTAS field campaign, At- airborne sea salt particles and their components, J. Phys. Chem.
mos. Chem. Phys., 13, 4707–4721, https://doi.org/10.5194/acp- A, 104, 11463–11477, 2000.
13-4707-2013, 2013. Froyd, K. D., Murphy, D. M., Ziemba. L. D., Brock, C. A.,
Bian, H., Froyd, K., Murphy, D. M., Dibb, J., Chin, M., Co- Kupc, A., Williamson, C., Schill, G. P., Middlebrook, A. M.,
larco, P. R., Darmenov, A., da Silva, A., Kucsera, T. L., Campuzano-Jost, P., Dibb, J. E., and Wilson, J. C.: A new method
Schill, G., Yu, H., Bui, P., Dollner, M., Weinzierl, B., and to quantify mineral dust and other aerosol species from aircraft
Smirnov, A.: Observationally constrained analysis of sea salt platforms using single particle mass spectrometry, in preparation,
aerosol in the marine atmosphere, Atmos. Chem. Phys. Discuss., 2019.
https://doi.org/10.5194/acp-2019-18, in review, 2019. Gantt, B. and Meskhidze, N.: The physical and chemical char-
Boucher, O., Randall, D., Artaxo, P., Bretherton, C., Feingold, G., acteristics of marine primary organic aerosol: a review, At-
Forster, P., Kerminen, V.-M., Kondo, Y., Liao, H., Lohmann, U., mos. Chem. Phys., 13, 3979–3996, https://doi.org/10.5194/acp-
Rasch, P., Satheesh, S. K., Sherwood, S., Stevens B., and Zhang, 13-3979-2013, 2013.
X. Y.: Clouds and Aerosols, in: Climate Change 2013: The Phys- Gerber, H. E.: Relative-humidity parameterization of the Navy
ical Science Basis. Contribution of Working Group I to the Fifth aerosol model (NAM), NRL Rep. 8956, Naval Res. Lab., Wash-
Assessment Report of the Intergovernmental Panel on Climate ington, D.C., USA, 1985.
Change, edited by: Stocker, T. F., Qin, D., Plattner, G.-K., Tig- Gong, S. L.: A parameterization of sea-salt aerosol source function
nor, M., Allen, S. K., Boschung, J., Nauels, A., Xia, Y., Bex, V., for sub- and super-micron particles, Global Biogeochem. Cy., 17,
and Midgley, P. M., Cambridge University Press, Cambridge, UK 1097, https://doi.org/10.1029/2003GB002079, 2003.
and New York, NY, USA, 2013. Grythe, H., Ström, J., Krejci, R., Quinn, P., and Stohl, A.: A re-
Chameides, W. L. and Stelson, A. W.: Aqueous-phase chemical pro- view of sea-spray aerosol source functions using a large global
cesses in deliquescent sea-salt aerosols: A mechanism that cou- set of sea salt aerosol concentration measurements, Atmos.
ples the atmospheric cycles of S and sea salt, J. Geophys. Res., Chem. Phys., 14, 1277–1297, https://doi.org/10.5194/acp-14-
97, 20565–20580, 1992. 1277-2014, 2014.
Chin, M., Ginoux, P., Kinne, S., Torres, O., Holben, B. N., Dun- Hara, K., Osada, K., Yabuki, M., and Yamanouchi, T.:
can, B. N., Martin, R. V., Logan, J. A., Higurashi, A., and Naka- Seasonal variation of fractionated sea-salt particles on
jima, T.: Tropospheric aerosol optical thickness from the GO- the Antarctic coast, Geophys. Res. Lett., 39, L18801,
CART model and comparisons with satellite and sun photometer https://doi.org/10.1029/2012GL052761, 2012.
measurements, J. Atmos. Sci., 59, 461–483, 2002.
Atmos. Chem. Phys., 19, 4093–4104, 2019 www.atmos-chem-phys.net/19/4093/2019/D. M. Murphy et al.: The distribution of sea-salt aerosol in the global troposphere 4103 Hoose, C., Lohmann, U., Erdin, R., and Tegen, I.: The global in- Murphy, D. M., Middlebrook, A. M., and Warshawsky, M.: Cluster fluence of dust mineralogical composition on heterogeneous ice analysis of data from the Particle Analysis by Laser Mass Spec- nucleation in mixed-phase clouds, Environ. Res. Lett., 3, 025003, trometry (PALMS) instrument, Aerosol Sci. Tech., 37, 382–391, https://doi.org/10.1088/1748-9326/3/2/025003, 2008. 2003. Huang, J. and Jaeglé, L.: Wintertime enhancements of sea salt Murphy, D. M., Cziczo, D. J., Hudson, P. K., Thomson, D. S., Wil- aerosol in polar regions consistent with a sea ice source son, J. C., Kojima, T., and Buseck, P. R.: Particle generation and from blowing snow, Atmos. Chem. Phys., 17, 3699–3712, resuspension in aircraft inlets when flying in clouds, Aerosol Sci. https://doi.org/10.5194/acp-17-3699-2017, 2017. Tech., 38, 400–408, 2004. Huebert, B. J., Lee, G., and Warren, W. L.: Airborne aerosol inlet Ovadnevaite, J., O’Dowd, C., Dall’Osto, M., Ceburnis, passing efficiency measurement, J. Geophys. Res., 95, 16369– D., Worsnop, D. R., and Berresheim, H.: Detecting 16381, 1990. high contributions of primary organic matter to marine Jones, A., Haywood, J. M., and Boucher, O.: Aerosol forc- aerosol: A case study, Geophys. Res. Lett., 38, L02807, ing, climate response and climate sensitivity in the Hadley https://doi.org/10.1029/2010GL046083, 2011. Centre climate model, J. Geophys. Res., 112, D20211, Pruppacher, H. R. and Klett, J. D.: Microphysics of Clouds and Pre- https://doi.org/10.1029/2007JD008688, 2007. cipitation, 2nd ed., Kluwer Acad., Dordrecht, the Netherlands, Koop, T., Kapilashrami, A., Molina, L. T., and Molina, M. J.: Phase 1997. transitions of sea-salt/water mixtures at low temperatures: Impli- Quinn, P. K., Miller, T. L., Bates, T. S., Ogren, J. A., cations for ozone chemistry in the polar marine boundary layer, Andrews, E., and Shaw, G. E.: A 3-year record of si- J. Geophys. Res., 105, 26393–26402, 2000. multaneously measured aerosol chemical and optical prop- Kreidenweis, S. M., McInnes, L. M., and Brechtel, F. J.: Observa- erties at Barrow, Alaska, J. Geophys. Res., 107, 4130, tions of aerosol volatility and composition at Macquarie Island https://doi.org/10.1029/2001JD001248, 2002. during the First Aerosol Characterization Experiment (ACE 1), Shinozuka, Y., Clarke, A. D., Howell, S. G., Kapustin, V. N., and J. Geophys. Res., 103, 16511–16524, 1998. Huebert, B. J.: Sea-salt vertical profiles over the Southern and Kupc, A., Williamson, C., Wagner, N. L., Richardson, M., and tropical Pacific oceans: Microphysics, optical properties, spatial Brock, C. A.: Modification, calibration, and performance of the variability, and variations with wind speed, J. Geophys. Res., Ultra-High Sensitivity Aerosol Spectrometer for particle size dis- 108, D24201, https://doi.org/10.1029/2004JD004975, 2004. tribution and volatility measurements during the Atmospheric Thomson, D. S., Schein, M. E., and Murphy, D. M.: Particle anal- Tomography Mission (ATom) airborne campaign, Atmos. Meas. ysis by laser mass spectrometry WB-57F instrument overview, Tech., 11, 369–383, https://doi.org/10.5194/amt-11-369-2018, Aerosol Sci. Tech., 33, 153–169, 2000. 2018. Toon, O. B., Turco, R. P., Westphal, D., Malone, R., and Lewis, E. R. and Schwartz, S. E.: Sea salt aerosol production: mech- Liu, M. S.: A multidimensional model for aerosols anisms, methods, measurements, and models – A critical review, – Description of computational analogs, J. Atmos. Geophysical Monograph Series, vol. 152, American Geophysical Sci., 45, 2123–2144, https://doi.org/10.1175/1520- Union, Washington, D.C., USA, 2004. 0469(1988)0452.0.CO;2, 1988. Liao, H., Chen, W. T., and Seinfeld, J. H.: Role of cli- Vignati, E., Facchini, M. C., Rinaldi, M., Scannell, C., Ceburnis, D., mate change in global predictions of future tropospheric Sciare, J., Kanakidou, M., Myriokefalitakis, S., Dentener, F., and ozone and aerosols, J. Geophys. Res., 111, D12304, O’Dowd, C. D.: Global scale emission and distribution of sea- https://doi.org/10.1029/2005JD006852, 2006. spray aerosol: Sea-salt and organic enrichment, Atmos. Environ., Loo, B. W. and Cork, C. P.: Development of high efficiency virtual 44, 670–677, 2010. impactors, Aerosol Sci. Tech., 9, 167–176, 1988. Wagenbach, D., Ducroz, F., Mulvaney, R., Keck, L., Legrand, May, N. W., Quinn, P. K., McNamara, S. M., and Pratt, M., Hall, J. S., and Wolff, E. W.: Sea-salt aerosol in K. A.: Multiyear study of the dependence of sea salt coastal Antarctic regions, Geophys. Res. Lett., 39, L18801, aerosol on wind speed and sea ice conditions in the https://doi.org/10.1029/2012GL052761, 1998. coastal Arctic, J. Geophys. Res.-Atmos., 121, 9208–9219, Wagner, R. and Möhler, O.: Heterogeneous ice nucleation ability of https://doi.org/10.1002/2016JD025273, 2016. crystalline sodium chloride dihydrate particles, J. Geophys. Res.- McNaughton, C. S., Clarke, A. D., Howell, S. G., Pinkerton, M., Atmos., 118, 4610–4622, https://doi.org/10.1002/jgrd.50325, Anderson, B., Thornhill, L., Hudgins, C., Winstead, E., Dibb, 2013. J. E., Scheuer, E., and Maring, H.: Results from the DC-8 In- Wang, H., Easter, R. C., Rasch, P. J., Wang, M., Liu, X., Ghan, S. let Characterization Experiment (DICE): Airborne versus sur- J., Qian, Y., Yoon, J.-H., Ma, P.-L., and Vinoj, V.: Sensitivity of face sampling of mineral dust and sea salt aerosols, Aerosol Sci. remote aerosol distributions to representation of cloud–aerosol Tech., 41, 136–159, 2007. interactions in a global climate model, Geosci. Model Dev., 6, Middlebrook, A. M., Murphy, D. M., and Thomson, D. S.: Ob- 765–782, https://doi.org/10.5194/gmd-6-765-2013, 2013. servations of organic material in individual marine particles at Wang, S., Schmidt, J. A., Baidar, S., Coburn, S., Dix, B., Koenig, T. Cape Grim during the First Aerosol Characterization Experiment K., Apel, D., Bowdalo, D., Campos, T. L., Eloranta, E., Evans, (ACE 1), J. Geophys. Res., 103, 16475–16483, 1998. M. J., DiGangi, J. P., Zondlo, M. A., Gao, R.-S., Haggerty, J. Modini, R. L., Harris, B., and Ristovski, Z. D.: The or- A., Hall, S. R., Hornbrook, R. S., Jacob, D., Morley, B., Pierce, ganic fraction of bubble-generated, accumulation mode Sea B., Reeves, M., Romashkin, P., ter Schure, A., and Volkamer, Spray Aerosol (SSA), Atmos. Chem. Phys., 10, 2867–2877, R.: Active and widespread halogen chemistry in the tropical and https://doi.org/10.5194/acp-10-2867-2010, 2010. www.atmos-chem-phys.net/19/4093/2019/ Atmos. Chem. Phys., 19, 4093–4104, 2019
4104                                         D. M. Murphy et al.: The distribution of sea-salt aerosol in the global troposphere

  subtropical free troposphere, P. Natl. Acad. Sci. USA, 112, 9281–       Yu, P., Froyd, K. D., Portmann, R. W., Toon, O. B., Freitas, S. R.,
  9286, 2015.                                                               Bardeen, C. G., Brock, C., Fan, T., Gao, R.-S., Katich, J. M.,
Weinheimer, A. J., Walega, J. G., Ridley, B. A., Gary, B. L., Black,        Kupc, A., Liu, S., Maloney, C., Murphy, D. M., Rosenlof, K. H.,
  D. R., Blake, N. J., Rowland, R. S., Sachse, G. W., Anderson,             Schill, G., Schwarz, J. P., and Williamson, C.: Efficient In-cloud
  B. E., and Collins, J. E.: Meridional distributions of NOx, NOy,          removal of aerosols by deep convection, Geophys. Res. Lett., 46,
  and other species in the lower stratosphere and upper troposphere         1061–1069, https://doi.org/10.1029/2018GL080544, 2019.
  during AASE II, Geophys. Res. Lett., 21, 2583–2586, 1994.               Zhang et al.: The development of different complexity in aerosol
Yu, P., Toon, O. B., Bardeen, C. G., Mills, M. J., Fan, T., English, J.     and chemistry modules within an online global weather forecast
  M., and Neely, R. R.: Evaluations of tropospheric aerosol proper-         modeling system FIM-Chem and the evaluation using ATom-1
  ties simulated by the Community Earth System Model with a sec-            observations, in preparation, 2019.
  tional aerosol microphysics scheme, J. Adv. Model. Earth Syst.,
  7, 865–914, https://doi.org/10.1002/2014MS000421, 2015.

Atmos. Chem. Phys., 19, 4093–4104, 2019                                                     www.atmos-chem-phys.net/19/4093/2019/
You can also read