A method for liquid spectrophotometric measurement of total and water-soluble iron and copper in ambient aerosols
←
→
Page content transcription
If your browser does not render page correctly, please read the page content below
Atmos. Meas. Tech., 14, 4707–4719, 2021
https://doi.org/10.5194/amt-14-4707-2021
© Author(s) 2021. This work is distributed under
the Creative Commons Attribution 4.0 License.

A method for liquid spectrophotometric measurement of total
and water-soluble iron and copper in ambient aerosols
Yuhan Yang1 , Dong Gao2 , and Rodney J. Weber1
1 Earth   and Atmospheric Sciences, Georgia Institute of Technology, Atlanta, GA 30332, USA
2 Department    of Environmental Health Sciences, School of Public Health, Yale University, New Haven, CT 06510, USA

Correspondence: Rodney J. Weber (rodney.weber@eas.gatech.edu)

Received: 6 March 2021 – Discussion started: 9 March 2021
Revised: 20 May 2021 – Accepted: 21 May 2021 – Published: 28 June 2021

Abstract. Determination of transition metals in ambient           1   Introduction
aerosols is important due to their toxicity to human health.
However, the traditional measurement techniques for metal
analysis are often costly and require sophisticated instru-       Transition metals are known to contribute to airborne par-
ments. In this study, we developed and verified relatively        ticle toxicity and can cause a wide range of adverse health
low-cost liquid spectrophotometric methods for the measure-       effects (Chen et al., 2018; Gonet and Maher, 2019). Iron
ments of iron (Fe) and copper (Cu), the two most abundant         (Fe) and copper (Cu) are often two of the most abundant
transition metals in ambient fine particulate matter (PM2.5 ).    transition metals in ambient fine particles (PM2.5 ) and have
For Fe analysis, we utilized a ferrozine-based colorimetric       been linked to a number of human diseases associated with
method, which has been frequently used for water-soluble          the respiratory, cardiovascular and central nervous systems
(WS) Fe determination, and further extended this approach         (Calderón-Garcidueñas et al., 2019; Dreher et al., 1997;
for the measurement of total Fe (water-soluble + water-           Wang et al., 2007). They have also been associated with other
insoluble). In this method, Fe is quantified through the for-     organ damage (Kim et al., 2013; Schrand et al., 2010). Tran-
mation of a light-absorbing ferrozine–Fe(II) complex (ab-         sition metals in ambient aerosols are emitted in a variety of
sorbance at 562 nm). A similar colorimetric method, which         chemical forms, such as metal oxides, metal sulfates, metal
forms a bathocuproine–Cu(I) complex absorbing light at            halides, metal organics and reactive nano-metalloid particles
484 nm, was developed and examined for measurement of             (Gonet and Maher, 2019; Sutto, 2018). Fe and Cu nanoparti-
WS and total Cu.                                                  cles (< 0.1 µm) may be especially toxic due to unique surface
   These methods were applied to 24 h integrated filter sam-      properties, combined with their small sizes that allow them
ples collected in urban Atlanta. Based on PM2.5 ambi-             to pass through cellular membranes and ability to be translo-
ent aerosols, total and water-soluble Fe and Cu concen-           cated to other organs (Bongaerts et al., 2020; Lee et al., 2020;
trations were in good agreement with inductively coupled          Moreno-Ríos et al., 2021). Water-soluble species are opera-
plasma mass spectrometry (ICP-MS) measurements (slopes            tionally defined and are obtained though aqueous dissolution
1.0 ± 0.1, r 2 > 0.89). The water-soluble components, opera-      of collected aerosols followed by liquid filtration of the ex-
tionally defined as those species in the aqueous filter extract   tract solution (typical filter pore sizes of 0.22 or 0.45 µm),
that pass through a 0.45 µm filter, were further characterized    which is roughly analogous to the process particles undergo
by ultrafiltration, which showed that roughly 85 % of both        when deposited in the respiratory-tract-lining fluid. Metals
the Fe and Cu in the water-soluble fraction was composed of       measured in this fraction can include molecules and colloidal
species smaller than nominally 4 nm.                              nanoparticles that are more readily bioavailable than insol-
                                                                  uble species. Studies have found that water-soluble transi-
                                                                  tion metals, including water-soluble (WS) Fe and Cu, have
                                                                  stronger adverse health associations than the correspond-
                                                                  ing water-insoluble components (Costa and Dreher, 1997;

Published by Copernicus Publications on behalf of the European Geosciences Union.
4708                                                     Y. Yang et al.: A method for measuring iron and copper in aerosols

Frampton et al., 1999; Huang et al., 2003; Ye et al., 2018).       bathocuproine–Cu(I) complex display a maximum value at
Transition metal ions that can form dissolution of aerosol         484 nm. Both techniques have been developed and used to
components, such as Fe(II) and Fe(III) and Cu(I) and Cu(II),       detect Fe and Cu in natural waters (Moffett et al., 1985; Vio-
are highly redox-active components of PM2.5 . These ions can       llier et al., 2000); however, use of the Fe–ferrozine approach
trigger and sustain catalytic reaction cycles, such as Fenton      is much more common and has also been utilized for mea-
reactions, generating reactive oxygen species (ROSs; OH,           surements of ambient aerosols (Kuang et al., 2019; Majestic
O−2 , HO2 , O3 and H2 O2 ) in vivo (Brewer, 2007; Lakey et         et al., 2006; Oakes et al., 2010; Rastogi et al., 2009; Zhu et
al., 2016), which can induce oxidative stress and further lead     al., 1997; Zhuang et al., 1992). These analytical techniques
to inflammatory responses and a subsequent host of adverse         can be applied to relatively small liquid spectrophotome-
health effects (Brook et al., 2010; Donaldson et al., 2001;        ters that utilize a long-path liquid waveguide capillary cell
Ghio et al., 2012; Nel, 2005).                                     (LWCC) for high sensitivity. Although only able to measure
   Transition-metal-bearing particles are emitted by a wide        a specific compound per analysis, in contrast to mass spec-
variety of sources. Major Fe sources include resuspended           trometer methods, the instrument is small, portable and rela-
mineral and road dust (tire and brake wear) and combus-            tively low cost and can be used for offline measurements of
tion of biomass and fossil fuels (Khillare and Sarkar, 2012;       sample extracts or for online measurement when connected
See et al., 2007; Wang et al., 2016). Cu sources are often         to a particle-into-liquid sampler (PILS) or similar system
dominated by traffic road dust and in certain locations by in-     (Oakes et al., 2010; Rastogi et al., 2009). Here we report on
dustrial sources (Adachi and Tainosho, 2004; Khillare and          the development, verification and application of liquid spec-
Sarkar, 2012; Kulshrestha et al., 2009; Lee and Hieu, 2011;        trophotometers for measurement of Fe and Cu in ambient
Wang et al., 2016). Water-soluble transition metals may orig-      aerosols collected on filters.
inate from primary emissions, such as combustion (e.g., WS
Fe), but secondary processing is likely the major source. This
can occur by dissolution of the various insoluble forms of the     2     Methods
metals emitted as primary emissions, for example, dissolu-
                                                                   2.1    Collection of ambient PM2.5 filters
tion of metal oxides to soluble forms as the particles age in
the atmosphere (Alves et al., 2020; Fang et al., 2015; Galon-      One year of filter collection was conducted throughout 2017
Negru et al., 2019; Ito et al., 2019; Meskhidze et al., 2005;      at the Jefferson Street (JST) site located ∼ 4 km northwest of
See et al., 2007; Wong et al., 2020).                              downtown Atlanta, Georgia. The JST site is surrounded by
   Measuring transition metals in ambient aerosols is chal-        a mixed commercial–residential area and has a characteristic
lenging due to their low concentrations (tens of nanograms         urban signature (Hansen et al., 2003). A total of 355 PM2.5
per cubic meter or less). Various analytical methods have          filter samples were collected with high-volume (hi-vol) sam-
been utilized. X-ray fluorescence (XRF) and particle-induced       plers (Thermo Andersen, flow rate normally 1.13 m3 min− ),
X-ray emission analysis (PIXE) are non-destructive but can         each filter collected over a 24 h period (midnight to mid-
be influenced by matrix effects that result in major interfer-     night) using prebaked (maximum T = 550 ◦ C) quartz filters
ences (Lin and Luo, 1979). Inductively coupled plasma mass         (Pallflex® Tissuquartz™, 0.2×0.25 m) with an effective col-
spectrometry (ICP-MS) is widely used for quantifying trace         lection area of 516.13 cm2 (20.32 cm by 25.40 cm). Samples
elements and is included in some federal reference methods         were immediately wrapped in prebaked aluminum foil and
for the identification of metals in water and ambient PM in        stored at −18 ◦ C until analysis. A selection of these filters
the USA (e.g., Method IO-3.5, USEPA Method 1640) (Am-              are included in the following analyses. A suite of other air
mann, 2007; Chow, 1995; Danadurai et al., 2011). Overall,          quality sampling instruments was also operational during the
these instruments tend to be expensive, making it challeng-        filter sampling period. Portions of these filters have already
ing to do routine analysis of large numbers of aerosol particle    been utilized in studies on aerosol oxidative potential (Gao et
samples in modestly equipped laboratories.                         al., 2020a, b).
   An alternative approach is liquid-based colorimetric meth-
ods, which can provide precise and accurate measurements           2.2    Reagents and standards
of specific metal species based on the assumption that the lig-
and used reacts exclusively with the target metal (i.e., in this   All acids and sodium hydroxide (NaOH) used were trace-
case Fe or Cu) to form a light-absorbing complex. Stookey          metal-grade obtained from VWR International LLC (Rad-
(1970) developed a spectrophotometric method for the anal-         nor, PA, USA). Standard stock solutions for Fe and Cu
ysis of Fe(II) based on Fe(II) complexing with a ferrozine         calibrations were prepared by dilution of commercially
ligand (3-(2-pyridyl)-5,6-bis(4-phenylsulfonic acid)-1,2,4-        available standards (1000 ppm in 2 % HCl obtained from
triazine) that absorbs light at 562 nm. Smith and Wilkins          the RICCA Chemical Company, Arlington, TX, USA) and
(1953) reported a colorimetric reagent, bathocuproine (2,9-        stored in a refrigerator (T = 4 ◦ C). Calibration with these
dimethyl-4,7-diphenyl-1,10-phenanthroline), that can selec-        standards was performed at the beginning of every mea-
tively chelate with Cu(I). The absorption spectra of the           surement day. Ammonium acetate (C2 H7 NO2 ) was ob-

Atmos. Meas. Tech., 14, 4707–4719, 2021                                             https://doi.org/10.5194/amt-14-4707-2021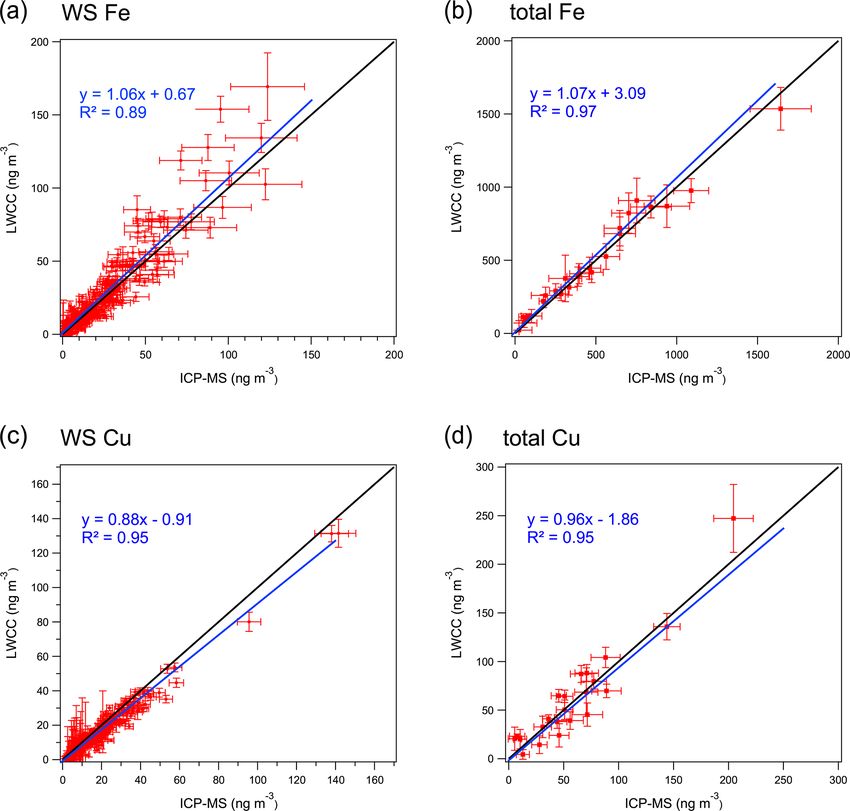
Y. Yang et al.: A method for measuring iron and copper in aerosols 4709
tained from Fisher Scientific International Inc. (Fair Lawn, The final ambient concentration of each element, Cair
New Jersey, USA) and ferrozine (3-(2-pyridyl)-5,6-bis (4- (ng m−3 ), was calculated by
phenylsulfonic acid)-1,2,4-triazine) from the HACH Com-
pany (Loveland, CO, USA). Bathocuproine (2,9-dimethyl- Vl Ve Afilter
Cair = Csample − Cblank × × , (2)
4,7-diphenyl-1,10-phenanthroline), sodium citrate dihydrate Vs Vair Apunch
(HOC(COONa)(CH2 COONa)2 · 2H2 O) and hydroxylamine
hydrochloride (HONH2 · HCl) were obtained from Sigma where Csample and Cblank are the liquid sample and blank con-
Aldrich (St. Louis, MO, USA). Details of the chemical centrations of the specific element (ng mL−1 ), determined
preparations are provided in the Supplement. by Eq. (1); Ve (mL) is the liquid volume of the sample (or
blank) extract; Vs (mL) is the liquid extract volume used
2.3 Spectrophotometer and LWCC system for the actual measurement; and Vl (mL) is the volume of
liquid sample solution after being diluted by all the chemi-
cals (i.e., Vl = Vs + Vchemicals ). Vair (m3 ) is the volume of air
Similar spectrophotometric instruments were used for all
drawn through the filter during sampling. Afilter (cm2 ) and
measurements (WS and total Fe and Cu). The final mixture
Apunch (cm2 ) are the total areas of the hi-vol filter and the
containing the light-absorbing complexes was pushed into a
filter punches used for analysis, respectively.
liquid waveguide capillary cell (LWCC-3250 or LWCC-3100
World Precision Instruments, Sarasota, FL). The waveguide
2.4 Filter extraction
was coupled at one end to a dual deuterium and tungsten
halogen light source (DT-Mini-2, Ocean Optics, Dunedin, 2.4.1 Extraction for water-soluble metals and
FL), which produced light over the wavelength range of 200 ultrafiltration
to 800 nm, and at the other end to a multi-wave light detector
(USB4000, Ocean Optics, Dunedin, FL), using 400 µm fiber For measurements of the water-soluble Fe and Cu collected
core diameter fiber optic cables (QP400-2-SR, Ocean Op- on the filters, one circular filter punch (1 in. in diameter,
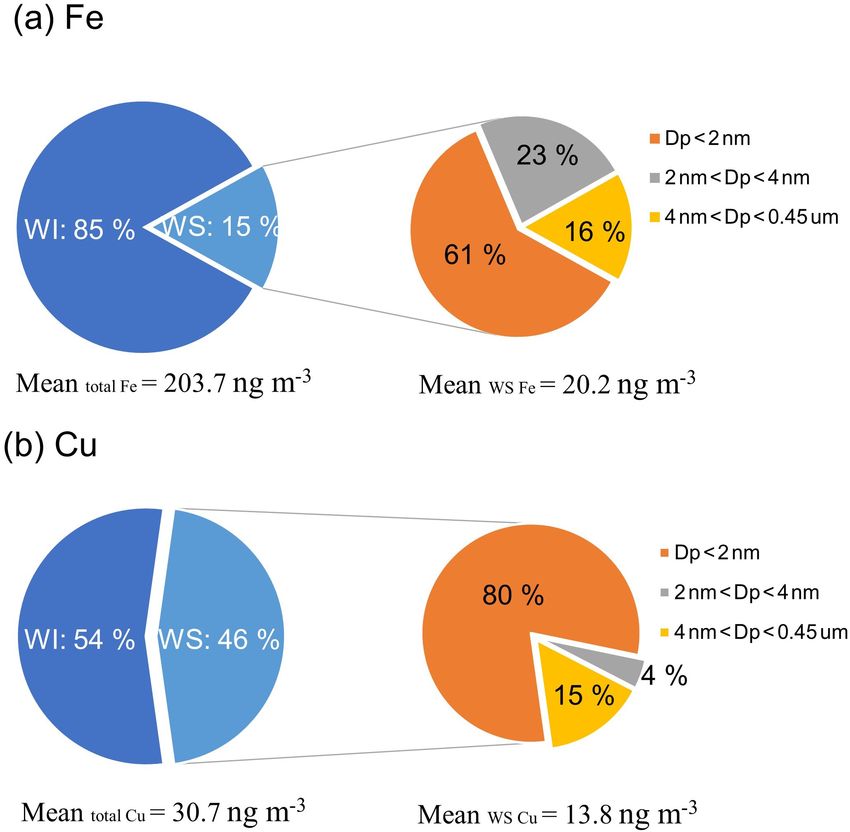
tics, Dunedin, FL). The light absorbance was recorded with a Apunch = 5 cm2 ) was extracted in 7 mL (Ve ) of de-ionized
data requisition software (SpectraSuite). For Fe analysis, the water (DI water; Nanopure Infinity™ ultrapure water system;
light absorption over the wavelength range between 557 and > 18 M cm−1 ) in a sterile polypropylene centrifuge tube
567 nm was measured and averaged as the absorbance of the (VWR International LLC, Suwanee, GA, USA) via 30 min
Fe complex in the sample (Abs562 ). Average absorption be- sonication (Ultrasonic Cleanser, VWR International LLC,
tween wavelengths of 479 and 489 nm was recorded and re- West Chester, PA, USA). The extract was filtered using a
ferred to as the absorbance for Cu measurements (Abs484 ). In 0.45 µm PTFE syringe filter (Fisherbrand™) and then acidi-
both measurements, the average absorbance measured over fied using 6 M high-purity HCl to a pH of 1 to preserve the
the wavelength range of 695 to 705 nm (Abs700 ) was chosen Fe or Cu in solution. A schematic of the extraction is shown
as the baseline absorbance. in Fig. 1.
Since the light absorption efficiencies of Fe(II)–ferrozine The filterable metal fraction in the extracts, defined as
and Cu(I)–bathocuproine complexes differed, the optical water-soluble metals in this paper, will include all dissolved
path lengths of the LWCC for Fe and Cu measurements were metal forms and any colloidal particles with a diameter less
100 cm (LWCC-3100) and 250 cm (LWCC-3250), respec- than 0.45 µm, assuming that all colloidal particles < 0.45 µm
tively. To keep the light absorption within an optimal range, can penetrate through the syringe filter, and the retention ef-
the recommended Fe(II) and Cu(I) liquid concentrations de- ficiency of particles > 0.45 µm is 100 %.
tected by the system are up to 40 and 50 ppb, respectively. To assess the contribution of colloidal particles to the op-
The metal concentrations in the liquid (C) were deter- erationally defined WS Fe and WS Cu, a subset of the col-
mined based on the light absorbances by lected filters (N = 69) were further filtered by ultrafiltration
(Amicon™ Ultra centrifugal filter units, Merck Millipore
1 Ltd., Tullagreen, Carrigtwohill, Co. Cork, Ireland). Two fil-
C= [(Absλ − Abs700 ) − a] , (1) ter sizes, 30 000 and 3000 daltons (Da), were used for size
b
fractionation, which roughly correspond to colloidal parti-
cles of 4 and 2 nm diameter, respectively (Erickson, 2009).
where Absλ represents the average light absorption of the Details of the conversion of particle mass in daltons to par-
sample (or blank) for the ranges given above, which encom- ticle diameter and the effects of ultrafiltration membrane re-
passes the wavelength (λ) at which maximum optical absorp- jection are discussed in the Supplement. The particles were
tion occurs; for Fe, λ = 562 nm, and for Cu, λ = 484 nm. separated within the 30 000 and 3000 Da ultrafiltration units
Abs700 represents the average light absorption between 695 at ∼ 3000 g (4000 rpm) centrifugation for 30 and 60 min, re-
and 705 nm; a (arbitrary units) and b (1/ng mL−1 ) are the spectively. The filtrate was then pH-adjusted to 1 and mea-
intercept and slope of the calibration curve, respectively. sured for WS Fe and WS Cu.
https://doi.org/10.5194/amt-14-4707-2021 Atmos. Meas. Tech., 14, 4707–4719, 2021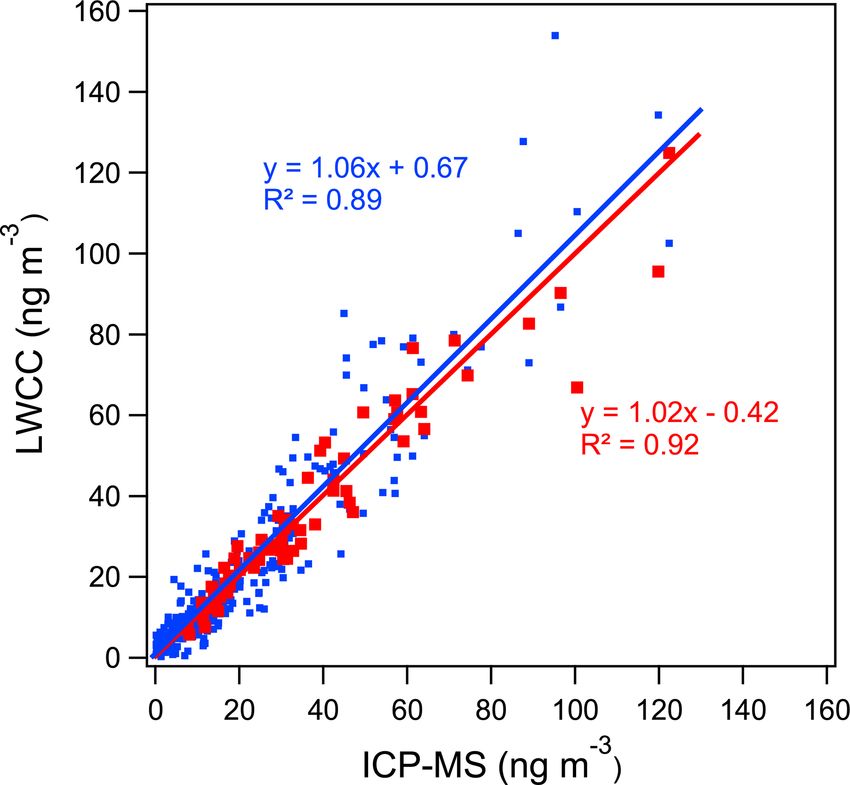
4710                                                        Y. Yang et al.: A method for measuring iron and copper in aerosols

Figure 1. Schematic of the experimental procedures for the measurement of water-soluble (blue line) and total (red line) Fe and Cu. The
upper schematic shows the processes common to both methods. The sample vial from this process is then analyzed for Fe or Cu via the
process illustrated in the bottom schematic. In the bottom schematic the process for Fe (yellow line) or Cu (green line) is given. The black
line is common to both the WS and total measurement (in the upper schematic) or common to both the Fe and Cu measurement (in the lower
schematic). X refers to the liquid samples used to assess the interference of other light-absorbing species at 562 or 484 nm (purple line).

   The soluble metal fraction may be affected by the degree             sedimental standards and > 98 % of Fe from standard rocks
of dilution of the samples in the extraction process. The ra-           and inner-shelf muds (Poulton and Canfield, 2005). The ef-
tio of extraction water volume to the volume of air sampled             fect of extraction time, heating temperature and rotation rate
on the analyzed filter portion, denoted as P , is ∼ 0.5 in this         on extraction efficiency were tested and are discussed below.
study. This implies that Fe- and Cu-containing substances               The extract was diluted to 10 mL (Ve ) using DI and then fil-
with solubility higher than roughly 10−3 g L−1 under condi-             tered by a 0.45 µm pore PTFE syringe filter. The volume of
tions close to neutral pH will likely be fully dissolved, while         the sample extract used for the measurement (Vs ) differed
species with water solubility as low as 10−6 g L−1 may be               between samples and was determined by the ambient con-
partially soluble but still contribute to the WS Fe and WS Cu           centration of each sample. The pH of the sample extract was
measured with our method. Details of the effect of P on Fe              adjusted to 1 using 5 M NaOH, and the sample volume was
or Cu solubility are discussed in the Supplement.                       adjusted to 2.5 mL with DI water.
                                                                           A total of 10 blank filters were collected throughout the
2.4.2   Extraction for total metal analysis                             1 year of sampling, and these were used randomly to assess
                                                                        the blank levels (i.e., multiple punches were taken from the
                                                                        blank filters for a blank analysis on different days). The same
The extraction procedures for the determination of total Fe
                                                                        tools and type of filter were used for blanks and samples to
and Cu (shown in Fig. 1) follow the method conducted by
                                                                        track all possible contamination. The concentration of blanks
Aller et al. (1986). To increase the solubility of metals, fil-
                                                                        was calculated using Eq. (1), assuming Va was equal to the
ter punches (1.5 cm2 for Fe and 3 cm2 for Cu) were digested
                                                                        volume of air drawn through actual ambient filter samples.
with 1.5 and 2 mL of 6 M HCl for total Fe and Cu mea-
surements, respectively. The filter was incubated in acid at
99 ◦ C and shaken at a rotational frequency of 350 rpm using a
ThermoMixer (Eppendorf North America, Inc., Hauppauge,
NY, USA) for 24 h. This extraction method has been demon-
strated to remove > 96 % of Fe from the PACS1 international

Atmos. Meas. Tech., 14, 4707–4719, 2021                                                    https://doi.org/10.5194/amt-14-4707-2021
Y. Yang et al.: A method for measuring iron and copper in aerosols 4711
2.5 Colorimetric methods 1 mL of 2.8 mM bathocuproine (Vl = 5.05 mL). After 15 min
of reaction, the light absorption of the bathocuproine–Cu(I)
2.5.1 Colorimetric method for Fe complex was measured.
The colorimetric methods can provide insights on the
A ferrozine-based method, which has been previously es- forms of metal ions present, such as Fe(II) and Fe(III), or
tablished and discussed (Oakes et al., 2010; Rastogi et Cu(I) and Cu(II), for example by first measuring the re-
al., 2009), was adopted and modified in this study for Fe mea- duced species, Fe(II) or Cu(I), then adding the reducing agent
surement. Briefly, an excessive amount of reducing agent, to measure the total (Fe(II)+Fe(III) or Cu(I)+Cu(II)). We
hydroxylamine hydrochloride (0.1 mL, 1.5 M), was added to do not attempt to speciate the WS Fe and WS Cu in this
2.5 mL (Vs ) of sample solution to reduce all soluble forms study since reduction–oxidation processes during the sam-
of Fe (e.g., Fe(III)) to Fe(II). The vial was sealed and stored pling, storage or extraction procedures may alter the valence
overnight (roughly 18 h) at room temperature to ensure com- states of airborne metals from what existed in the ambient
plete reduction (Bengtsson et al., 2002; Rozan et al., 2002). particles. In situ measurements of Fe(II) are feasible using
After the overnight redox reaction, the sample pH was ad- this colorimetric method when connected to a PILS or similar
justed to 4–5 using an ammonium acetate buffer. A total of system (Oakes et al., 2010; Rastogi et al., 2009). It is not fea-
0.2 mL of 5 mM ferrozine–acetate reagent was added to the sible to perform near-real-time measurements of Fe(III) due
solution to form the colored ferrozine–Fe(II) complex that to its long reduction reaction time (overnight). Quantifying
absorbs light at 562 nm. The total volume of sample solution speciation of Cu is challenging due to the tendency of Cu(I)
after addition of all the chemicals (Vl ) was 2.85 mL. to undergo disproportionation in aqueous solutions (Johnson
The reaction between Fe(II) and ferrozine is found to et al., 2015). In situ measurements of Cu(I) are possible with
be pH-dependent; the absorption of the complex increases the presence of reducing agents and masking ligand to inhibit
rapidly when pH is above 0 and becomes steady within the Cu(II) interference (Moffett et al., 1985), but further studies
pH range of 3 to 6 (Gibbs, 1976; Stookey, 1970). Under are necessary to achieve an acceptable detection limit.
the conditions of the original method, when the pH of the
sample was approximately 1, the absorbance of the complex 2.6 Metal analysis by ICP-MS
was sensitive to small fluctuations in pH, adding uncertainty
to the analysis. A further disadvantage is that at lower pH Both total and water-soluble elements, which included mag-
(pH = 1), the reaction rate of Fe(II) and ferrozine was much nesium (Mg), aluminum (Al), potassium (K), manganese
slower relative to higher pH (3 to 5). Therefore, we tested a (Mn) and zinc (Zn) in addition to Fe and Cu, were also
modification to the method by raising the pH of the sample measured by inductively coupled plasma mass spectrometry
to 4–5 during the colorimetric reaction using ammonium ac- (ICP-MS) (Agilent 7500a series, Agilent Technologies, Inc.,
etate buffer to increase the precision of the Fe measurement CA, USA). The sample preparation procedures have been de-
(Fig. 1). Part of the WS Fe samples was analyzed both ways, scribed in detail in Gao et al. (2020a). The sample prepa-
with low and higher pH, whereas all total Fe measurements ration for WS metal analysis followed the same extraction
were done with the buffered (higher pH) samples. procedures as those described above for WS Fe and Cu. The
filtered extract was then acid-preserved with concentrated ni-
2.5.2 Colorimetric method for Cu tric acid (70 %) to a final concentration of 2 % (v/v). For total
metal analysis, aqua regia, a more powerful acid than HCl,
For the determination of Cu concentrations, a bathocuproine was used for filter digestion. The acid-digested sample was
assay was used. Bathocuproine can selectively chelate with then diluted and filtered for ICP-MS analysis.
Cu(I) and form complexes absorbing light at 464 nm. To con-
vert other soluble Cu forms (e.g., Cu(II)) to Cu(I), 0.5 mL
3 Results and discussions
of 1.6 M hydroxylamine hydrochloride was added to 2.5 mL
(Va ) sample extracts at pH 1 (as described above) and al- 3.1 Evaluation of the colorimetric measurement
lowed to react for 30 min (Imamura and Fujimoto, 1975; method
Tomat and Rigo, 1975). The reaction between Cu(I) and
bathocuproine is also pH-dependent, and so a set of con- 3.1.1 Calibration of the detection methods
trolled trials were performed with different pH conditions
ranging from 0.5 to 6 to assess the optimal pH for forming The analytical systems were calibrated and assessed with
the colored complex (Fig. S1 in the Supplement). The light a series of standards diluted from the standard stocks of
absorption of the complex remained low at pH < 1.5 and ex- Cu(II) and Fe(III). The calibration curves for the reduced
hibited a rapid increase above pH 2 and became steady when form of metals (Cu(I) and Fe(II)) are illustrated in Fig. 2.
pH was within the range of 5 to 6. Based on these results, York regression (Wu and Yu, 2018) was applied and demon-
1 mL of 1 M sodium citrate was added to the sample solution strated a strong linear relationship between the element con-
to maintain the pH within the range of 5 to 6, followed by centrations and the detected light absorbance with a coef-
https://doi.org/10.5194/amt-14-4707-2021 Atmos. Meas. Tech., 14, 4707–4719, 20214712 Y. Yang et al.: A method for measuring iron and copper in aerosols
Table 1. Limits of detection, blanks and uncertainties for WS Fe, cles are collected as part of the blank measurement. To as-
WS Cu and total Cu for the liquid spectrophotometric (LWCC) and sess the interference, the light absorption at 484 or 562 nm of
ICP-MS measurement. the individual liquid samples was measured without adding
the colorimetric reagents (see X in Fig. 1). The interference
LWCC ICP-MS was measured for the ambient samples collected in this study
LOD, Overall LOD, Overall and in an extreme case (sampling wildfire smoke). By com-
ng m−3 uncertainty, ng m−3 uncertainty, paring the interference-corrected and non-corrected data, it
% % is found that the average interference was less than 20 % for
WS Fe 3.07 12.5 4.38 18.0 WS Fe and 1 % for total Fe. For total and WS Cu, a correc-
WS Cu 3.04 13.8 2.86 6.3 tion of about 24 % and 30 % was found, respectively. For the
Total Fe 14.79 7.2 14.80 7.2 extreme case, samples from within wildfire plumes, for WS
Total Cu 3.23 9.9 9.67 6.3 Cu an average correction of 50 % was needed (see Fig. S2).
The impact of this correction also depends on the concen-
trations of the Fe or Cu, which in smoke plumes can be at
low concentrations relative to a high level of light-absorbing
ficient of determination (R 2 ) of 1.00. The slopes of calibra-
aerosol species (i.e., BC and BrC), and so the correction, in
tion curves from multiple calibration runs were 0.033±0.004
this case, is important. The magnitude of the interference also
for Cu (coefficient of variation, CV = 12 %, N = 22) and
depends on the extraction method; methods that more effec-
0.053 ± 0.005 for Fe (CV = 9 %, N = 5), indicating the sta-
tively extract solid particles (e.g., BC) or solubilize light-
ble performance of the systems. Repeated measurements
absorbing species at low pH (e.g., mineral dust) could pro-
(N = 20) of a 35 µg L−1 standard solution had a relative stan-
duce higher interferences. Black carbon absorbs light over
dard deviation for both Cu and Fe of < 10 %. These results
all wavelengths, whereas BrC and mineral dust absorb pref-
indicated good precision and the robustness of this method
erentially at lower wavelengths and so would be a potentially
for quantifying both Cu and Fe.
larger interference for the Cu method since the Cu complex
3.1.2 Blanks, detection limit and uncertainty is measured at 484 nm compared to 562 nm for Fe. Since in-
complete combustion is the main source for BC and BrC,
Field blanks were analyzed on each test day in parallel tests for this interference are most important when these
with samples to assess the overall system background. The types of emissions make a large contribution to the overall
limits of detection (LODs) of the spectroscopic systems, aerosol sources, such as sampling in regions highly influ-
determined as 3 times the standard deviation of the filter enced by biomass burning or vehicle tailpipe emissions. In-
blanks, were 3.07 ng m−3 (N = 34) for WS Fe, 14.79 ng m−3 terference from light-absorbing mineral dust species is most
(N = 6) for total Fe, 3.04 ng m−3 (N = 29) for WS Cu and likely when sampling under dry conditions and high winds.
3.23 ng m−3 (N = 6) for total Cu. The detection limits in the We also used a series of metal mixtures, which contained
solutions were 2.07 ppb for WS Fe, 2.05 ppb for WS Cu, different levels of Fe, Cu, Co and Mn, to test the possible
7.00 ppb for total Fe and 3.06 ppb for total Cu. The over- interferences from the formation of colored complexes with
all uncertainties in the sampling system ranged from 7 % to other metals. For the Cu measurement, no interference from
14 %, calculated from the combination of the analytical un- Fe, Co or Mn was observed with up to 100 ppb of mixture
certainty, uncertainty in blank measurements and quadrature of Fe, Co and Mn present. Similarly, Co or Mn did not inter-
sum of the square of various relative uncertainties (such as fere with the Fe measurement with Co or Mn concentrations
uncertainties caused by calibrations, blank filters, flow rates, in the liquid up to 100 ppb. Cu had an interference of less
liquid extract volumes, etc.). The detection limits and uncer- than 2 ppb in the Fe measurement with a Cu concentration
tainties were comparable to the measurement using ICP-MS, in the liquid up to 40 ppb. In this study, the liquid concentra-
indicating that the LWCC has an equally good performance tions of Cu from ambient samples were lower than 40 ppb;
as ICP-MS, especially for the WS Fe measurement. A sum- therefore, there was no interference of other metals in Cu
mary of LODs, blanks and uncertainty are shown in Table 1. or Fe measurements for the colorimetric methods. All mea-
surements for ambient samples in this study were blank and
3.1.3 Interference interference-corrected.
In the spectrophotometric method, species in ambient aerosol 3.1.4 Comparison to ICP-MS measurements and
particles, such as black carbon (BC, or also called refrac- influence of experimental conditions
tory BC), light-absorbing organic species (i.e., brown car-
bon, BrC) or inorganic species (i.e., components of mineral To further evaluate the accuracy of the new detection method,
dust), can also absorb light at 482 or 562 nm, potentially re- the concentrations determined by the colorimetric methods
sulting in measurement interference. However, these inter- were compared to ICP-MS measurements. WS Fe and WS
ferences are not accounted for in the blanks since no parti- Cu were measured with the colorimetric methods using the
Atmos. Meas. Tech., 14, 4707–4719, 2021 https://doi.org/10.5194/amt-14-4707-2021Y. Yang et al.: A method for measuring iron and copper in aerosols 4713
Figure 2. Calibration curves for (a) Fe(II) and (b) Cu(I) measurement by the LWCC system. Results of York regression are shown.
LWCC system on all collected filters (N = 355), but only (with N = 3 filters for each condition). It was found that for
a portion of the 355 filters were used for the measurement total Fe extraction, there was a 5 % decrease when the extrac-
of total Fe and total Cu using the same LWCC system (Fe: tion time was shortened from 24 to 2.5 h and a 5 % increase
N = 23, Cu: N = 21). All filters (N = 355) were used for the when extraction time was increased from 24 to 120 h. For
ICP-MS measurements of both WS and total elements. Cu, the concentration decreased by 15 % when the extrac-
Water-soluble Fe and Cu. Regression analysis between tion time was changed from 24 to 2.5 h and decreased by 5 %
the colorimetric methods and ICP-MS measurements showed when the extraction time was extended to 120 h. An extrac-
good quantitative agreement for WS Fe and WS Cu with tion time of 24 h was concluded to be optimal for both Fe and
R 2 greater than 0.89. The differences between the LWCC- Cu. Extract temperature had a small impact, with a 5 % and
and ICP-MS-measured concentrations were 6 % and 12 % 10 % decrease for Fe and Cu extraction, respectively, when
for WS Fe and WS Cu (Fig. 3a and c) with the offsets (in- the temperature decreased from 99 to 50 ◦ C. The rotational
tercepts) less than 1 ng m−3 . Considering measurement un- shaking was found to significantly affect the extraction effi-
certainty, most points overlap the 1 : 1 line except for sev- ciency. Compared to shaking at a rate of 350 rpm, extraction
eral WS Fe measurements. The difference in WS Fe between without rotational shaking reduced the extraction efficiency
these two methods was possibly due to the acidic conditions by 98 % and 89 % for Fe and Cu, respectively.
(pH ∼ 1) of the colored-complex-forming solution used in
the original approach of the colorimetric method. As noted 3.2 Characteristics of Fe and Cu in urban Atlanta
above, to improve the method, some of the samples (N = 69)
were re-analyzed with sample pH adjusted to 4–5, which 3.2.1 Water-soluble, total and fractional solubility
resulted in a higher correlation with the ICP-MS measure-
ment, consistent with less sensitivity of the complex to pH The annual average concentrations of total Fe measured by
when in the higher pH range (r 2 = 0.92, slope 1.02, intercept ICP-MS and WS Fe measured by the LWCC was 203.7 and
−0.42 ng m−3 ) (Fig. 4). Considering the overall uncertainties 20.2 ng m−3 , respectively. Mass concentrations of WS Fe
in these two methods, the LWCC and ICP-MS measurements spanned a wide range, from the detection limit (3.07 ng m−3 )
of the water-soluble metals were in agreement. to 169 ng m−3 . The average concentrations of total Cu and
Total Fe and Cu. Similar results were found between the WS Cu were 30.7 and 13.8 ng m−3 , respectively. Mass
LWCC and ICP-MS methods for the measurement of total concentration of WS Cu ranged from the detection limit
element concentration. For total Fe, York regression between (3.04 ng m−3 ) to 132 ng m−3 . Due to uncertainties in both
the LWCC and ICP-MS yields a slope of 1.07, with an in- water-soluble and total measurements, a few calculated Cu
tercept of 3.09 ng m−3 and r 2 = 0.97; see Fig. 3b. For Cu, solubilities were higher than 1 and were treated as 1 when
the slope was 0.96, intercept = −1.86 ng m−3 and r 2 = 0.95 calculating the average fraction of Cu. Those solubilities
(Fig. 3d). when total or WS concentrations were blank were estimated
As noted, in the colorimetric method description above, using half of the detection limit of the total or WS concentra-
the filters for the total Fe and total Cu analysis were ex- tion. Tables 2 and S4 in the Supplement provide a more com-
tracted for a 24 h period with the assistance of shaking and plete summary. The statistics of the LWCC measurement and
high temperature. The effect of extraction time, heating tem- ICP-MS measurement of total metals were different since
perature and rotation rate on extraction efficiency was tested only a fraction of all the 2017 filter samples were analyzed
for total metals using the LWCC system (Fe: N = 23, Cu:
https://doi.org/10.5194/amt-14-4707-2021 Atmos. Meas. Tech., 14, 4707–4719, 20214714 Y. Yang et al.: A method for measuring iron and copper in aerosols
Figure 3. Comparison between LWCC method and ICP-MS method for (a) WS Fe, (b) total Fe, (c) WS Cu and (d) total Cu (results of York
regression are shown along with 1 : 1 ratio by the black line). Bars represent the uncertainties in measurements.
N = 21). These concentrations were comparable with a pre- trations through 30 000 Da ultrafiltration were significantly
vious study conducted in Atlanta, GA, and in the range re- higher than those through a 0.45 µm filter were removed. The
ported for many other regions globally (Table 3). size fractionation results are given in Fig. 5. Based on me-
As expected the total Fe concentration was much higher dians of all ultrafiltration data, approximately 84 % of the
than total Cu since Fe is a common element in the Earth’s WS Fe had a nominal diameter smaller than 4 nm, passing
crust (mass fraction of iron is 5.63 %) (Tomaszewski, 2017) through the 30 000 Da filter; 61 % of the WS Fe was nomi-
and ubiquitous in mineral dust, while PM2.5 Cu in urban nally smaller than 2 nm in diameter, which passed through
environments is mainly derived from vehicle brake and tire the 3000 Da filter. The fractions for the sizes in between
wear and tailpipe emissions resulting from motor-oil impuri- were calculated by taking the difference, and a rough dis-
ties; both of these sources are associated with traffic (Fang et tribution of Fe in the overall WS Fe was 61 % smaller than
al., 2015; Marcazzan et al., 2003). Other industrial sources of 2 nm, 23 % between 2 and 4 nm, and 16 % between 4 nm and
PM2.5 Cu are also possible. Despite much higher total con- 0.45 µm. For WS Cu, most (84 %) of WS Cu passed through
centrations, the concentrations of WS Fe were comparable the 3000 Da filter and had a nominal diameter less than 2 nm,
with WS Cu. This is due to a much lower solubility of Fe with 4 % between 2 and 4 nm and 15 % between 4 nm and
than Cu. The average soluble fraction of Fe and Cu is 14.6 % 0.45 µm.
and 50.7 %, respectively (Table 2). The 2 to 4 nm fraction of Fe colloidal particles (23 %) was
higher than that found in WS Cu (4 %, which was practically
3.2.2 Components of water-soluble Fe and Cu based on zero). Laboratory studies find that ambient particles under-
ultrafiltration going pH cycling from low pH (∼ 2) in deliquesced particles
to circumneutral pH of 5 to 6 when activated in cloud drops
Ultrafiltration of WS Fe and WS Cu was used to assess lead to the formation of nanoparticles of highly reactive fer-
contributions of colloidal particles to the concentrations of rihydrite of a few nanometers in diameter (∼ 5 nm) (Shi et
water-soluble metals. The data of the samples whose concen- al., 2011). The pH of the bulk PM2.5 aerosol in this region is
Atmos. Meas. Tech., 14, 4707–4719, 2021 https://doi.org/10.5194/amt-14-4707-2021Y. Yang et al.: A method for measuring iron and copper in aerosols 4715
Table 2. Statistical summary of transition metal concentrations in PM2.5 measured in Atlanta in 2017 based on liquid spectrophotometric
(LWCC) measurement.
Total Fe Total Cu WS Fe WS Cu Fe solubility Cu solubility
(N = 23) (N = 21) (N = 355) (N = 355) (N = 23) (N = 21)
Mean (ng m−3 ) 478.9 61.8 20.2 13.8 14.6 % 45.6 %
Median (ng m−3 ) 388.4 45.4 11.4 10.8 16.3 % 44.0 %
Maximum (ng m−3 ) 1535.2 247.1 169.3 131.5 32.5 % > 100 %
Minimum (ng m−3 ) 22.1 4.4 < LOD < LOD 0.2 % 3.3 %
RSD 0.76 0.87 1.25 0.98 0.76 0.82
Table 3. Concentration of PM2.5 particulates (µg m−3 ) and transition metals (ng m−3 ) in the ambient air of urban and suburban areas in
different parts of the world.
PM2.5 mass Total Fe WS Fe Total Cu WS Cu
Present study, Atlanta (USA) 10.4 203.7g 20.2h 30.7g 13.8h
Previous study, Atlanta (USA)a 21.1 13.8
Patras (Greece)b 17.4 124 11.9 7.28 2.67
Megalopolis (Greece)b 23.0 87 8.51 4.02 0.94
Po Valley (Italy)c 103 4.7
Tampa (USA)d 12.7 790 2.4
Hong Kong (China)e 29 160 15
Agra (India)f 104.9 1900 200
a Fang et al. (2015). b Manousakas et al. (2014). c Canepari et al. (2014). d Olson et al. (2008). e Hagler et al. (2007).
f Kulshrestha et al. (2009). g Based on ICP-MS measurement. h Based on LWCC measurement
estimated to be in the range of 1.63 to 2.31 (25th and 75th
percentiles throughout the year; Wong et al., 2020), which
would rise rapidly to pH between 5 and 7 in the extraction
solution (based on measurements). Rapid increase to circum-
neutral pH leads to a supersaturated soluble Fe(III), which
then precipitates out of the solution. Thus, either from pH
cycling experienced by the ambient aerosol or changes due
to the filter extraction process, the colloidal particles of WS
Fe observed in the 2 to 4 nm range are consistent with the
ferrihydrite reported by Shi et al. (2011). Acid-driven sol-
ubility of Cu occurs rapidly at higher pHs and so may not
reach supersaturation like that of Fe when pH increases to
circumneutral, accounting for the lack of colloidal particles
in the nominal 2 to 4 nm size range of WS Cu.
For both Fe and Cu, the fraction of Fe and Cu in the 4 nm
to 0.45 µm range may be insoluble chemical forms from pri-
mary emissions, like metal oxides that had been extracted
from the filter and had passed through the syringe filter, mak-
ing them not a “true” water-soluble species (i.e., not unique
Figure 4. Comparison between LWCC method and ICP-MS
method for WS Fe with pH adjustment of the light-absorbing sam-
from the insoluble fraction). More research needs to be done
ple. The blue points and line represent the original method without to determine what caused the variability in the various frac-
ammonium acetate and with pH of ∼ 1. The red points and line re- tions separated by ultrafiltration and to characterize the forms
fer to the improved method with ammonium acetate and with pH of of the metals in the various size fractions of what we opera-
4 to 5 (results of York regression are shown). tionally define as overall water-soluble metal. These results
have implications for aerosol toxicity and health effects.
https://doi.org/10.5194/amt-14-4707-2021 Atmos. Meas. Tech., 14, 4707–4719, 20214716 Y. Yang et al.: A method for measuring iron and copper in aerosols
total Cu) the spectrophotometry data were in good agreement
(slopes ranged between 0.88 and 1.07 and r 2 > 0.89).
In Atlanta, total Fe concentration was much higher than to-
tal Cu, whereas the level of WS Fe was comparable with WS
Cu due to a higher soluble fraction of PM2.5 Cu (45.6 %)
compared to Fe (14.6 %). The composition of what is op-
erationally defined as WS Fe and WS Cu (i.e., the aerosol
filter extracted in pure water and extract passed through a
0.45 µm pore liquid filter) was investigated with ultrafiltra-
tion Fe and Cu in the filtrate measured with the spectrophoto-
metric (LWCC) method. Ultrafiltration showed that roughly
84 % of both WS Fe and WS Cu was composed of dissolved
species or colloidal particles smaller than nominally 4 nm di-
ameter. Fe and Cu are two important redox-active metals that
have been linked to reactive oxygen species (ROSs) formed
in vivo and lead to adverse health effects through oxidative
stress. These spectrophotometric methods allow analyses of
the various physical forms of Fe and Cu in ambient aerosol
particles and are directly applicable to aerosol toxicity stud-
ies and their contribution to aerosol oxidative potential (OP).
Figure 5. Components of PM2.5 (a) Fe and (b) Cu. Water-soluble
(WS) species are operationally defined by samples that pass through Data availability. The data used in this paper are publicly available
a 0.45 µm pore syringe filter (shown in light blue). Water-insoluble at https://doi.org/10.5281/zenodo.4927503 (yhyang611, 2021) and
(WI) species are defined by the difference in all (total) species of can also be obtained from the corresponding author upon request.
that metal and WS species (shown in dark blue). WS Fe (a) and WS
Cu (b) concentrations were further separated in ultrafiltration via
30 000 or 3000 Da ultrafiltration filters (roughly corresponding to
Supplement. The supplement related to this article is available on-
particle sizes of 4 and 2 nm, respectively). Concentrations in differ-
line at: https://doi.org/10.5194/amt-14-4707-2021-supplement.
ent size ranges were determined by difference (statistics calculated
on the differences).
Author contributions. YY is responsible for the study design, ex-
periment using the LWCC, data analysis and manuscript writing.
4 Conclusion RJW supervised the study and participated in the writing and revi-
sion of the paper. DG provided ICP-MS data and interpretation of
In this study, a new approach for the measurement of WS the results.
Cu and total Cu has been developed and tested based on liq-
uid spectrophotometry. It follows a similar method for quan-
tifying WS Fe. All measurements can be performed with Competing interests. The authors declare that they have no conflict
a single relatively inexpensive spectrophotometer. Utilizing of interest.
daily PM2.5 filters collected in Atlanta during 2017, the spec-
trophotometer methods were assessed by comparing with
elements measured by ICP-MS on the same ambient filter Acknowledgements. The authors acknowledge funding by the
samples. Calibrations with liquid standards produced by se- Phillips 66 company. Thanks are given to Linghan Zeng for his kind
rial dilutions were highly linear and stable over periods of guidance in the experiment and many interesting discussions about
days. The spectrophotometric method detection limits in this data analysis. We would also like to thank Allison Weber for her
help in conducting the IC measurements.
study were 3.07 ng m−3 for WS Fe, 14.8 ng m−3 for total
Fe, 3.04 ng m−3 for WS Cu and 3.23 ng m−3 for total Cu,
with measurement uncertainties ranging from 7 % to 14 %.
Financial support. This research has been supported by the Phillips
The detection limit and uncertainties are comparable to ICP- 66 Company (grant no. AGR DTD 10/05/2020).
MS measurement. Possible interferences from other light-
absorbing species, such as black and brown carbon, should
be considered, especially for the Cu measurement and in sit- Review statement. This paper was edited by Mingjin Tang and re-
uations where emissions of light-absorbing aerosols are high viewed by two anonymous referees.
(e.g., BC, BrC, mineral dust). From comparisons with ICP-
MS measurements, in all cases (WS Fe, total Fe, WS Cu and
Atmos. Meas. Tech., 14, 4707–4719, 2021 https://doi.org/10.5194/amt-14-4707-2021Y. Yang et al.: A method for measuring iron and copper in aerosols 4717
References trometry: Application to monitoring episodic industrial emission
events, Anal. Chim. Acta, 686, 40–49, 2011.
Donaldson, K., Stone, V., Seaton, A., and MacNee, W.: Ambi-
Adachi, K. and Tainosho, Y.: Characterization of heavy metal parti- ent particle inhalation and the cardiovascular system: potential
cles embedded in tire dust, Environ. Int., 30, 1009–1017, 2004. mechanisms, Environ. Health Persp., 109, 523–527, 2001.
Aller, R. C., Mackin, J. E., and Cox Jr., R. T.: Diagenesis of Fe Dreher, K. L., Jaskot, R. H., Lehmann, J. R., Richards, J. H., Ghio, J.
and S in Amazon inner shelf muds: apparent dominance of Fe K. M. A. J., and Costa, D. L.: Soluble transition metals mediate
reduction and implications for the genesis of ironstones, Cont. residual oil fly ash induced acute lung injury, J. Toxicol. Env.
Shelf Res., 6, 263–289, 1986. Heal. A, 50, 285–305, 1997.
Alves, D. D., Riegel, R. P., Klauck, C. R., Ceratti, A. M., Hansen, Erickson, H. P.: Size and shape of protein molecules at the nanome-
J., Cansi, L. M., Pozza, S. A., de Quevedo, D. M., and Osório, D. ter level determined by sedimentation, gel filtration, and electron
M. M.: Source apportionment of metallic elements in urban at- microscopy, Biol. Proced. Online, 11, 32–51, 2009.
mospheric particulate matter and assessment of its water-soluble Fang, T., Guo, H., Verma, V., Peltier, R. E., and Weber, R.
fraction toxicity, Environ. Sci. Pollut. Res., 27, 12202–12214, J.: PM2.5 water-soluble elements in the southeastern United
2020. States: automated analytical method development, spatiotem-
Ammann, A. A.: Inductively coupled plasma mass spectrometry poral distributions, source apportionment, and implications
(ICP MS): a versatile tool, J. Mass Spectrom., 42, 419–427, for heath studies, Atmos. Chem. Phys., 15, 11667–11682,
2007. https://doi.org/10.5194/acp-15-11667-2015, 2015.
Bengtsson, G., Fronæus, S., and Bengtsson-Kloo, L.: The kinetics Frampton, M. W., Ghio, A. J., Samet, J. M., Carson, J. L., Carter, J.
and mechanism of oxidation of hydroxylamine by iron (III), Dal- D., and Devlin, R. B.: Effects of aqueous extracts of PM10 filters
ton T., 2002, 2548–2552, 2002. from the Utah Valley on human airway epithelial cells, Am. J.
Bongaerts, E., Nawrot, T. S., Van Pee, T., Ameloot, M., and Bové, Physiol.-Lung C., 277, L960–L967, 1999.
H.: Translocation of (ultra) fine particles and nanoparticles across Galon-Negru, A. G., Olariu, R. I., and Arsene, C.: Size-resolved
the placenta; a systematic review on the evidence of in vitro, ex measurements of PM2.5 water-soluble elements in Iasi, north-
vivo, and in vivo studies, Part. Fibre Toxicol., 17, 1–26, 2020. eastern Romania: Seasonality, source apportionment and poten-
Brewer, G. J.: Iron and copper toxicity in diseases of aging, partic- tial implications for human health, Sci. Total Environ., 695,
ularly atherosclerosis and Alzheimer’s disease, Exp. Biol. Med., 133839, https://doi.org/10.1016/j.scitotenv.2019.133839, 2019.
232, 323–335, 2007. Gao, D., Godri Pollitt, K. J., Mulholland, J. A., Russell, A. G.,
Brook, R. D., Rajagopalan, S., Pope 3rd C. A., Brook, J. R., Bhat- and Weber, R. J.: Characterization and comparison of PM2.5
nagar, A., Diez-Roux, A. V., Holguin, F., Hong, Y., Luepker, R. oxidative potential assessed by two acellular assays, Atmos.
V., Mittleman, M. A., Peters, A., Siscovick, D., Smith Jr., S. C., Chem. Phys., 20, 5197–5210, https://doi.org/10.5194/acp-20-
Whitsel, L., and Kaufman, J. D.: Particulate matter air pollution 5197-2020, 2020a.
and cardiovascular disease: An update to the scientific statement Gao, D., Mulholland, J. A., Russell, A. G., and Weber, R. J.:
from the American Heart Association, Circulation, 121, 2331– Characterization of water-insoluble oxidative potential of PM2.5
2378, 2010. using the dithiothreitol assay, Atmos. Environ., 224, 117327,
Calderón-Garcidueñas, L., González-Maciel, A., Mukherjee, P. https://doi.org/10.1016/j.atmosenv.2020.117327, 2020b.
S., Reynoso-Robles, R., Pérez-Guillé, B., Gayosso-Chávez, C., Ghio, A. J., Carraway, M. S., and Madden, M. C.: Composition of
Torres-Jardón, R., Cross, J. V., Ahmed, I. A. M., and Kar- air pollution particles and oxidative stress in cells, tissues, and
loukovski, V. V.: Combustion-and friction-derived magnetic air living systems, J. Toxicol. Env. Heal. B., 15, 1–21, 2012.
pollution nanoparticles in human hearts, Environ. Res., 176, Gibbs, C. R.: Characterization and application of ferrozine iron
108567, https://doi.org/10.1016/j.envres.2019.108567, 2019. reagent as a ferrous iron indicator, Anal. Chem., 48, 1197–1201,
Canepari, S., Astolfi, M. L., Farao, C., Maretto, M., Frasca, D., Mar- 1976.
coccia, M., and Perrino, C.: Seasonal variations in the chemical Gonet, T. and Maher, B. A.: Airborne, vehicle-derived Fe-bearing
composition of particulate matter: a case study in the Po Valley. nanoparticles in the urban environment: A review, Environ. Sci.
Part II: concentration and solubility of micro- and trace-elements, Technol., 53, 9970–9991, 2019.
Environ. Sci. Pollut. Res., 21, 4010–4022, 2014. Hagler, G. S. W., Bergin, M. H., Salmon, L. G., Yu, J. Z., Wan,
Chen, Y., Luo, X.-S., Zhao, Z., Chen, Q., Wu, D., Sun, X., Wu, E. C. H., Zheng, M., Zeng, L. M., Kiang, C. S., Zhang, Y. H.,
L., and Jin, L.: Summer–winter differences of PM2.5 toxicity to and Schauer, J. J.: Local and regional anthropogenic influence
human alveolar epithelial cells (A549) and the roles of transition on PM2.5 elements in Hong Kong, Atmos. Environ., 41, 5994–
metals, Ecotox. Environ. Safe., 165, 505–509, 2018. 6004, 2007.
Chow, J. C.: Measurement methods to determine compliance with Hansen, D. A., Edgerton, E. S., Hartsell, B. E., Jansen, J. J., Kan-
ambient air quality standards for suspended particles, J. Air dasamy, N., Hidy, G. M., and Blanchard, C. L.: The southeastern
Waste Manage., 45, 320–382, 1995. aerosol research and characterization study: Part 1 – Overview,
Costa, D. L. and Dreher, K. L.: Bioavailable transition metals in J. Air Waste Manage., 53, 1460–1471, 2003.
particulate matter mediate cardiopulmonary injury in healthy and Huang, Y.-C. T., Ghio, A. J., Stonehuerner, J., McGee, J., Carter,
compromised animal models, Environ. Health Persp., 105, 1053– J. D., Grambow, S. C., and Devlin, R. B.: The role of soluble
1060, 1997. components in ambient fine particles-induced changes in human
Danadurai, K. S. K., Chellam, S., Lee, C.-T., and Fraser, M. P.: lungs and blood, Inhal. Toxicol., 15, 327–342, 2003.
Trace elemental analysis of airborne particulate matter using
dynamic reaction cell inductively coupled plasma–mass spec-
https://doi.org/10.5194/amt-14-4707-2021 Atmos. Meas. Tech., 14, 4707–4719, 20214718 Y. Yang et al.: A method for measuring iron and copper in aerosols Imamura, T. and Fujimoto, M.: Kinetics and Mechanism of the Res., 110, D03301, https://doi.org/10.1029/2004JD005082, Reaction of Copper(II) with Hydroxylamine in the Presence of 2005. Bathocuproine Disulfonate, B. Chem. Soc. Jpn., 48, 2971–2972, Moffett, J. W., Zika, R. G., and Petasne, R. G.: Evaluation of 1975. bathocuproine for the spectrophotometric determination of the Ito, A., Myriokefalitakis, S., Kanakidou, M., Mahowald, N. M., copper(I) in copper redox studies with applications in studies of Scanza, R. A., Hamilton, D. S., Baker, A. R., Jickells, T., natural waters, Anal. Chim. Acta, 175, 171–179, 1985. Sarin, M., and Bikkina, S.: Pyrogenic iron: The missing link to Moreno-Ríos, A. L., Tejeda-Benítez, L., and Bustillo-Lecompte, high iron solubility in aerosols, Science Advances, 5, eaau7671, C.: Sources, characteristics, toxicity, and control of ul- https://doi.org/10.1126/sciadv.aau7671, 2019. trafine particles: An overview, Geosci. Front., 101147, Johnson, D. K., Stevenson, M. J., Almadidy, Z. A., Jenkins, S. E., https://doi.org/10.1016/j.gsf.2021.101147, in press, 2021. Wilcox, D. E., and Grossoehme, N. E.: Stabilization of Cu(I) for Nel, A.: Air pollution-related illness: effects of particles, Science, binding and calorimetric measurements in aqueous solution, Dal- 308, 804–806, 2005. ton T., 44, 16494–16505, 2015. Oakes, M., Rastogi, N., Majestic, B. J., Shafer, M., Schauer, J. J., Khillare, P. S. and Sarkar, S.: Airborne inhalable metals in residen- Edgerton, E. S., and Weber, R. J.: Characterization of soluble tial areas of Delhi, India: distribution, source apportionment and iron in urban aerosols using near-real time data, J. Geophys. Res., health risks, Atmos. Pollut. Res., 3, 46–54, 2012. 115, D15302, https://doi.org/10.1029/2009JD012532, 2010. Kim, J. S., Peters, T. M., O’Shaughnessy, P. T., Adamcakova-Dodd, Olson, D. A., Turlington, J., Duvall, R. M., McDow, S. R., Stevens, A., and Thorne, P. S.: Validation of an in vitro exposure system C. D., and Williams, R.: Indoor and outdoor concentrations of for toxicity assessment of air-delivered nanomaterials, Toxicol. organic and inorganic molecular markers: Source apportionment in Vitro, 27, 164–173, 2013. of PM2.5 using low-volume samples, Atmos. Environ., 42, 1742– Kuang, X. M., Gonzalez, D. H., Scott, J. A., Vu, K., Hasson, 1751, 2008. A., Charbouillot, T., Hawkins, L., and Paulson, S. E.: Cloud Poulton, S. W. and Canfield, D. E.: Development of a sequential Water Chemistry Associated with Urban Aerosols: Rapid Hy- extraction procedure for iron: implications for iron partitioning droxyl Radical Formation, Soluble Metals, Fe(II), Fe(III), and in continentally derived particulates, Chem. Geol., 214, 209–221, Quinones, ACS Earth Space Chem., 4, 67–76, 2019. 2005. Kulshrestha, A., Satsangi, P. G., Masih, J., and Taneja, A.: Metal Rastogi, N., Oakes, M. M., Schauer, J. J., Shafer, M. M., Majestic, concentration of PM2.5 and PM10 particles and seasonal varia- B. J., and Weber, R. J.: New technique for online measurement of tions in urban and rural environment of Agra, India, Sci. Total water-soluble Fe(II) in atmospheric aerosols, Environ. Sci. Tech- Environ., 407, 6196–6204, 2009. nol., 43, 2425–2430, 2009. Lakey, P. S., Berkemeier, T., Tong, H., Arangio, A. M., Lu- Rozan, T. F., Taillefert, M., Trouwborst, R. E., Glazer, B. T., Ma, cas, K., Pöschl, U., and Shiraiwa, M.: Chemical exposure- S., Herszage, J., Valdes, L. M., Price, K. S., and Luther Iii, G. response relationship between air pollutants and reactive oxy- W.: Iron-sulfur-phosphorus cycling in the sediments of a shal- gen species in the human respiratory tract, Sci. Rep., 6, 32916, low coastal bay: Implications for sediment nutrient release and https://doi.org/10.1038/srep32916, 2016. benthic macroalgal blooms, Limnol. Oceanogr., 47, 1346–1354, Lee, B.-K. and Hieu, N. T.: Seasonal variation and sources of heavy 2002. metals in atmospheric aerosols in a residential area of Ulsan, Ko- Schrand, A. M., Rahman, M. F., Hussain, S. M., Schlager, J. J., rea, Aerosol Air Qual. Res., 11, 679–688, 2011. Smith, D. A., and Syed, A. F.: Metal-based nanoparticles and Lee, Y., Chun, H.-S., Moon, J.-Y., Choi, J. S., Park, D., and their toxicity assessment, WIREs Nanomed. Nanobiotechnol., 2, Lee, Y.-C.: Correlation of α/γ -Fe2 O3 nanoparticles with the 544–568, 2010. toxicity of particulate matter originating from subway tun- See, S. W., Wang, Y. H., and Balasubramanian, R.: Contrasting reac- nels in Seoul stations, Korea, J. Hazard. Mater., 382, 121175, tive oxygen species and transition metal concentrations in com- https://doi.org/10.1016/j.jhazmat.2019.121175, 2020. bustion aerosols, Environ. Res., 103, 317–324, 2007. Lin, T.-L. and Luo, C.-S.: Matrix effects in PIXE analysis on liquid Shi, Z., Bonneville, S., Krom, M. D., Carslaw, K. S., Jickells, T. samples with an external beam, Nucl. Instrum. Methods, 159, D., Baker, A. R., and Benning, L. G.: Iron dissolution kinetics of 387–393, 1979. mineral dust at low pH during simulated atmospheric processing, Majestic, B. J., Schauer, J. J., Shafer, M. M., Turner, J. R., Fine, P. Atmos. Chem. Phys., 11, 995–1007, https://doi.org/10.5194/acp- M., Singh, M., and Sioutas, C.: Development of a wet-chemical 11-995-2011, 2011. method for the speciation of iron in atmospheric aerosols, Envi- Smith, G. F. and Wilkins, D. H.: New Colorimetric Reagent Specific ron. Sci. Technol., 40, 2346–2351, 2006. for Cooper, Anal. Chem., 25, 510–511, 1953. Manousakas, M., Papaefthymiou, H., Eleftheriadis, K., and Kat- Stookey, L. L.: Ferrozin-a new spectrophotometric reagent for iron, sanou, K.: Determination of water-soluble and insoluble ele- Anal. Chem., 42, 779–781, 1970. ments in PM2.5 by ICP-MS, Sci. Total Environ., 493, 694–700, Sutto, T. E.: Magnetite fine particle and nanoparticle environmental 2014. contamination from industrial uses of coal, Environ. Pollut., 243, Marcazzan, G. M., Ceriani, M., Valli, G., and Vecchi, R.: Source ap- 528–533, 2018. portionment of PM10 and PM2.5 in Milan (Italy) using receptor Tomaszewski, R.: ABUNDANCE OF ELEMENTS IN THE modelling, Sci. Total Environ., 317, 137–147, 2003. EARTH’S CRUST AND IN THE SEA, CRC Handbook of Meskhidze, N., Chameides, W. L., and Nenes, A.: Dust and pol- Chemistry and Physics and The Merck Index, Scientometrics, lution: A recipe for enhanced ocean fertilization?, J. Geophys. 112, 14–17, 2017. Atmos. Meas. Tech., 14, 4707–4719, 2021 https://doi.org/10.5194/amt-14-4707-2021
You can also read