Associating disease-related genetic variants in intergenic regions to the genes they impact
←
→
Page content transcription
If your browser does not render page correctly, please read the page content below
Associating disease-related genetic
                                 variants in intergenic regions to the genes
                                 they impact
                                 Geoff Macintyre1,6,7 , Antonio Jimeno Yepes1,7 , Cheng Soon Ong2,3,4 and
                                 Karin Verspoor1,5
                                1 Department of Computing and Information Systems, The University of Melbourne, VIC,

                                 Australia
                                2 Department of Electrical and Electronic Engineering, The University of Melbourne, VIC,

                                 Australia
                                3 Machine Learning Group, NICTA Canberra Research Laboratory, Australia
                                4 Research School of Computer Science, Australian National University, Australia
                                5 Health and Biomedical Informatics Centre, The University of Melbourne, VIC, Australia
                                6 Centre for Neural Engineering, The University of Melbourne, VIC, Australia
                                7
                                 These authors contributed equally to this work.

                                    ABSTRACT
                                    We present a method to assist in interpretation of the functional impact of
                                    intergenic disease-associated SNPs that is not limited to search strategies proximal
                                    to the SNP. The method builds on two sources of external knowledge: the growing
                                    understanding of three-dimensional spatial relationships in the genome, and the
                                    substantial repository of information about relationships among genetic variants,
                                    genes, and diseases captured in the published biomedical literature. We integrate
                                    chromatin conformation capture data (HiC) with literature support to rank putative
                                    target genes of intergenic disease-associated SNPs. We demonstrate that this hybrid
                                    method outperforms a genomic distance baseline on a small test set of expression
                                    quantitative trait loci, as well as either method individually. In addition, we show
                                    the potential for this method to uncover relationships between intergenic SNPs and
                                    target genes across chromosomes. With more extensive chromatin conformation
                                    capture data becoming readily available, this method provides a way forward towards
Submitted 23 May 2014
                                    functional interpretation of SNPs in the context of the three dimensional structure of
Accepted 7 October 2014
Published 23 October 2014           the genome in the nucleus.
Corresponding author
Karin Verspoor,                  Subjects Bioinformatics, Computational Biology, Genomics, Computational Science
karin.verspoor@unimelb.edu.au
                                 Keywords Text mining, eQTL, HiC, Non-coding variants, Data integration
Academic editor
Kenta Nakai
Additional Information and       INTRODUCTION
Declarations can be found on     Detection and characterisation of disease-associated genetic variation is a major emphasis
page 20
                                 of current scientific inquiry. Recent technological advances have enabled investigation of
DOI 10.7717/peerj.639
                                 increasingly complex genetic architectures and their relationship to disease. Genome-wide
    Copyright                    association studies (GWAS) are using large sample cohorts to associate increasing
2014 Macintyre et al.
                                 numbers of single-nucleotide polymorphisms (SNPs) with disease phenotypes (Solovieff
Distributed under                et al., 2013), and whole-genome sequencing efforts such as The Cancer Genome Atlas
Creative Commons CC-BY 4.0
                                 (The Cancer Genome Atlas Research Network, 2011) are uncovering large numbers of pu-
OPEN ACCESS                      tative cancer-causing single nucleotide variations. However, the functional interpretation

                                 How to cite this article Macintyre et al. (2014), Associating disease-related genetic variants in intergenic regions to the genes they
                                 impact. PeerJ 2:e639; DOI 10.7717/peerj.639
of these variations has focused mainly on those residing in protein-coding regions of
                                    the genome (Ward & Kellis, 2012b), despite the fact that the majority lie in non-coding
                                    regions (Pastinen, 2010; The 1000 Genomes Project Consortium, 2010). This is due to
                                    some of the difficulties in functional interpretation of intergenic SNPs. Distinguishing
                                    driver mutations from passenger in intergenic regions is difficult and intergenic SNPs
                                    may affect function in subtle ways such as disrupting regulatory elements (Schaub et al.,
                                    2012). Experimental approaches for validation of the functional impact of intergenic
                                    variation are involved (Paul, Soranzo & Beck, 2014), thus new computational approaches
                                    are emerging in an attempt to reduce the burden of functional interpretation of intergenic
                                    variation (Ward & Kellis, 2012a; Macintyre et al., 2010; Li et al., 2013).
                                       Functional interpretation of an intergenic variant requires that the gene impacted by
                                    the variant be identified—the target gene (Anonymous, 2012). A common mode of impact
                                    is via disruption of a regulatory element (enhancer) controlling the target gene (Paul,
                                    Soranzo & Beck, 2014). However, as regulatory elements can be located far away from
                                    the genes they regulate (Lieberman-Aiden et al., 2009; Fullwood et al., 2009), associating
                                    variant and target gene can be problematic. Considering genes flanking the variant in
                                    linear genomic space will, in many cases, miss the target gene. However, considering
                                    larger search spaces will often result in too many putative targets. Therefore additional
                                    information is required to associate the variation with its target gene.
                                       Chromatin marks (Ernst & Kellis, 2010), DNA conservation (Spivakov et al., 2012),
                                    chromatin interaction data (Lieberman-Aiden et al., 2009), expression quantitative trait
                                    loci (eQTL) (Gilad, Rifkin & Pritchard, 2009), changes in transcription factor binding
                                    affinities (Macintyre et al., 2010), and combinations of these (Li et al., 2013; Duggal, Wang
                                    & Kingsford, 2014), have been shown to succesfully reduce the target gene search space. In
                                    many cases, however, the underlying data is such that there is inadequate statistical power
                                    to achieve completely unbiased search. For example, eQTLs are based on a statistical
                                    association test between genetic variants and gene expression levels and hence their
                                    determination depends on having sufficient sample sizes (typically tens or hundreds of
                                    individuals with both sequence and gene expression data). Therefore eQTL studies are
                                    usually carried out considering only genes nearby SNPs and as such this data is biased
                                    towards SNP-proximal gene associations (Nica & Dermitzakis, 2013).
                                       Careful selection of the types of data used for search space reduction is required in
                                    order to achieve an unbiased search strategy. Recent experimental advances in mapping
                                    the three dimensional structure of the genome in the nucleus have led to the HiC
                                    method (Lieberman-Aiden et al., 2009). These data are ideal for limiting the search space
                                    for candidate target genes of a variant in an unbiased fashion. For any given genomic
                                    region containing a variant, it is possible to determine what other regions in the genome
                                    are in close proximity within the nucleus. It can be assumed that these regions are more
                                    likely to contain a gene which is a good candidate for being a direct target of an intergenic
                                    variant, and indeed recent work has demonstrated that chromatin structure is useful for
                                    characterising eQTLs (Duggal, Wang & Kingsford, 2014). However, the current resolution
                                    of the genomic interaction data from these technologies is such that the list of candidate

Macintyre et al. (2014), PeerJ, DOI 10.7717/peerj.639                                                                        2/24
genes obtained from regions that interact with the region containing the variant is too
large. Therefore, more information is required to prioritise this candidate list. The function
of candidate target genes of a variant may in many cases have been explored within the
biomedical literature in the context of a disease. Consequently, it should be possible to
mine the literature for this information and prioritise candidate genes accordingly.
In this work, we explore strategies for ranking the association of a DNA variant in
an intergenic region to a gene, without the need for SNP-related gene expression data
(eQTLs), but using evidence that is more informative than simple sequence distance. We
consider two primary approaches that take advantage of general background knowledge
to establish putative associations between intergenic variants and genes. One source of this
knowledge is the published biomedical literature, which is mined to establish SNP-gene
relationships, considered in the context of specific diseases. This can be viewed as capturing
the broader, indirect associations among SNPs and genes. Another source is the 3D
“interactome” data that is indicative of physical interactions at the genomic level.
We compare these strategies, both individually and in combination, to a sequence
distance baseline, with respect to a set of eQTLs. Our results are suggestive of the promise
of the approach, with the proposed hybrid ranking scheme outperforming the distance
baseline , and an exploratory analysis identifying a putative functional mechanism for a
gene ranked as a high-ranked candidate target for a given SNP in the data set.
METHODS
When attempting to interpret the functional impact of an intergenic SNP, a number of
approaches are typically employed. As a first step, the likely target gene of the SNP is
determined. Once this has been achieved, the relationship of the SNP relative to the
putative target gene will dictate which experimental or computational procedures will
be used to verify the relationship. For intergenic SNPs it is generally considered that they
will have some sort of regulatory effect. Candidate target gene search typically involves
looking at the closest gene to the SNP in linear genomic distance. Given that genetic units
are inherited as blocks, it is not a bad assumption to make that the nearest gene is the most
likely candidate. However, given that chromatin looping plays a significant role in gene
regulation (Fullwood et al., 2009), the chromatin architecture may be such that the nearest
gene is not the correct target gene. As soon as many genes are considered putative targets,
approaches are required to rank these genes for subsequent followup. Below, we explain
four ranking approaches considered in this paper.
Genome sequence distance (2D) ranking
Given the fundamental assumption that intergenic SNPs impact the closest genes to them,
as measured by sequence distance, we have employed a baseline ranking method based on
genomic sequence distance. In this method, the association between an intergenic SNP and
a gene is the number of intervening base pairs separating them. The ranking is determined
by the distance, from the smallest distance to the largest. Genes on different chromosomes
are given the bottom rank as no 2D distance can be calculated. Gene annotations from
Macintyre et al. (2014), PeerJ, DOI 10.7717/peerj.639 3/24build hg18 for the human genome were used to compute distances from the SNPs of
1 dbSNP: https://www.ncbi.nlm.nih.gov/
interest from dbSNP 132.1
SNP/
Spatial (3D) ranking
The HiC method proposed by Lieberman-Aiden et al. (2009) allows unbiased identification
of chromatin interactions across an entire genome, providing a physical basis for
determining interactions among genomic regions. In brief, chromatin is cross-linked with
formaldehyde then restriction enzyme digested, and the remaining fragments are ligated
so that linked regions form the same ligation product. These products are then subjected
to deep sequencing. The method produces a probability contact map for genomic regions,
at megabase resolution. The strength of probability among the region of a given intergenic
SNP of interest and the location of a gene in this 3D map is used to establish the spatial
association between the intergenic SNP and any gene it is in contact with (subject to a
threshold). We used HiC profiling of lymphoblast cells (Lieberman-Aiden et al., 2009)
subjected to the normalisation method of Yaffe & Tanay (2011) which computes log
(base2) ratios of observed and expected read counts for each 1 MB window across the
human genome (build hg18). For any given SNP, the log ratio of all 1 MB regions across the
genome interacting with the 1 MB region containing the SNP was assigned to genes falling
within these regions. For the given SNP, all genes were then ranked according to their
likelihood of interacting with the SNP based on HiC profiling. In this study, we limited our
analysis to HiC data for the HindIII restriction enzyme. This source of data is referred to
as rankspatial .
Literature-based ranking
We develop two literature-based ranking strategies, that capture complementary
information.
The first approach (described in “Gene-disease association scores”) strictly focuses
on establishing disease-specific rankings of genes. The rankings reflect the strength of
association between a disease and a set of genes, based on how frequently a disease and
a gene are mentioned together in the literature (with respect to background expectation
for their co-mention). The particular SNPs of interest do not play a specific role in this
analysis, other than to limit the set of diseases considered; indeed the ranking of genes will
be the same for every SNP, with respect to a given disease.
The second approach (described in “SNP-gene co-occurrence score ranking”) aims to
identify direct support for the relationship between an SNP and a gene, by searching the
literature specifically for abstracts in which an SNP and a gene are mentioned together.
This approach is clearly tied to the availability of abstract-level details about an SNP
existing in PubMed; this data is very sparse, in part due to the fact that specific details about
genetic variants are only rarely available in published abstracts (Jimeno Yepes & Verspoor,
2014a). Unfortunately, the access to the full content of the article is limited, with only
around 600k articles available from PubMed Central (a small proportion of the over 23M
citations available from PubMed). However, where it is available it can provide important
evidence of an association.
Macintyre et al. (2014), PeerJ, DOI 10.7717/peerj.639 4/24Both methods are applied to a corpus of documents which is processed to detect
mentions of genes and dbSNP SNPs, and to identify the diseases that specific publications
are related to. More details of these steps are provided below.
Several prior efforts have addressed the interpretation of SNPs via the biomedical
literature. The GRAIL method (Raychaudhuri et al., 2009) focuses on prioritising genes
in disease-implicated regions on the basis of similarities of genes as determined by the
similarity of the texts associated to the genes. The method has the effect of aggregating all
genes within a given disease region, though the analysis usually results in a single candidate
gene in each region being recognised as most significant. Determination of the genes in a
region of an SNP in this method is based on LD (linkage disequilibrium) characteristics,
and is effectively based on genomic distance. Similarly, the method of Johansson et
al. (2012) collects the genes within a 50k base pair window around an SNP, and then
determines probabilities of association of those genes to a disease or phenotype based on
key terms in the literature associated to the genes. These methods are both successful in
supporting SNP interpretation, and demonstrate the utility of the literature in supporting
functional analysis. However, they assume physical proximity of SNPs to genes as the
overriding basis for associating SNPs to genes; we will show that by considering a broader
set of genes we can identify relationships they may miss.
Literature sources
Resources from the US National Library of Medicine (NLM) like PubMed and PubMed
Central offer access to the biomedical literature. PubMed currently indexes over 23 million
biomedical publications, and provides publication meta-data (title, authors, journal,
publication date) as well as associated index concepts from the Medical Subject Headings
(MeSH) controlled vocabulary. Among these concepts is the general concept “cancer”.
We used this term to identify cancer-related literature in PubMed. PubMed expanded
this query automatically to include MEDLINE citations indexed with the MeSH heading
“Neoplasms” and any descendent term in the MeSH hierarchy. We retrieved 2.7 million
cancer-related citations from PubMed in December 2012 using this term, and built a local
repository of the abstract text of each of these citations. We refer to this as the cancer
corpus. We have restricted our analysis in this paper to cancer related diseases for two
reasons. Firstly, it allows us to limit our predictions of SNP-gene interaction to a managable
number for evaluation of performance of the method. Secondly, the cancer literature
is extensive and mature, and includes substantial SNP association studies providing an
adequate number of instances in which to assess performance of our approach.
Intergenic SNP mention detection
The database dbSNP (Sherry et al., 2001) provides large catalog of SNPs, publicly available
from the NCBI. It provides a mechanism for specifically identifying mutations that occur
in intergenic regions as explained on their website.2 We applied that procedure to retrieve
2 http://www.ncbi.nlm.nih.gov/books/ all human intergenic SNPs in dbSNP Build 139, available online as of October 31, 2013.
NBK44466//#Search.how do i obtain From these, we sub-select only those that are mentioned in the literature corpus that we
snps located in h
have compiled.
Macintyre et al. (2014), PeerJ, DOI 10.7717/peerj.639 5/24Since our study is limited to intergenic SNPs identified through dbSNP, we relied
exclusively on mentions of the dbSNP identifiers, also known as the rsIDs (because
each is in the form “rs00000”). The EMU tool (Doughty et al., 2011) was used to detect
mention of rsIDs in the abstracts. 10,143 rsID mentions were detected in the set of 2.7
million abstracts, containing 5,337 unique rsIDs. Of these, 2,409 mentions were classified
as intergenic based on dbSNP, representing 1,181 unique rsIDs.
Gene mention detection and normalisation
The literature is used in our work to establish background statistics of gene-disease
association. The starting point for this is detection of mentions of specific genes in the
literature, and normalisation of those mentions to NCBI Gene database identifiers. We
used a dictionary-based approach to annotate the corpus, as such methods have been
shown to be effective for gene normalisation (Jimeno-Yepes et al., 2013; MacKinlay &
Verspoor, 2013), especially for the context of interpreting human SNPs, since human genes
are less ambiguous than gene names in other species.
We used a large dictionary of gene names based on a dictionary built from the human
subset of the NCBI Gene database. We followed the procedure in Jimeno-Yepes et al. (2013),
removing duplicates and filtering out certain misleading or ambiguous gene names, such
as those ending with “disease”, “syndrome”, or “susceptibility”, and removed terms from
a standard stopword list.3 The entries in the dictionary are linked to their originating
3 Stopword list from the SMART system: NCBI Gene identifier. If an entry is common to multiple NCBI Gene records, all relevant
ftp://ftp.cs.cornell.edu/pub/smart. identifiers are associated with the dictionary entry.
We used the ConceptMapper tool (Tanenblatt, Coden & Sominsky, 2010; Funk et al.,
2014)4 as the dictionary tagger tool, reusing the configuration prepared for the BioCreative
4 http://uima.apache.org/d/uima- 2013 CTD track (MacKinlay & Verspoor, 2013), which does not make case distinction,
addons-current/ConceptMapper/ tokens have to be matched in the same order, only the longest match is considered and
ConceptMapperAnnotatorUserGuide.
html tokens that form part of a multiple-token name must be adjacent to each other. The output
of ConceptMapper provides a list of extracted genes with their position in text and their
normalization to an NCBI identifier.
ConceptMapper with the NCBI derived dictionary was used to annotate the MEDLINE
cancer subset. For each gene mention identified in text, we have the PMID of the citation,
the start and end position of the mention, the term identified in text and its NCBI
identifier. From this annotation, we extract the genes identified in each citation. This
list is used to derive gene-disease associations as shown below.
SNP-disease relationships
We utilise the literature to establish an association between an SNP and a disease. We first
apply the intergenic SNP detection described above. For each citation in our corpus that
mentions at least one intergenic SNP, we then look for any cancer-related MeSH term
in the meta-data for that citation. MeSH indexing of MEDLINE summarizes the most
relevant MeSH concepts with respect to the content of the article and it is available from
the MEDLINE baseline distribution. Cancer-related MeSH terms are considered the ones
under the Neoplasms MeSH heading with tree number starting with C4. This provides us
Macintyre et al. (2014), PeerJ, DOI 10.7717/peerj.639 6/24with SNP-disease relations. The diseases from these relations are used as a disease filter; we
estimate gene-disease associations for these diseases as explained below.
Gene-disease association scores
To establish the strength of a gene-disease association, we must first count the number
of times each gene is mentioned in an abstract related to a given disease throughout
our corpus. We apply the gene normalisation step to find all abstracts that mention a
given gene. For each abstract in our corpus that mentions at least one gene, we then look
for any cancer-related MeSH term in the meta-data for that abstract following the same
procedure as for SNP-disease relationships. For each such disease MeSH term, we record an
association between the genes mentioned in the abstract, and that disease. In this manner,
we establish counts for each {gene, disease} pair in the corpus.
The gene-disease association score is estimated based on the t-test, where the test looks
at the difference between the observed x and the expected mean µ. We have preferred
this to other alternatives like mutual information due to the problems that they have with
respect to low frequency events (Manning & Schütze, 1999).
In the test, the expected mean is the probability of the gene and the disease not being
associated, i.e., being independent P(Gene)P(Disease), and the observed P(Gene,Disease)
is the probability of the gene and the disease together. The variance is based on the
observed distribution considered as a Bernoulli distribution. N is the number of citations
in the cancer corpus.
x−µ
t= . (1)
s2
N
The literature-based gene-disease association score generates a ranking that will be
the same regardless of which SNP is considered since that method does not consider the
SNP directly. However, we utilise the established SNP-disease relationships to limit the
diseases considered relevant to the SNP. This in turn restricts the set of genes which are
considered to be potentially relevant to the SNP. Thus, we produce SNP-gene associations
that are based on the SNP’s association to a disease, and intersect the diseases common to
the SNP-disease and disease-gene sets to produce a set of SNP-disease-gene associations.
Each SNP-disease-gene association is assigned the score of the underlying disease-gene
association. This score is used to compute rankliterature .
SNP-gene co-occurrence score ranking
To consider the possibility of direct mentions of intergenic SNP-gene interactions in the
literature, we counted the number of abstracts in which a given intergenic SNP from our
data set and a gene are mentioned together with the text of an abstract (an SNP-gene
“co-mention”). Although we did not attempt to establish the specific nature of the
relationship between the SNP and the gene as mentioned in the article, prior work has
found that simple co-occurrence of such concepts can be useful to establish a biological
relationship (Gabow et al., 2008; Verspoor et al., 2013; Sokolov et al., 2013).
Macintyre et al. (2014), PeerJ, DOI 10.7717/peerj.639 7/24Table 1 Scores vs ranks: for a list of length n the fractional rank is given by the position i of the object
divided by n + 1.
Distance 43k 2k 500k 8k 1292k
Position (i) 3 1 4 2 5
i )
Rank ( n+1 3 = 0.5 1 = 0.167 4 = 0.667 2 = 0.333 5 = 0.833
6 6 6 6 6
There are very few of these intergenic SNP-gene co-mentions within the abstracts of our
literature dataset. There is an average of 5.88 unique genes co-mentioned with each of the
1,181 intergenic SNPs in the data set, with a standard deviation of 7.36 across the set of
SNPs. This value is consistent with the result for all the SNPs in the full dbSNP set (average
5.77 and standard deviation 7.33).
We generated a ranking over the genes co-mentioned with each SNP based strictly on
the occurrence count of the co-mentions. However, we found this too sparse for direct use
(see “Evaluation of performance of hybrid approach against baseline”).
Hybrid Spatial-Literature association ranking
Recognising that genomic distance, the spatial association method and the literature-based
gene-disease association method provide complementary information—the physical
distance methods capturing mostly direct relationships among SNPs and genes and
the literature method capturing mostly indirect relationships—we experimented with a
method combining them.
The hybrid method takes the ranked list of genomic distances, the ranked list of
SNP-gene associations from the spatial method and the ranked list of SNP-(disease)-gene
associations based on the gene-disease association method, and computes a hybrid rank
for each SNP-(disease)-gene association as the geometric mean of the ranks from the three
source methods (Bedő & Ong, 2014). This has the effect of maintaining a high overall rank
for an association if it is ranked high in one of the three methods, even when the rank is
very low in the other two.
Since ranks are invariant to monotone transforms of the corresponding scores, some
care has to be taken when aggregating them. In particular, a normalisation procedure has
to be applied to the numerical representation to account for the fact that we have lists
which differ in length. In this paper, we consider fractional ranks in the unit interval, that
is each object’s rank is its position in the sorted list normalised by the length of the list. The
simple example in Table 1 illustrates this concept for genomic distance. The corresponding
operations for the spatial method and the literature method are the same.
After ranking, the different sources of information are comparable, and can be
directly multiplied. Therefore, the hybrid rank of rankgen dist , rankspatial and rankliterature
is calculated as
rankhybrid = rank(rankgen dist ∗ rankspatial ∗ rankliterature ), (2)
Macintyre et al. (2014), PeerJ, DOI 10.7717/peerj.639 8/24where the operation rank(·) just performs the normalisation described in Table 1. This
hybrid rank is used in the validation procedure in the experiments. For the discovery
experiments which are across different chromosomes, genomic distance is meaningless,
and therefore is dropped from the hybrid ranking,
rankhybrid = rank(rankspatial ∗ rankliterature ). (3)
Evaluation
Evaluation of any predictive method is difficult in the absence of labeled, gold standard
data. Since functional association of intergenic SNPs to genes has been studied substan-
tially less than the impact of mutations within genes or proteins, there is limited data
available to validate our methods. Therefore a gold standard proxy must be used. The most
suitable data for evaluation of our methods in this case comes from eQTL studies. These
data provide links between SNPs and putative target genes based on statistical assocation
of alleles and gene expression. It has been previously shown that these associations have a
strong link with 3D genome structure linking both genes and SNPs nearby in linear and
3D space (Duggal, Wang & Kingsford, 2014). From the eQTL data, we have for each SNP a
target gene implicated as the gene affected by that SNP. We take this as our gold standard
proxy—the gene that each method should rank high in the set of potentially associated
genes.
We consider two different experiments to demonstrate the utility of an unbiased
search strategy: a validation experiment to compare the performance of our proposed
method with a genomic distance baseline, and a discovery experiment where we focus on
interchromosomal associations. For the validation experiment, we had to limit the set of
genes considered to those residing on the same chromosome as the SNP since the genomic
distance baseline could not be computed between chromosomes. In addition, we focussed
the comparison on long-range enhancer-like associations by excluding genes within
500 Kbp of the SNP under consideration. For the discovery experiment, we considered
only target genes from different chromosomes as the SNP under study to determine if
cross-chromosomal interactions could be detected.
eQTL data sources
For evaluaton of our approach we extracted eQTL data from the GTEx (Genotype-Tissue
Expression) eQTL Browser (Lonsdale et al., 2013) across all eQTL studies in the database.
We obtained all eQTLs which matched SNPs in our disease-SNP dataset mined from the
literature. In each case, the associated gene was recorded along with the reported p-value
for the association between the SNP and gene. This resulted in a set of 26 unique SNPs for
which there was a significant (p < 0.01) association with the expression of a gene. After
filtering of these eQTL SNPs, 17 significant associations were considered positive labels in
our ranking assessment of the SNP target gene methods.
For confirmation of discovery of novel SNP target gene pairs, we queried the
5 http://www.sanger.ac.uk/resources/
HapMap3 (Stranger et al., 2012) eQTL study data via the GeneVar database.5 If a significant
software/genevar
Macintyre et al. (2014), PeerJ, DOI 10.7717/peerj.639 9/24association between disease SNP and putative target gene was found, this was considered
evidence for a putative functional relationship between the SNP and gene.
Comparison of rankings
For each SNP, the eQTL data provides a gene that is strongly associated to that SNP. Our
analysis compares the rank of that target gene in the ranking produced by each method.
We consider the genomic distance-based ranking as the baseline ranking to which we
compare the alternative ranking methods. This reflects the fact that genomic distance is
the primary method used in current approaches to establish SNP-gene associations, as well
as the importance of DNA proximity at a molecular level. In addition, we compute the
ranking based on the HiC likelihood and the literature based sources. For each SNP-disease
pair, we ordered all genes based on each of the three sources of information above, and
identified the ranks at which there is eQTL evidence for association. The spatial and
literature rankings are then aggregated using the geometric mean (Eq. (2)).
RESULTS
Evaluation of performance of hybrid approach against baseline
Using eQTL associations between the disease SNPs and genes as a gold standard (per
“Evaluation”) we assessed the performance of our hybrid ranking methods against a
baseline ranking based on 2D (linear) genomic distance. As mentioned before, we focus
on long range associations (>500 Kbp) since these are the cases of interest. Furthermore
the 1 MBps resolution of the HiC data means that the score derived from HiC could be on
average up to 500 Kbp distant from the SNP of interest. For fair comparison with genomic
distance we limited the hybrid rank approach to genes on the same chromosome as the
SNP. This resulted in a total of 81,569 associations, of which only 18 had eQTL evidence.
Two SNPs (rs2029166 and rs7296239) within 2 Kbp from each other in AAAS gene had
identical spatial and literature scores hence we considered them as one single instance,
leaving a total of 17 eQTL for assessing performance.
The details of the rankings are shown in Table 2. Note that the rankings are performed
for each SNP-disease pair, hence a particular gene may be ranked the same for different
SNP-disease combinations where the ranking relies on same HiC experiment (for example
rs344781 in gene PSG11). This shows an additional advantage of the literature-based
approach which allows prioritisation of the putative associations using disease specific
information. From Table 1, it can be seen that spatial ranking (HiC ranking) or literature
ranking alone do not provide results comparable to ranking based on linear genomic
distance. However, a combination of both methods (hybrid ranking) outperforms linear
ranking. Figure 1 highlights this by plotting, for each of the eQTL SNPs, the rank of the
target gene based on genomic distance (rankgen dist ) against the rank of that target gene
based on rankhybrid . Three of the 17 eQTLs had lower ranks, and only the top 14 eQTLs
are shown. Better performance corresponds to lower rank, i.e., if the rank according to the
hybrid method is lower than the rank of the genomic distance, then the hybrid method
has outperformed genomic distance-based ranking. This is the case for twelve eQTL SNPs,
while rankgen dist outperforms rankhybrid in five cases. Hence the hybrid method has an
Macintyre et al. (2014), PeerJ, DOI 10.7717/peerj.639 10/24Table 2 eQTL data used for validation. The eQTL column shows the p-value of the eQTL data. GD means genomic distance, and Lit. refers to the score resulting from
literature. rD, rHiC and rL refer to the ranks of genomic distance, HiC and literature respectively, out of Total number of genes which are more than 500 Kbp from the
SNP under consideration. rHy is the geometric mean rankhybrid . A nan value in Lit. means that no evidence was found in the literature.
PubMedID SNP Disease chr Location Gene GeneID GeneWindow eQTL GD HiC Lit. rD rHiC rL rHy Total
21995493 rs652625 Carcinoma, NSC Lung chr1 12147937 MTOR 2475 chr1:11M-12M 3.94E-05 902741 6.84 1.17 0.0091 0.0046 0.0282 0.0012 2408
20937265 rs344781 Carcinoma, NSC Lung chr19 48866627 PSG11 5680 chr19:48M-49M 1.96E-05 644155 7.16 nan 0.0031 0.0006 0.2842 0.0013 1594
Macintyre et al. (2014), PeerJ, DOI 10.7717/peerj.639
21761413 rs344781 Endometrial Neoplasms chr19 48866627 PSG11 5680 chr19:48M-49M 1.96E-05 644155 7.16 nan 0.0031 0.0006 0.2748 0.0013 1594
20937265 rs344781 Lung Neoplasms chr19 48866627 PSG11 5680 chr19:48M-49M 1.96E-05 644155 7.16 nan 0.0031 0.0006 0.2992 0.0013 1594
19760037 rs7187167 Breast Neoplasms chr16 1289209 WDR24 84219 chr16:0-1M 2.73E-05 608807 7.21 nan 0.0156 0.0021 0.7419 0.0042 961
21995493 rs652625 Lung Neoplasms chr1 12147937 MTOR 2475 chr1:11M-12M 3.94E-05 902741 6.84 −5.59 0.0091 0.0046 0.2263 0.0046 2408
23059779 rs12983047 Carcinoma, Squamous Cell chr19 46526338 CIC 23152 chr19:47M-48M 0.00036 954318 7.15 1.42 0.0218 0.0230 0.0131 0.0075 1607
19358266 rs7187167 Lymphatic Metastasis chr16 1289209 WDR24 84219 chr16:0-1M 2.73E-05 608807 7.21 nan 0.0156 0.0021 0.7034 0.0083 961
23059779 rs12983047 Adenocarcinoma chr19 46526338 CIC 23152 chr19:47M-48M 0.00036 954318 7.15 0.33 0.0218 0.0230 0.0492 0.0137 1607
23059779 rs12983047 Lung Neoplasms chr19 46526338 CIC 23152 chr19:47M-48M 0.00036 954318 7.15 −0.61 0.0218 0.0230 0.0834 0.0168 1607
22267197 rs2823093 Breast Neoplasms chr21 15442702 USP25 29761 chr21:16M-17M 0.00010 581512 6.57 −1.75 0.0101 0.0709 0.1723 0.0169 296
22344756 rs3213182 Carcinoma, Squamous Cell chr20 31726893 ITCH 83737 chr20:32M-33M 0.00021 687808 6.95 −5.09 0.0142 0.0236 0.2079 0.0173 635
23059779 rs12983047 Carcinoma, NSC Lung chr19 46526338 CIC 23152 chr19:47M-48M 0.00036 954318 7.15 −2.16 0.0218 0.0230 0.1176 0.0243 1607
21427733 rs2029166 Breast Neoplasms chr12 52876365 AAAS 8086 chr12:52M-53M 7.79E-05 874685 6.40 −2.42 0.0131 0.0533 0.2238 0.0262 1144
21427733 rs7296239 Breast Neoplasms chr12 52877970 AAAS 8086 chr12:52M-53M 0.00011 876290 6.40 −2.42 0.0131 0.0533 0.2238 0.0262 1144
22344756 rs3213182 Head and Neck Neoplasms chr20 31726893 ITCH 83737 chr20:32M-33M 0.00021 687808 6.95 nan 0.0142 0.0236 0.7858 0.0283 635
21733090 rs7096206 Carcinoma, Hepatocellular chr10 54201690 CHUK 1147 chr10:101M-102M 1.43E-06 47777644 2.00 −1.08 0.6705 0.9153 0.1695 0.5931 956
21733090 rs7096206 Liver Neoplasms chr10 54201690 CHUK 1147 chr10:101M-102M 1.43E-06 47777644 2.00 −4.22 0.6705 0.9153 0.2029 0.6234 956
11/24Figure 1 Ranks of individual data sources vs. hybrid rank. For each eQTL SNP, the rank of the target gene based on each of the three sources:
genomic distance (rankgend ist ), HiC (rankspatial ) and literature (ranklit ), are plotted against the rank of that target gene based on rankhybrid . Points
in the upper left corner (the green region) occur when the hybrid rank is superior. The hybrid rank is better 12/17, 10/17, 15/17 times as compared
to the respective sources. (A)–(C) shows the whole range of ranks [0, 1], whereas (D)–(F) shows the same data zoomed in to the range [0, 0.1].
advantage in 70% of the test cases. Figure 2 further demonstrates that the three sources we
have considered are complementary. A pair of correlated sources would result in a scatter
plot along the diagonal of the figure.
Since the evaluation set is small, it is difficult to ascertain the statistical advantage of
rankhybrid . Work is currently underway to obtain a larger eQTL database for validation, but
the current results already show the promise of our proposed approach.
We have not included the SNP-gene co-mention strategy (“SNP-gene co-occurrence
score ranking”) directly in the ranking comparison, as we found it to be too sparse and
noisy to be of direct use in ranking. We identified 133 co-mentions of SNPs and genes for
the eQTL SNPs, from which 9 match an entry in the eQTL experiments. Since there are
35 unique {SNP, gene} pairs in the eQTL benchmark, we can say that the recall of these
is over 25%, even though the precision would be rather low (7%). If we consider only
Macintyre et al. (2014), PeerJ, DOI 10.7717/peerj.639 12/24Figure 2 Pairwise rank comparison of each of the three source rankings. For each eQTL SNP, each of the three sources of information: genomic
distance (rankgend ist ), HiC (rankspatial ) and literature (ranklit ), is plotted against each other. (A)–(C) shows the whole range of ranks [0, 1], whereas
(D)–(F) shows the same data zoomed in to the range [0, 0.1].
co-mentions with frequency >1, there are 3 that match an entry in the eQTL experiments
out of 25 co-mentions in total (recall = 8%, precision = 12%). An informal analysis of the
results suggests that many genes and SNPs are mentioned together in an abstract that are
not biologically or linguistically connected. The precision could be substantially improved
by detecting true SNP-gene relationships expressed in the abstracts rather than simple
co-mentions; the strategy used to learn and detect protein-residue relationships could
perhaps be applied here (Ravikumar et al., 2012).
We note that identified SNP-gene co-mentions that do not match an eQTL experiment
may in fact be correct; some co-mentions which are false positives from the perspective of
the eQTL data may be valid relationships. For this reason, it is difficult to have confidence
in any precision analysis and we have preferred the ranking evaluation presented above.
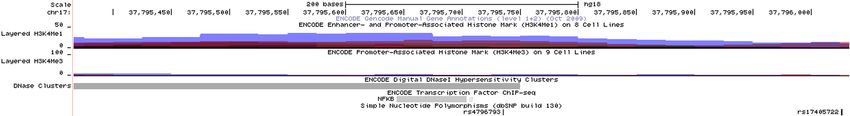
Macintyre et al. (2014), PeerJ, DOI 10.7717/peerj.639 13/24Figure 3 eQTL of SNP rs4796793 against CEACAM5. This figure shows an eQTL evaluation of SNP
rs4796793 against CEACAM5 for the LWK population using GeneVar.
Using the hybrid approach for novel SNP target gene discovery
We performed candidate target gene ranking for all of the 67 SNP-disease pairs in our
analysis yielding a total of 1,648,736 predicted candidates. We then used our hybrid
ranking strategy to prioritise target genes for further exploration. Given that our approach
is not limited to selection of target candidate genes on the same chromosome, we filtered
our results to look exclusively for candidates on a different chromosome to the SNP, to
highlight the power of our method. The top ranked associations can be found in Table 3.
We considered SNP/target gene pairs for the top 10 ranked results showing a HiC log ratio
greater than 1, combining the ranking from all diseases into one list. The most promising
candidate is shown at the bottom of Table 3, linking a risk SNP associated with non-small
cell lung cancer (NSCLC) on chromosome 17 with a target gene on chromosome 19,
CEACAM5. CEACAM5 has been shown to be over-expressed in lung cancer and was the
6th ranked gene linked to Lung Neoplasms using our literature ranking approach. These
two regions from chromosome 19 and chromosome 17 show evidence of interacting from
HiC data with a log ratio = 1.47. To determine if this SNP and gene have a regulatory
relationship, we searched for supporting evidence from a range of sources.
Firstly, we queried a large-scale eQTL study of HapMap3 (Stranger et al., 2012) data via
the GeneVar database.6 In the original study, STAT3 was the reported target gene of SNP
6 http://www.sanger.ac.uk/resources/ rs4796793 (2 kb upstream of the SNP) (Jiang et al., 2011). The study showed decreased
software/genevar risk of NSCLC for the minor allele (G). However, when we queried the HapMap eQTL
data we found no significant association between STAT3 and rs4796793 across HapMap
populations after multiple testing correction. Interestingly, when we examined CEACAM5,
we found a significant association with the SNP (p = 8.0e − 04) for the Luhya in Webuye
(LWK) population in Kenya. The C allele in this case showed increased CEACAM5
expression whereas the G allele showed decreased expression (Fig. 3). This suggests that
the C allele, showing increased risk for NSCLC may have a role in increasing expression
Macintyre et al. (2014), PeerJ, DOI 10.7717/peerj.639 14/24Table 3 Data used for SNP target gene discovery. HiC means the HiC score and Lit refers to the score resulting from literature. rD, rHiC and rL refer to the ranks of
genomic distance, HiC and literature respectively. rHy is the geometric mean rankhybrid . We report the significant SNPs, confirmed by an independent eQTL study on
GeneVar with p-value 0.05 of Spearman ρ.
Macintyre et al. (2014), PeerJ, DOI 10.7717/peerj.639
PubMedID SNP Disease chr Location Gene GeneWindow HiC Lit rHiC rL rHy Total p-value
21948749 rs4796793 Carcinoma, NSC Lung chr17 37795735 ERCC1 chr19:50M-51M 1.52 13.52 0.047955 0.000258 0.000043 23230 0.0152
17602083 rs4796793 Neoplasm Metastasis chr17 37795735 CEACAM7 chr19:46M-47M 1.47 15.74 0.062118 0.000086 0.000043 23230 0.0459
23059779 rs12983047 Carcinoma, NSC Lung chr19 46526338 TP53 chr17:7M-8M 1.37 19.21 0.045003 0.000174 0.000044 22976 0.0173
23059779 rs12983047 Carcinoma, Squamous Cell chr19 46526338 TP53 chr17:7M-8M 1.37 27.91 0.045003 0.000087 0.000044 22976 0.0173
21995493 rs652625 Lung Neoplasms chr1 12147937 TTF1 chr9:134M-135M 1.49 16.41 0.004690 0.000451 0.000045 22175 0.0231
22344756 rs3213182 Carcinoma, Squamous Cell chr20 31726893 PDXP chr22:36M-37M 1.23 19.24 0.036609 0.000292 0.000083 23956 0.0326
17602083 rs4796793 Carcinoma, Renal Cell chr17 37795735 XRCC1 chr19:48M-49M 1.53 73.29 0.046965 0.000043 0.000086 23230 0.0149
21948749 rs4796793 Lung Neoplasms chr17 37795735 CEACAM7 chr19:46M-47M 1.47 18.66 0.062118 0.000172 0.000086 23230 0.0459
21995493 rs652625 Carcinoma, NSC Lung chr1 12147937 ERCC1 chr19:50M-51M 1.05 13.52 0.053890 0.000316 0.000090 22175 0.038
21995493 rs652625 Lung Neoplasms chr1 12147937 CEACAM7 chr19:46M-47M 1.10 18.66 0.041082 0.000180 0.000090 22175 0.0359
21948749 rs4796793 Lung Neoplasms chr17 37795735 CEACAM5 chr19:46M-47M 1.47 18.66 0.061601 0.000258 0.000129 23230 0.0008
15/24Figure 4 SNP rs4796793 in the UCSC genome browser. This figure shows SNP rs4796793 mapped to the UCSC genome browser along with tracks
showing ENCODE information for histone modifications, DNaseI Hypersensitivity and transcription factor binding.
of CEACAM5, which is in concordance with the observed increase in expresion in lung
cancers (Blumenthal et al., 2007). As the HiC data reports these regions interacting in three
dimensional space for the major allele, we hypothesise that the minor allele must disrupt
this 3D conformation causing decreased expression of CEACAM5 and hence decreased
risk. We examined the genomic region containing the SNP and observed and enrichment
of histone marks supporting the presence of a regulatory element and in addition observed
evidence for an experimentally determined binding site for the transcription factor NFKB
(Fig. 4). If NFKB were to bind differentially to either allele, this may explain the change
in expression observed in CEACAM5 due to change in the 3D conformation of the DNA.
To test if differential binding was likely, we used a computational method that predicts
if the allele significantly alters binding affinity of the transcription factor (Macintyre
et al., 2010). From this the G allele is predicted to have a binding affinity significantly
(p < 5.4e − 06) stronger than the C allele. This provides a putative functional mechanism
for linking a disease-associated SNP with a target gene on a different chromosome. Further
experimental work is required to verify this observation.
DISCUSSION
Integrating multiple sources of information
One major challenge when integrating diverse sources of information is the various
intuitive ways of measuring association. In this work we consider 3D spatial association as
a contact probability, 2D spatial association as genomic distance, and literature association
as negative log p-values. These diverse measures of association can only be numerically
combined with appropriate normalisation and transformation, which may be complex and
difficult to properly estimate. For example, genomic distance and contact probabilities act
in opposite directions, i.e., small distances are “good” but big probabilities are “good”.
Furthermore, they have different scales as genomic distances could be large integers
whereas contact probabilities are in the interval [0,1]. Using a ranking approach allows
different association measures to be converted into the same direction and scale.
The spatial and literature scores complement each other as can be seen in the validation
experiment. HiC experiments result in contact map probabilities and hence do not take
disease information into account. Literature methods can take disease association into
account, but do not include spatial information. For example, the SNP rs344781 has no
literature evidence, hence resulting an extremely poor rank for literature. However there
is strong HiC evidence for the association (top rank) which results in a good hybrid rank.
Macintyre et al. (2014), PeerJ, DOI 10.7717/peerj.639 16/24When there is little HiC evidence (such as in rs7096206) weak evidence from literature can
pull up the hybrid rank.
The importance of the literature score is further confirmed by Table 2, which shows its
value in the discovery setting. Genomic distance cannot be used across chromosomes, and
literature evidence provides useful directions, as we have confirmed using GeneVar.
The general approach of integrating various sources of information using the geometric
mean is not limited to two sources of information. As different facets of the putative
SNP-gene association or SNP-disease association can be estimated, these can all be
combined using the geometric mean to obtain a single candidate list of associations for
further study.
Suitability of the eQTL reference set for evaluation
We opted to test the performance of our SNP target gene ranking method using
eQTL information as a gold standard. While we considered this the best independent
information currently available associating SNPs and genes on a genomic scale, there are
some pitfalls that need to be made clear. Firstly, many of the eQTL studies have an inherent
bias towards associations that are proximal to the SNP. Due to multiple testing correction
burden, it is not possible to test all SNPs against all genes for association, therefore only
genes nearby the SNP are tested. In this case, we may be artificially penalising our method
against selecting interactions at a large distance. That is, not matching a prediction in the
eQTL experiments does not imply that the SNP-gene association predicted is necessarily
incorrect, favouring the use of a ranking evaluation instead of precision/recall measures.
In addition to this, significant eQTL assocations can arise from a SNP directly affecting a
gene, or indirectly affecting the gene via an upstream target. Therefore, these data may also
contain false positives with respect to predicting direct targets. Nevertheless, until large
scale functional chromatin interaction experimental data is available, we believe eQTL data
provides an adequate source of benchmarking data for methods such as those presented in
this paper.
Limitations of the literature-based methods
Recognition of intergenic SNPs
To focus specifically on intergenic SNPs, it is necessary to categorise SNPs as intergenic
or not. The Human Genome Variation Society (HGVS) nomenclature (Den Dunnen
et al., 2000) provides specific notation for non-coding RNA reference sequences (with
the prefix “n.”), as well as for referencing specific nucleotides in any genomic reference
sequence (with the prefix “g.”), where the locations may or may not be coding DNA.
This nomenclature in principle provides a technique for straightforward identification of
intergenic regions, by looking for genomic variants and cross-referencing their positions
with the gene starts/stops in the reference sequences. However, our prior experience
with text mining of genetic variants (Jimeno Yepes & Verspoor, 2014b) suggests that these
descriptors are extremely rarely used in practice. The vast majority of references to genetic
variants in the literature refer to coding DNA or protein variants. Our approach to SNP
identification, therefore, is limited to recognising known intergenic SNPs (“Intergenic SNP
Macintyre et al. (2014), PeerJ, DOI 10.7717/peerj.639 17/24mention detection”). Other methods could be explored to extend the set of SNPs extracted
from text (Krallinger et al., 2009; Thomas et al., 2011).
Reliance on named entity recognition for literature identification
As indicated above, there is prior work on using the biomedical literature to support SNP
interpretation (Raychaudhuri et al., 2009; Johansson et al., 2012). Both of these methods
rely on links from the NCBI Gene database to identify relevant literature; in contrast
we do not rely on the existence of such curated links and perform indexing of direct
gene mentions throughout the available abstracts. We are not aware of a study that has
specifically considered the completeness of the links to the literature available from the
NCBI from the Gene or GeneRIF (Gene Reference Into Function) resources, but given
that they must be manually updated or submitted by a member of the community, it is
likely that the citations linked there represent only a fraction of the literature relevant to a
given gene. A brief investigation of these resources for a single well-studied gene, Human
BRCA1, indicates that there are 1,956 PubMed citations associated to its NCBI Gene
record. In contrast, our annotation of the abstract text identifies well over 7,000 abstracts
that reference that gene. In contrast, for less well-studied genes, we found that there could
be links to the literature in the NCBI Gene record that we did not identify from abstract
mentions, likely due to mentions of the gene in the full text of the article rather than the
abstract, or due to missing name variants/synonyms in our gene name dictionary.
Alternative methods for establishing gene-disease associations from the
literature
Various strategies for establishing gene-disease associations have been explored previously;
while we have tested one approach, it could be straightforwardly substituted with an
alternative knowledge-based method for establishing gene-disease associations. There
are literature-based methods that have addressed association of genes to disease based
on co-occurrences for a set of articles defined by a user query (Rebholz-Schuhmann
et al., 2007; Tsuruoka, Tsujii & Ananiadou, 2008) or that rely on matching of MeSH
profiles (Cheung et al., 2012; Xiang et al., 2013). Other methods use indirect relations from
co-occurrence analysis (Frijters et al., 2010) or based on interaction networks (Gonzalez et
al., 2007; Özgür et al., 2008). Some combine different sources of information including the
literature, such as Endeavour (Aerts et al., 2006), DisGeNET (Bauer-Mehren et al., 2010),
G2D (Perez-Iratxeta et al., 2005), MimMiner (van Driel et al., 2006), PolySearch (Cheng et
al., 2008) or the approach proposed by Tiffin et al. (2005). Many of these methods could be
effectively integrated into our approach.
An alternative to utilising MeSH annotations to establish the association to diseases in
the literature would be to do direct annotation of disease mentions in the text, as we have
done for gene names. This is the strategy employed by Johansson et al. (2012) and some
of the other approaches introduced above. However, any automated name recognition
strategy will suffer from some rate of noise. For the purposes of experimenting with the
literature-based concept, we felt that it was sufficient to utilise the MeSH annotations
provided in MEDLINE. Furthermore, we verified that the key terms available from the
citation meta-data matched the disease linked with the SNPs in our data. Text-level
Macintyre et al. (2014), PeerJ, DOI 10.7717/peerj.639 18/24annotation of disease names would be appropriate for a method that requires explicit
mentions of diseases, e.g., sentence level co-occurrence or information extraction
methods.
Potential bias stemming from the literature
As discussed by Raychaudhuri et al. (2009), any literature-based method is dependent
on the completeness of the literature and indeed the literature ultimately reflects only
those experiments that have been performed. Particularly for the SNP-gene co-mention
literature method that we propose, sparseness of mentions in the literature is a problem.
This is compounded by the fact that many mentions of genetic variants appear only in
the supplementary materials of publications (Jimeno Yepes & Verspoor, 2014a) and are
therefore difficult to extract using standard text mining strategies. For these reasons, the
co-mention strategy is not employed in our evaluation.
As an additional comment, due to the reliance in prior work on genomic distance
or eQTLs to establish SNP-gene associations, we would expect that the literature would
show bias favoring such associations. This is an additional reason to prefer the use
of gene-disease associations in this context rather than direct mentions of SNP-gene
associations. Utilising these indicative associations provides indirect evidence; as we have
seen this evidence appears to provide a broader context for establishing associations in a
disease context.
CONCLUSIONS
The functional interpretation of intergenic genetic variants poses a challenge to current
methods for studying the genetic basis of disease, despite their prevalence in the genomes
of individuals. Of particular difficulty are intergenic SNPs that do not appear to have a
relationship with the closest gene but instead impact more distant genes, either on the
same or even a different chromosome. Such variants cannot be adequately handled by the
standard approach of a genomic distance-based ranking. In this work we have explored
several strategies for ranking genes as associated to a given SNP; one based on published
spatial relationships, another based on general gene-disease relationships mined from the
published literature, and proposed a novel third method, in which the two are combined.
The focus of our method on ranking genes with respect to genetic variants in intergenic
regions is novel with respect to prior work.
We found in a validation study that this hybrid method outperformed a genomic
distance baseline in 70% of our test cases, identifying a stronger association between
a given SNP and the gene identified in an eQTL study as related to that SNP. This was
observed despite an overall bias towards nearby genes in the reference data set. We also
considered a direct literature co-occurrence strategy for relating an SNP to a gene, finding
that its sparsity made it inappropriate for ranking but that with some refinement it may
prove helpful for hypothesis validation. A more exploratory analysis specifically of putative
interchromosomal relationships indicates that the hybrid method has substantial promise
to support hypothesis generation, identifying potential relationships of SNPs to genes that
should be prioritised for experimental validation.
Macintyre et al. (2014), PeerJ, DOI 10.7717/peerj.639 19/24Our validation study is small, due to limited availability of appropriate test data, and
our discovery experiment is merely suggestive. There remain many questions about the
potential relationship of the genes that our ranking methods identify as strongly associated
to the SNPs we have studied, for which no eQTL data is available. These may very well be
important new SNP-gene relationships worthy of targeted study.
We have observed the potential of our proposed methods specifically in assisting the
interpretation of SNPs interacting with genes on different chromosomes. These are cases
that are particularly difficult for any methods that assume proximity of SNPs to the genes
they impact to characterise. In future work, in addition to refining the methods with
respect to substantially more data and furthering our understanding of their performance,
and exploring alternative methods for the constituent parts of the hybrid method in
more depth, we plan to build on this observation to develop an architecture that enables
characterisation of the full spectrum of intergenic SNPs, by determining criteria that will
allow automatic selection of the appropriate ranking method in particular circumstances.
That is, rather than insisting that there is a one-method-fits-all-variants ranking solution,
we aim to handle more cases more effectively by acknowledging and modelling the full
complexity of the problem space.
ADDITIONAL INFORMATION AND DECLARATIONS
Funding
We have received funding from National ICT Australia (NICTA) and the University of
Melbourne, Australia. NICTA is funded by the Australian Government through the
Department of Communications and the Australian Research Council through the ICT
Centre of Excellence Program. NICTA is also funded and supported by the Australian
Capital Territory, the New South Wales, Queensland and Victorian Governments, the
Australian National University, the University of New South Wales, the University of
Melbourne, the University of Queensland, the University of Sydney, Griffith University,
Queensland University of Technology, Monash University and other university partners.
The funders had no role in study design, data collection and analysis, decision to publish,
or preparation of the manuscript.
Grant Disclosures
The following grant information was disclosed by the authors:
National ICT Australia (NICTA).
University of Melbourne, Australia.
Competing Interests
The authors declare there are no competing interests.
Author Contributions
• Geoff Macintyre and Antonio Jimeno Yepes conceived and designed the experiments,
performed the experiments, analyzed the data, contributed reagents/materials/analysis
tools, wrote the paper, prepared figures and/or tables, reviewed drafts of the paper.
Macintyre et al. (2014), PeerJ, DOI 10.7717/peerj.639 20/24You can also read