Toward Everyday Gaze Input: Accuracy and Precision of Eye Tracking and Implications for Design - Microsoft
←
→
Page content transcription
If your browser does not render page correctly, please read the page content below
Toward Everyday Gaze Input: Accuracy and Precision of
            Eye Tracking and Implications for Design
               Anna Maria Feit1,2      Shane Williams2        Arturo Toledo2,3     Ann Paradiso2
                      Harish Kulkarni2        Shaun Kane2,4       Meredith Ringel Morris2
                1 Aalto University 2 Microsoft Research 3 Toledo Design 4 University of Colorado

ABSTRACT                                                                                      easy-to-use and robust gaze-enabled applications. As when de-
For eye tracking to become a ubiquitous part of our everyday                                  signing applications for other input modalities, such as touch
interaction with computers, we first need to understand its                                   or mouse, they have to face basic questions such as:
limitations outside rigorously controlled labs, and develop                                   Which region of the screen is easiest to interact with? How
robust applications that can be used by a broad range of users                                accurate can we expect the user’s input to be? What is the
and in various environments. Toward this end, we collected                                    minimum usable size of an interactive element?
eye tracking data from 80 people in a calibration-style task,
                                                                                              Prior work has found that tracking quality deviates from the
using two different trackers in two lighting conditions. We
                                                                                              numbers obtained in manufacturers’ labs [5, 11, 30, 31] and
found that accuracy and precision can vary between users and
                                                                                              that tracking accuracy (the offset from the true gaze point) and
targets more than six-fold, and report on differences between
                                                                                              precision (the spread of the gaze points) vary widely across
lighting, trackers, and screen regions. We show how such
                                                                                              different tracking conditions and users. However, few efforts
data can be used to determine appropriate target sizes and
                                                                                              have been made to draw any formal conclusions that could
to optimize the parameters of commonly used filters. We
                                                                                              inform the design of gaze-enabled applications; if so, they
conclude with design recommendations and examples how
                                                                                              concentrate on specific applications or interaction techniques
our findings and methodology can inform the design of error-
                                                                                              (e.g. [18, 32]) Research studies typically try to keep variation
aware adaptive applications.
                                                                                              as small as possible by carefully controlling tracking condi-
ACM Classification Keywords                                                                   tions, user positioning, frequently recalibrating the eye tracker,
H.5.m. Information Interfaces and Presentation : Misc.                                        and excluding participants that do not track well. While this is
                                                                                              reasonable for research, it is not feasible in practice.
Author Keywords                                                                               To illustrate the extent of this problem in everyday use of gaze
Eye tracking; gaze filters; sensor noise; adaptive interfaces.                                input, we conducted an informal survey among five expert
                                                                                              users of gaze applications (people with ALS who rely on gaze-
INTRODUCTION                                                                                  based AAC for communication). We found that they have to
Eye tracking has become an easily available and relatively                                    recalibrate their eye tracker between three and ten times per
cheap modality to enhance interaction with a computer. Re-                                    day, even though devices are mounted to their wheelchairs and
mote (as opposed to head-mounted) video-based eye trackers                                    their movement in front of the screen is limited due to their
are available for under $200 [43, 45]. They are unobtrusive                                   motor disabilities. Despite this frequent recalibration, they
and can be mounted on a display or built into laptops [28]. As                                reported that they typically fail to interact with an application
a result, there is increasing interest in using information about                             several times per day as the application cannot account for
eye gaze not only as a research instrument, but to enhance                                    differences in tracking quality.
our everyday interaction with computers. Gaze-enabled ap-
plications and interaction techniques range from explicit gaze                                To establish eye gaze as part of our everyday interaction with
input, such as pointing [22, 49] or gaze gestures [8, 16, 33] to                              computers, we need to understand the characteristics and lim-
attentive applications that use gaze to make inferences about                                 itations of eye tracking in practice and derive standards for
the user’s intentions [13, 29, 38] and improve input with other                               the design of gaze-enabled applications that take into account
modalities [37].                                                                              that accuracy and precision can vary widely across different
                                                                                              tracking conditions. Toward this end, we collected calibration-
Surprisingly, little work has been done to understand the re-                                 style eye tracking data from 80 participants in a controlled but
quirements of such applications as they integrate into our                                    practical setup, using two different trackers in two lighting
everyday computer use. There is no common standard or                                         conditions. In contrast to many eye tracking studies, we did
framework for designers and developers to rely on to develop                                  not exclude any participant due to insufficient tracking qual-
                                                                                              ity and only calibrated once at the beginning. Our findings
Permission to make digital or hard copies of all or part of this work for personal or         offer several contributions for the design and development of
classroom use is granted without fee provided that copies are not made or distributed
for profit or commercial advantage and that copies bear this notice and the full citation     gaze-enabled applications:
on the first page. Copyrights for components of this work owned by others than ACM
must be honored. Abstracting with credit is permitted. To copy otherwise, or republish,       1. We report accuracy and precision ranges overall and for
to post on servers or to redistribute to lists, requires prior specific permission and/or a      different parts of the screen that characterize the large varia-
fee. Request permissions from Permissions@acm.org.
CHI 2017, May 06–11, 2017, Denver, CO, USA                                                       tion across different tracking conditions.
© 2017 ACM. ISBN 978-1-4503-4655-9/17/05âòe$15.00
DOI: http://dx.doi.org/10.1145/3025453.3025599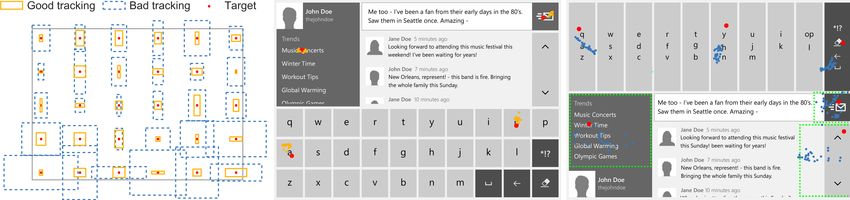
2. We provide a formal way to derive appropriate target                 Explicit or implicit inter-   Gaze event                Ref #’s
                                                                        action by eye gaze
   sizes from measures of accuracy and precision. Based on
                                                                        Gaze pointing                 Fixation or gaze point    [7, 22, 49]
   our data we give recommendations for the minimum size of             Gaze gestures                 Sequence of fixations     [8, 16, 23,
   gaze-aware regions to allow robust interaction.                                                                              33, 47]
3. We present an approach to find optimal parameters for any            Dwell-based selection         Fixation over min. time   [17, 24]
   filter that minimizes target size and signal delay. We com-      #
                                                                    G   Multimodal selection          Fixation or gaze point    [17, 20]
   pare five commonly used filtering techniques and provide         #
                                                                    G   Selection by following        Smooth pursuit            [35]
   optimized parameters.                                                a moving object
                                                                        Drag and drop                 Fixation or gaze point    [17, 20]
4. We show our vision of error-aware adaptive applications              Rotary control and sliders    Smooth pursuit            [40]
   and show how our results and methodology can be utilized         #
                                                                    G   Switching windows             Gaze point                [10]
   in the design and operating principle of such applications.      #
                                                                    G   Image annotation              Fixation                  [10]
                                                                    #   Reading                       Fixation or gaze point    [42]
Our methods can be re-applied to future hardware versions or
                                                                    #   Focus of attention            Fixation or gaze point,   [9, 15, 27,
in other contexts to derive updated measurements as technol-                                          saccade                   29, 37]
ogy and use scenarios evolve.                                      Table 1. An overview of interactions performed in gaze-enabled applica-
                                                                   tions. Circles mark the degree of explicit control from full control ( )
                                                                   to no conscious control (#). Most interactions rely on the detection of
BACKGROUND AND RELATED WORK                                        fixations and saccades, while a few utilize smooth pursuit of a target.
There are various technologies that can be used to capture
eye gaze (see e.g. [11] for an overview). We focus on remote       using smooth pursuit. This work concentrates on applications
video-based eye tracking, in which an eye-tracking camera is       that use saccades and fixations for computer interaction.
attached to or integrated in a device’s screen.
                                                                   Accuracy and Precision of Gaze Tracking
                                                                   The (spatial) quality of the tracked gaze can be measured in
Computer Interaction by Eye Gaze                                   terms of precision and accuracy. Accuracy denotes the off-
Eye trackers deliver information about where on the screen the     set between the true gaze position and the recorded position,
user is looking. Applications can use this data for explicit eye   whereas precision measures the dispersion of recorded gaze
input that requires conscious control by the user, or can use      points during a fixation (i.e. , the gaze points’ standard devia-
it as an implicit source of information, often in combination      tion). We measure accuracy and precision separately in the x-
with other input modalities (attentive user interfaces) [26].      and y-directions. Accuracy is often reported by manufacturers
In the following, we use the term gaze-enabled to refer to         to be < 0.5°. However, in particular for remote eye trackers,
any application that reacts to the changing gaze of the user.      offset from the true gaze point is often found to be larger than
In this paper, we concentrate on estimation of gaze points         1° [5, 30], even in controlled environments.
by remote, video-based eye trackers. They capture the gaze
location of the user in screen coordinates at regular intervals,   Factors that influence tracking quality
depending on the recording frequency (commonly 30–60 Hz).          The tracking method considered in this paper relies on pupil
Optionally, the system can apply filters to smooth the signal,     and corneal reflection tracking, the most common method
and algorithms to detect events. The application then processes    for estimating the gaze location [11]. The image in Figure 1
the signal and responds accordinglyNote that each processing       shows a user’s eyes and the location of the pupil and corneal
step must happen in real-time and cannot rely on information       reflection, as estimated by the SMI REDn scientific. The
from future gaze points without delaying the application.          heavy mascara, thick frames of glasses, and reflections shown
                                                                   in the image could potentially impair the quality of the cap-
The most important gaze events for interactive applications        tured gaze. In general, tracking quality is influenced by the
are fixations and saccades. A fixation denotes a period of         interplay of various factors related to properties of the user’s
time (from less than 100 ms up to several seconds [11, 25])        eye, the tracking environment, the tracking method, as well
for which the gaze location is static within a small region. A     as the calibration procedure (e.g. [11, 30]). Such properties
saccade is the rapid and ballistic movement between fixations;     include glasses or contact lenses, varying eye physiologies,
they take about 30–80 ms [11] and can be 2° or larger [26].        different levels of sunlight, properties of artificial lighting, and
While there are other gaze events — including smooth pursuit,      the resolution and focus of the camera, among others. In the
microsaccades or glissades [11] — fixations and saccades are       resulting signal, four different types of noise have been recog-
essential to describe how the attention of the user changes        nized: system inherent, physiological, optic artifacts, and data
and can be recognized most reliably [11]. Table 1 overviews        loss [11]. Artifacts and data loss impact the interaction, but
interactions performed in various gaze-enabled applications,       can be detected and removed from the data stream (at the cost
ranging from explicit eye input to attentive user interfaces,      of signal delay), whereas the detection of physiological and
with several in-between these two ends of the continuum (this      system generated noise relies on filtering by the system.
list is not exhaustive, but represents exemplars of common
interaction styles). The second column shows the gaze events       Algorithmic approaches to robust interaction
on which the interaction relies. Independent of the conscious      Various algorithmic methods have been proposed to filter or
level of control, the applications mainly use the same gaze        correct the estimated gaze point (see [11] for a review), but
events to extract information about the user’s intention: single   many rely on post-hoc processing that introduces high latency,
gaze points, fixations, and saccades, with a few exceptions        making them unsuitable for real-time interaction. We extend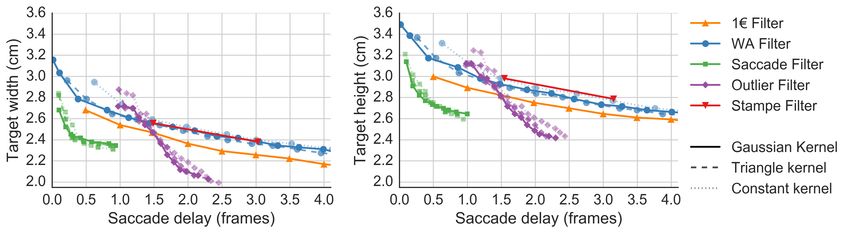
Age        18–24     25–34       35–44     45–54    55–64
                                                                                        12        45          14        8        1
                                                                             Eye color  Blue      Green       Hazel     Dark brown
                                                                                        11        9           10        50
                                                                             Ethnicity  Asian or Black or Hispanic      White    Other or
                                                                                        Pac. Isl. Afr. Am.                       Mixed
                                                                                        23        7           9         34       7
                                                                             Experience Never used eye tracking         Has used eye tracking
                                                                                        52                              28
                                                                                   Table 2. Study participants’ demographic information
Figure 1. Image of the study setup. Left: in a room with no windows
illuminated by artificial light. Right: in a room with large windows fac-   Participants: 81 participants took part in the experiment (62
ing the tracker, recorded on a cloudy day. Inset: design of targets and     male, 19 female). When advertising the study, we explicitly
go/no-go symbols and their distribution over the screen.                    encouraged people to take part even if they wore glasses or
prior work [39] by evaluating several real-time filtering tech-             contact lenses, or had experienced problems using eye tracking
niques for interactive applications based on our collected data,            before. Table 2 shows demographic information. The calibra-
and propose an approach to choose optimal parameters. Re-                   tion process failed for only one participant (male) for whom
cent efforts model and predict the error when estimating the                no data could be collected, and which is excluded in Table 2.
gaze position on head-worn eye tracking glasses [2, 3]. Such                Participants were compensated with a $5 lunch coupon.
models are the first step towards adaptive and personalized                 Eye trackers: We collected gaze data with 2 different eye
user interfaces for gaze interaction that adapt to the quality of           trackers: Tobii EyeX [45] and SMI REDn scientific [14], both
the tracked gaze. However, at this stage, they are complex to               at 60 Hz. The first is an affordable tracker developed for
train and implement, and it is unclear how they perform under               consumer use, the second is sold for scientific purposes and
less controlled conditions. Our focus is on remote eye tracking             is more expensive. The trackers have a similar form factor
rather than head-mounted systems.                                           and can be attached to the bottom of screens up to 27”. They
                                                                            operate at a similar tracking range, not restricting the user
Design approaches to robust interaction                                     in their natural movement. SMI reports an accuracy of 0.4°
Several interaction methods and design approaches have been                 and a spatial resolution (root mean square) of 0.05. No such
proposed to deal with poor accuracy and precision. One obvi-                values are available for the Tobii EyeX [44]. Participants were
ous approach is to enlarge targets. However, this is not always             assigned randomly to use one of the eye trackers.
feasible as the overall size of the interface is limited. Space-            Tracking Environment: We collected data in two different
efficient techniques, such as hierarchical menus, can facilitate            lighting environments, shown in Figure 1. The artificial envi-
interaction with large targets, but slow down performance, as               ronment was a room with no windows; light was from halogen
they require more steps for selection. Dynamic approaches,                  MR16 spot lights and two fluorescent 40-watt Biax lamps in
such as zooming or fisheye lenses [1, 4, 9] can make selec-                 2×2 fixtures. The daylight environment was a room with large
tion more robust, but may visually distract the user. Gaze                  windows facing the tracker; additional lighting came from
gestures [8, 16, 33, 47] have been found to be more robust                  the same fluorescent lights used in the artificial setup. Data
against noise in comparison to target-based selections, but                 was collected on a cloudy day. While both conditions do not
may require unnaturally large saccades to overcome tracking                 provide the optimal lighting recommended for an eye tracking
problems and may be hard to learn. Smooth pursuit [35, 40,                  lab [11], they allow us to capture the noise induced by exter-
46] shows promise as a robust selection technique, but requires             nal lighting that may be encountered in practice in end users’
a moving stimulus that the eye can follow which is often not                homes, offices, etc. Participants were assigned randomly to
suitable for many traditional user interfaces. Requiring longer             one environment.
dwell times in dwell-based gaze selection is another approach
to avoiding accidental target selection, though this slows down             Setup: The equipment setup was the same in both environ-
interaction times; expert users may be able to reliably select              ments. We used a Microsoft Surface Pro 3 with an Intel Core
targets with dwell times near 300 ms, but only if target sizes              i5-4300U 1.9 GHz and 4 GB memory. The application was
are appropriate for the tracking quality [24]. Our findings can             shown on the 12” screen at a resolution of 1440×960 pixel
inform the design of many of the applications shown in Table 1              (144 DPI). Both trackers were magnetically affixed to a hori-
to optimally adapt to the tracking quality at a given time.                 zontal bar at the bottom of the Surface’s docking station with
                                                                            the material provided by the manufacturers. We placed the
                                                                            display on a table at the same height in both environments. To
DATA COLLECTION                                                             compensate for different participant heights, we tilted the dock-
We collected gaze data across a broad range of people, using                ing station towards the user to adapt the gaze angle between
two different eye trackers in two environments with differ-                 the user’s eyes and the eye tracker, until the manufacturer’s
ent lighting. We controlled important factors to be the same                calibration software showed a good tracking position. Partici-
throughout the study, such as position of the user relative to              pants were positioned at 65 cm from the screen. They were
the tracker, but kept the setup as natural as possible to capture           told to try to stay still, but that they could move their head
how much accuracy and precision of eye tracking can vary in                 naturally. With this setup, a visual angle of 1° corresponds to
tracking conditions similar to those in practice.                           a movement of ca. 1.1 cm on the screen.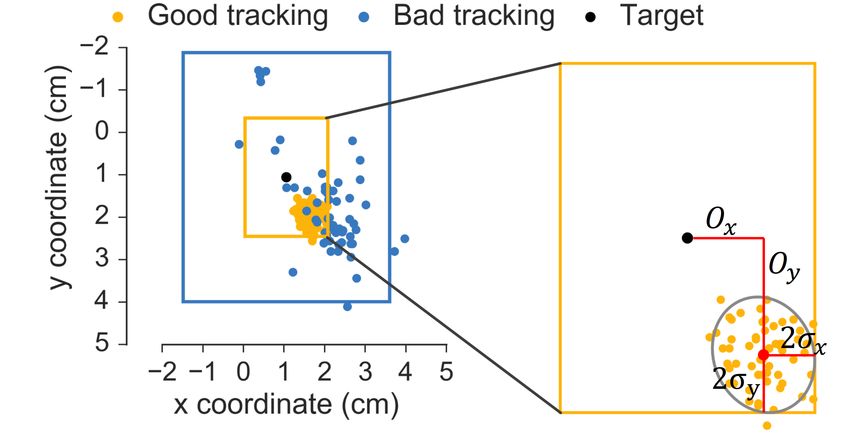
Figure 2. Left: box plot of the accuracy (offset) and precision (standard deviation) over all target fixations. Center and right: different percentiles,
averaged over all targets, show that accuracy and precision vary largely in practical tracking conditions.

Task and Procedure: The participants’ task was to look at                      ANALYSIS AND RESULTS
targets randomly presented on the screen for about two sec-                    The analyzed dataset consists of 2,343 fixations from 80 users
onds each. If the target turned into a checkmark, they were                    looking at 30 targets (2.4% of fixations were excluded, as de-
instructed to press the spacebar as quickly as possible; if it                 scribed above). By “target fixation” we simply denote the data
turned into a cross, they should wait for the next target. This                recorded while a user was looking at a target. No algorithmic
go/no-go task was used to keep the participants’ attention on                  method was involved to extract fixation events. In the follow-
the target [12]. Thirty targets were shown in random order,                    ing analysis, we first compute aggregate measures for each
distributed over the screen as shown in Figure 1, with a ver-                  target. Where not denoted differently, we then average across
tical distance of 214 pixel (3.32°, 3.77 cm), and a horizontal                 the 30 targets for each user to account for the fact that fixations
distance of 267 pixel (4.14°, 4.71 cm) between neighboring                     by the same participant are not independent observations.
targets. Each target’s (invisible) activation area was a circular
region of 500 pixel diameter (8.8 cm, 7.7°). When the partici-                 Data Loss and Distribution of Gaze Points
pant’s gaze was inside the target for 500 ms, it was activated                 Data loss occurs when the eye tracker cannot estimate the gaze
and its color turned cyan. After 1250 ms the go/no-go task                     position. On average, each target fixation consists of 55.6 gaze
started. If a target could not be activated after 5 s (because the             points recorded over 1 s (ca. 60 frames). The average data loss
tracked gaze was too noisy), the next target appeared. Figure 1                is 7.9% of frames. A two-way ANOVA shows significantly
shows the targets and the go/no-go icons. Before the task                      higher loss for the Tobii tracker than for the SMI: gaze position
started, we calibrated the eye trackers with a 7-point calibra-                could not be estimated for 13.1% versus 2.8% of points per
tion method provided by the manufacturers. The study started                   target (F(1,79) = 18, p < 0.01). No such difference was found
with a demographic questionnaire. After that, the instructions                 for the tracking environments (8.1% in artificial versus 7.8%
for the go/no-go task were displayed, and then the task began.                 in daylight) and there was no interaction effect. For 1,450
Data Collection and Preprocessing: All gaze points were                        fixations (62%) no data was lost. For the remaining 38%,
recorded as an (x,y) position in screen coordinates, as given                  tracking was lost on average 11 times during the 1 s fixation,
by the API of the respective tracker, with filtering turned off.               for an average of 1.5 frames.
For each target, we extracted the gaze points of a 1 s window                  We performed normality tests on the gaze points of each target
(60 frames) during which the participant looked at the target.                 fixation, separately in the x- and y-directions (D’Agostino and
We did not use a fixation detection algorithm, which cannot                    Pearson’s test as implemented by Python’s SciPy package [7,
reliably distinguish between saccades and noise artifacts, but                 20] with a significance level of p < .01). They showed that on
extracted the data in one of two ways: (1) Online: A target                    average gaze points are normally distributed in the x-direction
was activated if the gaze of the user stayed within a 250 pixel                for 71% of the fixations, and in the y-direction for 74%.
radius from the target for 500 ms. Gaze points were extracted
for the next 1000 ms and saved if the gaze was still within that               Precision and Accuracy
region after that time; otherwise, the activation was reset. The               For all gaze points during a target fixation we compute accu-
go/no-go task was only shown if we could extract the gaze                      racy and precision separately in the x- and y-direction. Accu-
points. (2) Offline: If a target could not be activated for 5 s,               racy denotes the absolute offset between the fixated target and
the next one was shown. From the recorded data we extracted                    the mean of the estimated gaze points. Precision is computed
1 s during which we could be sure that the participant looked                  as the standard deviation (SD) of the gaze points.
at the target. Therefore, we chose a 1 s window for which
on average the gaze points were closest to the target. This                    Table 3 shows an overview of the results. Values are averaged
post-processing had to be done for 11% of the fixations                        across users and given for different conditions. We also show
                                                                               average accuracy and precision values for different percentiles
For each fixation, we then excluded the gaze points where no                   of users fixating each target, e.g. only the best 25%. Stan-
eyes could be tracked (reported as such by the eye tracker). If                dard deviations are given in brackets. We used multivariate
this was more than 2/3 of the gaze points, we excluded this                    ANOVA to test for significant differences in accuracy and
fixation from the analysis.                                                    precision between the tracker and light conditions. We report
Accuracy (cm) Precision (cm)
X Y X Y
Overall 0.47 (0.64) 0.57 (0.52) 0.52 (0.73) 0.5 (0.56)
Percentile
25% 0.15 0.2 0.19 0.22
50% 0.31 0.45 0.32 0.32
75% 0.58 0.78 0.57 0.58
90% 0.93 1.19 1.1 1.04
Tracker
SMI REDn 0.58 (0.75) 0.66 (0.57) 0.51 (0.91) 0.51 (0.64)
Tobii EyeX 0.36 (0.5) 0.48 (0.45) 0.53 (0.44) 0.48 (0.44)
Light
Artificial 0.51 (0.75) 0.65 (0.6) 0.6 (0.87) 0.56 (0.68)
Daylight 0.42 (0.51) 0.5 (0.42) 0.44(0.56) 0.44 (0.4)
Table 3. Average accuracy and precision across all users, across different
Figure 3. Precision of the estimated gaze points over the different targets. percentiles of each target, and for different tracker and light conditions
Covariance ellipses show the contour of the 2D Gaussian, fitted to the (lower values are better). Standard deviations are given in brackets. An
gaze points corresponding to all fixations of the same target. extended table with degrees is provided in the supplementary material.
values in cm, which is independent of screen resolution. For Comparison between screen regions
space reasons, we do not report the values in degrees of visual The precision of the estimated gaze for each target is worse to-
angle, but refer to the supplementary material for an extended ward the right and bottom edge of the screen, as shown in Fig-
version of the table. Our results should not be seen as absolute ure 3. The ellipses represent the covariance matrix computed
properties of the tested eye trackers or tracking environments, over all gaze points from all 80 users. Multivariate ANOVA
but show how much we can expect accuracy and precision to and follow-up univariate analysis with TukeyHSD tests found
vary as eye tracking is used in everyday computer interaction. that the precision of the bottom row was significantly worse
compared to all other rows at the p < .05 (adjusted) signifi-
Variation over all conditions cance level in both x- and y-direction. In contrast, there was
Figure 2 shows how much accuracy and precision can vary no significant difference for accuracy between any of the rows.
over all collected data. Table 3 gives the corresponding results.
A paired samples t-test showed that on average, accuracy is Significant differences between columns were only found for
worse in the y-direction by about 0.1 cm (t(1, 79) = 2.8,p < precision in the x- direction. Precision was significantly worse
.01). The middle and right plot in Figure 3 visualize how for the right-most (6th) column in comparison to all other
accuracy and precision increase over different percentiles. No columns at the p < .01 (adjusted) significance level. In the
significant difference between the x- and the y-direction was supplementary material we provide exact accuracy and preci-
found for precision (t(1, 79) = 1.0.3, p = 0.3). sion values for rows and columns.
Comparison over time
The middle and right plots in Figure 2 visualize how accuracy
and precision become worse for different percentiles of users. The tracking quality did not significantly change for the same
The results given in Table 3 are average values over the cor- participant during the experiment. MANOVA found no differ-
responding percentiles of each target. Very accurate fixations ence for either accuracy or precision between the first and last
(25th percentile) are only 0.15 cm in the x- and 0.2 cm in the target fixation of each user (F(1, 158) = 0.9, p = 0.46).
y-direction offset from the target. On the other hand, inaccu- FROM ACCURACY AND PRECISION TO TARGET SIZE
rate fixations (90th percentile) can be as far offset as 0.93 cm
Once we know the tracking accuracy and precision, we can
in the x- and 1.19 cm in the y-direction, a more than six-fold
derive appropriate target sizes. A target denotes any region in
difference. Similar for the spread of the gaze points.
a user interface that should recognize if the user’s gaze falls
inside its borders in order to trigger a functionality. This can
Comparison between tracking conditions
be an explicitly controlled button, the words and lines in an
Two-way MANOVA found a significant difference between
attentive reading application, the active recognition region for
the eye trackers used in the study (F(1, 79) = 7.7, p < .01).
gaze gestures, or the area of interest in a research experiment.
Follow-up univariate testing showed that the Tobii EyeX
tracker was more accurate than the SMI REDn scientific in When a user fixates the center of a target, we assume that the
both the x-direction (F(1, 79) = 9.4, p < .01) and y-direction captured gaze points are normally distributed in the x and y
(F(1, 79) = 10.6, p < .01), whereas no significant difference directions around a mean with offset Ox/y (accuracy) from
was found for precision. This stands in contrast to our previous the target center and a standard deviation σx/y (precision). For
finding that the Tobii EyeX has significantly more data loss robust and smooth interaction, we suggest that at least 95% of
than the SMI REDn, in which case it cannot track the gaze po- gaze points should fall inside the target regions; this means we
sition at all. As shown in Table 3, tracking in the daylight con- can derive the target width and height as:
dition was consistently better by about 0.1-0.15cm. However,
Sw/h = 2 (Ox/y + 2 σx/y ) (1)
this difference was not found to be significant(F(1, 79) = 1.7,
p = 0.16) by the two-way MANOVA. Also there was no sig- We multiply σx/y by 2, as about 95% of values lie within two
nificant interaction effect. standard deviations of the mean for normally distributed data.Filter Parameter Ranges
Weighted Average (WA) [19, 48] Window size N 2–40 frames
WA + saccade detection [39] Saccade threshold s 1–4 cm (à .05)
Max. window size N 2–40 frames
WA + saccade detection Saccade threshold s 1–4 cm (à .05)
+ 1-sample outlier correction Max. window size N 2–40 frames
1e filter [6] Adaption rate β Cut- 0–1.5 (à .01)
off frequency fcmin 0.4–6.5 (à .1)
Stampe filter [41] – –
Table 4. Filtering techniques for which we optimize parameters and that
we evaluate based on our collected data. Ranges denotes the parameter
ranges considered in the grid search.
Figure 4. Given the accuracy and precision, target size is computed
based such that 95% of gaze points fall inside the target. The plot shows there are two main states that need to be recognized: fixations
example target sizes based on two different fixations of the same target, and saccades. Eye tremor, microsaccades, and noise should be
one with good and one with bad tracking quality.
filtered in order to stabilize the signal and improve precision.
An error rate of more than 5% (every 20th point) slows down The quick and sudden change between those states must be ac-
performance and leads to errors that are often hard to recover counted for by the filter. This makes commonly used methods,
from.However, if an interaction technique can be used reliably such as moving average, Kalman filter, and Savytzki-Golay,
with a smaller percentage of points, Equation 1 can be easily filter less useful [6, 39]. Based on prior work [39] and our
modified by replacing the multiplier with the corresponding own experience, we tested five different types of filters. They
value from the standard normal table. are summarized in Table 4 and described in the following.
Figure 4 visualizes the computation of the target size based The Stampe filter [41] is commonly used to remove outliers
on the offset and SD of the raw gaze points and shows two from the tracked gaze signal. It uses a two-step procedure that
example targets based on the gaze points of two fixations with detects one- and two-frame deviations from a continuously
good and bad tracking quality. Although Equation 1 is a sim- increasing or decreasing signal and corrects them according to
plification and not a statistical assessment of the distribution of the surrounding points. This introduces a delay of up to two
the gaze points, it can be used to quickly compute appropriate frames. No parameters are necessary.
target sizes based on precision and accuracy values. When we Weighted average (WA) [19, 48] or finite impulse response
check this formula based on our collected data, we get that for filter (FIR) computes the filtered point X̂t at time t as the
each target fixation on average 94.9% of gaze points fall inside weighted average over the last N points:
a target of width and height as computed by Equation 1. Ta- N
wi
ble 5 shows the resulting average target sizes computed based X̂t = ∑ · Xt−i (2)
over all target fixations, and over different percentiles of users i=0 ∑ j w j
for each target. Sizes can vary from 0.94×1.24 cm for users where Xt−i is the point observed at time t − i , and wi is the
that track well, up to 5.96×6.24 cm if we want to allow robust corresponding (normalized) weight. The only parameter for
interaction for nearly all users in our dataset. These target a WA filter is the window size N. The function defining the
sizes are based on unfiltered data; next, we discuss filtering weight for each point in the averaging window, is called the
techniques and derive similar values based on filtered data. kernel function. We test three different kernel functions:
1. A Linear kernel corresponds to a simple average of the last
PARAMETER OPTIMIZATION FOR FILTERS
N points, wi = 1.
Filters can significantly improve the precision of the tracked
gaze by removing noise artifacts and reducing signal disper- 2. A triangular kernel [21, 48] assigns a weight of 1 to the
sion. Several filters have been proposed for real-time systems; least recent point (N), 2 to the next point (N − 1), and so on,
however, developers implementing these filters must choose wi = N − i + 1.
parameters that control their performance. This is often done 3. A Gaussian kernel function [19] assigns weights according
suboptimally based on prior experience or heuristics. We to a Gaussian function, where the variance is chosen such
describe an easy-to-implement procedure to optimize the pa- that no point in the averaging window is assigned a weight
(i−1)2
rameters of any filter for minimum target size and minimum −
smaller than 0.05 [39], wi = e 2σ 2
delay, based on calibration-style data as collected in our study.
We then compare five different types of filters with three dif- Saccade detection can be used to extend the WA filter [36].
ferent kernel functions, and evaluate their effect on precision Similar to the identification by dispersion threshold algo-
and accuracy in comparison to the unfiltered data. rithm [34], commonly used for fixation detection in offline
processing [11], it defines a threshold s that is used to detect
Filters for Interactive Gaze Applications saccades. As long as the distance between successive gaze
In interactive gaze-enabled applications, no post-processing of points is smaller than s, they are assumed to belong to the
the data is possible, and any filtering must be done in real-time. same fixation. The filtered gaze point is computed as the
This limits the ability to detect outliers and artifacts, which weighted average over the last N points of the same fixation.
introduce a delay of several frames. For most applications If the distance exceeds the threshold, a saccade is detected andFigure 5. Pareto front of optimal parameter settings for each tested filter. Filters are evaluated based on the resulting target size and average delay in
detecting a saccade. Corresponding parameters are given in the supplementary material. Depending on the application, appropriate parameters can
be chosen that yield the desired trade-off between target size and signal delay.
no filter is applied. The new gaze point is the first of a new 1. Target size: For each target fixation in the data set, apply
fixation. We test the same kernel functions as described above. the filter, compute the accuracy and precision of the filtered
In addition to the window size N, the filter requires to set the gaze, and derive the corresponding target size according to
saccade threshold s. Equation 1. Compute the target size S75% over all fixations
as the 75th percentile of all target sizes. This represents a
Outlier correction further extends the WA filter [21]. It de-
target size that allows for robust interaction, where for 75%
tects and removes single outliers that would be detected as
of fixations at least 95% of gaze points fall inside the target.
two successive saccades by the previous filter. If the distance
between successive gaze points exceeds the saccade threshold 2. Saccade simulation: Simulate saccades between two
s, the new gaze point is saved as the start of a potential new fix- neighboring targets of size S75% . For each target fixation,
ation. The algorithm waits for the next observation to confirm simulate a second fixation by shifting each gaze point by
S75% cm and append it to the original fixation. The result-
the detection of a saccade. If the next gaze point is closer to
ing signal simulates a fixation-saccade-fixation sequence.
the previous fixation, the potential fixation is discarded as an
Create a second sequence by shifting the original points by
outlier. Otherwise, a new fixation is started. This introduces
−S75% cm in the negative direction.
a one-frame delay. Points belonging to the same fixation are
filtered by a WA filter, as before. The parameters are the size 3. Saccade delay: Apply the filter to the constructed se-
N of the averaging window and the saccade threshold s. quences. For each filtered sequence, compute saccade delay
as number of frames from the start of the second fixation
The 1e filter [6] has been proposed for filtering the signal until the signal first exceeds the lower target bound of the
obtained from human motion tracking. It uses a low-pass filter second target. Adjust the delay by any delay the unfiltered
but adapts the cut-off frequency depending on the movement signal may have due to signal noise.
speed. At low speeds, the signal is heavily smoothed, at the
cost of responsiveness to signal changes. As speed increases, In this way, for each potential set of parameters, we compute
the cut-off frequency is increased, thus the filter is less ef- the target size necessary for robust interaction and the average
fective but more responsive to the fast changes in the signal. signal delay the filter would lead to when used in a gaze-
This principle makes the 1e filter potentially well-suited for enabled application. In order to decide on the best parameters,
eye tracking, where static fixations alternate with very fast we have to trade off these two opposing criteria. Therefore,
saccades. To our knowledge it has not been applied to eye we identify the Pareto optimal solutions by discretizing the
tracking data before. It has two parameters to control smooth- delay, and then for each delay, determining the parameters that
ness and responsiveness of the filter: the cut-off frequency yield the minimum target size without exceeding this delay.
fcmin and the adaption rate β . Figure 5 shows the resulting Pareto fronts for applying each
filter in the x- and y-direction. Each point denotes a parame-
ter setting that yields the minimum target size for the corre-
Parameter Optimization
sponding delay. The Weighted Average filter can be seen as a
Most of these filters require the choice of one or more pa- baseline. Its only parameter, the size of the averaging window,
rameters, which determine the effectiveness of the filter. We determines the trade-off between small target size and short
propose an approach to optimize parameters based on data delays. The Gaussian and Triangle kernel perform slightly
collected through a calibration-style study such as the one better than the Constant kernel. They give a higher weight
described earlier in this paper. In a grid search, we instantiate to more recent points, thus allowing for a larger averaging
a filter with each possible parameter, apply it to the data, and window at the same signal delay than the Constant kernel. In
evaluate its effect on two criteria: the resulting target size and practice the Stampe filter yields a larger delay than expected
the delay in following a saccade. For each possible parameter, from its construction. The two points in the plot represent the
the following steps are performed separately in the x- and first and second step during which one- and two-frame outliers
y-direction:Target width (cm) Target height (cm)
Raw Filt. Diff Raw Filt. Diff
Overall 3.0 2.02 33% 3.14 2.19 30%
Percentile
25% 0.94 0.58 38 % 1.24 0.8 35%
50% 1.8 1.12 38 % 2.26 1.48 35%
75% 3.28 1.9 42 % 3.78 2.35 38%
90% 5.96 3.9 35 % 6.24 4.24 32%
Table 5. Recommended target sizes for robust and smooth interaction
by eye gaze, and a comparison between sizes computed based on raw
data and filtered data. Percentiles show how much target sizes varies for
different levels of tracking quality.
are corrected, in theory yielding one- and two-frame delays.
However, depending on the noise structure, the Stampe filter
may detect saccades as outliers, thus yielding a larger delay.
In practice, this leads to similar or worse performance than Figure 6. Appropriate target sizes for different screen positions, com-
the weighted average filter. The 1e filter performs better than puted based on the raw and the filtered data.
the WA filter, due to the dynamic adjustment of the cut-off
frequency. However, in practice this adjustment is not enough are computed based on the corresponding percentile for each
for the filter to react to the sudden and large signal jumps target and averaged over all targets. The optimized Outlier
corresponding to a saccade. Moreover, the cut-off frequency filter reduces the target size by up to 42%. However, the filter
is also adjusted to noise artifacts that show similar dynamics can only improve the precision of the data, not its accuracy.
as saccades. The Saccade filter performs best for a delay up
to one frame (16 ms with a 60 Hz tracker). While in theory,
it does not introduce any delay, in practice a saccade may not IMPLICATIONS FOR GAZE-ENABLED APPLICATIONS
be detected, in which case a strong averaging filter is applied. We can use our findings to derive implications for the design
On the other hand, choosing a small saccade threshold ensures of gaze-enabled applications that are used by a broad range of
minimal delay, but increases the number of outliers wrongly users under varying tracking conditions. Such implications are
detected as saccades, thus yielding a larger target size. A simi- useful for designers and developers, but also for researchers
lar trade-off applies to the Outlier filter. The construction of who want to minimize the risk of having to exclude users from
the filter introduces a minimum delay of one frame. However, their study or who want to conduct studies in more natural
stronger filtering is achieved if we increase the saccade thresh- environments.
old and thus take into account larger delays if a saccade is not Target size and distances: Gaze-enabled regions should
recognized, on average up to about 2.5 frames. be designed slightly larger in height than in width, since
The supplementary material contains corresponding parameter we observed consistently larger standard deviations in the
settings for each filter. Developers can use these results to y-direction. According to our data, target sizes of at least
choose the best filter settings appropriate for their application. 1.9×2.35 cm allow for reliable interaction for at least 75% of
If a different setup is used or as technology develops, the users if optimal filtering is used. If no filter is implemented,
presented approach and metrics can be used to derive optimal this should be enlarged to 3.28×3.78 cm. Targets of this size
parameters for any given filter based on data obtained from can be placed directly next to each other. Note that the size
simple target fixations. only denotes the region that is reactive to the eye gaze; this
can be invisible to the user and the corresponding UI elements
can be smaller, in which case the distance between graphical
Effect on Accuracy and Precision
elements must then take into account the larger tracking area.
Based on our comparison, we choose to filter our data with the
Outlier filter with a Gaussian kernel, which extends weighted Screen regions: Avoid placing gaze-enabled elements to-
averaging with saccade detection and outlier correction. Ac- wards the bottom or right edge of the screen, for which accu-
cording to our optimization, we choose a saccade threshold of racy and precision was found to be significantly worse.
1.45 cm in x- and 1.65 cm in the y-direction, and a window
size of 36 and 40 frames respectively. In practice, this would Filtering: Use a weighted average filter with a Gaussian or
Triangular kernel and saccade detection. If the application can
yield a delay of about two frames (32 ms with a 60 Hz tracker).
account for a two-sample delay, additional outlier correction
Figure 6 shows the resulting average target sizes based on the (Kumar et al. 2008) can improve precision further and reduce
filtered and unfiltered data of each target fixation. Table 5 recognition of false saccades. In this work, we obtained best
compares the average sizes based on the raw and filtered data. results with the following parameters: window size of 36/40
The first row shows the average overall data. Precision has frames, saccade threshold of 1.45 cm/1.65 cm in x-/y-direction.
improved from 0.53 cm to 0.29 cm in the x-direction and from The latter one could be further adapted to the specific appli-
0.51 to 0.27 cm in the y-direction, while accuracy has approx- cations, for example when targets are far apart and expected
imately stayed the same. The other rows show the variation saccades thus larger. Therefore, the supplementary material
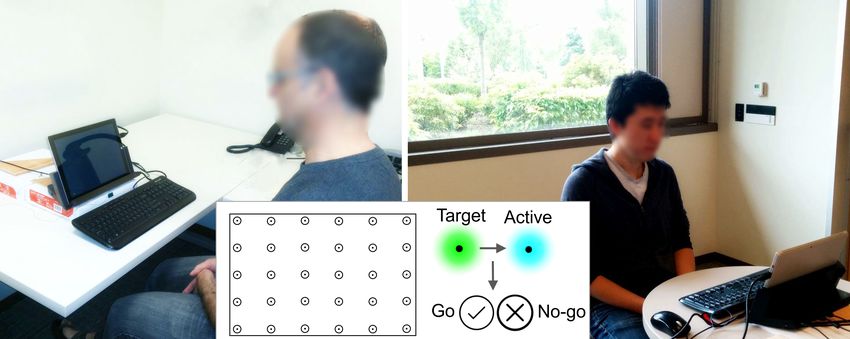
of target size for different percentiles of target fixations. They provides optimized parameters.Figure 7. Example case that shows how the design of a gaze-controlled social network application can be adapted to the changing tracking quality. Left:
Target sizes for good and bad tracking, based on data from two users. Middle: UI for good tracking quality. Right: UI adapted to bad tracking. The
keyboard has moved up where tracking is best and letters are grouped to account for vertical offset and spread of gaze points. Green lines show that
the active gaze region of the buttons is actually larger than the graphical UI element, accounting for bad tracking near the bottom of the screen.
Error-Aware and Adaptive Applications entry may then be disambiguated algorithmically using text
Our findings open up a new set of questions, setting the stage prediction, or combined with a secondary input action to select
for research in future areas such as adaptive UIs. We share the individual characters). The links under "Trends" are merged
vision of other researchers (e.g. [2, 3, 36]) that applications into one gaze target, while keeping them visually as before; if
should be aware of uncertainty in the input signal and adapt activated, an alternative pointing technique like zooming [4,
their interface and functionality accordingly. However, eye 10] or fish-eye lenses [1] could be applied. Similarly, the scroll
tracking poses a challenge in that the error of the estimated buttons are kept as before, but their active gaze region expands
gaze point varies substantially depending on the interplay of beyond the screen and toward the static message window.
many factors and thus is hard to predict and correct. Therefore,
4. Optimize when to adapt the UI, by monitoring changes in
we envision applications consisting of flexible modules that
tracking and predicting the potential gain. In order for adaptive
adapt their graphical representation and functionality to varia-
interfaces to be usable, the system needs to take into account
tions in accuracy and precision of the tracked gaze. The results
the cost for the user to adapt to the new UI. To determine the
and methods presented in this paper are an important step to-
best changes the system trades off criteria such as interaction
wards the the design of such adaptive modules. To exemplify
cost, learning time, or user preference in interaction with
this, we sketch an example application in Figure 7. We show
the user. Toward this end, future work is needed to develop
how the user interface of a social network application can be
appropriate user models and optimization methods.
adapted based on example data of two different users from our
data set. We envision the application to adapt to the changes Other types of applications could benefit from information
in tracking quality by going through the following steps: about accuracy and precision. For example, the more accu-
rate and precise the estimated gaze points, the more complex
1. Collect information about tracking accuracy and preci-
and small the gaze gestures that can be used. During run-
sion by analyzing target fixations during calibration and usage.
time, a gesture system could adapt to loss of tracking quality
Utilize the data to compute appropriate target sizes as shown
and encourage the user to perform larger gestures, or provide
in Equation 1. The left plot in Figure 7 shows example target
different gesture sets for different levels of tracking quality.
sizes based on data from two different users. Yellow denotes
Recognition algorithms could also take into account the qual-
“good” and blue “bad” tracking quality.
ity of the tracked gaze to better differ between noise in the
2. Choose optimal filter parameters, trading off signal re- signal and noise in the gesture performance. Attentive read-
sponse and precision based on the characteristics of the ap- ing applications (e.g. [13, 38]) could adapt their font size and
plication. For example, if error corrections are costly, a more word spacing for better recognition of fixations during reading.
aggressive filter could be chosen if signal quality drops, taking Visualizing tracking quality to the end user could be useful, for
into account delayed response of user actions for a more ro- example in remote collaborative settings where information
bust interaction. Optimal parameters for a range of acceptable about collaborators’ gaze can be a useful communication tool,
delays are given in the supplementary material. but a noisy signal can be confusing [7].
3. Adapt functionality and design of the UI to account for
the changes in tracking quality, either as predefined or op- DISCUSSION
timized in real-time. This is exemplified in Figure 7. The We showed how eye tracking precision and accuracy can vary
middle part shows a UI designed for good tracking quality: under tracking conditions similar to those encountered in prac-
it has a full keyboard placed on the bottom of the screen (as tice. Our work underscores the importance of error-aware
familiar from mobile interfaces); links and buttons can be applications that adapt to variations in tracking quality, and
selected individually. The UI on the right is adapted to poor we suggested several opportunities for how our results can
tracking. The keyboard is moved to the top where tracking inform the design of such applications. In the following, we
is relatively best, and letters are grouped to account for the discuss the generalizability of our findings to applications used
vertical offset and spread of gaze points (grouped-key text in-the-wild and opportunities for further work.Generalizability of Results 8.3% of the deviation in tracking quality, whereas differences
To assess the generalizability of our results to gaze input in between users account for up to 32.8%. Thus, it is reasonable
everyday computer interaction, we have replicated our data to assume that data collected under similar conditions with
collection with six experienced eye tracking users (people with other eye trackers are likely to show a similarly large varia-
ALS who rely on gaze-based AAC for communication), in tion in tracking accuracy and precision; formally investigating
environments and setups in which they use their eye track- this would be a valuable direction for future research. For
ers in practice. The task was the same as described in the applications to be usable in practice, it is important to account
Study section, but we only used the Tobii EyeX tracker, and for these large variations in tracking quality, regardless of the
mounted it on a rolling stand (rather than table) for wheelchair source. But in order to generate updated measurements as use
accessibility. Compared to the first study, gaze points were scenarios and eye tracking devices evolve, other researchers
tracked with a similarly large variation in precision; multivari- can use the experimental and analytic methodologies we de-
ate ANOVA found no difference for precision in either the x- scribed in this paper.
or the y-direction. However, accuracy of the gaze points varied
even more, ranging from 0.16 cm and 0.21 cm in the x- and CONCLUSION
y-direction if tracking was good (25th percentile) to 1.32 cm Eye tracking has the potential to revolutionize how we interact
and 1.67 cm in the x- and y-direction for poor tracking (90th with computers. Attentive applications seamlessly integrate
percentile). Multivariate ANOVA and follow-up univariate gaze input into existing interaction paradigms and explicit gaze
testing found the difference in accuracy to the first study sig- control opens new design spaces for HCI. While researchers
nificant (F(1, 86) = 2.6, p = 0.04). Further analysis showed, have developed many interaction techniques and applications
that in comparison to the first study, there were more outliers that use gaze information, there was a gap in understanding
for which offset was over 1 cm. A Mood’s median test found the requirements of such applications as they are released to
no significant difference in accuracy between the two studies. consumers. Toward this end, our work provides important
contributions for developers and designers of gaze-enabled
This shows that the conditions created in our study closely
applications, as well as researchers using eye tracking:
resemble those that we can expect in practice. However, when
applying our findings designers should keep in mind that in 1. We showed that there is large variability in accuracy and
particular the accuracy can vary even more, suggesting that precision when eye tracking is used in more practical condi-
designers should be conservative in their design of targets. tions. Differences between users can be more than six-fold,
and we analyzed variations of trackers and screen regions.
Limitations and Opportunities for Future Work 2. We propose a way of formally going from measures of
Several characteristics of our study design may lead to even accuracy and precision to target sizes. We provide look-
larger variations in-the-wild. We computed target sizes with up tables for appropriate target sizes and discuss the best
the assumption that users look at the center of a target. If screen regions. Our findings can be directly used by people
the user’s gaze changes within a small region, accuracy and developing gaze-enabled applications.
precision will likely stay the same but more gaze points will 3. We optimize and evaluate filters that work for eye track-
land outside a target as the gaze gets close to its border. It is ing data in practical conditions. We propose an optimization
a separate research question how the visual design of targets approach to find parameters that minimize target size and
(label shape, color, etc.) changes the focus of a user. signal delay, given calibration-style data. Developers can
directly use our results to choose the filter and parameters
Our study was short, thus we did not find differences in ac- appropriate for their application, while researchers can fol-
curacy or precision between a user’s first and last fixation. low our approach as they develop new filters.
In practice, we expect that accuracy and precision further 4. We outline our vision of error-aware gaze application,
decrease over time (due to movement, fatigue, etc.). that adapt their design and interaction techniques to the
We found that accuracy and precision become worse toward current tracking quality. We discuss several examples and
the bottom and right edge of the screen. However, both tested provide a walkthrough how our findings can be used to
trackers can be used with screens up to 27”, which is larger inform the design of such applications.
than the 12” screen we used. We expect tracking to also get For eye tracking to become a ubiquitous part of our everyday
worse toward the left and top edges as targets are placed closer interaction with computers, it is important to more systemati-
to the spatial limits of the tracker; however, a similar study on cally explore the question of “What is good design?’ for gaze
a larger screen is necessary to confirm this expectation. input, with the goal of establishing standards and frameworks
We used two commercially-available remote, IR eye trackers for robust, usable gaze applications. The presented findings
under two lighting setups. The specific accuracy and precision are an important step toward this goal, and our methods can
measures we report may vary under other environmental con- be re-applied to future hardware versions or in other contexts
ditions and/or with different equipment. However, our study to derive updated measurements as technology evolves.
reveals that in practical conditions, tracking quality is much
more affected by differences between individual users than ACKNOWLEDGMENTS
trackers or lighting. Using mixed linear regression to model We thank Mike Bennett, Ed Cutrell, Shahram Eivazi, and Antti
the accuracy and precision of our data, we found that on aver- Oulasvirta for their insightful comments. We also thank our
age differences in lighting and tracker only account for up to PALS and study participants, and the MSR Enable team.REFERENCES Human factors in computing systems - CHI ’05. ACM
1. Michael Ashmore, Andrew T. Duchowski, and Garth Press, New York, New York, USA, 151. DOI:
Shoemaker. 2005. Efficient eye pointing with a fisheye http://dx.doi.org/10.1145/1054972.1054994
lens. In Proceedings of Graphics Interface 2005.
11. Kenneth Holmqvist, Marcus Nyström, Richard
Canadian Human-Computer Communications Society,
Andersson, Richard Dewhurst, Halszka Jarodzka, and
Waterloo, 203–210.
Joost de Weijer. 2011. Eye tracking: A comprehensive
2. Michael Barz, Andreas Bulling, and Florian Daiber. guide to methods and measures. OUP Oxford.
2016a. Computational Modelling and Prediction of Gaze
Estimation Error for Head-mounted Eye Trackers DFKI 12. Yu-Chun Huang and Fong-Gong Wu. 2015. Visual and
Technical Report. (2016). manual loadings with QWERTY-like ambiguous
keyboards: Relevance of letter-key assignments on
3. Michael Barz, Florian Daiber, and Andreas Bulling. mobile phones. International Journal of Industrial
2016b. Prediction of gaze estimation error for error-aware Ergonomics 50 (2015), 143–150. DOI:
gaze-based interfaces. In Proceedings of the Ninth http://dx.doi.org/10.1016/j.ergon.2015.08.002
Biennial ACM Symposium on Eye Tracking Research &
Applications - ETRA ’16. ACM Press, New York, New 13. Aulikki Hyrskykari, Päivi Majaranta, Antti Aaltonen, and
York, USA, 275–278. DOI: Kari-Jouko Räihä. 2000. Design issues of iDICT: A
http://dx.doi.org/10.1145/2857491.2857493
Gaze-Assisted Translation Aid. In Proceedings of the
symposium on Eye tracking research & applications -
4. Richard Bates and Howell Istance. 2002. Zooming ETRA ’00. ACM Press, New York, New York, USA,
interfaces!: enhancing the performance of eye controlled 9–14. DOI:http://dx.doi.org/10.1145/355017.355019
pointing devices. In Proceedings of the fifth international
ACM conference on Assistive technologies - Assets ’02. 14. SensoMotoric Instruments. 2016. SMI REDn Scientific –
ACM Press, New York, New York, USA, 119. DOI: Specifiactions. (2016).
http://www.smivision.com/fileadmin/user
http://dx.doi.org/10.1145/638249.638272
5. Pieter Blignaut, Kenneth Holmqvist, Marcus Nyström, 15. Howell Istance and Aulikki Hyrskykari. 2011.
and Richard Dewhurst. 2014. Improving the Accuracy of Gaze-Aware Systems and Attentive Applications. In Gaze
Video-Based Eye Tracking in Real Time through Interaction and Applications of Eye Tracking. Vol. 58.
Post-Calibration Regression. In Current Trends in Eye IGI Global, 175–195. DOI:
Tracking Research. Springer International Publishing, http://dx.doi.org/10.4018/978-1-61350-098-9.ch013
Cham, 77–100. DOI: 16. Howell Istance, Aulikki Hyrskykari, Lauri Immonen,
http://dx.doi.org/10.1007/978-3-319-02868-2_5 Santtu Mansikkamaa, and Stephen Vickers. 2010.
6. Géry Casiez, Nicolas Roussel, and Daniel Vogel. 2012. Designing gaze gestures for gaming: an Investigation of
1e filter: a simple speed-based low-pass filter for noisy Performance. In Proceedings of the 2010 Symposium on
input in interactive systems. In Proceedings of the 2012 Eye-Tracking Research & Applications - ETRA ’10. ACM
ACM annual conference on Human Factors in Computing Press, New York, New York, USA, 323. DOI:
Systems - CHI ’12. ACM Press, New York, New York, http://dx.doi.org/10.1145/1743666.1743740
USA, 2527. DOI: 17. Robert J. K. Jacob. 1991. The use of eye movements in
http://dx.doi.org/10.1145/2207676.2208639 human-computer interaction techniques: what you look at
7. Sarah D’Angelo and Darren Gergle. 2016. Gazed and is what you get. ACM Transactions on Information
Confused: Understanding and Designing Shared Gaze for Systems 9, 2 (Apr 1991), 152–169. DOI:
Remote Collaboration. In Proceedings of the 2016 CHI http://dx.doi.org/10.1145/123078.128728
Conference on Human Factors in Computing Systems - 18. Shahram Jalaliniya and Diako Mardanbegi. 2016.
CHI ’16. ACM Press, New York, New York, USA, Eyegrip: Detecting targets in a series of uni-directional
2492–2496. DOI: moving objects using optokinetic nystagmus eye
http://dx.doi.org/10.1145/2858036.2858499 movements. In Proceedings of the 2016 CHI Conference
8. Heiko Drewes and Albrecht Schmidt. 2007. Interacting on Human Factors in Computing Systems. ACM,
with the computer using gaze gestures. Springer-Verlag. 5801–5811.
475–488 pages. 19. J Jimenez, D Gutierrez, and P Latorre. 2008. Gaze-based
9. Andrew T Duchowski, Nathan Cournia, and Hunter Interaction for Virtual Environments. Journal of
Murphy. 2004. Gaze-contingent displays: a review. Universal Computer Science 14 19 (2008), 3085–3098.
Cyberpsychology & behavior : the impact of the Internet, http://giga.cps.unizar.es/
multimedia and virtual reality on behavior and society 7, 20. Manu Kumar, Tal Garfinkel, Dan Boneh, and Terry
6 (dec 2004), 621–34. DOI: Winograd. 2007. Reducing shoulder-surfing by using
http://dx.doi.org/10.1089/cpb.2004.7.621 gaze-based password entry. In Proceedings of the 3rd
10. David Fono and Roel Vertegaal. 2005. EyeWindows: symposium on Usable privacy and security - SOUPS ’07.
evaluation of eye-controlled zooming windows for focus ACM Press, New York, New York, USA, 13. DOI:
selection. In Proceedings of the SIGCHI conference on http://dx.doi.org/10.1145/1280680.1280683You can also read