Biology Additional sample examination questions - NSW Education Standards Authority - NESA
←
→
Page content transcription
If your browser does not render page correctly, please read the page content below

NSW Education Standards Authority

Biology

Additional sample examination questions
Contents

Introduction .................................................................................................... 3

Question List .................................................................................................. 4

Sample Questions

                 Module 5 Heredity ...................................................................... 8

                 Module 6 Genetic Change ........................................................ 34

                 Module 7 Infectious Disease .................................................... 51

                 Module 8 Non-infectious Disease and Disorders ..................... 73

                                                                  –2–
Introduction
The first HSC examination for the new Biology Stage 6 syllabus will be held in 2019.
The syllabus and related assessment materials are available on the syllabus page of the NESA
website.
The Assessment and Reporting in Biology Stage 6 document provides the Biology HSC
examination specifications. The Biology – Sample examination materials document indicates
the layout and format of the HSC examination and provides examples of questions that may be
found in HSC examinations, with annotations.
This document, Biology – Additional sample examination questions, provides additional
examples of questions that may be found in HSC examinations for Biology. The document
comprises new questions, as well as questions that have been published in the sample
examination materials and some questions that have been drawn from previous HSC
examinations.
The document has been developed to assist teachers to:
• create sample HSC examination papers
• prepare revision exercises
• model question design
• consolidate understanding of the syllabus.
The sample questions are arranged by module. Examples of both objective-response questions
and short-answer questions for each of the modules, Heredity, Genetic Change, Infectious
Disease, and Non-infectious Disease and Disorders, are provided.
Each sample question has been mapped to show how the question relates to content, syllabus
outcomes and bands. Questions may require candidates to integrate knowledge, understanding
and skills from different content areas. Each question is mapped to the main content area(s)
being assessed but may be relevant to one or more content areas. When a question has been
mapped to multiple content areas, it has been placed under the topic deemed to be most relevant.
Answers for the objective-response questions and marking guidelines for the short-answer
questions are also provided. The sample questions, sample answers and marking guidelines
provide teachers and students with guidance as to the types of questions that may be included
in the examination and how they may be marked. They are not meant to be prescriptive.
Note:
• In this set of sample questions, some stimulus material is used in more than one question.
This illustrates how the same content area can be examined in different ways.
• The new Biology Stage 6 syllabus includes content areas that were also part of previous
syllabuses. Where this occurs, teachers and students may still refer to past HSC examination
papers for examples of other types of questions that are relevant.
• In this document, ‘Bands’ means the performance bands targeted by the question.
–3–Question List
* denotes a multiple–choice question
Module 5 Heredity
Question Marks Content Syllabus Outcomes Bands
Mod 5 – 1* 1 Mod 5 Reproduction BIO12–12 2–3
Mod 5 – 2* 1 Mod 5 Cell Replication BIO12–5, BIO12–12 2–3
Mod 5 – 3* 1 Mod 5 DNA and Polypeptide Synthesis BIO12–6, BIO12–12 4–5
Mod 5 – 4* 1 Mod 5 DNA and Polypeptide Synthesis BIO12–4, BIO12–12 5–6
Mod 5 – 5* 1 Mod 5 Genetic Variation Bio12–4, BIO12–12 2–3
Mod 5 – 6* 1 Mod 5 Genetic Variation BIO12–12 3–4
BIO12–5, BIO12–6,
Mod 5 – 7* 1 Mod 5 Genetic Variation 4–5
BIO12–12
BIO12–5, BIO12–6,
Mod 5 – 8* 1 Mod 5 Genetic Variation 4–5
BIO12–12
BIO12–5, BIO12–6,
Mod 5 – 9* 1 Mod 5 Genetic Variation 5–6
BIO12–12
Mod 5 Inheritance Patterns in a BIO12–2, BIO12–6,
Mod 5 – 10* 1 4–5
Population BIO12–12
Mod 5 – 11 (a) 3 Mod 5 Reproduction BIO12–4, BIO12–12 2–4
Mod 5 – 11 (b) 3 Mod 5 Reproduction BIO12–12 2–4
Mod 5 – 12 5 Mod 5 Reproduction BIO12–6, BIO12–12 2–6
Mod 5 – 13 (a) 3 Mod 5 Cell Replication BIO12–4, BIO12–12 2–5
Mod 5 – 13 (b) 1 Mod 5 Cell Replication BIO12–5, BIO12–12 4–5
BIO12–5, BIO12–6,
Mod 5 – 13 (c) 3 Mod 5 Cell Replication 4–6
BIO12–12
Mod 5 – 14 (a) 3 Mod 5 Cell Replication BIO12–4, BIO12–12 4–6
BIO12–5, BIO12–6,
Mod 5 – 14 (b) 2 Mod 5 Cell Replication 5–6
BIO12–12
Mod 5 – 15 3 Mod 5 DNA and Protein Synthesis BIO12–7, BIO12–12 2–4
BIO12–4, BIO12–6,
Mod 5 – 16 (a) 3 Mod 5 Genetic Variation 2–4
BIO12–7, BIO12–12
BIO12–5, BIO12–6,
Mod 5 – 16 (b) 2 Mod 5 Genetic Variation 4–6
BIO12–12
BIO12–4, BIO12–5,
Mod 5 – 17 4 Mod 5 Genetic Variation 2–5
BIO12–6, BIO12–12
Mod 5 Inheritance Patterns in a
Mod 5 – 18 (a) 2 BIO12–1, BIO12–12 4–5
Population
Mod 5 Inheritance Patterns in a
Mod 5 – 18 (b) 4 BIO12–2, BIO12–12 3–6
Population
–4–Module 6 Genetic Change
Question Marks Content Syllabus Outcomes Bands
Mod 6 – 1* 1 Mod 6 Mutation BIO12–6, BIO12–13 3–4
Mod 6 – 2* 1 Mod 6 Mutation BIO12–6, BIO12–13 4–5
Mod 6 – 3* 1 Mod 6 Mutation BIO12–5, BIO12–13 4–5
Mod 6 – 4* 1 Mod 6 Mutation BIO12–6, BIO12–13 4–5
Mod 6 – 5* 1 Mod 6 Biotechnology BIO12–7, BIO12–13 2–3
Mod 6 – 6* 1 Mod 6 Biotechnology BIO12–6, BIO12–13 3–4
Mod 6 – 7* 1 Mod 6 Genetic Technologies BIO12–7, BIO12–13 2–3
Mod 6 – 8 (a) 3 Mod 6 Mutation BIO12–4, BIO12–13 2–5
Mod 6 – 8 (b) 2 Mod 6 Mutation BIO12–6, BIO12–13 2–4
BIO12–4, BIO12–6,
Mod 6 – 8 (c) 3 Mod 6 Mutation 2–5
BIO12–7, BIO12–13
BIO12–4, BIO12–6,
Mod 6 – 9 8 Mod 6 Mutation 2–6
BIO12–13
Mod 6 Biotechnology BIO12–6, BIO12–7,
Mod 6 – 10 6 2–6
Mod 6 Genetic Technologies BIO12–13
Mod 6 Biotechnology BIO12–5, BIO12–6,
Mod 6 – 11 (a) 2 4–6
Mod 6 Genetic Technologies BIO12–13
BIO12–5, BIO12–6,
Mod 6 – 11 (b) 3 Mod 6 Genetic Technologies 3–6
BIO12–7, BIO12–13
BIO12–5, BIO12–6,
Mod 6 – 12 (a) 2 Mod 6 Biotechnology 4–6
BIO12–13
BIO12–5, BIO12–6,
Mod 6 – 12 (b) 3 Mod 6 Genetic Technologies 3–6
BIO12–7, BIO12–13
BIO12–4, BIO12–5,
Mod 6 – 13 4 Mod 6 Genetic Technologies 2–6
BIO12–7, BIO12–13
BIO12–5, BIO12–6,
Mod 5 Heredity
Mod 6 – 14 7 BIO12–7, BIO12–12, 2–6
Mod 6 Genetic Technologies
BIO12–13
Module 7 Infectious Disease
Question Marks Content Syllabus Outcomes Bands
Mod 7 – 1* 1 Mod 7 Causes of Infectious Disease BIO12–7, BIO12–14 2–3
Mod 7 – 2* 1 Mod 7 Causes of Infectious Disease BIO12–5, BIO12–14 3–4
Mod 7 – 3* 1 Mod 7 Causes of Infectious Disease BIO12–6, BIO12–14 4–5
Mod 7 – 4* 1 Mod 7 Responses to Pathogens BIO12–5, BIO12–14 2–3
Mod 7 – 5* 1 Mod 7 Responses to Pathogens BIO12–7, BIO12–14 4–5
Mod 7 – 6* 1 Mod 7 Immunity BIO12–5, BIO12–14 3–4
Mod 7 – 7* 1 Mod 7 Immunity BIO12–5, BIO12–14 5–6
Mod 7 – 8* 1 Mod 7 Immunity BIO12–5, BIO12–14 5–6
Mod 7 – 9* 1 Mod 7 Prevention, Treatment and Control BIO12–1, BIO12–14 4–5
–5–Mod 7 – 10* 1 Mod 7 Prevention, Treatment and Control BIO12–14 4–5
Mod 7 Causes of Infectious Disease BIO12–2, BIO12–6,
Mod 7 – 11* 1 5–6
Mod 7 Prevention, Treatment and Control BIO12–14
Mod 7 – 12 3 Mod 7 Causes of Infectious Disease BIO12–4, BIO12–14 2–4
BIO12–2, BIO12–3,
Mod 7 – 13 3 Mod 7 Causes of Infectious Disease 2–4
BIO12–6, BIO12–14
Mod 7 Causes of Infectious Disease
Mod 7 – 14 5 BIO12–6, BIO12–14 2–6
Mod 7 Responses to Pathogens
Mod 7 – 15 (a) 2 Mod 7 Responses to Pathogens BIO12–1, BIO12–14 4–6
Mod 7 – 15 (b) 4 Mod 7 Responses to Pathogens BIO12–6, BIO12–14 3–6
Mod 7 – 16 (a) 2 Mod 7 Immunity BIO12–4, BIO12–14 2–3
Mod 7 – 16 (b) 4 Mod 7 Immunity BIO12–6, BIO12–14 3–6
Mod 7 – 17 (a) 3 Mod 7 Immunity BIO12–6, BIO12–14 3–6
Mod 7 – 17 (b) 3 Mod 7 Immunity BIO12–6, BIO12–14 3–6
Mod 7 Causes of Infectious Disease
Mod 7 Prevention, Treatment and Control BIO12–4, BIO12–5,
Mod 7 – 18 9 Mod 8 Causes and Effects BIO12–6, BIO12–7, 2–6
Mod 8 Epidemiology BIO12–14, BIO12–15
Mod 8 Prevention
Module 8 Non-infectious Disease and Disorders
Question Marks Content Syllabus Outcomes Bands
Mod 8 – 1* 1 Mod 8 Homeostasis BIO12–5, BIO12–15 3–4
Mod 8 – 2* 1 Mod 8 Homeostasis BIO12–5, BIO12–15 3–4
BIO12–2, BIO12–6,
Mod 8 – 3* 1 Mod 8 Homeostasis 4–5
BIO12–15
Mod 8 – 4* 1 Mod 8 Causes and Effects BIO12–7, BIO12–15 2–3
Mod 8 – 5* 1 Mod 8 Epidemiology BIO12–7, BIO12–15 2–3
Mod 8 – 6* 1 Mod 8 Epidemiology BIO12–6, BIO12–15 3–4
Mod 8 – 7* 1 Mod 8 Prevention BIO12–7, BIO12–15 2–3
Mod 8 – 8* 1 Mod 8 Technologies and Disorders BIO12–7, BIO12–15 3–4
Mod 8 – 9* 1 Mod 8 Technologies and Disorders BIO12–6, BIO12–15 3–4
BIO12–4, BIO12–7,
Mod 8 – 10 (a) 3 Mod 8 Homeostasis 3–6
BIO12–15
BIO12–4, BIO12–6,
Mod 8 – 10 (b) 3 Mod 8 Homeostasis 3–6
BIO12–7, BIO12–15
BIO12–2, BIO12–5,
Mod 8 – 11 5 Mod 8 Epidemiology 2–6
BIO12–7, BIO12–15
BIO12–6, BIO12–7,
Mod 8 – 12 3 Mod 8 Prevention, Treatment and Control 2–5
BIO12–15
Mod 8 – 13 (a) 2 Mod 8 Technologies and Disorders BIO12–6, BIO12–15 2–4
Mod 8 – 13 (b) 4 Mod 8 Technologies and Disorders BIO12–6, BIO12–15 2–6
–6–BIO12–6, BIO12–7,
Mod 8 – 14 7 Mod 8 Technologies and Disorders 2–6
BIO12–15
BIO12–2, BIO12–4,
Mod 8 – 15 7 Mod 8 Epidemiology BIO12–5, BIO12–6, 2–6
BIO12–7, BIO12–15
–7–Module 5 Heredity
Mod 5 – Question 1
A strawberry plant will send out over the ground runners which will take root and grow a new
plant as shown.
This method of growing a new plant is an example of
A. budding.
B. germination.
C. external fertilisation.
D. asexual reproduction.
Content Syllabus outcomes Bands Key
Mod 5 Reproduction BIO12–12 2–3 D
–8–Mod 5 – Question 2
A student constructed a model of meiosis as shown. However, there is an error in the model.
6
5
1 2 3 4
5
Which aspect of this model does NOT fit with observations of meiosis?
A. Separation of chromatids has not been shown in the model.
B. The chromosomes have not independently assorted in stage 2.
C. The chromosomes in stage 4 should have duplicated before stage 5.
D. The chromosomes have undergone crossing over before sister chromosome alignment in
stage 3.
Content Syllabus outcomes Bands Key
Mod 5 Cell Replication BIO12–5, BIO12–12 2–3 D
–9–Mod 5 – Question 3
Haemophilia A is a blood clotting disorder that arises from a defect in the gene F8 which is
carried on the X chromosome. The disorder affects the production of a glycoprotein that is one
of many components needed to form the platelets which form blood clots when a bleed occurs.
It is typically treated with infusions of FVIII product, an inactive single chain polypeptide of
2332 amino acids, which is manufactured using DNA technology on human endothelial cells.
Why is the inactive FVIII polypeptide chain used in the treatment of Haemophilia A?
A. It will prevent bleeds from occurring.
B. It can take the place of platelets in clotting blood.
C. It can be used to manufacture the glycoprotein that is affected by the defective F8 gene.
D. It is used as a gene therapy to help the patient manufacture FVIII in their own endothelial
cells.
Content Syllabus outcomes Bands Key
Mod 5 DNA and Polypeptide Synthesis BIO12–6, BIO12–12 4–5 C
– 10 –Mod 5 – Question 4
The table shows the base triplets in mRNA for amino acids.
From the table, the amino acid Tryptophan (Trp) can be coded for by the base triplet UGG.
Base triplets found in messenger RNA
Second base
U C A G
Phe Ser Tyr Cys U
Phe Ser Tyr Cys C
U
Phe Ser Stop Stop A
Phe Ser Stop Trp G
Leu Pro His Arg U
Leu Pro His Arg C
C
Leu Pro Gln Arg A
Third base
First base
Leu Pro Gln Arg G
lle Thr Asn Ser U
lle Thr Asn Ser C
A
lle Thr Lys Arg A
Met Thr Lys Arg G
Val Ala Asp Gly U
Val Ala Asp Gly C
G
Val Ala Glu Gly A
Val Ala Glu Gly G
Which base triplet could code for the amino acid Arginine (Arg)?
A. AAU
B. GAC
C. GCC
D. CGG
Content Syllabus outcomes Bands Key
Mod 5 DNA and Polypeptide Synthesis BIO12–4, BIO12–12 5–6 D
– 11 –Mod 5 – Question 5
A student completed a genetics exercise by preparing a Punnett square. T represents a dominant
allele and t represents a recessive allele.
Parent 1 gametes
TT Tt
Parent 2 gametes
Tt tt
What were the likely genotypes of these parents?
A. Both parents were homozygous.
B. Both parents were heterozygous.
C. Parent 1 was homozygous, Parent 2 was heterozygous.
D. Parent 1 was heterozygous, Parent 2 was homozygous.
Content Syllabus outcomes Bands Key
Mod 5 Genetic Variation BIO12–4, BIO12–12 2–3 B
Mod 5 – Question 6
In which of the following do both processes result in genetic variation of offspring?
A. DNA mutation and gamete formation
B. Cell differentiation and gamete formation
C. DNA mutation and polypeptide production
D. Cell differentiation and polypeptide production
Content Syllabus outcomes Bands Key
Mod 5 Genetic Variation BIO12–12 3–4 A
– 12 –Mod 5 – Question 7
Colour blindness is a sex-linked recessive trait.
Susan is not colourblind but her father is. Susan is married to James who is also not colourblind.
Susan and James are expecting twins, a boy and a girl.
Which row in the table shows the probability of colourblindness in the boy and the girl?
Boy Girl
A. 0% 0%
B. 50% 0%
C. 0% 50%
D. 50% 50%
Content Syllabus outcomes Bands Key
Mod 5 Genetic Variation BIO12–5, BIO12–6, 4–5 B
BIO12–12
– 13 –Mod 5 – Question 8
Haemophilia A is a blood clotting disorder that arises from a defect in the gene which is carried
on the X chromosome.
A couple is considering starting a family. However, the father suffers from Haemophilia A.
The mother is healthy with no family history of the disease.
What is the probability that a potential grandson will have Haemophilia A if they have a
daughter who partners with an unaffected man?
A. 0%
B. 25%
C. 50%
D. 100%
Content Syllabus outcomes Bands Key
Mod 5 Genetic Variation BIO12–5, BIO12–6, 4–5 C
BIO12–12
– 14 –Mod 5 – Question 9
It is suspected that a child has a recessive, sex-linked condition. An initial pedigree was
developed.
Which of the following is most likely to depict this initial pedigree?
A. B. C. D.
Unaffected male Affected male
Unaffected female Affected female
Content Syllabus outcomes Bands Key
Mod 5 Genetic Variation BIO12–5, BIO12–6, 5–6 B
BIO12–12
Mod 5 – Question 10
A student conducted a survey to determine the phenotype prevalence of cats that had long
hair in comparison to the number that had short hair in a population of cats. She asked her
classmates to describe the coat length of their cats and tallied the results. Out of 26 cats that
were counted, she found that 42% of the cats had long hair and 58% had short hair, and that
the trait did not follow a Mendelian ratio.
Which of the following best explains why the results did not follow a Mendelian ratio?
A. The student tallied the numbers incorrectly.
B. The length of cat hair may be determined by more than one gene.
C. The student cannot determine the genotype from the phenotype alone.
D. The students were unclear about whether their cat had long or short hair.
Content Syllabus outcomes Bands Key
Mod 5 Inheritance Patterns in a BIO12–2, BIO12–6, 4–5 B
Population BIO12–12
– 15 –Mod 5 – Question 11 (6 marks)
(a) The following data shows the average amount of Human Chorionic Gonadotropin 3
(hCG) produced by pregnant women.
Weeks of pregnancy hCG (ng/mL)
0 0
4 85
8 185
12 185
16 80
20 65
24 60
28 65
32 75
36 65
40 35
Use the information provided to graph the levels of hCG in a normal pregnancy.
Question 11 continues on page 17
– 16 –Question 11 (continued)
(b) Describe the role and changes in levels of a hormone in pregnancy. 3
Mapping grid (a):
Content Syllabus outcomes Bands
Mod 5 Reproduction BIO12–4, BIO12–12 2–4
Marking guidelines (a):
Criteria Marks
• Labels axes correctly including units
• Uses appropriate scale
3
• Plots points correctly
• Draws appropriate graph
• Provides some correct steps in completing the graph 2
• Provides some relevant information 1
Sample answer:
Human Chorionic Gonadotropin concentrations in
pregnancy
200
180
160
Concentration of hCG (ng/mL)
140
120
100
80
60
40
20
0
0 5 10 15 20 25 30 35 40 45
Weeks of pregnancy
Question 11 continues on page 18
– 17 –Question 11 (continued)
Mapping grid (b):
Content Syllabus outcomes Bands
Mod 5 Reproduction BIO12–12 2–4
Marking guidelines (b):
Criteria Marks
• Describes the role and changes in levels of a hormone in pregnancy 3
• Outlines the role and/or levels of a hormone in pregnancy 2
• Provides some relevant information 1
Sample answer:
A hormone that is important in pregnancy is progesterone. Progesterone is initially produced
by the corpus luteum in the ovary and causes the endometrium to thicken, which helps to
support and maintain the pregnancy in the first weeks when the placenta is still developing.
The developed placenta then produces progesterone at significantly higher levels to
maintain the pregnancy. Prior to birth progesterone levels drop significantly to facilitate
labour.
End of Question 11
– 18 –Mod 5 – Question 12 (5 marks)
Justify why internal fertilisation is more advantageous than external fertilisation in 5
ensuring the continuity of a species.
Mapping grid:
Content Syllabus outcomes Bands
Mod 5 Reproduction BIO12–6, BIO12–12 2–6
Marking guidelines:
Criteria Marks
• Provides a thorough justification
• Shows a thorough understanding of both internal fertilisation and external
fertilisation in terms of ensuring the continuity of a species 5
• Shows clear understanding of the advantages of internal fertilisation over
external fertilisation
• Shows a sound understanding of both internal fertilisation and external
fertilisation
4
• Links both to ensuring the continuity of a species
• Outlines benefits and/or weaknesses of internal and external fertilisation
• Outlines features of both internal fertilisation and external fertilisation 3
• Identifies some features of internal fertilisation and/or external fertilisation 2
• Provides some relevant information 1
Sample answer:
For the continuity of a species, each generation must successfully reproduce to produce
sufficient numbers of the next generation. A critical number of embryos must survive to
gestational maturity. This is less likely with external fertilisation.
Organisms that reproduce by external reproduction spend a substantial amount of energy
and resources in the production and release of very large numbers of sperm and eggs. This
is because each sperm and egg and the resulting embryos have limited chances of survival,
not being protected by the parent for example in the open ocean. Chances of successful
fertilisation are low in such vast aquatic environments. Larger numbers ensure some will be
fertilised.
Internal fertilisation provides a smaller safer environment for release of gametes, fertilisation
and maturation of the embryos. Chances of successful fertilisation are increased and
embryos are protected from predators within the body of the parent. Even after birth/egg
laying parental care assists survival of the offspring.
– 19 –Mod 5 – Question 13 (7 marks)
Students conducted preliminary experiments to analyse the DNA base composition of
five different species.
The table shows the experimental data collected.
Species % Adenine % Guanine
A 38 12
B 26 22
C 8 40
D 20 32
E 33 18
(a) On the grid provided, plot the % Guanine against % Adenine of the species 3
analysed and draw a suitable line of best fit.
% Guanine
% Adenine
(b) Identify the relationship shown by the data. 1
(c) Explain the relationship shown by the data. 3
Question 13 continues on page 21
– 20 –Question 13 (continued)
Mapping grid (a):
Content Syllabus outcomes Bands
Mod 5 Cell Replication BIO12–4, BIO12–12 2–5
Marking guidelines (a):
Criteria Marks
• Uses appropriate scale
• Plots points correctly 3
• Draws an appropriate line of best fit
• Draws a substantially correct graph 2
• Provides some relevant information 1
Sample answer:
50
45
40
35
30
% Guanine 25
20
15
10
5
0
0 5 10 15 20 25 30 35 40 45 50
% Adenine
Question 13 continues on page 22
– 21 –Question 13 (continued)
Mapping grid (b):
Content Syllabus outcomes Bands
Mod 5 Cell Replication BIO12–5, BIO12–12 4–5
Marking guidelines (b):
Criteria Marks
• Identifies a correct relationship 1
Sample answer:
As the % of Adenine increases, the % of Guanine decreases.
Mapping grid (c):
Content Syllabus outcomes Bands
Mod 5 Cell Replication BIO12–5, BIO12–6, 4–6
BIO12–12
Marking guidelines (c):
Criteria Marks
• Explains the relationship
3
• Makes clear reference to the data
• Demonstrates some understanding of the relationship 2
• Provides some relevant information 1
Sample answer:
The percentage of A = T is related to the percentage of G = C due to the base pairing rule.
This means as A goes up, T will also go up because A = T and A + T + C + G should equal
100%. Therefore as A increases, the amount of G should decrease as there is a smaller
proportion available.
End of Question 13
– 22 –Mod 5 – Question 14 (5 marks)
(a) Complete the following diagram to show the process by which gametes are 3
formed.
A
A
B
B
a
a
b
b
A A b
a B B a b
a A
B B
Question 14 continues on page 24
– 23 –Question 14 (continued)
(b) How does the segregation of chromosomes during meiosis lead to a wide variety 2
of gametes being produced?
Mapping grid (a):
Content Syllabus outcomes Bands
Mod 5 Cell Replication BIO12–4, BIO12–12 4–6
Marking guidelines (a):
Criteria Marks
• Diagram 1: tetrads line up correctly, alleles in correct position,
homologous chromosomes paired and joined correctly and crossing over
has occurred 3
• Diagram 2: haploid, with appropriate chromosomes and alleles in both
• Completes Diagram 1
OR 2
• Shows some elements of Diagram 1 and Diagram 2
• Provides some relevant information 1
Question 14 continues on page 25
– 24 –Question 14 (continued)
Sample answer:
A
A
B
B
a
a
b
b
A A b
a B B a b
a A
B B
Question 14 continues on page 26
– 25 –Question 14 (continued)
Mapping grid (b):
Content Syllabus outcomes Bands
Mod 5 Cell Replication BIO12–5, BIO12–6, 5–6
BIO12–12
Marking guidelines (b):
Criteria Marks
• Demonstrates a sound knowledge of independent assortment during
2
gamete formation and relates to a range of gamete combinations
• Provides some relevant information 1
Sample answer:
In meiosis, there is a reduction division. Chromosome pairs line up together and one of each
pair goes into the daughter cells. For each pair, this process is independent – hence a large
number of combinations is possible.
End of Question 14
– 26 –Mod 5 – Question 15 (3 marks)
There are some significant differences in the form that DNA has in prokaryotic and 3
eukaryotic cells.
In the space provided draw a labelled diagram demonstrating the difference in the
form of DNA between prokaryotic and eukaryotic cells.
Mapping grid:
Content Syllabus outcomes Bands
Mod 5 DNA and Protein Synthesis BIO12–7, BIO12–12 2–4
Marking guidelines:
Criteria Marks
• Draws prokaryotic DNA form as loop and eukaryotic DNA form as a
strand with distinct ends 3
• Provides relevant labels that convey understanding of DNA forms
• Draws prokaryotic DNA form as loop and eukaryotic DNA as a strand
with distinct ends
2
OR
• Draws and labels EITHER prokaryotic DNA form or eukaryotic DNA form
• Provides some relevant information 1
Sample answer:
Eukaryotic DNA
Prokaryotic DNA
DNA in a loop DNA in tightly coiled
strands with two ends
– 27 –Mod 5 – Question 16 (5 marks)
A non-infectious disease was observed in a mother and her four sons who live with
her. She has no daughters. The father of these children does not have the disease and
does not live with them. The woman’s parents and her two sisters who live overseas
do not have the disease.
A geneticist suspects that the disease is inherited.
(a) Draw the family pedigree for this disease. 3
(b) From the evidence, what indicates that the disease could be the result of a 2
recessive allele and not be sex-linked?
Mapping grid (a):
Content Syllabus outcomes Bands
Mod 5 Genetic Variation BIO12–4, BIO12–6, 2–4
BIO12–7, BIO12–12
Question 16 continues on page 29
– 28 –Question 16 (continued)
Marking guidelines (a):
Criteria Marks
• Provides a pedigree showing THREE generations
• Uses common structure OR key 3
• Clearly shows sufferers
• Provides a clear pedigree showing sufferers 2
• Provides some relevant information 1
Sample answer:
I KEY
Unaffected female
II Unaffected male
Affected female
III Affected male
Mapping grid (b):
Content Syllabus outcomes Bands
Mod 5 Genetic Variation BIO12–5, BIO12–6, 4–6
BIO12–12
Marking guidelines (b):
Criteria Marks
• Provides evidence that indicates why the gene is recessive
2
• Provides evidence that indicates why the gene cannot be sex-linked
• Provides evidence that indicates why the gene is recessive
OR 1
• Provides evidence that indicates why the gene cannot be sex-linked
Sample answer:
The grandparents do not have the disease while the mother has the disease (recessive)
and the disease is not found in the grandfather while the mother has the disease
(not sex-linked).
End of Question 16
– 29 –Mod 5 – Question 17 (4 marks)
The diagram shows a model developed in the early 20th century of crossing over of 4
homologous chromosomes.
Explain how the difference between this model and our current model of crossing
over reflects an increased understanding of the way in which new combinations of
genotypes are produced. Support your answer with a diagram.
Mapping grid:
Content Syllabus outcomes Bands
Mod 5 Genetic Variation BIO12–4, BIO12–5, 2–5
BIO12–6, BIO12–12
Marking guidelines:
Criteria Marks
• Outlines gamete formation in the old and current models clearly showing
the difference
4
• Relates the difference between the models to gamete production and
genetic variation in potential offspring
• Outlines gamete formation in the old and current models
• Makes some link to gamete production and/or genetic variation in 3
potential offspring
• Outlines gamete formation in the old and/or current model
AND/OR
2
• Outlines some implication in terms of gamete production and/or genetic
variation in potential offspring
• Provides some relevant information 1
Question 17 continues on page 31
– 30 –Question 17 (continued)
Sample answer:
The old model shows one strand of each homologous chromosome. This means that when
gametes are produced they would only contain the chromosomes showing the products of
crossing over, ie showing the recombined genetic information. Our current model shows
that DNA replication has occurred before crossing over takes place. Replicated homologous
chromosomes line up in tetrads. Cross over happens between two chromatids within the
tetrad, not between all chromatids. Therefore, there are parental chromatids that have
undergone crossing over and parental chromatids that have not.
P2 chromatids
Homologous
chromosomes
P1 chromatids
This means that when gametes are made, some will get unchanged parental chromosomes
and some will get the chromatids that have undergone crossing over. This means that the
range of gametes produced, and thus individuals produced through fertilisation, will show
much greater variation.
End of Question 17
– 31 –Mod 5 – Question 18 (6 marks)
A student plans to investigate whether the development of insulin has affected the
prevalence of Type 1 diabetes in the human population and subsequently influenced
human evolution. She has access to data on Australians with diabetes extending back
to 1973.
(a) Propose a suitable hypothesis for this investigation. 2
(b) Identify TWO variables that need to be controlled for this investigation and 4
explain their importance.
Mapping grid (a):
Content Syllabus outcomes Bands
Mod 5 Inheritance Patterns in a Population BIO12–1, BIO12–12 4–5
Marking guidelines (a):
Criteria Marks
• Proposes a suitable hypothesis 2
• Provides some relevant information 1
Sample answer:
The use of insulin, by people who have Type 1 diabetes, has increased the prevalence of
Type 1 diabetes in the human population.
Mapping grid (b):
Content Syllabus outcomes Bands
Mod 5 Inheritance Patterns in a Population BIO12–2, BIO12–12 3–6
Marking guidelines (b):
Criteria Marks
• Identifies TWO variables that could affect findings and explains their
4
importance
• Identifies TWO variables that could affect findings and outlines their
3
importance
• Identifies ONE variable that could affect findings and outlines its
2
importance
• Provides some relevant information 1
Question 18 continues on page 33
– 32 –Question 18 (continued)
Sample answer:
One variable the student will need to control for is the increase in the Australian population
since 1973. Just counting the increase in numbers without taking into account population
increases will give a biased result as even without an increase in prevalence it would be
expected that the total numbers will increase as the population increases. The prevalence
will need to be measured using a rate such as number of people with Type 1 diabetes per
100 000 people.
Another variable that may affect results, and therefore reduce the validity of the data, is the
length of time the subject has used insulin or since diagnosis. This data may also be useful
if determining whether the prevalence of Type 1 diabetes is caused by more people being
diagnosed or more people surviving for a longer time.
End of Question 18
– 33 –Module 6 Genetic Change
Mod 6 – Question 1
The bread mould, Neurospora crassa, normally produces its own amino acids from raw
materials through a system of enzymes.
Gene A Gene B Gene C
Enzyme A Enzyme B Enzyme C
Raw
Ornithine Citrulline Arginine
materials
If a mutation occurred in gene B, the bread mould would still produce arginine if supplied with
A. citrulline.
B. ornithine.
C. enzyme C.
D. raw materials.
Content Syllabus outcomes Bands Key
Mod 6 Mutation BIO12–6, BIO12–13 3–4 A
– 34 –Mod 6 – Question 2
An evolutionary biologist was investigating the timeframes of genetic divergence between
different species of Acacia. She hypothesised that she would get a better indication of the time
at which Acacia species diverged by using non-coding DNA segments rather than coding DNA
segments.
Why is this hypothesis most likely to be supported by the evidence?
A. Coding DNA segments never undergo mutation.
B. Coding DNA segments are less stable over time due to the selection pressures of the
environment.
C. Non-coding DNA segments are stable over time and cannot be used as evidence of
genetic divergence.
D. Non-coding DNA segments will show greater diversity after divergence as they are not
exposed to selection pressures.
Content Syllabus outcomes Bands Key
Mod 6 Mutation BIO12–6, BIO12–13 4–5 D
Mod 6 – Question 3
The following events occur after DNA is subjected to radiation. The events are listed in no
specific order.
P: Mutation
Q: Change in cell activity
R: Change in protein structure
S: Change in polypeptide sequence
What is the correct sequence of steps?
A. P, Q, R, S
B. S, Q, P, R
C. S, R, Q, P
D. P, S, R, Q
Content Syllabus outcomes Bands Key
Mod 6 Mutation BIO12–5, BIO12–13 4–5 D
– 35 –Mod 6 – Question 4
Which of the following is true of a mutation that produces an allele that is dominant?
A. It would be expected to cause death.
B. It could give an observable phenotype in a heterozygous genotype.
C. It could give an observable phenotype only in a homozygous genotype.
D. It would be expected to spread more quickly through a population than a recessive
mutation.
Content Syllabus outcomes Bands Key
Mod 6 Mutation BIO12–6, BIO12–13 4–5 B
Mod 6 – Question 5
A student was doing a literature review on biotechnology and wanted to see how biotechnology
research could positively benefit people who suffered from Type 1 diabetes. He found several
potential measures that were being explored to help people with diabetes.
Which of the following measures does NOT use biotechnology?
A. Gene therapy in which genetic information is introduced into the cells of the pancreas
B. The screening of genes to inform potential parents of the risk of their child developing
Type 1 diabetes
C. The use of auto-monitoring insulin pumps that can detect when a patient’s insulin levels
are dropping too low
D. Collecting survey data on the prevalence of Type 1 diabetes in different communities to
ensure insulin supplies are maintained at sufficient levels
Content Syllabus outcomes Bands Key
Mod 6 Biotechnology BIO12–7, BIO12–13 2–3 D
– 36 –Mod 6 – Question 6
Glofish are a genetically-modified organism in which the gene that causes fluorescence in
jellyfish has been inserted into a tropical fish species, typically Zebra fish. These fish are sold
commercially for home aquariums. Some sectors of the community have said that humans do
not have the right to make genetically-modified organisms for this purpose.
What is the main nature of their concern?
A. The limited application the Glofish have in society
B. The risks to the biodiversity of the Zebra fish species
C. The ethics of manipulating an organism’s genes for commercial gain
D. That the Glofish may interbreed with other species causing serious mutations in the
future
Content Syllabus outcomes Bands Key
Mod 6 Biotechnology BIO12–6, BIO12–13 3–4 C
Mod 6 – Question 7
A New Zealand research team inserted a single gene into an onion to reduce the activity of
the enzyme that makes your eyes water, resulting in an onion that you can cut without crying.
Which term best describes this team’s process?
A. Cloning
B. Artificial pollination
C. Genetic engineering
D. Artificial insemination
Content Syllabus outcomes Bands Key
Mod 6 Genetic Technologies BIO12–7, BIO12–13 2–3 C
– 37 –Mod 6 – Question 8 (8 marks)
The flow chart illustrates the effect of a point mutation on an organism.
Stage: 1 2 3 4 5
CTGAGA CTGTGA CUGUGA Faulty
protein
Mutagen
(a) Outline the series of events from stages 2 to 4 that resulted in the faulty protein. 3
(b) Describe how a type of mutagen may have caused the changes observed in 2
stage 2.
(c) Given the information in the chart shown, describe the effect caused by the 3
mutation in stage 4 and the effect this would have on the organism.
3'
Gly Phe
Leu
Glu
Ser
A U A
Asp U
A C G C G C
U G U G Tyr
Ala C A Stop
G UC
A G U Stop
C
U A C A
G Cys
G
A
C A U
C
Val
C
U U G U G A
G
Stop
Trp
3' 5' 3'
G U
G U
A C
Arg A C
C A Leu
Ser
U A C G
G U
A C A A
C
Lys CU U G G
A UC Pro
Asn G A
U G
C U A U
GA His
Thr C G C
Gln
IIe Arg
Met
Start 3'
Question 8 continues on page 39
– 38 –Question 8 (continued)
Mapping grid (a):
Content Syllabus outcomes Bands
Mod 6 Mutation BIO12–4, BIO12–13 2–5
Marking guidelines (a):
Criteria Marks
• Outlines the series of events from stages 2 to 4 3
• Outlines some events from stages 2 to 4 2
• Provides some relevant information 1
Sample answer:
Stage 2 represents the mutation that occurred in the DNA.
Stage 3 represents the transcription of the mutated DNA into RNA.
Stage 4 represents the translation of the RNA into a polypeptide chain that cannot be made
into a functional protein.
Mapping grid (b):
Content Syllabus outcomes Bands
Mod 6 Mutation BIO12–6, BIO12–13 2–4
Marking guidelines (b):
Criteria Marks
• Describes how a type of mutagen may have caused the change in DNA 2
• Provides some relevant information 1
Sample answer:
A mutagen that may have caused the mutation in stage 2 is UV radiation. It has high energy
photons that can cause the misalignment or change in the DNA when it is undergoing
replication. In this case the mutation resulted in a substitution change, switching an adenine
base for a thymine base.
Question 8 continues on page 40
– 39 –Question 8 (continued)
Mapping grid (c):
Content Syllabus outcomes Bands
Mod 6 Mutation BIO12–4, BIO12–6, 2–5
BIO12–7, BIO12–13
Marking guidelines (c):
Criteria Marks
• Describes the effect of the mutation on the polypeptide
3
• Describes the effect that this change will have on the organism
• Outlines the effect of the mutation on the polypeptide and/or the effect
2
that this change will have on the organism
• Provides some relevant information 1
Sample answer:
Stage 4 would have the Leu (Leucine) amino acid and a Stop codon. The original DNA
strand had a Leu (Leucine) and an Arg (Arginine) amino acid. The Arg (Arginine) has been
replaced with a STOP as a result of the mutation. This will cause the translation process
to end, causing the polypeptide chain to terminate prematurely. This will result in an
incomplete chain that cannot be made into a functional protein. The non-functioning protein
has implications for the health of the organism.
End of Question 8
– 40 –Mod 6 – Question 9 (8 marks)
Compare the processes and effects of point mutations and chromosomal mutations. 8
Include examples in your answer.
Mapping grid:
Content Syllabus outcomes Bands
Mod 6 Mutation BIO12–4, BIO12–6, 2–6
BIO12–13
Marking guidelines:
Criteria Marks
• Provides a comprehensive comparison
• Shows a thorough understanding of the processes and effects of point
8
mutations and chromosomal mutations
• Includes examples of both point mutations and chromosomal mutations
• Shows a sound understanding of the processes and effects of point
mutations and chromosomal mutations 6–7
• Includes examples of point mutations and/or chromosomal mutations
• Outlines some processes and/or effects of point mutations and
chromosomal mutations 4–5
• Includes example(s) of point mutations and/or chromosomal mutations
• Identifies some features of point mutations and/or chromosomal
2–3
mutations
• Provides some relevant information 1
Sample answer:
All mutations make changes to DNA. They occur in DNA replication during:
– mitosis (for cell proliferation and growth of the organism)
– meiosis (for the production of gametes).
Point mutations are changes that occur in a single nucleotide. These changes can be
substitution with the wrong nucleotide, an extra nucleotide added (addition) or a nucleotide
not included (deletion). It is possible to have multiple point mutations along a chromosome.
The order of nucleotide bases determines the protein that is produced by the cell. The point
mutation may have no effect on the protein produced as the change may still enable a triplet
code for the same amino acid, or the change of one amino acid might not have a significant
effect on the resulting protein.
The point mutation may mean that the triplet code initiates a stop sequence, in which case
the protein will not be produced, or it may mean that a range of proteins is not produced at
all or that greater quantities of protein are produced.
Question 9 continues on page 42
– 41 –Question 9 (continued)
A frameshift point mutation is caused by an addition or deletion. Every triplet on the DNA
after the point mutation is affected. This can radically change the protein product of the cell.
Chromosomal mutations involve large sections of the chromosome breaking off completely
(deletion), or breaking off and reassembling in reverse order (inversion) or breaking off and
adhering to another chromosome (translocation).
These breakups of chromosomes move genes to new loci and can break up genes by
splitting the chromosome in the middle of the gene sequence.
These types of chromosome changes can radically affect cell activity.
Chromosomal mutations can also include non-disjunction of homologous chromosomes at
anaphase, resulting in cells with too many or too few chromosomes. These mutations can
have radical effects on cell activity and the organism.
Both point mutations and chromosomal mutations can cause disease. For example, point
mutations: cystic fibrosis, sickle cell anaemia; chromosomal mutations: Down’s syndrome,
Turner’s syndrome.
Both kinds of mutations have also generated new alleles which have in some cases been
adaptive and contributed to evolution.
End of Question 9
– 42 –Mod 6 – Question 10 (6 marks)
‘The application of reproductive technologies in plant and animal breeding limits 6
genetic diversity.’
To what extent is this statement correct?
Mapping grid:
Content Syllabus outcomes Bands
Mod 6 Biotechnology BIO12–6, BIO12–7, 2–6
BIO12–13
Mod 6 Genetic Technologies
Marking guidelines:
Criteria Marks
• Makes an informed judgement about the correctness of the statement
• Shows comprehensive understanding of genetic diversity and the
application of reproductive technologies in plant and animal breeding 6
• Shows a clear connection between genetic diversity and the application
of reproductive technologies in plant and animal breeding
• Makes a judgement about the correctness of the statement
• Shows thorough understanding of genetic diversity and the application of
reproductive technologies in plant and animal breeding 5
• Shows a connection between genetic diversity and the application of
reproductive technologies in plant and animal breeding
• Shows a sound understanding of genetic diversity and the application of
reproductive technologies in plant and animal breeding
4
• Makes a link between genetic diversity and the application of
reproductive technologies in plant and animal breeding
• Shows some understanding of genetic diversity and/or reproductive
2–3
technologies
• Provides some relevant information 1
Sample answer:
Artificial pollination is the transfer of pollen from the anther of one plant to the stigma
of another. Artificial insemination is the collection of semen and its delivery into the
reproductive system of a female, using equipment.
Both technologies can be used to increase the number of offspring with the desired
characteristics that can be generated by one parent and therefore can result in decreased
genetic diversity in the population. Other individuals in the population do not contribute to
the next generation. For example semen from the same bull can be used to impregnate
hundreds of cows, or pollen from one male flower is more likely to be transferred to a female
flower.
Question 10 continues on page 44
– 43 –Question 10 (continued)
However, reproductive technologies can overcome geographical barriers and therefore
allow genes to be spread more widely across the world. These techniques could increase
genetic diversity by allowing interbreeding between geographically separated organisms, and
generating new hybrids.
Answers could include:
Banks of sperm and pollen can be created to preserve endangered genes and allow them
to be more prevalent in subsequent generations. This helps to prevent the loss of genetic
diversity.
End of Question 10
– 44 –Mod 6 – Question 11 (5 marks)
The yeast Saccharomyces cerevisiae cannot naturally ferment the sugar xylose.
Low value biomass, such as straw and wood fibres, contains up to 20% xylose.
S. cerevisiae was modified to enable it to produce ethanol from xylose. Information
on the two species involved in making the modified S. cerevisiae is shown in the table.
Type of Species Relevant End
organism reaction product
Bacteria Burkholderia Utilises xylose Fructose
cenocepacia in metabolism
Yeast Saccharomyces Utilises fructose Ethanol
cerevisiae in metabolism
(a) Explain why biotechnology was needed to modify S. cerevisiae. 2
(b) Two strains of genetically modified S. cerevisiae were produced. The two 3
strains were compared under the same conditions. The results are shown.
25
Concentration of ethanol
20
Strain A
15
(g/L)
Strain B
10
5
0
0 10 20 30 40 50
Time (h)
Justify which of these two strains would be better to use to produce commercial
quantities of ethanol using low value biomass. In your answer, refer to
information from the graph.
Question 11 continues on page 46
– 45 –Question 11 (continued)
Mapping grid (a):
Content Syllabus outcomes Bands
Mod 6 Biotechnology BIO12–5, BIO12–6, 4–6
BIO12–13
Mod 6 Genetic Technologies
Marking guidelines (a):
Criteria Marks
• Relates the use of biotechnology to crossing the species barrier 2
• Provides some relevant information 1
Sample answer:
The organisms are from different genera so genetic material is not usually transferred
between them. The desired genetic material is cut out from the bacteria and inserted into
the yeast genome.
Mapping grid (b):
Content Syllabus outcomes Bands
Mod 6 Genetic Technologies BIO12–5, BIO12–6, 3–6
BIO12–7, BIO12–13
Marking guidelines (b):
Criteria Marks
• Justifies why one of the strains is more suitable to use, with reference to
information from the graph 3
• Links the justification to commercial operation
• Identifies the strain more suited
• Outlines why the strain chosen is preferred, based on information from 2
the graph
• Provides some relevant information 1
Sample answer:
Strain B would be the better strain to use. Strain B has a higher rate of ethanol production
than Strain A. The graph shows that Strain B consistently produced significantly
more ethanol than Strain A. For example, at time 30 hours, Strain A produced 10 g/L
concentration of ethanol and Strain B produced 20 g/L concentration of ethanol. This means
the strain is more efficient and, for the production of commercial quantities, more ethanol will
be produced within a given time frame.
End of Question 11
– 46 –Mod 6 – Question 12 (5 marks)
A woman recently conceived a baby guaranteed to be free from hereditary
breast cancer. Doctors screened for an embryo that was free from a gene
that can cause breast cancer.
The screening was performed due to the long history of this form of cancer
in the family and the fact that any daughter born with the gene would have
a 50–80% chance of developing breast cancer.
(a) Explain the possible impact of this reproductive technology on the genetic 2
composition of the population.
(b) Discuss the use of this genetic technology in the treatment of medical conditions. 3
Mapping grid (a):
Content Syllabus outcomes Bands
Mod 6 Biotechnology BIO12–5, BIO12–6, 4–6
BIO12–13
Marking guidelines (a):
Criteria Marks
• Correctly relates use of the reproductive technology to changes in the
2
genetic composition of the population
• States ONE possible impact of the reproductive technology on the
1
genetic composition of the population
Sample answer:
In the long term, the gene which has a higher chance of developing breast cancer will
become less common in the population, as the gene is selected against. So, fewer people
will suffer breast cancer and because fewer people will have the gene, their offspring are
also more likely not to have the gene.
Question 12 continues on page 48
– 47 –Question 12 (continued)
Mapping grid (b):
Content Syllabus outcomes Bands
Mod 6 Genetic Technologies BIO12–5, BIO12–6, 3–6
BIO12–7, BIO12–13
Marking guidelines (b):
Criteria Marks
• Identifies issues associated with the use of the genetic technology
3
• Provides points for and/or against the use of the genetic technology
• Outlines issue(s) associated with the use of the genetic technology 2
• Provides some relevant information 1
Sample answer:
Genetic technologies may reduce the number of people suffering from certain medical
conditions, enable them to increase their contribution to society and reduce the medical
costs of treatment. This technology may also have some undesired effects.
If pre-fertilisation genetic manipulation were to become more widespread, it would affect
human evolution, as genomes could be chosen and manipulated. Insurance companies
may insist on genetic screening before they would insure and vary insurance conditions
according to the results of the screening.
Ethical guidelines concerning genetic manipulation must be made clear and adhered to so
that personal choice and liberties are not compromised by government or corporations, for
this type of genetic manipulation to result in real positive outcomes.
End of Question 12
– 48 –Mod 6 – Question 13 (4 marks)
Draw a flow chart showing the sequence of events that results in the formation of 4
recombinant DNA.
Mapping grid:
Content Syllabus outcomes Bands
Mod 6 Genetic Technologies BIO12–4, BIO12–5, 2–6
BIO12–7, BIO12–13
Marking guidelines:
Criteria Marks
• Draws a flow chart that clearly shows the sequence of events in the
4
formation of recombinant DNA
• Draws a substantially correct flow chart 3
• Shows some steps in the formation of recombinant DNA 2
• Provides some relevant information 1
Sample answer:
Genome
containing Restriction
desired enzymes
gene
Plasmid of Desired
bacterium gene
DNA Combined in
ligase test tube
Recombinant
plasmid
– 49 –Mod 6 – Question 14 (7 marks)
Describe how technological developments led to the advancement of our knowledge 7
and understanding of inheritance. Support your answer with examples.
Mapping grid:
Content Syllabus outcomes Bands
Mod 5 Heredity BIO12–5, BIO12–6, 2–6
BIO12–7, BIO12–12,
Mod 6 Genetic Technologies
BIO12–13
Marking guidelines:
Criteria Marks
• Shows a comprehensive understanding of how technological
developments led to the advancement of knowledge and understanding
of inheritance 7
• Supports answer with examples
• Identifies relevant technological developments
• Describes their contributions to knowledge and understanding of
inheritance
6
• Shows a sound understanding of the knowledge and understanding
before and after the technological developments
• Supports answer with examples
• Identifies relevant technological developments
• Outlines their contributions to knowledge/understanding of inheritance
• Shows some understanding of the knowledge/understanding before and 4–5
after the technological developments
• Supports answer with an example
• Identifies a technological development
2–3
• Outlines its contribution(s) to knowledge/understanding of inheritance
• Provides some relevant information 1
Answers could include:
• Artificial pollination – Mendel’s Laws
• Microscopy and staining – behaviour of chromosomes – work of Sutton and Boveri
• X-ray crystallography – structure of DNA – work of Rosalind Franklin
• Use of isotopes – show semi-conservative DNA replication – work of Meselson and
Stahl
• Radiation – one gene, one polypeptide – work of Beadle and Tatum
• Gene manipulation
• Gene editing – CRISPR.
– 50 –Module 7 Infectious Disease
Mod 7 – Question 1
All pathogens can be described as
A. infectious.
B. macroscopic.
C. microscopic.
D. viral.
Content Syllabus outcomes Bands Key
Mod 7 Causes of Infectious Disease BIO12–7, BIO12–14 2–3 A
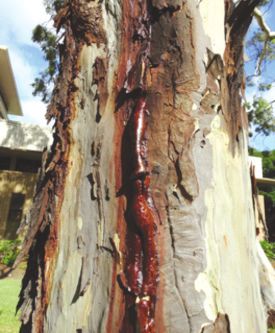
– 51 –Mod 7 – Question 2
The diagram shows a model of disease transmission.
Infectious
agent
Susceptible Reservoir
host
Route of Route of
entry exit
Mode of
transmission
A pathogen was identified as being unadapted to dry conditions and as having the
gastrointestinal tract as the ‘route of entry’ and the ‘route of exit’.
Using this information, what is the most likely mode of transmission?
A. Skin to skin contact
B. Coughing or sneezing
C. Contaminated water supplies
D. Transmission of infected blood products
Content Syllabus outcomes Bands Key
Mod 7 Causes of Infectious Disease BIO12–5, BIO12–14 3–4 C
– 52 –Mod 7 – Question 3
The diagram shows a model of disease transmission.
Infectious
agent
Susceptible Reservoir
host
Route of Route of
entry exit
Mode of
transmission
An epidemiologist suspected that bats were acting as a reservoir for an infectious disease in
humans.
Which condition would need to be met to confirm the epidemiologist’s suspicion?
A. The infectious agent would need to have a mode of entry into humans.
B. The infectious agent would need a mode of transmission from bats to humans.
C. The bats would have to be able to transmit the infectious agent between each other.
D. The susceptible human host must be able to transmit the infectious agent to the reservoir
of bats.
Content Syllabus outcomes Bands Key
Mod 7 Causes of Infectious Disease BIO12–6, BIO12–14 4–5 B
– 53 –You can also read