Effect of YouTube Marketing Communication on Converting Brand Liking into Preference among Millennials Regarding Brands in General and Sustainable ...
←
→
Page content transcription
If your browser does not render page correctly, please read the page content below
sustainability

Article
Effect of YouTube Marketing Communication on
Converting Brand Liking into Preference among
Millennials Regarding Brands in General and
Sustainable Offers in Particular. Evidence from South
Africa and Romania
Rodney Duffett 1 , Dana-Mihaela Petros, anu 2, * , Iliuta-Costel Negricea 3 and Tudor Edu 3
 1   Marketing Department, Faculty of Business and Management Sciences, Cape Peninsula University of
     Technology, Keizersgracht and Tennant Street, Cape Town 8000, South Africa; duffettr@cput.ac.za
 2   Department of Mathematics-Informatics, Faculty of Applied Sciences, University Politehnica of Bucharest,
     Splaiul Independent, ei 313, 060042 Bucharest, Romania
 3   Management-Marketing Department, Faculty of Management-Marketing, Romanian-American University,
     1B Expozitiei Blvd., 1st district, 012101 Bucharest, Romania; costel.negricea@profesor.rau.ro (I.-C.N.);
     tudor.edu@profesor.rau.ro (T.E.)
 *   Correspondence: danap@mathem.pub.ro; Tel.: +40-761-086-656

 Received: 24 December 2018; Accepted: 19 January 2019; Published: 23 January 2019

 Abstract: The omnipresent role of online information and communication technology (ICT) channels
 in the lives of Millennial consumers is universally recognised in industry and academia. The persistent
 usage of ICT platforms such as social media, especially digital video sharing conduits (e.g., YouTube),
 among the Millennial cohort has become an important marketing communication platform for
 organisations to reach this evasive target market. The extensive use of YouTube has generated
 billions of dollars in marketing communication income, but there is limited academic inquiry in
 terms of in developing economies, particularly regarding the effect of online usage and demographic
 factors among Millennials. This paper examines the effect of YouTube marketing communication on
 affective (attitudinal) responses, meaning brand liking and the impact on brand preference, among
 Millennials in two developing economies, Romania and South Africa, as well as the influence of
 usage and demographic factors on the affective (attitudinal) association. A survey was conducted
 among 400 Romanian and 400 South African respondents, and the hypothesised associations
 were evaluated via structural equation modelling (SEM) and multigroup SEM. The results of this
 paper reveal a favourable connection between brand liking and brand preference as a result of
 YouTube marketing communication, making a notable contribution to the limited YouTube inquiry on
 attitude-to-advertising theory in developing economies regarding brands in general and sustainable
 offers in particular. A number of the online usage and demographic factors were also found to
 have an effect on the brand liking and preference association, supporting in the reduction of the
 academic–practitioner gap, and assisting organisations in better understanding Millennials in the
 development of effective marketing communication campaigns on video sharing platforms.

 Keywords: YouTube marketing communication; Millennials; liking; preference; affective (attitude)
 responses; Romania; South Africa; structural equation modelling; hypothesis groups

1. Introduction
     Digital video is one of the fastest growing social media, especially among Millennials (18–34-year
olds), with an estimated 4.5 billion global users and an advertising spending forecast of $37 billion by

Sustainability 2019, 11, 604; doi:10.3390/su11030604                      www.mdpi.com/journal/sustainability
Sustainability 2019, 11, 604                                                                     2 of 24

2022 (across all video sharing platforms). YouTube is predicted to account for nearly a quarter of free
video advertising spending, and over 1 billion hours are watched on YouTube daily. Hence, YouTube
has become a very important communication channel and is commissioning a greater portion of
marketing communication budgets, expressly to reach the Millennial generation group, which stands
to inherit $5 trillion from their Baby Boomer parents [1,2]. Thus, Millennials’ attitudes towards
YouTube marketing communication are of great significance to organisations and their brands, since
they may offer a greater understanding of future consumer behaviour predispositions considering
their incremental growing spending power [2–4] and a number of this cohort members displaying a
particular concern towards the environment [5]. Moreover, over 80% of Millennials watch YouTube on
a monthly basis [6]; hence, organisations cannot ignore this digital video sharing platform to target
this very lucrative cohort. However, Araújo et al. [7] disclosed that there was a dearth of research
that considers quantitative analysis of online video advertising among Millennials; hence, further
inquiry is necessary to understand this cohort’s affective (attitudinal) responses in terms of YouTube
marketing communication.
       There is disagreement regarding how to assess online advertising effectiveness. Social media
metrics are proposed to be an effective measure, but click-through rates do not reveal the influence of
social media marketing communication on consumer affective (attitudinal) responses, which require
a different perspective to examine the aforementioned effectiveness. Social media marketing
communication is mainly driven by consumer desire, so it is imperative to understand the behaviour
motivator, in other words, consumer attitudes, which are main catalysts of marketing communication
exposure [8,9]. Lutz [10] concluded that measuring attitudes was important, since they had an effect on
consumers’ responses to marketing communication. In References [11,12], the authors disclosed that
there were three stages in hierarchy-of-effect models, namely cognitive (awareness and knowledge),
affective (liking and preference), and behavioural (buying intention and purchase). The authors
of [13,14] asserted that emotional/affective responses were seen as a sequence of intense feelings that
may result in immediate or future behavioural responses. Hence, this study considers whether brand
liking can be converted into brand preference due to YouTube marketing communication.
       A number of inquiries have examined consumers’ cognitive and behavioural responses,
perceptions, and other aspects of YouTube marketing communication [7,15–38]. However, if the main
goal of marketing communication is to create a favourable attitude-to-advertising (Aad ) experience
to increase purchase intentions, then a positive affective response to marketing communication
(i.e., advertising) is a fitting measure of advertising effectiveness [11,12]. Several inquiries have
considered various aspects of affective responses [14,39–44] towards various types of YouTube
marketing communication. However, Dehghani et al. [19] reported that there was a lack of research and
knowledge concerning YouTube as an advertising channel for marketers to use as an effective marketing
communication medium in general, as well as in sustainability issues in particular, considering that
many companies nowadays focus on issues outside of the traditional marketing mix in positioning
endeavours, Corporate Social Responsibility (CSR) perspectives often playing a leading role [45].
Furthermore, none of these studies examined the association between liking and preference affective
(attitudinal) responses in terms of the hierarchy-of-effects model, and it is important to reduce the
academic–practitioner gap.
       Additionally, most of the abovementioned research was conducted in developed economies, where
Millennials have greater and superior access to sound information and communication technology
(ICT) infrastructure. Furthermore, the growth of social media has begun to slow in many developed
economies, whereas developing economies are still showing robust growth [46]. There is also limited
academic inquiry in developing economies concerning video sharing users, whose attitudes and usage
factors may be divergent compared to developed economies (such as the United States (US) and
Western Europe economies) owing to differing cultural characteristics, poor ICT infrastructure, and
slower Internet speeds (especially in Africa) [47–49]. Additionally, there are limited cross-country
studies, and few have considered the effect of independent variables, such as usage and demographic
Sustainability 2019, 11, 604 3 of 24
factors, on YouTube marketing communication. Westenberg [37] noted that further YouTube research
should use large sample sizes in different populations (countries). Rodriguez [32] indicated that social
media (YouTube) were still growing and more research was required to understand the most effective
conduits to initiate YouTube advertising. Bolton et al. [3] also agreed that previous social media
research led to more questions than answers and advocated that few studies considered whether there
were differences within the Millennial cohort. Balakrishnan and Manickavasagam [16] revealed that
not much was known about the influence of different user patterns and demographics on consumer
attitudes towards social media advertising, while the authors of [50] uncovered that social media
frequent users were more predisposed to acquiring green offers. Hence, this empirical investigation
study not only seeks to ascertain Millennials’ affective (attitudinal) responses based on YouTube
marketing communication (i.e., conversion of brand liking into preference), but also considers the
effect of usage and demographic factors in two developing economies from two continents, Europe
and Africa, namely Romania and South Africa.
The remainder of the paper is organised as follows. Section 2, Materials and Methods, presents an
analysis regarding YouTube and marketing communication, millennial cohort, attitudes, and research
methods. Afterwards, Section 3 describes the results regarding usage and demographic factors along
with hypothesis testing. Section 4, Discussion and Implications, analyses key findings, theoretical
implications, managerial implications, as well as limitations and future research directions.
2. Materials and Methods
2.1. YouTube and Marketing Communication
YouTube is the second largest search engine after Google (the owner of YouTube); the third most
frequented website; and the largest of the video content sharing and creation websites in the world [51].
YouTube is free in terms of membership, uploading, and/or viewing content, which means that this
digital ICT platform attracts a huge audience. YouTube has 1.5 billion monthly users; two-thirds of
the users are aged 18–44; over 400 hours of video are uploaded every minute; 1 billion hours of video
content are viewed on a daily basis; and over 50% of YouTube uploaded files are viewed via mobile
devices [6,52,53].
YouTube provides organisations and brands with an interactive ICT platform to share new
and existing video content with consumers. YouTube, also dubbed the “content community” [54],
is considered an important antecedent of the sharing economy or collaborative consumption realities
as collective usage, with a significant impact on sustainability, is possible mainly through online
social network interactions [55–57]. YouTube’s contribution to collaborative behaviour is ensured
through the videos uploaded by organisations or individuals, among which a distinct percentage
display social or environmental endeavours [58–60]. A personalised-brand YouTube channel assists
in creating the brand’s online presence and provides users with a platform to view all of the brand’s
video content in their own time, and analytics help to observe what video content is the most effective.
Brands can optimise their efforts by paying for promotion and sharing popular video content to attain
greater awareness and exposure among consumers, as well as an improved transparency regarding
sustainability issues [61]. Organisations can also use YouTube paid promotion as a cost-effective and
fast way to promote topical video content. YouTube offers several types of marketing communication,
namely display, overlay, in-search discovery, sponsored cards, video (skippable or non-skippable), and
bumper [6,52,53]. The different advertising forms are collectively considered in this study to provide a
complete overview of YouTube as a marketing communication platform.
YouTube marketing communication effectiveness can be evaluated via analytics based on
click-through view rates, completed video views and/or number of shares, and comments and
likes [36,51,53]. However, YouTube’s marketing communication impact can also be assessed via a
variety of cues, such as advertisement recall, engagement, understanding and feedback [32], and/or
through consumer reviews, which express sentiment towards marketing communication and haveSustainability 2019, 11, 604 4 of 24
influence on the audience’s future purchase behaviour. However, a majority of academic inquiries
assess YouTube marketing communication effectiveness via qualitative in-depth interviews [34,37,62],
content analysis [7,14,21,36], and/or attitudinal surveys [15,16,19,20,22,23,26,28,29,35,39–44,63]. This
study has adopted the latter approach, using a cross-sectional approach to assess Millennials’ affective
Aad responses regarding YouTube marketing communication.
2.2. Millennial Cohort
Cohort theory postulates that divergent population segments can be separated into distinguishing
generational groups based on events that have transpired over a certain time period when they were
born. Consequently, each cohort displays homogeneous values; attitudes, interests, opinions (lifestyle);
needs; behaviour; and consumption patterns due to analogous events; technology innovation and
development; and experiences, which occurred over a particular time period [64,65]. Hence, cohort
theory is important to organisations and their brands, as they provide an opportunity to adapt
marketing communication strategies to appeal to each of the cohort’s precise characteristics, needs,
and wants. The Millennial cohort comprises those born between 1982 and 2002, being of huge interest
to organisations due to its members’ incremental growing spending power [2,3,66].
This cohort is the first generation to grow up with computers; Internet access; download music,
movies, and videos; mobile communication; instant messaging and social media; and use an array
of interactive mobile devices (iPods, tablets, and smartphones) in the digital era. Consequently,
this omnipresent environment (and its interaction with Millennials) has been described as a driving
force of online purchases and has the greatest social media penetration in comparison to all previous
generational groups. Three quarters of the working population will be composed of Millennials
by 2025, and this cohort already has significant spending power ($600 billion on an annual basis).
Additionally, Millennials will represent 35% of global daily consumer spending by 2030 and are set
to inherit $5 trillion from their parents [2–4,6,67]. Moreover, many of these individuals display a
particular concern towards sustainability through their direct actions [61] or through their active
involvement in collaborative consumption [5]. Considering these perspectives, together with the fact
that over 80% of Millennials watch YouTube on a monthly basis, organisations cannot ignore this digital
video sharing platform to target this very lucrative cohort. Nevertheless, Araújo et al. [7] disclosed
that there was a dearth of research considering quantitative analysis of online video advertising
among Millennials. Thus, further inquiry is necessary to understand this cohort’s affective (attitudinal)
responses in terms of YouTube marketing communication, translated into the potential conversion of
brand liking into preference.
2.3. Attitudes
Aad can be defined as a consumer’s predisposition after exposure to a marketing communication
stimulus, which results in a tendency to behave in a consistently favourable or unfavourable way [10].
Academia and practitioners generally agree that sequences of response stages occur, known as response
hierarchy models, which range from awareness of a stimulus (e.g., brand), knowledge, interest, positive
sentiments, and ultimately climax in a purchase. Moreover, each response hierarchy stage should be
accomplished prior to behaviour or purchase. Hence, organisations frequently use these stages as
objectives, which are also used as measures to assess marketing communication effectiveness [11,12].
A number of advertising models were proposed to examine the different hierarchical stages, but
these models were established via traditional advertising. The hierarchy-of-effects model considers
three stages, namely cognitive responses (awareness and knowledge), affective responses (liking and
preference), and behavioural responses (conviction and purchase) [11,12].
2.3.1. YouTube Affective Response Hypotheses
MacKenzie and Lutz [68] and Shavitt, Lowrey, and Haefner [69] found that entertaining
advertisements resulted in favourable attitudes towards products. Statista noted that YouTube wasSustainability 2019, 11, 604 5 of 24
primarily developed for entertainment and information purposes [70]. Chungviwatanant et al. [39]
confirmed that entertainment (affective responses) had a large positive effect on consumer attitudes
towards skippable in-stream advertising on YouTube but advocated that more research was required
to ascertain other factors’ influence on the affective response. Zhang and Mao [44] stressed that
consumers’ general dislikes or likes of social media advertising were transferred to their attitudes
and behaviour towards social media display advertising via advertisement clicks. Additionally,
Nalewajek and Macik [58] posited that attitudes towards responsible consumption could be changed
based on behavioural changes induced by social media. Araújo et al. [7] found that YouTube videos
containing advertising resulted in greater liking among Brazilians in comparison to Americans (US)
and British (UK) but indicated that there was a lack of inquiry that quantitatively analysed online video
advertising among young consumers in developing and developed economies. This study aims to
enrich the literature by investigating the impact of YouTube marketing communication on the affective
(attitudinal) responses, namely whether this online environment can influence the transformation of
brand liking into preference. Thus, hypothesis H1a was formulated:
• H1a. Brand liking has a positive effect on brand preference among Millennials due to YouTube
marketing communication.
Additionally, the growth of social media channels such as YouTube has started to slow in
many developed economies as they begin to reach saturation, while the number of social media
users is rapidly growing in developing economies with the improvement of ICT infrastructure,
and the incremental growth of mobile devices—over half of YouTube content is viewed via mobile
devices [6,51,53,70]. In Reference [16], Balakrishnan and Manickavasagam concurred that many studies
had considered social media advertising in Western countries such as the US and Europe, whereas
similar studies should be conducted in developing economies due to fast penetration of social media in
these countries. Edu, Lotter, Negricea and Avram [71] established that young and educated Romanians
and South Africans exhibited similar budget allocation in terms of data and voice and communication.
Hence, the choice of these two developing economies is justified, the discussion leading to the building
of the following hypotheses:
• H1b. Brand liking has a positive effect on brand preference among Millennials owing to YouTube
marketing communication in a European economy (Romania).
• H1c. Brand liking has a positive effect on brand preference among Millennials due to YouTube
marketing communication in an African economy (South Africa).
Considering the Internet download speed country ranking compiled by Cable Co [72] within
the top 200 countries, in the first place, Singapore can be found, followed by 11 European countries,
with Romania being ranked the fifth, while the first African country is Madagascar on the 22nd
place, followed by Kenya on the 64th and South Africa on the 76th place. Moreover, according to
the International Telecommunication Union [73], the percentage of individuals using the Internet is
significantly higher in Europe compared to Africa (77.2% versus 22.1%—values for 2017), while in
Romania, it is higher than in South Africa (59.5% versus 54%—values for 2016), although a constant
narrowing of the gap between the two countries has been noticed since 2012. Hence, seeing these
differences in individual Internet usage and download speed, a discrepancy in the importance
attributed by individuals from the two countries to YouTube as a marketing communication means
can be expected, leading to the proposal of hypothesis H1d:
• H1d. Brand liking has a significantly larger positive effect on brand preference on
European Millennials (Romania) than on African Millennials (South Africa) due to YouTube
marketing communication.
2.3.2. YouTube Usage Factors’ Hypotheses
A majority of studies only consider YouTube usage factors as descriptive statistics, and
not as independent variables to explain affective (attitudinal) response measures. The mostSustainability 2019, 11, 604 6 of 24
frequently stated YouTube usage factors include: Access devices, online videos viewing
frequency, length of YouTube viewership time, subscription numbers, and YouTube video
sharing [16,17,23,25,26,39,42,50,74]. Regarding studies employing YouTube usage variables as
independent variables, Chungviwatanant et al. [39] uncovered that a higher attitude score about
a skippable in-stream ad was recorded in the case of people watching YouTube videos between 1 and 4
hours per week and using smart TVs in comparison with desktops, laptops, smart phones, and tablets.
Additionally, Balakrishnan and Manickavasagan [16] established that people watching YouTube for
less than 1 hour and more than 3 hours had an unfavourable attitude towards YouTube advertising.
Furthermore, the authors of [75,76] maintained that there was heterogeneity within the Millennial
cohort, and Bolton et al. [3] agreed that further research should establish if there were significant
differences within the Millennial cohort in terms of social media usage. Thus, in order to develop the
literature, this inquiry considers several YouTube usage factors. Due to the little research on YouTube
usage factors employed as independent variables to explain affective (attitudinal) responses owing to
YouTube marketing communication, the study builds on Duffett’s research [77] by applying four usage
factors (access; length of usage; log-on frequency; log-on duration) employed in the investigation of
the impact of Facebook advertising on the South African Generation’s Y affective attitudes, while the
fifth usage factor (number of advertisements viewed on YouTube) was developed based on literature.
The first usage factor, means of accessing, was selected to investigate whether differences in the
conversion of brand liking into preference could be explained based on how YouTube was accessed by
Romanian and South African Millennials assessed together, as well as separately. Thus, hypotheses
H2a, H2b, and H2c were proposed:
• H2a. The effect of brand liking on brand preference varies according to how Millennials
access YouTube.
• H2b. The effect of brand liking on brand preference varies according to how Millennials access
YouTube in Romania.
• H2c. The effect of brand liking on brand preference varies according to how Millennials access
YouTube in South Africa.
The second usage factor, measuring the number of years of YouTube usage, was chosen to assess
potential differences that might occur in the transformation of brand liking into preference considering
the user experience with this online platform in both contexts, grouped Millennials and distinct per
each country. Hence, hypotheses, H3a, H3b, and H3c were proposed:
• H3a. The effect of brand liking on brand preference diverges owing to the number of years
Millennials use YouTube.
• H3b. The effect of brand liking on brand preference diverges owing to the number of years
Millennials use YouTube in Romania.
• H3c. The effect of brand liking on brand preference diverges owing to the number of years
Millennials use YouTube in South Africa.
The third usage factor, YouTube log-on frequency, was picked to comprehend if the potential
change of brand liking into preference could be influenced by the intensity with which YouTube is
accessed, the appraisal being envisaged for the combined Millennial group and for both countries
individually. Thus, hypotheses, H4a, H4b, and H4c were proposed:
• H4a. The effect of brand liking on brand preference differs as a result of Millennials’ YouTube
log-on frequency.
• H4b. The effect of brand liking on brand preference differs as a result of Millennials’ YouTube
log-on frequency in Romania.
• H4c. The effect of brand liking on brand preference differs as a result of Millennials’ YouTube
log-on frequency in South Africa.Sustainability 2019, 11, 604 7 of 24
The fourth usage factor, YouTube log-on duration, was retained to appraise whether the time spent
on YouTube could impact on the conversion of brand liking into preference in the case of Millennials,
in general, and in the case of the individual Romanian and South African ones, in particular. Thus,
hypotheses H5a, H5b, and H5c were drafted:
• H5a. The effect of brand liking on brand preference varies due to Millennials’ YouTube
log-on duration.
• H5b. The effect of brand liking on brand preference varies due to Millennials’ YouTube log-on
duration in Romania.
• H5c. The effect of brand liking on brand preference varies due to Millennials’ YouTube log-on
duration in South Africa.
The fifth usage factor, number of advertisements viewed on YouTube, was developed based on the
log-on frequency and duration factors and variables related to YouTube content, aiming to test if the
change of brand liking into preference could be explained by the number of advertisements watched
on YouTube by Romanian and South African Millennials evaluated together, as well as separately.
Hence, hypotheses H6a, H6b, and H6c were formulated:
• H6a. The effect of brand liking on brand preference differs as a result of the number of
advertisements Millennials view on YouTube.
• H6b. The effect of brand liking on brand preference differs as a result of the number of
advertisements Millennials view on YouTube in Romania.
• H6c. The effect of brand liking on brand preference differs as a result of the number of
advertisements Millennials view on YouTube in South Africa.
2.3.3. YouTube Demographic Factors’ Hypotheses
As mentioned previously, a majority of studies only consider YouTube demographic factors as
descriptive statistics and not as independent variables to explain affective (attitudinal) response
measures. The most frequently stated YouTube demographic factors include: Age, gender,
income, population group and education [7,17,19,20,23,25,29,32,35,37,42,44,63,74]. Balakrishnan and
Manickavasagam [16] established that little was known about the association of usage patterns and
demographic factors on attitudes towards social media marketing communication. However, in a
broader analysis, Taylor et al. [78] uncovered that women considered social network advertisements to
be more entertaining than men, while in a narrower inquiry, Chungviwatanant et al. [39] ascertained
that male respondents displayed more positive attitudes to skippable in-stream YouTube advertising,
whereas female respondents showed greater irritation to the YouTube advertisements. Furthermore,
such divergent results in terms of the influence of gender on Aad regarding various forms of YouTube
marketing communication can also be found in the works of Araujo et al. [7], Rodriguez [32], and Todd
and Melancon [79]. Considering these divergent perspectives, in an attempt to shed more light into the
potential impact of gender on the affective (attitudinal) responses induced by YouTube communication,
this paper focuses on probing gender’s influence on the conversion of brand liking into preference for
Romanian and South African Millennials assessed together, as well as separately, thus hypotheses H7a,
H7b, and H7c being formulated:
• H7a. The effect of brand liking on brand preference owing to YouTube marketing communication
differs as a result of Millennials’ gender.
• H7b. The effect of brand liking on brand preference owing to YouTube marketing communication
differs as a result of Millennials’ gender in Romania.
• H7c. The effect of brand liking on brand preference owing to YouTube marketing communication
differs as a result of Millennials’ gender in South Africa.
IGI [75] and Zambodla [76] maintained that Millennials should not be treated as a single target
market segment, since younger members being in different life stages compared to the oldest cohortSustainability 2019, 11, 604 8 of 24
members prompted a different life outlook. Regarding young people, Taylor et al. [78], investigating
three age groups (15–18 years old; 19–24 years old; 25+ years old), uncovered that individuals aged
19 to 24 appraised social network advertisements to be more informative compared to the other
two age groups, with the authors inferring, based on the findings, more positive attitudes for such
advertisements from this age group. Balakrishnan and Manickavasagan [16], investigating several
age groups, concluded that respondents between 20 and 30 years old and those between 41 and 50
years old had a favourable attitude towards YouTube advertising. Although some evidence exists
regarding the relationship between age and attitude towards social network advertising, there is a
dearth of research on the impact of age on the affective (attitudinal) responses based on YouTube
communication. To address this research gap, the present study, expanding on Duffett’s research [77]
on the impact of Facebook advertising on the South African Generation’s Y affective attitudes, assesses
three age groups (18–22 years old; 23–27 years old; 28–32 years old) as different outcomes are expected
across age groups [78] because of the heterogeneity uncovered in the Millennial cohort [75,76].
Therefore, the following hypotheses are considered to reduce the aforementioned research gaps:
• H8a. The effect of brand liking on brand preference due to YouTube marketing communication
varies owing to Millennials’ age.
• H8b. The effect of brand liking on brand preference due to YouTube marketing communication
varies owing to Millennials’ age in Romania.
• H8c. The effect of brand liking on brand preference due to YouTube marketing communication
varies owing to Millennials’ age in South Africa.
2.4. Research Methods
2.4.1. Variable Measurements
The research instrument was adapted from Duffett [77]. Thus, a self-administered questionnaire,
comprising three main sections, was developed. The opening section collected data via one nominal
and four ordinal scales, assessing in terms of Millennials’ YouTube usage the following factors
(independent variables): How the video sharing platform was accessed (with three options: Mobile
device; PC; mobile device and PC); the number of years that YouTube was used (with five options:
≤1 Year; 2 Years; 3 Years; 4 Years; ≥5 Years); frequency of log-on (with five options: Daily; 2–4 times a
week; once a week; 2–4 times a month; once a month); duration spent per log-on (with five options:
≤1 Hour; 2 Hours; 3 Hours; 4 Hours; ≥5 Hours); and the number of advertisements viewed per
log-on (with five options: None; ≤5; 6–10; 11–15; ≥16). The next section comprised the affective
(attitudinal) measures, namely two five-item constructs for “liking” and “preference”. These affective
(attitudinal) response measures were evaluated via five-point verbal Likert scales, which ranged from
“strongly disagree” to “strongly agree”. The final section gathered data on the Millennial respondents’
demographic factors through one nominal scale for gender and one ordinal scale for age (with three
options: 18–22 years old; 23–27 years old; 28–32 years old).
The questionnaire was drafted in English and translated in Romanian to ensure wording
consistency [80]. Moreover, all scale options were easily retained for the Romanian sample and
an exact translation was possible for all of them. Additionally, according to Babakus et al. [81],
the five-point verbal Likert scales employed to inquire about the affective (attitudinal) response
measures, inserted in the questionnaire through displaying all scale options, are an adequate solution
to improve the quantity and quality of the collected data. Both versions of the questionnaire (English
and Romanian) were piloted using 20 Millennial respondents from each country [80]. For Romania,
the scale options were displayed in Romanian and English, the respondents being asked whether they
observed word inconsistencies. Considering that no observations or recommendations were made
regarding the questionnaire, a compatibility between the English and Romanian versions was assumed.
Furthermore, considering the scale option number and wording compatibility, one can conclude thatSustainability 2019, 11, 604 9 of 24
the two questionnaire versions can be deemed homogeneous according to de Jonge et al. [82], and,
hence, suitable for a cross-country comparison.
Based on the formulated hypotheses and defined variable measurements, the conceptual model
was built. Figure
Sustainability 2019, 11,1xpresents
FOR PEERthe conceptual model of the proposed approach.
REVIEW 9 of 24
Figure 1. Conceptual model of the proposed approach.
Figure 1. Conceptual model of the proposed approach.
2.4.2. Sampling and Collection of Data
2.4.2. Sampling and Collection of Data
The research population included Romanian and South African Millennials (aged 18–32 years
old), The
whoresearch population
had previously included
used YouTube Romanian
and hadand South African
perceived YouTubeMillennials
marketing (aged 18–32 years
communication.
old), who had previously used YouTube and had perceived YouTube marketing communication.
A sequential (also known as multistage) sampling technique was used to sample 800 Millennial A
sequential (also known as multistage) sampling technique was used to sample 800
respondents (400 in Romania and 400 in South Africa). Quota sampling was firstly used to secure Millennial
arespondents
representative(400sample,
in Romania and of
in terms 400 in South
gender andAfrica). QuotaSouth
age, among sampling was firstly
Africans used to secure
and Romanians a
[83,84].
representative sample, in terms of gender and age, among South Africans and Romanians
Next, only Millennial respondents were requested to voluntarily partake in the survey [19]. [83,84].
Next,
The only Millennial
questionnaires respondents
were distributedwere
viarequested to voluntarily
online and paper means partake in thethe
to collect survey
data [19]. The
and were
questionnaires were distributed via online and paper means to collect the data and were self-
self-administered, which allowed the respondents to be surveyed without assistance. Online data
administered, which allowed the respondents to be surveyed without assistance. Online data
collection was used in Romania, whereas a face-to-face paper questionnaire was distributed, via
collection was used in Romania, whereas a face-to-face paper questionnaire was distributed, via
snowball sampling, in South Africa, owing to the poor response rate of online studies in this
snowball sampling, in South Africa, owing to the poor response rate of online studies in this country
country [15,85]. All responses were treated as confidential and the survey was completely anonymous,
[15,85]. All responses were treated as confidential and the survey was completely anonymous, since
since no personal or contact particulars were requested. Informed consent was obtained from all
no personal or contact particulars were requested. Informed consent was obtained from all Millennial
Millennial respondents who participated in the research.
respondents who participated in the research.
2.4.3. Data Analysis
2.4.3. Data Analysis
Confirmatory factor analysis using SPSS and Amos was employed to establish reliability and
Confirmatory factor analysis using SPSS and Amos was employed to establish reliability and
convergent and divergent validity. Furthermore, Structural equation modelling (SEM) was used to
convergent and divergent validity. Furthermore, Structural equation modelling (SEM) was used to
assess the hypothesised association between the liking and preference measures, owing to YouTube
assess the hypothesised association between the liking and preference measures, owing to YouTube
marketing communication for the combined and Romanian and South African samples. Multigroup
marketing communication for the combined and Romanian and South African samples. Multigroup
SEM was used to test the effect of the country, usage, and demographic factors of the abovementioned
SEM was used to test the effect of the country, usage, and demographic factors of the abovementioned
hypothesised associations. The path coefficients for liking and preference attitudinal responses, as a
result of YouTube marketing communication, were used to establish if there was significance for each
of the combined, Romanian, and South African samples. The country, usage, and demographic
factors for the combined sample, Romanian, and South African path coefficients were assessed viaSustainability 2019, 11, 604 10 of 24
hypothesised associations. The path coefficients for liking and preference attitudinal responses, as a
result of YouTube marketing communication, were used to establish if there was significance for each
of the combined, Romanian, and South African samples. The country, usage, and demographic factors
for the combined sample, Romanian, and South African path coefficients were assessed via multigroup
SEM to ascertain if they were significant, assessing the measurement model prior to the factors’ impact
evaluation [86].
3. Results
3.1. Usage and Demographic Factors
The sample comprised 800 Millennials living in Romania and South Africa, who were
representative of gender and age in these developing economies [83,84]. Table 1 provides a complete
overview of the usage and demographic factors of Millennial respondents for the combined, Romanian,
and South African samples. One can find in the Supplementary Materials, comprehensive details,
namely the document “YouTube Affective–Descriptive Statistics and Central Tendency”, containing
the tables exported from the IBM SPSS Statistics Software, comprising the affective–descriptive
statistics and the central tendency for the variables used in the study, the designed questionnaire
used for collecting the data and the Sheet “Dataset” of the “The Centralised Dataset” Excel Workbook,
containing the whole database.
Table 1. YouTube usage and demographic factors’ descriptive statistics.
Analysed Aspects Concerning Combined Sample Romania South Africa
YouTube’s Usage and Characteristics (n = 800) (n = 400) (n = 400)
Usage Characteristic n % n % n %
Mobile device 121 15.1 50 12.5 71 17.8
Access PC 170 21.3 31 7.7 121 30.2
Mobile device and PC 509 63.6 319 79.8 208 52.0
≤1 year 92 11.5 24 6.0 68 17.0
2 years 122 15.2 25 6.2 97 24.2
Length of usage 3 years 131 16.4 26 6.5 105 26.3
4 years 92 11.5 35 8.8 57 14.2
≥5 years 363 45.4 290 72.5 73 18.3
Daily 339 42.4 259 64.7 80 20.0
2–4 times a week 200 25.0 92 23.0 108 27.0
Log-on frequency Once a week 115 14.4 26 6.5 89 22.2
2–4 times a month 93 11.6 19 4.8 74 18.5
Once a month 53 6.6 4 1.0 49 12.3
≤1 hour 304 38.0 160 40.0 144 36.0
2 hours 265 33.1 150 37.5 115 28.7
Log-on duration 3 hours 103 12.9 38 9.5 65 16.3
4 hours 60 7.5 12 3.0 48 12.0
≥5 hours 68 8.5 40 10.0 28 7.0
None 249 31.1 155 38.8 94 23.5
≤5 328 41.0 168 42.0 160 40.0
Advertisement viewership # 6–10 130 16.3 49 12.2 81 20.3
11–15 49 6.1 12 3.0 37 9.2
≥16 44 5.5 16 4.0 28 7.0
Male 377 47.1 179 44.8 198 49.5
Gender
Female 423 52.9 221 55.2 202 50.5
18–22 266 33.2 131 32.8 135 33.7
Age (years) 23–27 303 37.9 148 37.0 155 38.8
28–32 231 28.9 121 30.2 110 27.5Sustainability 2019, 11, 604 11 of 24
3.2. Confirmatory Factor Analysis and Structural Equation Models and Hypothesis Testing
Using confirmatory factor analysis, the affective (attitudinal) response measures’ factor loadings,
average variance extracted (AVE), Cronbach’s alpha (α), and composite reliability (CR) are displayed
in Table 2.
Table 2. YouTube marketing communications affective (attitudinal) responses—confirmatory
factor analysis, factor loadings, average variance extracted (AVE), composite reliability (CR) and
Cronbach’s alpha.
Affective (Attitudinal)
Factor Loadings AVE CR Cronbach’s α
Responses
Liking Total SA Rom Total Rom SA Total Rom SA Total Rom SA
Like brands more (1) 0.858 0.739 0.849
Adds to enjoyment (2) 0.877 0.784 0.907
Likeable and pleasant (3) 0.877 0.801 0.911 0.699 0.793 0.539 0.920 0.950 0.851 0.906 0.926 0.795
Entertaining and fun (4) 0.711 0.793 0.820
Like advertised products (5) 0.844 0.511 0.821
Preference
Look for advertised products (1) 0.799 0.672 0.876
Relevant to interests (2) 0.858 0.720 0.936
Stimulate brand preference (3) 0.917 0.859 0.958 0.677 0.739 0.508 0.912 0.934 0.836 0.893 0.946 0.757
Gain interest in products (4) 0.748 0.656 0.853
Prefer promoted brands (5) 0.781 0.632 0.814
Note: Rom = Romania, SA = South Africa.
The Cronbach’s α and CR reliability assessment values for the combined, Romanian, and South
African samples were over 0.7 and 0.8, respectively, which is suggestive of acceptable reliability [87].
The liking and preference attitude factor loadings ranged from 0.511 to 0.958, and AVE values ranged
from 0.508 to 0.793 for the combined, Romanian, and South African samples, which is indicative of
convergent validity, since the values are over 0.5 [87]. The AVE square root values of the combined
(0.836 and 0.822), Romanian (0.891 and 0.860), and South African (0.734 and 0.713) samples for
liking and preference attitude constructs were larger than the correlation between the constructs for
the combined (0.655), Romanian (0.672), and South African (0.430) samples, thereby indicative of
discriminant validity [88].
The SEM goodness-of-fit measures and path coefficients, in the testing of the hypotheses, are
considered below (Table 3).
Table 3. Hypothesis testing, structural equation modelling (SEM) goodness-of-fit measures and
significant outcomes. Root mean square error of approximation (RMSEA); Tucker Lewis index (TLI);
Normed-fit index (NFI); Goodness-of-fit index (GFI); Comparative fit index (CFI); Standardised root
mean square residual (SRMR).
Hypothesis χ2 /df RMSEA TLI NFI GFI CFI SRMR Significance Support
H1a 0.365 0.000 1.000 0.999 0.999 1.000 0.004 p < 0.001 Yes
H1b 0.456 0.000 1.000 0.999 0.997 1.000 0.008 p < 0.001 Yes
H1c 0.218 0.000 1.000 0.998 0.999 1.000 0.084 p < 0.001 Yes
H1d 1.446 0.024 0.992 0.992 0.990 0.998 0.034 p < 0.05 Yes
H2a 1.579 0.027 0.985 0.982 0.989 0.997 0.039 - No
H2b 1.634 0.042 0.977 0.985 0.971 0.994 0.034 p < 0.05 Yes
H2c 1.083 0.014 0.990 0.974 0.984 0.998 0.041 - No
H3a 2.234 0.039 0.944 0.977 0.962 0.987 0.043 p < 0.05 Yes
H3b 2.122 0.053 0.965 0.982 0.962 0.990 0.048 p < 0.05 Yes
H3c 1.307 0.028 0.943 0.951 0.967 0.986 0.040 - No
H4a 1.137 0.021 0.985 0.987 0.982 0.996 0.074 p < 0.05 Yes
H4b 2.519 0.062 0.951 0.968 0.942 0.980 0.020 p < 0.05 Yes
H4c 1.167 0.021 0.985 0.987 0.982 0.996 0.062 p < 0.05 Yes
H5a 2.111 0.037 0.953 0.980 0.989 0.989 0.015 p < 0.001 Yes
H5b 3.305 0.076 0.909 0.964 0.930 0.974 0.036 p < 0.001 YesSustainability 2019, 11, 604 12 of 24
Table 3. Cont.
Hypothesis χ2 /df RMSEA TLI NFI GFI CFI SRMR Significance Support
H5c 1.272 0.026 0.949 0.954 0.972 0.988 0.025 p < 0.05 Yes
H6a 1.848 0.033 0.961 0.981 0.977 0.991 0.033 p < 0.05 Yes
H6b 2.891 0.069 0.934 0.973 0.950 0.982 0.056 - No
H6c 0.787 0.001 1.000 0.974 0.985 1.000 0.033 p < 0.05 Yes
H7a 1.085 0.010 0.999 0.995 0.993 1.000 0.017 - No
H7b 2.844 0.068 0.958 0.977 0.958 0.985 0.035 p < 0.05 Yes
H7c 0.427 0.000 1.000 0.993 0.996 1.000 0.016 - No
H8a 1.910 0.034 0.977 0.985 0.979 0.992 0.032 p < 0.05 Yes
H8b 2.842 0.068 0.939 0.970 0.945 0.980 0.062 i < 0.001, p < 0.05 Yes
H8c 1.291 0.027 0.968 0.955 0.971 0.989 0.061 - No
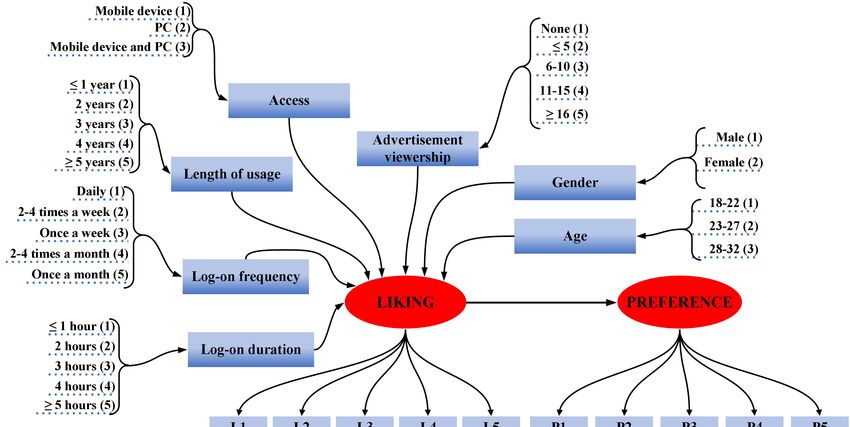
The influences of YouTube usage characteristics and demographic factors on the affective
(attitudinal) association were assessed using standardised coefficients. The results are presented
in Figure 2 and Table 4.
Table 4. Influence of YouTube usage characteristics and demographic factors on the affective
(attitudinal) association.
Combined (n =
Independent Variables Romania (n = 400) South Africa (n = 400)
800)
Usage Characteristics β Sig β Sig β Sig
South Africa (1) 0.66
Country p < 0.05 - -
Romania (2) 0.75
Mobile device (1) 0.84 0.58 0.76
p < 0.05
Access PC (2) 0.79 - 0.59 0.57 -
(3) – (2)
Mobile device and PC (3) 0.80 0.82 0.65
≤1 year (1) 0.94 0.53 0.74
2 years (2) 0.83 0.25 0.78
p < 0.05 p < 0.05
Length of usage 3 years (3) 0.57 0.25 0.49 -
(1) – (3) (1) – (2 and 3)
4 years (4) 0.35 0.92 0.35
≥5 years (5) 0.90 0.92 0.89
Daily (1) 0.88 0.89 0.96
2–4 times a week (2) 0.57 0.37 p < 0.05 0.17
p < 0.05 p < 0.05
Log-on frequency Once a week (3) 0.87 0.75 (3, 4, and 5) – 0.87
(5) – (2) (3) – (2)
2–4 times a month (4) 0.70 0.75 (2) 0.55
Once a month (5) 0.96 0.75 0.74
≤1 hour (1) 0.77 0.73 0.66
2 hours (2) 0.87 0.86 0.33
p < 0.001 p < 0.001 p < 0.05
Log-on duration 3 hours (3) 0.69 0.48 0.75
(5) – (3) (4 and 5) – (3) (5) – (4)
4 hours (4) 0.56 0.79 0.13
≥5 hours (5) 0.82 0.79 0.79
None (1) 0.69 0.73 0.30
≤5 (2) 0.87 0.83 0.78
Advertisement p < 0.05 p < 0.05
6–10 (3) 0.56 0.55 - 0.53
viewership # (2) – (1) (4 and 5) – (3)
11–15 (4) 0.85 0.52 0.60
≥16 (5) 0.91 0.52 0.60
Sociodemographic characteristics
Male (1) 0.81 0.85 p < 0.05 0.66
Gender - -
Female (2) 0.79 0.70 (1) – (2) 0.58
18–22 (1) 0.72 0.70 0.68
p < 0.05 p < 0.001
Age (years) 23–27 (2) 0.81 0.79 0.52 -
(3) – (1 & 2) (3) – (1 and 2)
28–32 (3) 0.87 0.87 0.95
Note a: p = statistical significance level. Note b: (X) – (Y) = comparison between statistically significant categories.H8c 1.291 0.027 0.968 0.955 0.971 0.989 0.061 - No
The influences of YouTube usage characteristics and demographic factors on the affective
(attitudinal)
Sustainability 2019, 11, 604association were assessed using standardised coefficients. The results are presented in 13 of 24
Figure 2 and Table 4.
Figure 2. Significant standardised coefficients.
Figure 2. Significant standardised coefficients.
Table 4. Influence of YouTube usage characteristics and demographic factors on the affective
(attitudinal) association.Sustainability 2019, 11, 604 14 of 24
Analysing the results depicted in Tables 3 and 4, the following findings have been drawn:
• H1: Liking→preference. The goodness-of-fit measures produced very good statistics, according
to Hooper, Coughlan, and Mullen, as presented in Reference [89], goodness-of-fit threshold
standards regarding SEM models, for the combined sample (χ2/df = 0.365; RMSEA = 0.000; NFI =
0.999; TLI = 1.000; CFI = 1.000; GFI = 0.999; and SRMR = 0.004), Romanian sample (χ2/df = 0.456;
RMSEA = 0.000; NFI = 0.999; TLI = 1.000; CFI = 1.000; GFI = 0.997; and SRMR = 0.008), and South
African sample (χ2/df = 0.218; RMSEA = 0.000; NFI = 0.998; TLI = 1.000; CFI = 1.000; GFI = 0.999;
and SRMR = 0.084). The path coefficients showed that liking had a significantly favourable
effect on preference owing to YouTube marketing communication among Millennials in all of the
abovementioned scenarios, namely the combined sample (β = 0.80, p < 0.001), Romanian (β = 0.77,
p < 0.001), and South African samples (β = 0.64, p < 0.001). The multigroup SEM goodness-of-fit
measures were acceptable regarding the association between Romania and South Africa (χ2/df
= 1.446; RMSEA = 0.024; NFI = 0.992; TLI = 0.992; CFI = 0.998; GFI = 0.990; and SRMR = 0.034).
The comparison between Romania and South Africa showed a significantly larger favourable
influence on preference in Romania (β = 0.75, p < 0.05) than in South Africa (β = 0.66, p < 0.05).
Hence, H1a, H1b, H1c, and H1d were supported (Table 3). Additionally, the preference variance
was explained by liking among Millennials owing to YouTube marketing communication in a
large proportion in all scenarios, 64% for the combined sample (R2 = 0.64); 59% for the Romanian
sample (R2 = 0.59); 41% for the South African sample (R2 = 0.41); and 56% for the Romanian
sample (R2 = 0.56) versus 44% for the South African sample (R2 = 0.44) in the comparison between
the two developing economies.
• H2: Access—Liking→preference. The goodness-of-fit measures produced very good statistics
for the Romanian sample (χ2/df = 1.634; RMSEA = 0.042; TLI = 0.977; NFI = 0.985; GFI = 0.971;
CFI = 0.994, and SRMR = 0.034). The path coefficients indicated that liking had a significantly
stronger positive effect on preference when Romanian Millennial respondents accessed YouTube
via mobile devices and PC (β = 0.82, p < 0.05) compared to PC (β = 0.59, p < 0.05); thus, hypothesis
H2b was supported. However, in terms of the combined and South African samples, the path
coefficient revealed that liking did not have an effect on preference as a result of how Millennials
accessed YouTube; therefore, hypotheses H2a and H2c were not supported (Table 3).
• H3: Length of usage—Liking→preference. The goodness-of-fit measures produced acceptable
statistics for the combined sample (χ2/df = 2.234; RMSEA = 0.039; TLI = 0.944; NFI = 0.977;
GFI = 0.962; CFI = 0.987, and SRMR = 0.043) and Romanian sample (χ2/df = 2.122; RMSEA
= 0.053; TLI = 0.965; NFI = 0.982; GFI = 0.962; CFI = 0.990, and SRMR = 0.048). The path
coefficient indicated that liking had a significantly stronger positive effect on preference among
Millennial respondents who used YouTube for 1 year or less (β = 0.94, p < 0.05) compared to
those who used YouTube for 3 years (β = 0.57, p < 0.05) in the combined sample; and for 1 year or
less (β = 0.53, p < 0.05) compared to those Romanian Millennials who used YouTube for 2 years
(β = 0.25, p < 0.05) and 3 years (β = 0.25, p < 0.05), which supports hypotheses H3a and H3b.
However, the path coefficient showed that liking did not have an effect on preference as a result
of the number of years South African Millennial respondents had used YouTube; consequently,
H3c was not supported (Table 3).
• H4: Log-on frequency—Liking→preference. The goodness-of-fit measures produced adequate
statistics for the combined sample (χ2/df = 1.137; RMSEA = 0.021; TLI = 0.985; NFI = 0.987; GFI =
0.982; CFI = 0.996, and SRMR = 0.074), Romanian (χ2/df = 2.519; RMSEA = 0.062; TLI = 0.951;
NFI = 0.968; GFI = 0.942; CFI = 0.980, and SRMR = 0.020), and South African samples (χ2/df =
1.167; RMSEA = 0.021; TLI = 0.985; NFI = 0.987; GFI = 0.982; CFI = 0.996, and SRMR = 0.062).
The path coefficient indicated that liking had a significantly greater positive effect on preference
for Millennial respondents who logged on to YouTube once a month (β = 0.96, p < 0.05) than
those who logged on to YouTube 2–4 times a week (β = 0.57, p < 0.05). in the combined sample
and for South African Millennials who logged on to YouTube once a week (β = 0.87, p < 0.05) inSustainability 2019, 11, 604 15 of 24
comparison to those ones who logged on to YouTube 2–4 times a week (β = 0.17, p < 0.05). For the
Romanian sample, the path coefficient indicated that liking had a significantly greater positive
effect on preference among Romanian Millennial respondents who logged on to YouTube once a
week (β = 0.75, p < 0.05), 2–4 times a month (β = 0.75, p < 0.05), and once a month (β = 0.75, p <
0.05) compared to those who logged on to 2–4 times a week (β = 0.37, p < 0.05), which supported
hypotheses H4a, H4b, and H4c (Table 3).
• H5: Log-on duration—Liking→preference. The goodness-of-fit measures produced satisfactory
statistics for the combined sample (χ2/df = 2.111; RMSEA = 0.037; TLI = 0.953; NFI = 0.980; GFI =
0.989; CFI = 0.989, and SRMR = 0.015), Romanian (χ2/df = 3.305; RMSEA = 0.076; TLI = 0.909;
NFI = 0.964; GFI = 0.930; CFI = 0.974, and SRMR = 0.036), and South African samples (χ2/df =
1.272; RMSEA = 0.026; TLI = 0.949; NFI = 0.954; GFI = 0.972; CFI = 0.988, and SRMR = 0.025). The
path coefficient revealed that liking had a significantly larger positive effect on preference among
Millennial respondents who spent 5 hours or longer (β = 0.82, p < 0.001) logged on to YouTube
than those who spent 3 hours (β = 0.69, p < 0.001) logged on to YouTube on the combined sample;
for Romanian Millennial respondents who spent 4 hours (β = 0.79, p < 0.001) and 5 hours (β =
0.79, p < 0.001) or longer logged on to YouTube compared to those who spent 3 hours (β = 0.48, p
< 0.001) logged on to YouTube; and for 5 hours or longer logged on to YouTube (β = 0.79, p < 0.05)
compared to those who spent 4 hours logged on to YouTube (β = 0.13, p < 0.05) for South African
Millennials, which supported hypotheses H5a, H5b, and H5c (Table 3).
• H6: Advertisement viewership—Liking→preference. The goodness-of-fit measures produced
very good statistics for the combined sample (χ2/df = 1.848; RMSEA = 0.033; TLI = 0.961; NFI
= 0.981; GFI = 0.977; CFI = 0.991, and SRMR = 0.033), and South African sample (χ2/df =
0.787; RMSEA = 0.001; TLI = 1.000; NFI = 0.974; GFI = 0.985; CFI = 1.000, and SRMR = 0.033).
The path coefficient showed that liking had a significantly larger positive effect on preference by
Millennialrespondents who watched 1–5 YouTube advertisements (β = 0.87, p < 0.05) compared
to those who watched no YouTube advertisements (β = 0.69, p < 0.05) in the combined sample;
and for South African Millennial respondents who watched 11–15 (β = 0.60, p < 0.05) and 16
or more (β = 0.60, p < 0.05) YouTube advertisements versus those who watched 6–10 (β = 0.53,
p < 0.05) YouTube advertisements, which supported hypotheses H6a and H6c. However, the
path coefficient showed that liking did not have an effect on preference due to the number of
advertisements viewed on YouTube by Romanian Millennial respondents; therefore, H6b was not
supported (Table 3).
• H7: Gender—Liking→preference. The goodness-of-fit measures produced reasonable statistics
for the Romanian sample (χ2/df = 2.844; RMSEA = 0.068; TLI = 0.958; NFI = 0.977; GFI = 0.958;
CFI = 0.985, and SRMR = 0.035). The path coefficient revealed that liking had a significantly
stronger positive effect on preference when Romanian Millennial male respondents (β = 0.85, p <
0.05) accessed YouTube compared to female respondents (β = 0.70, p < 0.05), which supported H7b.
However, the path coefficients showed that liking did not have a positive impact on preference
based on gender as a result of YouTube marketing communication for the combined and South
African samples. Hence, hypotheses H7a and H7c were not supported (Table 3).
• H8: Age—Liking→preference. The goodness-of-fit measures produced acceptable statistics for
the combined sample (χ2/df = 1.910; RMSEA = 0.034; TLI = 0.977; NFI = 0.985; GFI = 0.979; CFI
= 0.992, and SRMR = 0.032) and Romanian sample (χ2/df = 2.842; RMSEA = 0.068; TLI = 0.939;
NFI = 0.970; GFI = 0.945; CFI = 0.980, and SRMR = 0.062). The path coefficient indicated that
liking had a significantly stronger positive effect on preference by Millennial respondents who
were aged 28–32 years (combined sample β = 0.87, p < 0.05; Romanian sample β = 0.87, p < 0.001)
versus those aged 18–22 years (combined sample β = 0.72, p < 0.05; Romanian sample β = 0.70, p <
0.001) and 23–27 years (combined sample β = 0.81, p < 0.05; Romanian sample β = 0.79, p < 0.001),
which supported hypotheses H8a and H8b. However, the path coefficient revealed that liking didYou can also read