Exploring Alternative Finance and Policy Options for Effective and Sustainable Delivery of Housing in South Africa - For an Equitable Sharing of ...
←
→
Page content transcription
If your browser does not render page correctly, please read the page content below

Exploring Alternative Finance
and Policy Options for Effective
and Sustainable Delivery
 of Housing in South Africa

                       For an Equitable Sharing of National Revenue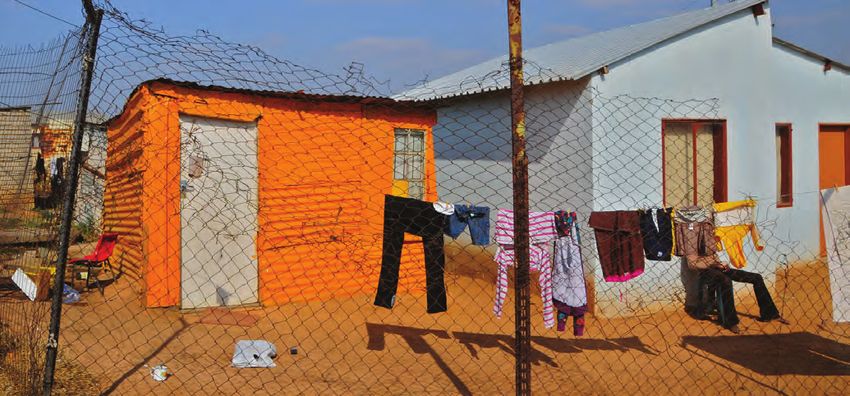
For an Equitable Sharing of National Revenue

EXPLORING ALTERNATIVE FINANCE AND
 POLICY OPTIONS FOR EFFECTIVE AND
SUSTAINABLE DELIVERY OF HOUSING IN
           SOUTH AFRICA

               ISBN: 978-0-621-42269-6
                     RP303/2013

           2nd Floor, Montrose Place, Bekker Street,
       Waterfall Park, Vorna Valley, Midrand, South Africa
             Private Bag X69, Halfway House 1685
          Tel: 086 1315 710, Fax: +27 (0) 11 207 2344
                    www.ffc.co.za
CONTENTS

               TABLE OF CONTENTS
                    Contents                                                                 2

                    Abbreviations                                                            6

                    Glossary of Terms                                                        7

                    CHAPTER 1: Background                                                    8
                    CHAPTER 2: Key Challenges Facing the Human Settlements
                    		Sector
                                                                                             10
                    CHAPTER 3: Overview of Housing Sector and Delivery in
                               South Africa                                                  12

                        3.1     Constitutional perspective to housing                        12
                        3.2     Housing policy regimes in South Africa                       13
                                3.2.1 Period one (1992 to 2003)                              14
                                3.2.2 Period two (2004 to 2009)                              15
                                3.2.3 Period three (2012 to 2013)                            16
                        3.3     Housing finance instruments                                  16
                                3.3.1   Mortgage finance                                     17
                                3.3.2   State-financed housing instruments                   18
                                3.3.3   Complementary housing finance instruments            19
                        3.4     Past Commission recommendations on housing finance           20

                    CHAPTER 4: Method and Limitations                                        21
                    CHAPTER 5: Modelling Results                                             23
                        5.1      Profile of housing needs in South Africa                    23
                        5.2      Supply-side interventions                                   25
                                 5.2.1 Formal owned, formal rental and traditional rentals   26
                                 5.2.2 Informal settlements                                  26
                                 5.2.3 Backyard dwellings                                    26
                                 5.2.4 New family formation and the housing ladder           29
                        5.3      Demand interventions                                        30
                        5.4      Investment interventions                                    34
                        5.5      Considering alternative housing scenarios                   36

                    CHAPTER 6: Conclusions and Recommendations                               38
                    References                                                               41

2   // Sustainable Delivery of Housing in South Africa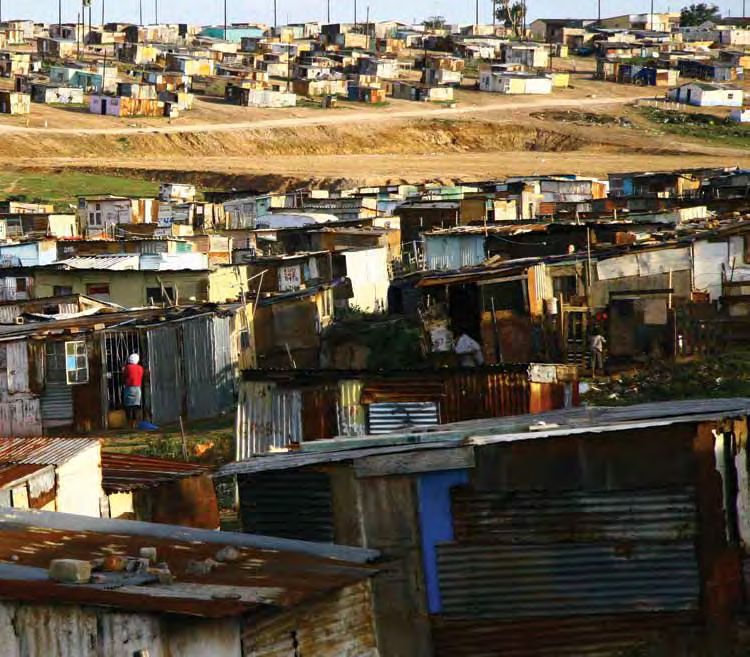
FIGURES

                                       FIGURES
Figure 1:   Housing delivery value chain                                                                           11

Figure 2:   Housing units completed/under construction (1992 to 2003)                                              14

Figure 3:   Housing units completed/under construction (2004 to 2009)                                              15

Figure 4:   Mortgage credit granted by value and income level (2012)                                               17

Figure 5:   Unsecured credit granted by value and income level (2012)                                              17

Figure 6:   HSDG allocation (2002 to 2016)                                                                         18

Figure 7:   Share of HSDG by province (2012)                                                                       18

Figure 8:   Diminishing housing outputs versus rising expenditure                                                  19

Figure 9:   Conceptual framework of the model                                                                      22

                                                                    Sustainable Delivery of Housing in South Africa //   3
                                                Back to Contents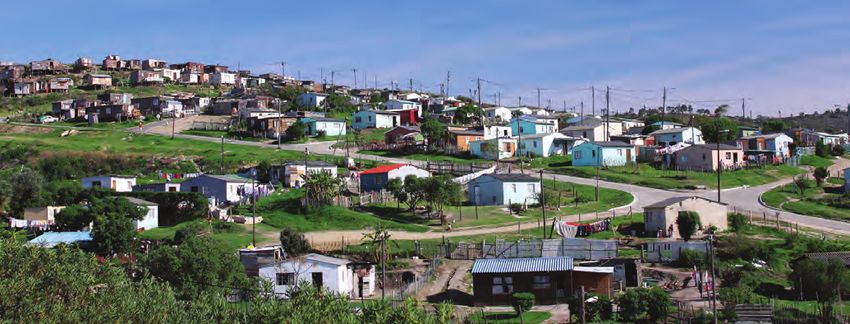
TABLES

                                                      TABLES
    Table 1:      Profile of housing in South Africa (1996 to 2011)                                        12

    Table 2:      Allocation and spending for Rural Households Infrastructure Grant (2010/11 to 2013/14)   19

    Table 3:      Urban Settlements Development Grant spending as at 31 March 2012                         20

    Table 4:      Housing circumstances: national housing circumstances                                    24

    Table 5:      Supply interventions by housing circumstance and income                                  25

    Table 6:      Informal settlements − national                                                          27

    Table 7:      Backyard rental − national                                                               28

    Table 8:      New household formations                                                                 29

    Table 9:      Demand interventions by housing circumstance and income                                  30

    Table 10:     Demand-side interventions                                                                31

    Table 11:     Investment interventions by housing circumstance and income                              34

    Table 12:     Investment interventions                                                                 35

    Table 13:     Alternative scenarios                                                                    37

4    // Sustainable Delivery of Housing in South Africa

                                                           Back to Contents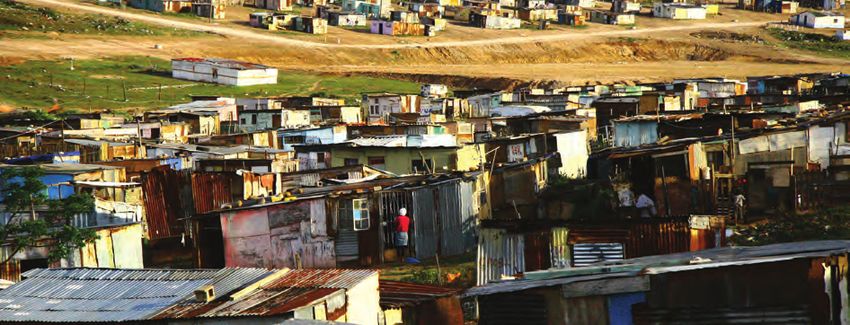
AUTHORITY

                                              AUTHORITY
The Financial and Fiscal Commission (“the Commission”) is a permanent, independent and impartial
Institution established in terms of the Constitution of the Republic of South Africa Act No. 108 of 1996
as amended. It is governed by among others the Financial and Fiscal Commission Act No. 99 of 1997
as amended. The mandate of the Commission is specifically to make recommendations to Parliament,
provincial legislatures and organised local government on the annual division of the revenue that has
been nationally raised between and among the three spheres of government, and generally to provide
advice to organs of state on any other financial and fiscal matters. The latter can be done either of the
Commission’s own accord or initiative (section 3(2)(b)(i) of the Financial and Fiscal Commission Act),
or at the request of an organ of state (section 3 (2)(b)(ii) of the Financial and Fiscal Commission Act).

This Submission is made in terms of section 3 (2)(b)(i) of the Financial and Fiscal Commission Act.
It focuses on the challenges relating to the financing of housing in South Africa and is informed by
among others input received from stakeholders at two public hearings and during bilaterals held with
key government and non-government stakeholders. The public hearings and bilaterals were aimed at
soliciting stakeholder views on real and perceived challenges relating to housing financing. The Sub-
mission finally reports on the research process that was followed, the findings that the Commission
has made, and formally outlines the Commission’s recommendations on housing financing.

For and on behalf of the Financial and Fiscal Commission

Bongani Khumalo (Mr.)
Acting Chairperson/CE
Financial and Fiscal Commission
11 October 2013

                                                                               Sustainable Delivery of Housing in South Africa //   5
                                                            Back to Contents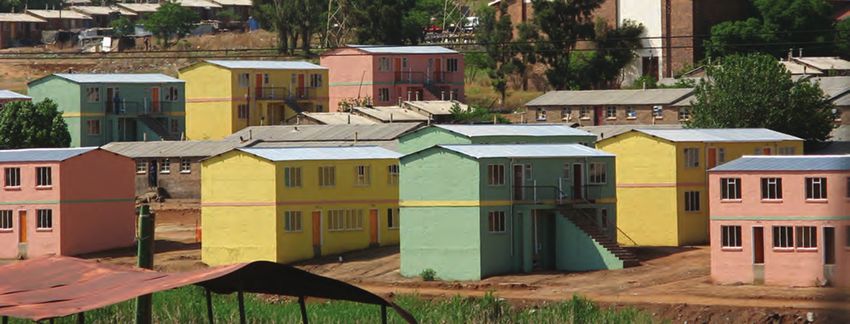
ABBREVIATIONS

          ACRONYMS/ABBREVIATIONS
                        BNG		                 Breaking New Ground

                        DoHS		                Department of Human Settlements

                        HHs		                 Households

                        HSDG		                Human Settlement Development Grant

                        MIG		                 Municipal Infrastructure Grant

                        NCR		                 National Credit Regulator

                        NDP		                 National Development Plan

                        NUSP		                National Upgrading Support Programme

                        RDP		                 Reconstruction and Development Programme

                        RHIG 		               Rural Households Infrastructure Grant

                        StatsSA		             Statistics South Africa

                        USDG		                Urban Settlement Development Grant

6   // Sustainable Delivery of Housing in South Africa

                                                               Back to Contents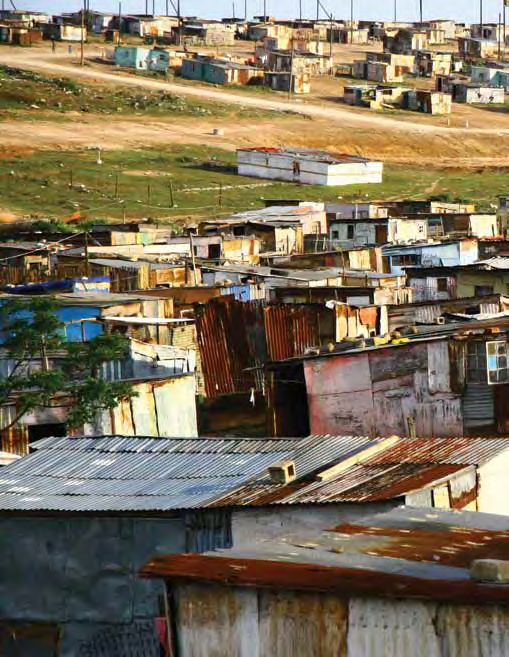
GLOSSARY

                        GLOSSARY OF TERMS
Affordability                 How much a household can afford to spend paying for a home, which
                              depends on the household’s income and expenses.

Affordability Parameters      The factors applied to credit provided by financial institutions or used
                              to calculate rentals.

Backyard rental               Informal dwellings found in the backyard of existing formal houses
                              that usually do not comply with current planning and building regula-
                              tions.

Demand-side interventions Programme/activities that result in households being able to afford/
                          access houses of higher standards.

Developer/Contractor          A person/company who is building a housing project.

Development parameters        Factors used to determine the cost of the housing unit and interven-
                              tion based on defined specifications.

Funding parameters            Parameters applied to assess the cost to the State and the gearing of
                              State funding.

Housing arena                 Where a housing intervention is to be located (inner city, urban
                              periphery, infill areas, existing suburbs etc.).

Housing circumstances         Current housing conditions of households defined in terms of tenure,
                              the nature and condition of the housing stock, and services accessed
                              by households.

Housing intervention          Explicit activities aimed at improving a specific current housing
                              circumstance, for example delivering Reconstruction and Develop-
                              ment Programme (RDP) housing, upgrading informal settlements or
                               subsidising mortgage interest rates.

Investment interventions      Programmes or activities aimed at stimulating investment in housing
                              such as, for example, tax rebates etc.

Subsidies and incentives      Financial assistance provided by Government to individuals or com-
                              munities towards the cost of meeting their housing needs.

Supply-side interventions     Programmes or activities that result in the supply of housing to
                              households, for example subsidy housing projects, site and service
                              schemes etc.

                                                                          Sustainable Delivery of Housing in South Africa //   7
                                                       Back to Contents
CHAPTER 1

    CHAPTER 1

                       Background

                              This submission is made in the context of the government’s renewed emphasis on and redirection of
                              the delivery of human settlements, as stated in the National Development Plan (NDP). The NDP seeks
                              to revise the housing finance regime, re-shape regulations and incentives for land use, transform
                              spatial arrangements toward compact cities and promote active citizenry in meeting housing needs.
                              This report is based on stakeholder inputs and the proceedings of two rounds of public hearings on
                              housing finance held by the Commission, as well as a modelling exercise.

                              The first public hearings developed a common understanding of problems facing the human set-
                              tlements sector1. The sector is overwhelmed by a number of challenges that are not always clearly
                              understood, which results in inappropriate interventions from the public and private sectors. The
                              lack of a common understanding of what constitutes housing demand2 is a significant constraint to
                              being able to provide the required mix of housing supply and demand. Administrative inefficiencies
                              related to establishing and approving townships and to transferring title deeds increase the delivery
                              costs and limit the development of a secondary market3 for affordable houses. As a number of
                              stakeholders agreed, the housing subsidy makes communities passive recipients (instead of encour-
                              aging them to mobilise their own energies and resources) and distorts the housing finance market.
                              The subsidy scheme also imposes limited choice and flexibility, making it difficult for households to
                              access higher-standard housing.

                              Following the first round of public hearings, the Commission undertook further research, to develop
                              realistic alternatives that could address some of the challenges identified in the problem statement.

                              The motivation behind the Commission’s entry into the housing policy arena was concerns over
                              rising housing backlogs, poor programme delivery and rising expenditure, growing reliance on state
                              assistance for housing, the inadequate influence of non-state housing interventions and perceptions
                              of a lack of financial sustainability in the delivery of housing.

                              Since 1994, the South African government has delivered more than three million houses to poor and
                              low-income households. These include fully and partially subsidised houses, as well as rental units.
                              The success of the national housing subsidy scheme in delivering houses has been impressive. Yet,

                                  1
                                      For full details, please refer to the problem statement report, available at www.ffc.co.za.
                                  2
                                      Housing demand should be understood in a broader sense, to include current housing needs compared to housing supply
                                  for different households, as well as future housing needs that could be driven by population growth and changes in house-
                                  holds’ ages.
                                  3
                                      The secondary housing market refers to the buying and selling of existing houses already owned by households as opposed
                                  to building new houses.

8         // Sustainable Delivery of Housing in South Africa

                                                                               Back to Contents
CHAPTER 1
despite this delivery record, South Africa has an estimated deficit of over two million housing units,
while more than 40 per cent of the available and used rental units are in a state of slum condi-
tions. The backlog is attributed to an inability to deliver: in 2009/2010 the government delivered only
55 per cent of its goal of 300 000 units. Other causes of the deficit include exaggerated or overstated
housing demand, housing delivery inefficiencies (delays in township establishment processes, infra-
structure constraints and the limited availability of well-located and affordable land) and insufficient
resources.
The approach followed for the housing options report included a literature and policy review, budget
analysis and financial modelling of various housing interventions. The model’s underlying analytical
framework categorises households into different housing circumstances by tenure type (for example
owned or rented) and income level to reflect their housing needs. For each housing circumstance
(for example informal and traditional dwellings), the model applies a set of appropriate interventions
and computes the cost and impact per intervention. Interventions are presented as four alternative
scenarios, to offer an appropriate combination of policy options required to address housing chal-
lenges holistically. Although the census data for 2011 was not available at the time of this study in
2012, the results of the model remain relevant and useful for policy advice and decision-making, as
the main aim is to develop alternative housing funding and delivery options, and understand the
associated costs. Even if the actual costs change as a result of 2011 census data, the message and
the bigger picture will not necessarily change.
The analysis found that different households in different housing circumstances and at different
stages of their lifecycles require specific housing interventions. Government’s role in providing
housing must be understood within this context. The Constitution is particularly ambiguous about
the role of government and the provision of adequate housing continues to be interpreted as
physical delivery by the State. Such an interpretation is costly to the government but appears to have
a significant positive overall impact on the number of qualifying households assisted. A combination
of government and household/private sector-funded interventions costs the State less, but has less
impact on households than the purely state-funded interventions. The most significant limitation to
self-build initiatives is the high level of household credit, which reduces access to credit for building
or home loans.
The housing options analysis was presented at a second round of public hearings, at which stake-
holders made inputs. Generally, stakeholders supported the Commission’s initiative to develop a set
of alternative funding and housing delivery options. Some of the specific inputs made by stakehold-
ers include the following:4
• The model needs to be updated using the 2011 census results.
• The government should introduce a better and more efficient public transport system, so that
households will be better able to access economic opportunities and social services.
• The government must move away from investing in housing and focus instead on improving
the lives of households. This would require merging a number of subsidies into a “sustainable
human settlements” subsidy.
• Energy efficiency should be considered for all new buildings, which will result in an additional
cost of about R20,000 per unit.
• Consultations with communities are essential for the successful implementation of interven-
tions.
Having provided some background on the process followed, the remainder of the report is struc-
tured as follows. Section 2 summarises the key challenges facing the human settlements sector.
Section 3 gives an overview of housing sector and delivery in South Africa, and highlights some
of the Commission’s past recommendations. Section 4 describes the methodology used to cost
alternative housing finance and delivery interventions to address some of the challenges identified
during the first round of public hearings. Section 5 summarises the results, while Section 6 provides
conclusions and recommendations.
4
Other issues raised by stakeholders that could not be dealt with satisfactorily in this report will form part of the Commission’s
research agenda for the future.
Sustainable Delivery of Housing in South Africa // 9
Back to ContentsCHAPTER 2
CHAPTER 2
Key Challenges Facing the Human Settlements Sector
At the first round of public hearings, challenges noted included: insufficient delivery to scale and lack
of sustainability, problems with providing fully subsidised housing, an increasing gap market, the lack
of well-located land, and bulk infrastructure and housing delivery chain inefficiencies.
2.1 Insufficient delivery to scale and lack of sustainability
The delivery of over three million fully subsidised houses since 1994 is not enough to address the many
housing needs. Despite significant increases in the budget allocated to human settlements and the
delivery of over three million houses, housing backlogs remain at levels similar to those in 1994. Popu-
lation growth and migration to cities add to the demand for housing and housing subsidies. Increasing
costs over time imply that more subsidies will be required to deliver on promises.
2.2 Problems with providing fully subsidised housing
The high levels of unemployment in South Africa mean that 60 per cent of households are potentially
eligible for fully subsidised houses. This has resulted in an increasing burden and dependence on the
State for housing. The current subsidy is perceived as discouraging complementary investment and
participation by the private sector and households, especially at the lower end of the market.
2.3 Increasing gap market
In South Africa, the gap market is growing, as more and more people do not qualify for a subsidy or
for a mortgage bond. This gap market is made worse by the lack of commercial incremental housing
products.5 The finance-linked individual subsidy programme (FLISP) has not succeeded in encourag-
ing the private sector to provide mortgages for households in the gap market. This burden has been
passed onto the State.
2.4 Lack of well-located land, and bulk infrastructure and housing delivery
chain inefficiencies
South Africa’s national housing subsidy is based on a capital grant that finances top structure. It is
insufficient to cover the costs of higher density development and higher land costs in well-located
areas. This results in peripheral development. Even where land is made available, poor intergovern-
5
Commercial incremental housing products are housing finance instruments provided by banks and aimed at funding part of
the construction of a new house, e.g. for purchasing a serviced site only, as opposed to covering the cost of an entire house.
10 // Sustainable Delivery of Housing in South Africa
Back to ContentsCHAPTER 2
mental relations mean that housing developments can take up to three years from the establishment
of a township to the handing over of houses (see Figure 1). A combination of land assembly problems,
administrative and land-market inefficiencies, and regulatory costs drive house prices up by 30 per
cent on average.
Figure 1: Housing delivery value chain
Transfer and
Land assembly
handover
3–6 months
1–10 months
Source: National Treasury, 20116
6
Presentation made by the National Treasury during the 2011 housing finance public hearings hosted by the Financial and
Fiscal Commission.
Sustainable Delivery of Housing in South Africa // 11
Back to ContentsCHAPTER 3
CHAPTER 3 Overview of Housing Sector and Delivery in
South Africa
The housing sector is concerned with the delivery of basic services and houses within a spatial
framework that relies on good location and transport infrastructure to ensure sufficient access to
services. Therefore, a functional housing sector comprises a complex relationship between market
forces, private sector firms, governmental rules and regulations, financing and facilitative interven-
tions, as well as inputs and investments by the households. The housing sector operates within an
environment that is governed by rules and regulations (set through policy and legislation) and a legal
framework that is enabled through a range of institutions and interventions set by the national govern-
ment and applied by provincial governments, municipalities, development finance institutions, private
sector banks and other actors (such as estate agents).
Since 1996, the state of South African housing has improved as a result of policies, rising income levels
and direct government intervention. Between 1996 and 2011, the number of households living in brick
or concrete houses, as a percentage of all types of main dwellings in South Africa, increased from 48
per cent to 65 per cent. Households are also switching from traditional dwelling types at a much higher
rate. As Table 1 shows, the percentage of traditional dwellings decreased from 18 per cent in 1996 to
eight per cent in 2011. However, almost 200 000 more households were living in informal dwellings in
2011 than in 1996. This reflects the difficulties associated with eradicating informal settlements and the
shortcomings of informal settlement upgrading programmes.
Table 1: Profile of housing in South Africa
Dwelling type 1996 2001 2011
No. HHs % No. HHs % No. HHs %
House or concrete structure on a separate stand 4 331 586 48% 6 238 464 53% 9 384 029 65%
Traditional dwelling 1 644 388 18% 1 654 787 14% 1 139 917 8%
Flat in block of flats 458 167 5% 589 109 5% 720 327 5%
Town/cluster/semi-detached house 381 541 4% 319 864 3% 573 056 4%
Unit in retirement village 40 433 - - - - -
House/flat/room in backyard 483 460 5% 412 377 4% 422 849 3%
Informal dwelling/shack in backyard 403 329 4% 459 525 4% 712 955 5%
Informal dwelling/shack elsewhere 1 049 686 12% 1 376 708 12% 1 249 776 9%
Room/flatlet on shared property 139 632 2% 120 611 1% 118 984 1%
Caravan/tent 17 126 0% 30 610 0% 14 440 0%
other 128 054 1% 568 219 5% 113 827 1%
Total 9 077 402 11 770 274 14 450 160
Source: Statistics South Africa: 1996; 2001 & 2011
12 // Sustainable Delivery of Housing in South Africa
Back to ContentsCHAPTER 3
3.1 Constitutional imperatives of housing
South Africa’s government is constitutionally mandated to ensure that everyone has access to
adequate housing (Section 26 of the Constitution), and the State has an obligation to take reason-
able legislative and other measures to achieve the progressive realisation of the right to housing.
However, the Constitution does not outline these reasonable measures, and so the government’s
role in fulfilling the right to housing is subject to different interpretations and expectations.
Constitutionally two critical points affect the definition: the meaning of ‘adequate housing’ and the
timeframes that best satisfy ‘progressive realisation’ of needs. As ‘adequate housing’ is not clearly
defined, the meaning depends on the household’s specific context and circumstance, and needs or
priorities at a given time (Tissington, 2010). For a household to have access to ‘adequate housing’,
certain conditions, including land, services and a dwelling, have to be met.
Given this understanding, before the government can fulfil its obligation, the household’s housing
needs and income circumstances need to be fully understood so that the interventions introduced
are relevant. Essentially, there are three types of households: those who cannot afford housing;
those that are able to contribute towards their own housing needs; and those that can fully afford
their own housing needs, through their own savings or mortgage bonds. The State plays a facilitative
role for those who can afford their own housing needs but may be expected to play a bigger role
for the other two groups, including (but not limited to) providing full or partial subsidies. Given these
diverse needs, some households may only need access to land, land and building material, finance,
and services such as water, sewage, electricity and roads. All of these factors need to be taken into
account when defining ‘adequate housing’. Furthermore, the State’s obligation to provide ‘adequate
housing’ may differ from province to province, city to city, rural to urban areas and person to person
(see the Grootboom case7).
‘Progressive realisation’ is also subject to varying interpretations. The South African courts interpret
‘progressive realisation’ as the act of dismantling a range of legal, administrative, operational and
financial obstacles that block access to socio-economic rights (Tessington, 2010). The United Nations
Committee on Economic, Social and Cultural Rights interprets ‘progressive realisation’ as a minimum
core obligation from the State to ensure that everyone has access to at least a basic level of housing.
Under this formulation, the State has an obligation to improve the quality of public services gradually
until they reach a certain level. The other understanding of ‘progressive realisation’ of a housing right
is formulated around Maslow’s hierarchy of needs, where housing needs are secondary to essential
needs for services, such as land, water, sanitation and refuse removal. This interpretation is consist-
ent with the current approaches to housing delivery in South Africa, such as upgrading informal
settlements or providing sites and services. Examples of measurable benchmarks for ‘progressive
realisation’ include the target of upgrading 500 000 shacks in informal settlements by 2014 through
the provision of basic services and land tenure rights (Tissington, 2010).
3.2 Housing policy regimes in South Africa
Since 1994, the government has put in place housing policies and programmes to fulfil its consti-
tutional obligation and respond to South Africa’s housing problems. The housing policy is targeted
at meeting compensation promises rather than addressing the various dimensions of the housing
market. As a result, the housing policy has been characterised by unbalanced, spur-of-the-moment
and disconnected interventions carried out under three broad programmes: (1) the Incremental
Housing Programme,8 (2) the Social and Rental Housing Programme9 and (3) the Rural Housing
Programme.10 Housing policies have undergone significant reforms involving changes in delivery
norms and standards, delivery models, orientation (quantity to quality) and income groups targeted.
These reforms are classified into three major policy episodes corresponding to 1992 to 2003, 2004
to 2009 and 2010 to 2013.
7
Government of the Republic of South Africa and Others vs.Grootboom and Others (CCT11/00) [2000] ZACC 19; 2001 (1) SA
46; 2000 (11) BCLR 1169 (4 October 2000)
8
Includes incorporated integrated residential development programme, enhanced people’s housing process, and informal
settlements upgrading, consolidation subsidies and emergency housing assistance.
9
Includes institutional subsidies, social housing assistance and community residential units (hostels).
10
Focuses on rural subsidies and housing assistance for farm residents.
Sustainable Delivery of Housing in South Africa // 13
Back to ContentsCHAPTER 3
3.2.1 Period one (1992 to 2003)
During this period, the principal housing policy was the White Paper on Housing and Housing Act (No.
107 of 1997), which was anchored on seven policy tenets: stabilisation of the housing environment,
mobilising housing credit, providing subsidy assistance, rationalising institutional capacities, facilitating
the speedy release and servicing of land, and coordinating government investment development.
The national housing subsidy developed in 1992. The programme’s main goal was to deliver as many
subsidised houses as possible (coverage), with over one million houses (RDP) targeted in the first five
years. The target was met within a seven-year period. During this period, because local government
structures were underdeveloped, the housing development projects were developer-driven11 and paid
for by conveyances. This approach ended towards 2003, as beneficiaries were allocated to the housing
projects from a waiting list managed by provinces and municipalities.
Between 1992 and 2003, housing delivery challenges were characterised by complaints from ben-
eficiaries about the size and quality of houses delivered, and complaints by constructors about the
adequacy of the subsidy to build houses of the expected standard. National minimum norms and
standards were developed to address these complaints and included size specifications of 30m2 and
increasing the quantum of subsidy over time. As Figure 2 shows, housing delivery started very slowly
in 1994, with only 20 000 units completed that year, and gradually improved, to reach over 200 000
units a year by 1999.
Figure 2: Housing units completed/under construction (1994 to 2003)
Source: Department of Human Settlements
11
Private sector developers and contractors identified land for housing and implemented housing projects using the capital
subsidy, with little or no involvement of the provinces and municipalities in issues such as structuring of projects.
14 // Sustainable Delivery of Housing in South Africa
Back to ContentsCHAPTER 3
3.2.2 Period two (2004 to 2009)
This period is characterised by the introduction of the Breaking New Ground (BNG) policy framework.
BNG emphasised the delivery of sustainable human settlements, the need for integrated development
and upgrading of informal settlements. It also placed increased emphasis on the process of housing
delivery (the planning and engagement) and the long-term sustainability of the housing environment
(Tissington, 2011). BNG was formulated to address previous challenges and was a shift from focusing
on quantity to focusing on quality (the size, settlement design and alternative technology) and choice
(including tenure type and location). During this period, the housing units delivered evolved signifi-
cantly, to comprise a 40m2 house with two bedrooms, a toilet with a washbasin, a kitchen with a basin,
a wooden front door, a roof tile and fascia boards.
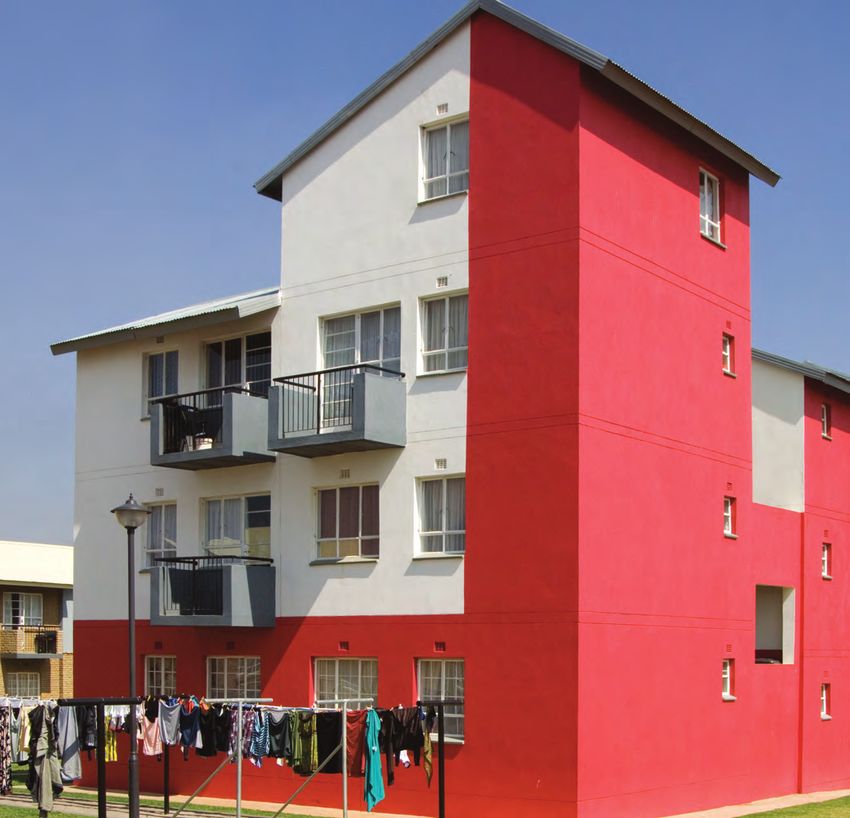
Other developments included the introduction of the FLISP in 2005 and the introduction of Social
Housing Policy in 2005.12 A Rental Housing Amendment Act (No. 43 of 2007) was also approved,
amending the Rental Housing Act 1999 to provide for rulings by rental tribunals among other things.
The Social Housing Act (No. 16 of 2008) establishes and promotes sustainable social housing environ-
ment and provides for the introduction of the Social Housing Regulatory Authority (SHRA).13 In 2008 the
National Rental Housing Strategy was approved, setting the delivery target of 100 000 rental housing
units (75 000 social housing and 25 000 community residential units) by 2012.
In 2008 the National Upgrading Support Programme (NUSP) was established to assist provinces and
municipalities in their efforts to upgrade informal settlements. The NUSP delivery pillars include water
and sanitation, security of tenure and community empowerment. The programme’s proposals were
incorporated in the national and provincial delivery agreements and rolled out within 49 municipalities
across the country.
As Figure 3 illustrates, housing delivery increased until 2006 and then decreased, reaching just over
150 000 units per year in 2008 and 2009. The decrease in the number of houses delivered is attributed
to higher delivery norms (30m2 to 40m2), the global financial crisis that started in 2007, the escalation
of construction costs, and under-spending by provinces because of poor programme management.
However, the delivery of rental housing units cannot be assessed because of a lack of data.
Figure 3: Houses completed/under construction – 2004 to 2009
Source: National Treasury (2009) and Industry Insight (2011)
12
FLISP is intended provide support to households in their deposit obligations for mortgage finance in order to reduce the
capital amount being borrowed and the interest charges associated with it. The Social Housing Policy on the other hand was
introduced to fill policy vacuum and address challenges in the social housing sector.
13
SHRA regulates social housing institutions among other things.
Sustainable Delivery of Housing in South Africa // 15
Back to ContentsCHAPTER 3
3.2.3 Period three (2012 to 2013)
In 2012 and 2013, the key housing policy developments included a revised National Housing Code in
2009, the adoption of Outcome 814 and the NDP. The Housing Code contains the principles, guidelines
and norms and standards that apply to the government’s various housing assistance programmes.
It represents a shift, away from municipal-driven subsidy projects providing RDP houses in the
informal settlements, to encouraging the development of a secondary housing market and providing
subsidies within integrated areas.
In addition to the Housing Code, through Outcome 8 the government committed itself to upgrade
400 000 households living in informal settlements over a four-year period starting in 2010.15 In 2012
the government announced a R1-billion state-guaranteed fund to promote access by households
earning between R3,501 and R15,000 per month to housing loans to buy a house (newly built or for
sale) costing R300,000 or less.
Another development was the NDP, whose objectives include a need to address the apartheid geo-
graphical and urban inefficiencies.16 The number of housing units completed/under construction for
2010/2011 was 121 879 and 88 441 units for 2011/2012 (up to December 2011).
3.3 Housing finance instruments
Housing in South Africa is funded through household savings, state funding and private finance.
State funding comprises municipal finance for infrastructure and subsidies/incentives to selected
individuals. Private finance covers project finance for developers and end-user finance to house-
holds. The size of each funding source depends on specific circumstances, such as income levels,
access to private finance, active property land and markets, and the State’s appetite to fund housing.
South Africa has an active formal property and mortgage finance market, which caters for the upper-
and middle-income housing market and is granted by banks. The government, through a number
of grants, continues to support housing opportunities for the low-income groups. For example, in
2011 the government spent more than R15-billion on housing, rising to R17.9-billion in 2013/14. The
Human Settlements Development Grant (HSDG) is one of the main grants and has many objectives
including the financing of individual housing subsidies (full and partial), enhanced extended discount
benefit scheme, social and economic facilities and rectification of pre- and post-1994 housing.
14
Outcome 8 concerns sustainable human settlements and improved quality of households’ life and has four outputs:
upgrading 400 000 units of accommodation within informal settlements; improving access to basic services; facilitating the
provision of 600 000 accommodation units within the gap market for people earning between R3,500 and R12,800; and
mobilising well-located public land for low-income and affordable housing with increased densities.
15
The four focus outputs are: accelerated delivery of housing opportunities, access to basic services, efficient use of land for
human settlements and improved property market.
16
Some of the suggestions contained in the NDP include:
• Urban sprawl should be contained, and possibly reversed, as denser forms of development are more efficient (on land
usage);
• Special incentives and subsidies should be designed to make affordable, large-scale, high-density housing possible in
inner cities; and
• New urban development and infrastructure investment around corridors of mass transit and around existing and
emerging economic nodes.
16 // Sustainable Delivery of Housing in South Africa
Back to ContentsCHAPTER 3
3.3.1 Performance of mortgage finance
Mortgage finance is granted predominantly to households earning more than R15,000 per month, as
Figure 4 shows. This income group accounts for just over 80 per cent of private housing finance, with
the remainder going to those earning between R7,500 and R10,000 per month. Mortgage finance to
households with a monthly income below R7,500 is almost non-existent. According to the household
credit access frontier17, households with a monthly income of between R3,500 and R7,500 can qualify
for a mortgage bond of between R140,000 and R300,000 depending on the interest rate and credit-
worthiness. The National Credit Regulator (NCR, 2012) found that, of the total value of mortgage bonds
granted, less than 10 per cent are below R350,000. The view from the Commission’s public hearings
was that either banks are reluctant to fund affordable properties or the supply/stock of affordable
homes is insufficient.
Figure 4: Mortgage credit granted by value and income level (2012)
R0–R3,500
R3,501–R5,500
R5,501–R7,500
R7,501–R10,000
R10,001–R15,000
>R15,000
Source: National
Credit Regulator
(2012).
Figure 5 shows that low-income groups account for a significant proportion of total unsecured
lending (NCR, 2012), accounting for 60 per cent of the value of unsecured credit in 2007, declining
to 40 per cent in 2012. However,the extent to which low-income households, especially those not
eligible for fully subsidised houses, use unsecured lending to contribute to their housing needs is
unclear. As noted earlier, the prevailing view is that households that fall in the gap between those
eligible for a subsidy and those who qualify for mortgage (the gap market) are inadequately catered
for.
Figure 5: Unsecured credit granted by value and income level (2012)
R0–R3,500
R3,501–R5,500
R5,501–R7,500
R7,501–R10,000
R10,001–R15,000
>R15,000
Source: National
Credit Regulator
(2012).
17
Credit access frontier measures the ability of a household to access credit facility.
Sustainable Delivery of Housing in South Africa // 17
Back to ContentsCHAPTER 3
3.3.2 State-financed housing instruments
The main conditional grant for housing delivery is the HSDG, which is transferred to all provinces
using a formula that takes into account various socio-economic attributes. Gauteng, KwaZulu-Natal
and the Western Cape account for 50 per cent of HSDG allocations (see Figure 7). Provinces are
responsible for managing, implementing and transferring the grant to municipalities, depending on
accreditation18 levels. A large number of municipalities depend on this grant for housing delivery
because they lack the capacity to raise their own revenue. Figure 6 shows the annual HSDG alloca-
tion since 2002. The grant has grown from just under R5-billion in 2002 to R20-billion in 2016. During
the years under scrutiny, on average over 90 per cent of the grant was spent. The inability to spend
100 per cent of the grant is often due to administrative inefficiencies and a fragmentation of funding
and functions for built environment. For instance, funding for complementary housing infrastructure
− i.e. bulk service funding and the municipal infrastructure grant (MIG) − is scattered across various
government departments whose planning activities are not always synchronised.
Figure 6: HSDG allocation (2002 to 2016)
R million
Source: National Treasury
(2012 and 2013) and Depart-
ment of Housing Settlements
(2012)
Figure 7: Share of HSDG by province (2012)
Source: National Treasury
(2012 and 2013) and Depart-
ment of Housing Settlements
(2012)
18
Municipalities in South Africa are accredited to administer the housing function and associated funds depending on their
capacity levels. There are three accreditation levels, with the highest involving full administration of housing activities.
18 // Sustainable Delivery of Housing in South Africa
Back to ContentsCHAPTER 3
Notwithstanding a healthy and positive HSDG allocation trajectory, Figure 8 depicts a disturbing trend:
a trade-off between rising allocations and the number of housing units delivered. Since 2005 housing
allocations have increased but the output has been declining, implying diminishing marginal returns.
Although the underlying causes of this cannot be established with certainty, available anecdotal
evidence points to rising and inflated construction costs, higher delivery norms and standards, pure
inefficiencies and an inability of the DoHS to account for housing units delivered. This trend is an early
signal of fiscally unsustainable housing delivery by government. Reversing the trend will require a
concerted effort to restructure the entire housing finance and delivery chain.
Figure 8: Diminishing housing outputs versus rising expenditure
Source: National
Treasury, 2011
3.3.3 Complementary housing finance instruments
In addition to the HSDG, the government finances other elements of housing delivery through location-
specific and targeted conditional grants, such as the Rural Households Infrastructure Grant (RHIG)19 and
the Urban Settlement Development Grant (USDG).20 The RHIG and USDG were introduced in 2010/2011
and 2011/2012 respectively, as part of evolving housing finance reforms. Since their introduction, the
spending performance of both the RHIG and USDG has been poor, as shown in Tables 2 and 3. By
March 2012, total expenditure for the 2011/2012 financial year stood at 72 per cent for the RHIG and
44 per cent for the USDG. Under-spending on RHIG has resulted in reduced baseline allocations for
2012/2013, as shown in Table 2, further undermining the achievement of housing policy objectives.
Table 2: Allocation and spending for RHIG 2010/11–2013/14
Spending as a percentage
Financial year Total allocation R’000 Total spending R’000
of total allocation
2010/11 100 66.7 (by Mar 2011) 66.7%
2011/12 258 187 (by Mar 2012) 72.4%
2012/13 340.6 (479.5 reduced by 138) 61 (by Jan 2013) 17.9%
Source: National Treasury and Department of Human Settlements21
19
The RHIG is intended to fund the provision of onsite water and sanitation infrastructure in rural municipalities.
20
The aim of the USDG is to assist metropolitan municipalities, supplementing their revenue to subsidise the capital costs of
acquiring urban land, increase supply of well-located land, improve spatial density, and provide basic services.
21
Unpublished data requested from the National Treasury.
Sustainable Delivery of Housing in South Africa // 19
Back to ContentsCHAPTER 3
Table 3: Urban Settlements Development Grant spending as at 31 March 2012
Total R’000 Spent by 31/03/2012 Total R’000 Spent by 31/01/2013
Municipality
2011/12 R’000 percentage 2012/13 R’000 percentage
Buffalo City 423 446 796 99 19% 499 474 111 862 22%
Nelson Mandela 502 626 314 922 63% 592 870 226 135 38%
Mangaung 411 995 163 153 40% 485 967 244 416 50%
Ekurhuleni 1 094 276 504 305 46% 1 212 537 455 922 38%
City of JHB 1 027 970 470 176 46% 1 290 748 273 624 21%
City of Tshwane 891 081 349 874 39% 1 051 070 460 938 44%
EThekwini 1 091 574 558 323 51% 1 287 560 274 801 21%
City of Cape Town 824 030 287 972 35% 971 980 344 867 35%
Total 6 266 998 2 728 424 44% 7 392 206 2 392 565 45%
Source: Department of Human Settlements (2012) and the National Treasury22
3.4 Past Commission recommendations on housing finance
Some of the challenges raised during the public hearings are in line with the Commission’s previous
research and recommendations. The public hearings revealed that the key factors affecting the
performance of housing programmes include problems with the design of the subsidy, institutional
arrangements, and the policy and legislative framework. In its 2008 Submission, the Commission
highlighted inefficiencies associated with fragmented housing funding and planning, and land-use
management. The Commission recommended fast-tracking the accreditation of municipalities to
carry out the housing function as a remedy to the planning and cash-flow challenges. Currently,
these recommendations are at an advanced stage for implementation by the DoHS, which intends
assigning the housing function to six metros.23
Other recommendations made by the Commission include the following:
• The government should consider the funding implications of any further policy changes.
• Consideration should be given to linking new housing subsidies with the MIG.
• The government should review the effectiveness of current housing finance arrangements in
meeting housing needs within the context of creating sustainable and more compact human
settlements.
The government has responded positively to a number of these recommendations, which have not
yet been implemented.
22
Unpublished third quarter performance requested from the National Treasury.
23
The Commission has tabled to the DoHS a detailed submission on its position of shifting the housing function to six metros.
20 // Sustainable Delivery of Housing in South Africa
Back to ContentsCHAPTER 4
CHAPTER 4
Method and Limitations
The quantitative results of this report are based on a financial model which used the 2007 Community
Survey demographic data; financial parameters on subsidy amounts, mortgage unsecured credit,
monthly rental and insurance; and cost data on land, infrastructure per service level and construc-
tion for different building standards and professional costs. Results of the model are calibrated over
an eight-year horizon up to 202024 and take into account new family formations.
Figure 9 on page 22 describes the model. First, households are disaggregated into seven different
housing circumstances. Second, a total of 31 interventions [supply (18), demand (10) and investment
(3)] are applied to different housing circumstances, depending on current policy, income levels and
appropriateness.25 Due to similarities in certain housing circumstances, some interventions overlap
more than one circumstance. Interventions are grouped into four policy scenarios: historic practice,
lowest cost to the State, formalisation of informality or Outcome 8, and the NDP. The scenarios allow
an optimal policy combination to be developed for consideration by the government. They are then
evaluated in terms of total cost to the State, required contributions by households and the private
sector, total number of households reached and assisted, and additional hectares of land required.
Using this model, various housing finance and policy options for South Africa are analysed. The
modelling undertaken is unique, as it analyses existing and new supply-side, demand-side and invest-
ment interventions in the housing sector, taking into consideration both public and private sector
funding and investment. The intention is to review existing and potential housing interventions
holistically, in terms of their performance and appropriateness in addressing the needs of people in
different housing circumstances. The review takes into account the limited role of the State and the
potential for the crowding-in of household savings and private finance. Each intervention is applied
to a relevant housing circumstance and further evaluated based on the total required cost disag-
gregated into State, household and private sector contributions. Each intervention is evaluated in
terms of overall impact on households, contribution towards integrated and equitable cities, market
distortion and contribution towards an effective housing market.
24
Projected growth rates are taken from UNISA BMR, Population and Household Projections for South Africa by Province and
Population Group, 2001−2021.
25
Supply-side interventions are activities in housing that is being supplied to households, for example housing subsidy and
the provision of land/site and services schemes. Demand-side interventions refer to programmes that result households
being able to afford/access houses of higher standards. Investment interventions are activities aimed at stimulating increased
investment into housing, such as tax rebates.
Sustainable Delivery of Housing in South Africa // 21
Back to ContentsCHAPTER 4
Figure 9: Conceptual framework of the model
The last step in the model involves packaging the different interventions into broad policy scenarios,
which can be adopted or realigned to address housing challenges holistically and with the available
funding. The four scenarios considered are: historic practice, low cost to the State, Outcome 8 and
the NDP.26
The model does not take into account variables, such as inflation, interest rate fluctuations and
exchange rates, which may have an impact on the outcome for each intervention. The model deals
with generic cost inputs reflecting average prices; no assumptions are made about the availability
of land and the administrative capability to deliver the housing interventions. Resources (materials,
water, electricity, etc.) are assumed to be unlimited. To calculate affordability and access to credit,
various general assumptions have been made that may vary from one credit provider to another. In
addition, due to the lack of details for each income category, an average income for all households
within each category has been used.
26
Historical practice focuses on the provision of subsidy-linked housing units (large- and medium-scale RDP housing projects),
social housing rental stock, lower end mortgage-financed housing (with a FLISP subsidy). Low cost to the State combines
interventions within each housing circumstance that have the lowest cost to the State. Outcome 8 concerns formalising
informality within urban centres. The NDP combines interventions that focus on creating a more compact, efficient and
equitable city.
22 // Sustainable Delivery of Housing in South Africa
Back to ContentsCHAPTER 5
CHAPTER 5
Modelling Results
5.1 Profile of housing needs in South Africa
The starting point of this analysis involves scoping the housing needs and categorising households
into different housing circumstances. Housing circumstances refer to household conditions in terms
of tenure, income, the nature and condition of the housing stock and services accessed. Table 4
shows the total number of South Africans according to their housing circumstances. Forty-six per
cent of all South Africans live in formal houses, and 21 per cent of households earning less than
R3,500 per month have formal houses. A relatively high percentage of low-income groups live in
‘inadequate housing’, such as informal settlements and backyard dwellings: at least 7.3 per cent
of households earning less than R3,500 per month stay in informal settlements. Households in the
gap market (with incomes of between R3,500 and R15,000) are found across various housing cir-
cumstances but are mainly concentrated within formal owned and formal rental dwellings. Although
about 27 per cent of households in this income group have less than adequate housing circum-
stances, the majority are able financially to meet fully or partially their housing needs.
The diversity of housing circumstances across all income groups has important implications for
housing finance and delivery, suggesting that each household requires circumstance-specific
housing interventions. Some interventions require complete state funding, while others require a
combination of state, household and private contributions. Table 4 includes projected new family for-
mations up to the year 2020. New family formations are estimated at 3.6 million, with approximately
55 per cent falling within the income category of less than R3,500 per month.
Sustainable Delivery of Housing in South Africa // 23
Back to Contents24
Table 4: Housing circumstances: national housing circumstances
R0-R 3,500 R3 500 - R 7 000 – R10 000 – R15 000 – R20,000+ Total
Housing Circumstance / Income Category
R7 000 R10 000 R15 000 R20 000
A: Formal, owned 2 595 398 880 882 415 107 522 558 308 920 1 026 420 5 749 285
Percentage of total HH 21.0% 7.0% 3.4% 4.2% 2.5% 8.3% 46.4%
B: Formal, rented, plus room/flatlet not in
1 380 830 433 093 224 180 228 985 103 018 255 611 2 625 717
backyard
Percentage of total HH 11.2% 3.5% 1.8% 1.8% 0.8% 2.1% 21.2%
CHAPTER 5
C: Informal settlement, regardless of whether
903 349 192 439 61 254 24 060 9 991 11 664 1 202 757
owned or rented
Percentage 7.3% 1.6% 0.5% 0.2% 0.1% 0.1% 9.7%
// Sustainable Delivery of Housing in South Africa
D: Backyard dwelling, regardless of whether
626 984 166 507 69 820 38 885 14 330 28 803 945,329
owned or rented
Percentage 5.1% 1.3% 0.6% 0.3% 0.1% 0.2% 7.6%
E: Traditional dwelling, regardless of whether
1 133 113 210 203 37 341 20 298 17 998 23 722 1 442 675
owned or rented
Percentage 9.2% 1.7% 0.3% 0.2% 0.1% 0.2% 11.7%
Back to Contents
F: Hostel 181 202 108 658 53 512 7 598 1 986 3 508 356 464
Percentage 1.5% 0.9% 0.4% 0.1% 0.0% 0.0% 2.9%
G: Other 33 582 9 704 5 300 3 295 1 165 3 483 56 529
Percentage of total HH 0.4% 0.1% 0.0% 0.0% 0.0% 0.0% 0.5%
Total (as at 2007) 6 854,458 2 001 486 866 514 845 679 457 408 1 353 211 12 378 756
Percentage of total HH 55.4% 16.2% 7.0% 6.8% 3.7% 10.9% 100%
New family formation 2 012 529 587 664 254 429 248 312 134 313 397 326 3 634,573
Total (projected to 2020) 8 866 987 2 589 150 1 120 943 1 093 991 591 721 1 750 537 16 013 329
Percentage of total HH as at 2007 7.,7% 20.9% 9.1% 8.8% 4.8% 14.1% 129%
Source: The household income data is based on data modelled by the Department of Economics at the University of Stellenbosch using the Community Survey of 2007.CHAPTER 5
5.2 Supply interventions
Supply-side interventions are programmes or activities that result in housing being supplied to house-
holds by the government. A total of 21 supply-side interventions have been considered and are applied
to four housing circumstances disaggregated by income level, as set out in Table 5. For households
within formal owned, formal rented and traditional dwellings, the intervention required is connection
of services where backlogs exist. This intervention is applicable to households of all income groups
and borne entirely by the State. Households falling within informal settlements may be eligible for six
interventions (listed in Table 5) and the total cost may be borne by a combination of State, household
and private sector contributions. For example, the option of site and service with incremental top
structure involves the State providing land/stand with services, while the household takes care of the
top structure using a combination of own savings and borrowing where necessary.
Table 5: Supply interventions by housing circumstance and income
Housing R0–R3 500 R3 500–R7 000 R7 000–R10 000 R10 000– R15 000– R20 000+
circumstance R15 000 R20 000
Formal, owned Nat: 41.4% 12.3% 5.5% 6.2% 3.4% 10.6%
Formal, rented
Traditional Metro: 25.9% 11.1% 6.2% 8.6% 4.3% 17.1%
dwelling
Service connection to backlog – water, sanitation, electricity
Informal Nat: 7.3% 1.6% 0.5% 0.2% 0.1% 0.1%
settlements
Metro: 10.0% 2.3% 0.7% 0.3% 0.1% 0.1%
In-situ upgrade of informal settlement with formal top structure
In-situ upgrade of informal settlement with incremental top structure
Site and service with formal top structure
Site and service with incremental top structure
Admin incorporation of informal settlements (basic level of service, no top structure)
RDP housing
Backyard Nat: 5.1% 1.3% 0.6% 0.3% 0.1% 0.2%
dwellings
Metro: 7.0% 2.0% 0.8% 0.5% 0.2% 0.4%
Upgrade of backyard rental (with incentive)
RDP housing
New family Nat: 2 012 529 587 664 254 429 248 312 134 313 397 326
formation and
housing ladder Metro: 925 770 331 087 164 370 196 996 94 754 367 944
RDP housing - - -
Site and service with incremental top - - - -
structure
Subsidised social rental (SHRA) - - - -
(apartment)
Social housing institution/privately - - - -
developed rental with an incentive
- Privately developed residential rental (apartment)
- Developer delivered formal house for ownership
Privately developed bonded RDP house
Sub-divided formal house for ownership with incentive
Household rental (formal apartment with incentive)
Private converted industrial space to residential units
Sustainable Delivery of Housing in South Africa // 25
Back to ContentsCHAPTER 5
5.2.1 Formal owned, formal rented and traditional dwellings
The total number of households living in formal owned, formal rented and traditional dwellings
nationally is approximately 9.8 million, of which 3.7 million live in metropolitan municipalities.
Interventions applicable for these households are mainly related to water, sanitation and elec-
tricity connections, would cost between R50-billion and R200-billion (depending on varying
service levels) and would be borne entirely by the State. This intervention comes at a signifi-
cant cost to the State because households make little or no contribution and gearing levels
are low. However, service connections have the greatest impact in terms of coverage and
developmental outcomes: access to basic services reduces most environmental and health
hazards associated with poor sanitation and low-quality water.
5.2.2 Informal settlements
The total number of households living in informal settlements nationally is approximately 1.2
million of which 688 000 live in a metropolitan municipality. Interventions applicable for these
households are shown in Table 6, with the cost of each intervention disaggregated in terms
of relative funding contribution from the State, households and private sector, as well as the
overall impact on households.
The interventions that have the highest impact on households are in-situ upgrading of informal
settlements with formal top structure, site and service with a formal top structure, and subsi-
dised RDP housing. However, these interventions are associated with the highest cost to the
State, create significant market distortions because of crowding out the private sector and do
not contribute to effective housing markets. Of all the interventions, the least overall impact
on households is from in-situ upgrading of informal settlements with an incremental top
structure, and site and service with an incremental top structure. The overall impact is lower
for households with incomes below R3,499 than for those with incomes above this amount
because of high levels of household indebtedness and an inability to access end-user finance.
However, these interventions have the lowest cost to the State and the highest gearing.
Compared to in-situ upgrading of informal settlements with formal top structure, site and
service and complete RDP housing, the administrative incorporation of informal settlements
with no top structure intervention has a slightly modest level impact on households, but at a
significantly lower cost to the State. The estimated total cost of administrative incorporation
is R29-billion. This intervention is premised on shifting the paradigm, so that informality is
accepted as part of the solution to housing, in light of the growing unevenness in number of
RDP houses delivered and people living in informal settlements.
5.2.3 Backyard dwellings
The total number of households living in backyard rental is approximately 945 000, of which 57
000 live in metropolitan municipalities. The majority earn between R0 and R3,499 per month.
As Table 7 shows, the two interventions deemed appropriate are either relocating the house-
holds to subsidised RDP housing or owner-upgraded backyard rental units (with incentives).
Subsidised RDP housing has a higher impact on all households but imposes a significant cost
to the State. When owners are given a sliding scale incentive to upgrade their backyard rental
units to a prescribed minimum standard, the outcome is a significant cost reduction to the
State, improved gearing levels from households and better developmental outcomes. (See
Table 7 on page 28)
26 // Sustainable Delivery of Housing in South Africa
Back to ContentsYou can also read