Overview of housing affordability in cities in the Czech Republic
←
→
Page content transcription
If your browser does not render page correctly, please read the page content below
39
1 Overview of housing affordability in
cities in the Czech Republic
House prices in the Czech Republic have soared faster than household
disposable income, especially in cities where house prices have often risen
at a faster pace than the national average. While the rise in house prices
may benefit the large share of Czech homeowners, it has made it even
harder for newcomers, especially the young, to get a foot on the housing
ladder. With rents also rising and with relatively limited supply, the private
rental market offers few alternatives for people struggling to find affordable
housing. Many low- and middle-income households are therefore getting
priced out of cities, or have no choice but to turn to substandard quality
housing. While structural drivers pushing housing demand up in Czech
cities are likely to remain despite the COVID-19 crisis, housing
development does not happen where it is most needed, i.e. where demand
for housing is highest, driving house prices up in Czech cities. Furthermore,
Czech households bear a heavy financial burden by living in cities where
the housing stock is often old and in need of energy efficiency
improvements.
HOUSING AFFORDABILITY IN CITIES IN THE CZECH REPUBLIC © OECD 2021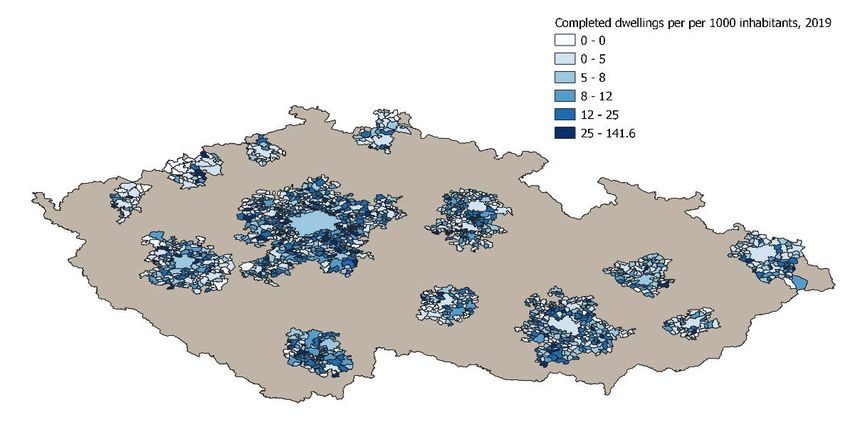
40
Introduction
As in many other OECD countries, many households in the Czech Republic are increasingly struggling to
access a decent, affordable home, with house prices reaching new highs and incomes falling out of pace.
This is especially the case for low-income households or households at risk of poverty, elderly people and
single-parent families. The challenge of housing affordability is even more acute in cities and urban areas,
where property and rental prices have often increased faster than in the Czech Republic in general and
housing cost overburden and overcrowding rates are higher.
At the time of writing this report, the COVID-19 pandemic has been unfolding around the world and
continues to shake housing markets. While the long-term impacts of the pandemic on the housing market
in the Czech Republic remain uncertain, the crisis has brought to the fore many of the longstanding issues
the Czech Republic was facing, such as housing insecurity, homelessness and housing inequalities.
After briefly defining housing affordability, this chapter starts with an overview of the historical context and
the influence it had on the Czech Republic’s housing market. It then focuses on housing affordability in
Czech cities by exploring the evolution of house prices and the main drivers for both demand and supply,
examining the burden of total housing-related costs that Czech households need to shoulder and
assessing the quality of housing in Czech cities, including housing’s energy efficiency, in comparison with
the rest of the country and other OECD countries.
To support the analysis, the OECD, in co-operation with the Ministry of Regional Development of the Czech
Republic (MMR), carried out a survey on 1 877 Czech municipalities in August/September 2020 to collect
data on the housing market and housing policies at the municipal level. The survey will hereinafter be
referred to as the “OECD-MMR housing survey”. The survey covered all municipalities within functional
urban areas (FUAs) of more than 50 000 inhabitants as defined by the OECD,1 as well as the municipalities
within the FUAs of Jablonec and Mladá Boleslav (see Annex A for further details on the administration of
the survey). Results from this survey are included in the chapters of the report.
Defining housing affordability
In the absence of a universally agreed definition of housing affordability, several organisations and
countries measure housing affordability in different ways, ranging from price-to-income and housing
expenditure-to-income ratios to housing quality measures (Box 1.1).
At its core, housing affordability is linked to the ability of households to pay for a dwelling. Housing
affordability is therefore often seen as a function of housing costs and the income of the household.
Housing costs are, in turn, driven by several factors including house prices, rents, mortgages, but also
insurance, mandatory services and charges (e.g. sewage and refuse removal charges), regular
maintenance and repairs, taxes and the cost of utilities (water, electricity, gas and heating). However,
affordability is not only about housing costs per se. It also involves the location of housing, the access that
housing provides to jobs and economic opportunities, public goods and services, as well as its quality:
Housing location is an important component of housing affordability, as poor housing location can
make seemingly affordable housing unaffordable for low-income families. When households live in
isolated and remote areas, where housing is cheaper, they tend to spend more on transport and
commute for longer hours, making housing more expensive and decreasing their well-being.
Furthermore, living in cheaper but less well-connected areas can reduce access to public services
(education, health, etc.), to public space (pavements, streets, public parks, commercial areas, etc.)
and jobs and economic opportunities.
HOUSING AFFORDABILITY IN CITIES IN THE CZECH REPUBLIC © OECD 2021
41
It is also critical to take into account the quality of housing. Beyond the walls and roof sheltering
people, housing is a place where people should feel safe, have enough physical space and enjoy
adequate sanitary conditions. Whether the dwelling responds to the household’s specific needs
also determines its quality, e.g. its accessibility for elderly people or people with disabilities. Energy
efficiency is at the intersection of housing quality and financial affordability, as energy-efficient and
better-insulated homes reduce the risk of dampness and provide warmer homes, thus improving
living conditions while reducing energy bills and improving housing affordability. Considering that
low-income households tend to spend relatively more on heating their homes than higher-income
households, improving energy efficiency in housing constitutes a key factor to build more inclusive
housing markets.
Box 1.1. Selection of definitions and measures of housing affordability
UN-Habitat states that “The underlying principle [of housing affordability] is that household financial
costs associated with housing should not threaten or compromise the attainment and satisfaction of
other basic needs such as food, education, access to health care, transport, etc. Based on the existing
method and data of UN-Habitat’s Urban Indicators Program (1996-2006), unaffordability is currently
measured as the net monthly expenditure on housing cost that exceeds 30% of the total monthly
income of the household” (UN, 2018[1]).
In 2010, a European Commission communication (the “European platform against poverty and social
exclusion: a European framework for social and territorial cohesion”) addressed the issue of affordable
accommodation by declaring that “access to affordable accommodation is a fundamental need and
right” (European Commission, 2010[2]). In Europe, housing affordability is analysed through the
housing cost overburden rate which is the share of the population in a country living in households
that spend 40% or more of their disposable income on housing (Eurostat, n.d.[3]).
Country examples
The Australian Bureau of Statistics measures housing affordability as the ratio of housing costs to
gross household income.
In the United Kingdom, the Office for National Statistics calculates a housing affordability ratio by
dividing house prices by annual earnings, with data for new dwellings, existing dwellings and all
dwellings combined, while earnings are available on a workplace basis and a place of residence basis
(Office for National Statistics, 2020[4]).
The United States Federal Reserve defines the issue of housing affordability by the rate of the
housing cost burden, i.e. the share of households that spend more than 30% of their income on
housing costs (Dumont, 2019[5]).
Various housing quality measures are also used to assess housing affordability, such as the number
of rooms per person, the overcrowding rate and the housing deprivation rate. Canada’s statistical office
Statistics Canada, for example, defines suitable housing as housing with enough bedrooms for the
size and composition of the household.
Source: UN (2018[1]), “Metadata Indicator 11.1.1: Proportion of urban population living in slums, informal settlements or inadequate housing”,
https://unstats.un.org/sdgs/metadata/files/Metadata-11-01-01.pdf; Eurostat (n.d.[3]), Housing Statistics: Statistics Explained; Office for
National Statistics (2020[4]), Housing Affordability in England and Wales: 2019; Dumont, A. (2019[5]), Housing Affordability in the US: Trends
by Geography, Tenure, and Household Income, https://doi.org/10.17016/2380-7172.2430.
HOUSING AFFORDABILITY IN CITIES IN THE CZECH REPUBLIC © OECD 2021
42
Accommodation can therefore be considered affordable if: i) households can afford to buy or rent it;
ii) households can afford to live in it (i.e. living in the accommodation does not overburden the households’
finances, when taking into account operation and maintenance costs as well as utility expenses, so that
they are able to pay for other obligations); and iii) it is adequate (i.e. it is of good quality and meets the
needs of its occupants). This definition will be used hereinafter to assess and analyse housing affordability
in cities in the Czech Republic.
The Czech housing market has a historically owner-dominated structure
As in many other former communist countries in Central and Eastern Europe, homeownership is the
dominant type of tenure in the Czech Republic, with 75% of households owning their accommodation
(i.e. 59% of households live in a dwelling that is owned outright and 16% in a dwelling that is owned with
an outstanding mortgage or housing loan). The rate of homeownership is also high amongst low-income
households, with 58% of households in the bottom quintile of the income distribution owning their dwelling
outright in 2018, i.e. without an outstanding mortgage or housing loan. While the share of outright owners
in the Czech Republic is well above the OECD average of around 43%, it is lower than in other former
socialist countries. In Lithuania, the Slovak Republic or Hungary, for example, outright homeownership
accounts for 80%, 76% and 73% of households respectively. This is mirrored by a relatively important role
played by the private rental market in the Czech Republic compared with other countries in Central and
Eastern Europe. Almost 18% of Czech households rent their dwelling from the private rental sector, which
is lower than the average in OECD countries (25%) but remains higher than in many other former socialist
countries. The share of households that rent their dwelling from the subsidised market (state-owned or
other) is very low, at 1.4% of all households (OECD, 2020[6]) (Figure 1.1).
Figure 1.1. Housing tenure distribution in OECD countries, 2018 or latest year available
Share of households in different types of tenure, in percentage
Own outright Owner with mortgage Rent (private) Rent (subsidised) Other, unknown
%
100
90
80
70
60
50
40
30
20
10
0
Note: Tenants renting at subsidised rent are grouped together with tenants renting at private rent in Australia, Canada, Chile, Denmark, Mexico,
the Netherlands and the United States, and are not capturing the full extent of coverage in Sweden due to data limitations.
Source: OECD (2020[6]), Affordable Housing Database, http://oe.cd/ahd.
HOUSING AFFORDABILITY IN CITIES IN THE CZECH REPUBLIC © OECD 2021 43 The housing tenure distribution in the Czech Republic, and especially the prevalence of homeownership and the relative importance of the private rental market, results from the transition to a market economy since 1989 and the subsequent privatisation of the housing stock. During the communist regime, which started in 1948, the Czech economy was governed by central planning and most of the economy was state-owned, including the housing stock. Almost all private multi-unit buildings that had been built during the construction boom between 1920 and 1938 or earlier were expropriated to become state property, with landlords forced to sell their property to the state at very low prices. State rental housing, therefore, became the dominant tenure in city centres, with the government allocating state-owned flats according to people’s needs and at a very low rent (Lux and Sunega, 2010[7]). Tenants who were allotted flats by the state obtained unlimited occupancy rights and tenants were able to transfer their “right of use” to their relatives or to exchange it with other user right holders (Lux and Mikeszova, 2012[8]). After the Velvet Revolution of 1989 and the change of regime, privatisation of the housing stock occurred via two main channels: i) through the restitution of the public housing stock that had been expropriated between 1948 and 1989, which was returned to their previous owners or their descendants by restitution laws; and ii) through the sale of the dwellings to sitting tenants at below-market prices, as low as 5% to 10% of the actual value (de Boer and Bitetti, 2014[9]). By 1993, most of the property transfers to private owners had been completed (about 6%-7% of the whole Czech housing stock) (Lux and Mikeszova, 2012[8]), mainly in towns and cities. In central Prague, for example, around 70% of all houses were returned to their previous owners. This process of transition from a socialist to a market economy has had a deep and lasting impact on the structure of the Czech housing market. In 1991, homeownership constituted 38% of the housing stock, 9% for co-operative housing and 39% for public rental, while private renting was almost non-existent (de Boer and Bitetti, 2014[9]). By 2018, homeownership and private renting had jumped to 75% and 18% respectively, while only 1.4% of Czech households rented their accommodation through the public subsidised rental market. The very small size of the municipality-owned housing market, including social housing rented out at below- market rates, also finds its roots in the historical context. The municipal rental sector was created after 1991 with the transfer of around 1.44 million state-owned dwellings to municipalities, i.e. about 39% of the housing stock in the Czech Republic. Municipalities became free to manage and allocate public housing, with no state regulatory framework, regulations on public housing allocation or requirements to provide housing to poor and vulnerable households. Faced with rent regulation preventing them from introducing any effective way of managing their housing stock without subsidising it and a lack of financial and human resources to ensure the maintenance of it, many municipalities privatised a major part of their housing stock (Lux and Sunega, 2017[10]). Today, social rental dwellings account for only 0.4% of the total number of dwellings in the Czech Republic – a very low share compared with other OECD countries (e.g. 37.8% in the Netherlands, 20% in Austria, 7.6% in Poland and 4.0% in Hungary (OECD, 2020[6])). The privatisation of the housing stock also gave rise to the emergence of a private rental sector that used to be virtually non-existent prior to the transition from communism. While the private rental sector plays a relatively important role in the Czech housing market and has experienced stronger growth than in most other central and eastern European countries, a split market has hampered the development of the private rental market into a strong and stable tenancy (de Boer and Bitetti, 2014[9]). The market was indeed split between existing contracts of sitting tenants, whose occupancy rights remained unaltered by the restitution of the flats to their original owners, and new contracts for which free market rental prices could be charged from 1993 to promote investments in rental housing. This created a divide between the “privileged” historical tenants – who had rent thresholds set by national governments and tenure security – and the “non-privileged” new tenants – whose rents fell under a liberal system of no regulation on rent setting or lease term and who had no effective tenant protection (Lux and Mikeszova, 2012[8]). In 2007, rents for sitting tenants started to adjust gradually to market rents, reducing the divide between regulated rents and free market rents. The deregulation was completed by 2012 and has helped create a more competitive HOUSING AFFORDABILITY IN CITIES IN THE CZECH REPUBLIC © OECD 2021
44
private rental market, increase private rental supply and improve accessibility for outsiders. However,
deregulation has also led to a significant decrease in rent setting protection for tenants and altered the
demand on the market, with private renting being seen as a temporary housing option for Czech
households, even among young people (Lux and Sunega, 2010[7]).
Many Czech households are struggling to access affordable housing, especially
in cities
House prices in the Czech Republic have increased sharply over the past few years, much faster than
household incomes, particularly in cities. While the rise in house prices is not necessarily an issue for the
large share of Czech households that already own their dwelling and do not plan to move, purchasing new
housing remains out of reach for most newcomers to the housing market. As rents have also been
increasing, the private rental market offers few alternative housing options.
House prices in the Czech Republic have increased faster than incomes
Since reaching their post-financial crisis low in 2013, house prices in the Czech Republic have increased
sharply and now largely exceed their pre-crisis level. Between the first quarter of 2013 and the second
quarter of 2020, real house prices rose by 43.1% – a much higher growth rate than in the OECD, where
real house prices increased by 24.9% on average over the same period (Figure 1.2). In 2018 alone, house
prices increased by 7.1% in the Czech Republic – the fourth highest annual growth rate among all OECD
countries, just under the growth rates observed in Hungary, Latvia and Portugal. While the pace of house
price increase has slowed down since 2018, house prices still rose by 6.3% between the fourth quarter
(Q4) of 2018 and Q4 2019 – much more than in the euro area on average (3.8%) and more than twice as
fast as in the OECD on average (2.5%). Estimates from the Czech National Bank (CNB) indicate that the
Czech housing market has been overvalued since 2017 and was overvalued by around 25% at the end of
2019 (CNB, 2020[11]).
Figure 1.2. Real house prices, change between Q1 2013 and Q2 2020
%
80
70
60
50
40
30
20
10
0
-10
-20
Note: Real house prices are nominal house prices deflated using the private consumption deflator from the national account statistics. Data for
New Zealand show the change in real house prices between Q1 2013 and Q1 2020.
Source: OECD (2021[12]), Analytical House Price Indicators Database, https://stats.oecd.org/.
HOUSING AFFORDABILITY IN CITIES IN THE CZECH REPUBLIC © OECD 2021 45
House prices in the Czech Republic have soared faster than household disposable income, making
housing increasingly unaffordable for first-time buyers, renters and those who have to move from cheap
areas into more expensive ones for work reasons for example. Since 2015, the price-to-income ratio in the
Czech Republic has experienced one of the fastest increases among all OECD countries (Figure 1.3). Real
house prices have steadily outpaced real wage growth – at an average rate of 2.6 percentage points per
year since 2013 – which has undermined housing affordability even in the context of declining borrowing
costs (EC, 2020[13]).
While the rise in house prices may benefit the large share of Czech households that own their dwelling
(due to the rise in the value of their assets), it means that purchasing new housing remains out of reach
for most newcomers to the housing market. This may in turn hinder upward social mobility, as current and
future generations are less able to purchase property than their parents (OECD, 2019[14]). Currently, Czech
households need to save more than 11 years of gross annual salaries to buy a standardised new dwelling
of 70 square metres (m²), compared to about 9 years in Latvia, and about 7 years in Hungary and Poland
(Deloitte, 2020[15]).
Figure 1.3. Price-to-income ratio, Q2 2020 or latest available
Index, 2015=100
140
135
130
125
120
115
110
105
100
95
90
Note: Nominal house prices divided by nominal disposable income per head.
Source: OECD (2021[12]), Analytical House Price Indicators Database, https://stats.oecd.org/.
House prices are particularly high in Czech cities, aggravating the housing affordability
crisis for urban residents
While house price growth has varied considerably across regions, it has generally been higher in cities
than in the rest of the Czech Republic. Across the Czech Republic, the larger the municipalities are in
terms of population, the more expensive housing is, suggesting that there is a price premium for living in
cities. In all 13 regions of the Czech Republic, house prices are consistently higher in municipalities that
have more than 50 000 inhabitants than in municipalities with fewer inhabitants (Figure 1.4).
Prague is the most expensive city in the Czech Republic. In the first quarter of 2020, the average price of
purchased flats in Prague was CZK 88 100 (EUR 3 340) per m², reaching as much as CZK 159 800
(EUR 6 060) per m² in district Prague 1 (1 of the 22 administrative districts of Prague which includes most
of the medieval centre of the city). This was almost 50% higher than the average price of purchased flats
HOUSING AFFORDABILITY IN CITIES IN THE CZECH REPUBLIC © OECD 202146
in all regional capitals of the Czech Republic at CZK 65 400 (EUR 2 480). According to the Czech
Statistical Office, Prague also recorded the strongest price growth (41.7%) since 2010 for all types of real
estate among all regions in the Czech Republic (Czech Statistical Office, 2020[16]). Purchasing prices for
new flats in Prague increased by 64% since 2010 and by 10.7% between the first quarter of 2019 and the
first quarter of 2020. According to the Eurostat perception survey, as many as 70% of inhabitants of the
FUA of Prague either strongly disagreed or somewhat disagreed that it was easy to find good housing at
a reasonable price in 2019, compared with about 35% of the population of Ostrava.
Figure 1.4. Flat prices by region and by population size of municipalities in the Czech Republic
Average purchase price of flats in the 13 regions of the Czech Republic and Prague, by size of municipalities,
2016-18
Less than 1 999 inhabitants Between 2 000 and 9 999 inhabitants
Between 10 000 and 49 999 inhabitants More than 50 000 inhabitants
CZK/m2
70 000
60 000
50 000
40 000
30 000
20 000
10 000
0
Source: Czech Statistical Office (2020[16]), Czech Statistical Office Statistics, https://www.czso.cz/csu/czso/statistics.
Following Prague, Brno was the second most expensive regional capital, with an average price of
purchased flats of CZK 65 400 in Q1 2020, followed by Ceske Budejovice (CZK 48 800), Hradec Kralove
(CZK 44 900) and Pilsen (CZK 44 700) (Deloitte, 2020[17]).
Rent prices have increased steadily but at a slower pace than house purchase prices
The private rental sector provides a housing option to the segments of the population who cannot afford to
enter the homeownership market or do not have access to the social housing market, due to ineligibility or
inefficiencies such as long waiting lists. While homeownership remains the preferred tenure for Czech
households, a fast increase in house prices combined with caps on mortgage loans (nine times borrowers’
net annual incomes since 2018) has hampered access to homeownership for newcomers, pushing more
households towards other types of tenures.
Even though the private rental sector has expanded since the 1990s, it only accounts for around 13%-
14% of the total housing stock. However, this national average masks territorial variations within
the Czech Republic, as cities tend to have a higher stock of private rental housing than the rest of the
country. In Prague, for example, about one-third of the housing stock is rented.
Rent prices in major cities are higher than in the rest of the Czech Republic. In 2019, the average monthly
rent in Prague was EUR 12.3 per m², which means that a tenant pays on average EUR 740 a month for a
60-m² flat (Deloitte, 2020[15]). While this remains lower than rent prices in large European metropolitan
HOUSING AFFORDABILITY IN CITIES IN THE CZECH REPUBLIC © OECD 2021 47
areas such as Amsterdam, London and Paris, rent prices in Prague are similar to those in other major
cities in Europe such as Marseille (France), Milan (Italy) and Rotterdam (Netherlands). They are also higher
than in Lisbon (Portugal), Vienna (Austria) and Berlin (Germany), where the average monthly rents were
EUR 11.8, EUR 9.9 and EUR 9.1 per m² respectively. In Brno and Ostrava, the average rent prices were
EUR 9.6 and EUR 6.4 per m² respectively (Figure 1.5).
Figure 1.5. Rental prices in selected countries and European cities
A. Rental prices developments in selected countries, index Q1 2008=100 B. Rental prices in major European cities, 2019
EUR/m2
Sofia 4.1
CZE EST HUN Ostrava 6.4
LVA LTU SVK Turin 6.9
SVN EUR Belgrade 7.
Porto 8.6
Berlin 9.1
180 Brno 9.6
Vienna 9.9
Hamburg 10.5
Bratislava 11.
160 Krakow 11.5
Budapest 11.6
Frankfurt 11.7
Brussels 11.8
140 Lisbon 11.8
Marseille 12.
Prague 12.3
Milan 12.5
120 The Hague 12.8
Lyon 12.8
Rotterdam 12.9
Rome 13.3
100 Munich 16.4
Warsaw 16.7
Madrid 18.6
Bergen 19.2
80 Barcelona 19.3
Copenhagen 19.9
Amsterdam 20.7
Dublin 25.
60 Oslo 25.8
London (inner) 27.
Paris 28.3
Luxembourg 30.7
40
0 10 20 30 40
Sources OECD (2021[12]), Analytical House Price Indicators Database, https://stats.oecd.org/; Deloitte (2020[15]), Property Index: Overview of
European Residential Markets.
Since 2005, real rent prices have almost doubled in the Czech Republic – one of the largest increases
among OECD countries (Figure 1.6). Although much of the rise in rents since 2005 can be explained by
rent deregulation and catch-up from low rent levels inherited from the socialist regime, the increase has
also been strong in more recent years – and stronger than in some neighbouring countries (Figure 1.5).
However, the rise in rents has not been as strong as the rise in house purchase prices. Between the second
quarter of 2019 and the second quarter of 2020, rent prices in the Czech Republic increased by 3.7%,
lower than the 4.3% increase in house purchase prices over the same period but one of the highest growth
rates among European and OECD countries. In the euro area on average, rent prices rose by 1.3% over
the same period.
Rental markets in the major cities of the Czech Republic have been impacted by the COVID-19 crisis, as
measures introduced to contain the spread of the virus led to a near-complete freeze of tourism activities
around the world (OECD, 2020[18]). As a result, many flats located in the centre of touristic cities such as
Prague, which were used for short-term rentals through peer-to-peer accommodation rental Internet
platforms, have been introduced into the long-term rental market, creating some downward pressure on
rents. However, this could be short-lived, as uncertainties remain on medium- to long-term impacts of the
COVID-19 crisis on rental markets and about whether these dwellings will return to the short-term market
once tourism activity recovers.
HOUSING AFFORDABILITY IN CITIES IN THE CZECH REPUBLIC © OECD 202148
Figure 1.6. Rent prices, change between Q1 2005 and Q4 2020
Rent price index, 2015=100, seasonally adjusted
%
350
300
250
200
150
100
50
0
-50
Note: Data for Q4 2020 were not available for Australia and New Zealand for which data for Q3 2020 were used.
Source: OECD (2021[12]), Analytical House Price Indicators Database, https://stats.oecd.org/.
Drivers pushing housing demand up in Czech cities are likely to withstand the
COVID-19 crisis
While the COVID-19 pandemic is still unfolding, whether it will have a long-lasting impact on housing
affordability will depend on many factors, including the duration of the pandemic and the extent of recovery
packages. The impacts of the crisis also vary significantly across territories, for example depending on the
region’s exposure to tradeable sectors and global value chains, its specialisation such as tourism and its
share of occupations amenable to remote working (OECD, 2020[19]). However, evidence from past
pandemics suggests that the impacts on the housing market and the decline in house prices in cities are
generally short-lived (Francke and Korevaar, 2021[20]). In particular, cities’ resilience to major shocks and
resulting urban change can drive house prices up back to their previous levels. The following section
discusses the structural drivers of housing demand in cities in the Czech Republic.
Housing demand in the Czech Republic has been fuelled by various economic, financial
and demographic factors
Some factors that have driven the strong demand for housing in cities are common to the Czech Republic.
Strong economic growth and rising real wages until 2020.
The Czech economy has been thriving in the past few years and economic growth has accelerated since
2013. In the years preceding the COVID-19 pandemic, national gross domestic product (GDP) expanded
by 5.2% in 2017, 3.2% in 2018 and 2.3% in 2019. The Czech Republic’s geographical location and
openness to foreign direct investment – also driven by the country’s accession to the European Union (EU)
and single market – fostered integration to global value chains and higher productivity (OECD, 2020[21]).
Combined with low unemployment and a tight labour market with a high level of job vacancies, this has
contributed to an acceleration of wage growth, resulting in a convergence of incomes and GDP per capita
HOUSING AFFORDABILITY IN CITIES IN THE CZECH REPUBLIC © OECD 2021 49
towards the OECD average and rising living standards. In turn, the Czech Republic has maintained one of
the lowest rates of inequality and poverty in the OECD (OECD, 2020[21]) (Figure 1.7).
Figure 1.7. Converging GDP per capita and low-income inequalities
A. GDP per capita B. Gini coefficient, 2018 or latest year available
USD, current prices, current PPPs, OECD = 100 Scale from 0 "perfect equality" to 1 "perfect inequality
Czech Republic CEECs EA19 0.5
0.45
110
0.4
100
0.35
90
0.3
80
0.25
70
0.2
60 0.15
50 0.1
40 0.05
30 0
1995 1998 2001 2004 2007 2010 2013 2016 2019 FIN
NZL
LVA
SVK
GRC
ITA
CZE
LTU
SVN
BEL
NOR
ESP
FRA
EST
TUR
MEX
SWE
IRL
POL
JPN
ISR
GBR
CHL
ISL
DNK
NLD
CHE
HUN
LUX
KOR
AUT
PRT
DEU
CAN
AUS
USA
Note: Central and Eastern European countries (CEECs) are Hungary, Poland, the Slovak Republic and Slovenia.
Source: OECD (2020[22]), Productivity Database, https://stats.oecd.org/; OECD (OECD[23]), Income Distribution Database,
https://stats.oecd.org/.
Figure 1.8. Economic sentiment and GDP forecasts for 2020 and 2021
A. New confirmed cases per day, 7-day moving average B. Real GDP and unemployment rate
Czech Republic OECD countries Real GDP Unemployment rate (right axis)
Per million inhabitants 2019 Q4 = 100 %
1 400 105 5.5
1 200
100 4.5
1 000
800
95 3.5
600
400
90 2.5
200
0 85 1.5
Mar 20 May 20 Jul 20 Sep 20 Nov 20 2017 2018 2019 2020
Source: OECD (2020[24]), OECD Economic Outlook, Volume 2020 Issue 1, https://dx.doi.org/10.1787/0d1d1e2e-en.
However, the COVID-19 pandemic and the resulting lockdown and containment measures that were put
in place from March 2020 onwards have had a deep adverse economic impact, putting a halt to the
continuous growth experienced in the past few years. In spring 2020, with restrictions to mobility and
private consumption, retail sales and industrial output fell respectively by 9% and 11% year-on-year
(OECD, 2020[24]). While the first wave of the outbreak was relatively well contained and recovery started
when the initial lockdown ended in April 2020, the Czech Republic experienced a stronger second wave
HOUSING AFFORDABILITY IN CITIES IN THE CZECH REPUBLIC © OECD 202150
of the epidemic, which triggered renewed restrictions and a freeze in the recovery since September 2020.
Unemployment also started to rise from its initially low levels, reaching 2.9% in the third quarter of 2020,
although it remains very low in international comparison. GDP is estimated to have contracted by around
5.6% in 2020 and is expected to recover slowly, by 1.5% in 2021, and 3.3% in 2022 (OECD, 2020[21]).
While a more prolonged lockdown could hamper recovery, a quicker-than-expected deployment of
vaccines – which are for now expected to be widely deployed only in the second half of 2021 – and
continued government support to companies could trigger higher confidence and stronger economic
growth in the coming year.
Whether or not the economic crisis will have an impact on house prices in the long term is uncertain at this
point. However, at the time of writing, house prices do not seem to have been affected by the crisis and
have continued to rise. Real house prices increased by almost 6% year-on-year in the third quarter of
2020.
Favourable lending conditions, with low mortgage rates and high availability of credit.
According to data from the CNB, total lending to households for housing purchases represented more than
three-quarters of all loans to households and amounted to CZK 1 436 billion (EUR 51.6 billion) at the end
of December 2020 (of which CZK 1 343 billion, i.e. 94%, were mortgages) (Figure 1.9). In recent years,
the high volume of new mortgages has been driven by low interest rates, household income growth and
Czech households’ continued preference for homeownership. While a record amount of housing loans had
been granted to households in 2018 (CZK 232 billion of which CZK 187 billion [i.e. 80%)] in mortgages),
credit growth has slowed down since then, due to a tightening of lending conditions introduced by the CNB
in order to counter the “spiral between property prices and property purchase loans” (CNB, 2018[25]). The
CNB introduced caps on the debt-to-income (DTI) ratio and the debt service-to-income (DSTI). From
October 2018, debt should not exceed 9 times the net annual income of borrowers and the DSTI ratio
should not exceed 45%. However, these prudential ratios are only recommendations and have no binding
power, which limits their effectiveness (OECD, 2018[26]). The average size of loans provided for house
purchases has also increased, mainly because of the increase in house prices. About one-fifth of Czech
households are currently repaying a housing mortgage (CNB, 2019[27]). Between March and May 2020,
the CNB cut policy rates 3 times, from 2.25% to 0.25%, and lowered the counter-cyclical buffer from 1.75%
to 1% to help banks extend credit. Financial conditions for purchasing property, therefore, remain
favourable and are likely to continue to boost the attractiveness of investing in housing.
Figure 1.9. Lending to households for house purchase
Mortgage loans Other housing-related loans
CZK millions
1 600 000
1 400 000
1 200 000
1 000 000
800 000
600 000
400 000
200 000
0
Source: CNB (2020[28]), Czech National Bank Statistics, https://www.cnb.cz/en/statistics/.
HOUSING AFFORDABILITY IN CITIES IN THE CZECH REPUBLIC © OECD 2021 51
Changes in household composition and population ageing.
Demographic growth in the Czech Republic has been low and the size of households has been decreasing
steadily. The average size of a Czech household reached 2.42 people in 2018 and the number of
households increased to almost 4.4 million households in 2018, leading to more demand for housing.
Furthermore, the Czech Republic is ageing more rapidly than most European countries, with the share of
the population aged 65 years or more increasing by 5 percentage points between 2008 and 2018.
Projections also show that the share of the population aged 80 years old or more is expected to increase
from 4% of the total population today to more than 12% by 2060 (Figure 1.10). By 2040, about a quarter
of the population is expected to be 65 years or older, compared with 18% of the population today (OECD,
2018[26]). While evidence of how population ageing affects house prices is ambiguous, population ageing
does influence the type of housing demand, as the older and less mobile population has specific needs in
terms of housing size and accessibility, for example. Adapting the existing housing stock to meet demand
from an ageing population therefore implies home renovation and upgrading efforts.
Figure 1.10. Evolution of households in the Czech Republic
A. Number of households and household size B. Population structure projections
Number of households (left axis) 0-14 year-olds 15-64 year-olds
Size of households (right axis) 65-80 year-olds 80+ year-olds
Thousands %
4 500 2.65 100
90
4 400
2.6 80
4 300
70
4 200 2.55 60
50
4 100 2.5
40
4 000
30
2.45
3 900 20
3 800 2.4 10
0
2018 2030 2040 2050 2060
C. Increase in the share of the population aged 65 or over between 2009 and 2019 (percentage points)
6
5
4
3
2
1
0
Source: ECB (2020[29]), Statistical Data Warehouse, https://sdw.ecb.europa.eu/home.do; OECD (2020[30]), Population Statistics,
https://stats.oecd.org/.
HOUSING AFFORDABILITY IN CITIES IN THE CZECH REPUBLIC © OECD 202152
However, some factors of housing demand are specific to cities
Whereas some factors influencing house prices are national, such as demographic trends, the availability
of credit and the CNB’s interest rate policy (discussed in the previous section), housing markets are by
definition influenced by their location and involve a range of specific local factors. Cities are popular
locations and attract people who want to benefit from the availability of jobs, education, lifestyles and
cultural opportunities, as well as urban infrastructure, public goods and services.
The share of population living in cities and towns or semi-dense areas is lower than the average in high-
income countries (22% in urban centres, 37% in towns and semi-dense areas and 41% in rural areas in
the Czech Republic, compared with 49%, 27% and 24% respectively in high-income countries on average)
(OECD/EC, 2020[31]). However, over the last decade in the Czech Republic, the population living in FUAs,
i.e. a city and of its commuting zone (Dijkstra, Poelman and Veneri, 2019[32]), has increased faster than in
the country overall. According to the Czech Statistical Office, the population in all Czech FUAs increased
by 4.5% between 2009 and 2019, compared to only 1.8% in the Czech Republic in the same period (Czech
Statistical Office, 2020[16]). The fastest increase in population over the last decade was registered in the
FUAs of Brno, Ceske Budejovice, Pilsen and Prague. Prague expanded by 9.7% in 10 years and Brno,
Pilsen and Ceske Budejovice rose by 5.7%, 5.4% and 5.3% respectively. Faster population growth in cities
is due to inflows from rural areas to the main cities, as well as inflows of migrants from abroad who tend to
settle in urban areas. Some cities that host high-quality and renowned universities, such as Brno, Olomouc
and Pilsen, also attract many Czech and international students. Conversely, some FUAs lost population.
This is the case of Ostrava and Most, for example, where the population decreased by 5.1% and 4.9%
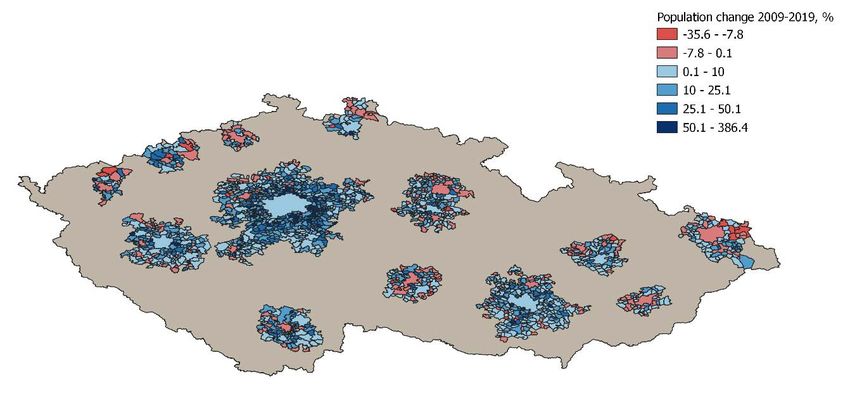
respectively between 2009 and 2019 (Figure 1.11).
Figure 1.11. Population change in municipalities of FUAs, 2009-19
Source: OECD calculations based on Czech Statistical Office (2020[16]), Czech Statistical Office Statistics,
https://www.czso.cz/csu/czso/statistics.
HOUSING AFFORDABILITY IN CITIES IN THE CZECH REPUBLIC © OECD 2021 53 Some Czech cities are also very attractive to investors and demand for investment properties has been increasing – especially demand for prime properties by foreigners who have been able to purchase real estate in the Czech Republic without limitation since 2012 (IMF, 2018[33]). Prague, in particular, has become a mainstream destination for property investment in Europe (PwC/Urban Land Institute, 2017[34]). This has put more pressure on house prices in the past few years. Although the economic literature analysing the direct impact of foreign acquisition of real estate on domestic house prices remains scarce, there is cross-country evidence of a broad relationship between aggregate capital inflows and house prices, through the increased demand for housing, the increased money supply and liquidity due to capital inflows and the positive impact of capital inflows on economic activity, pushing house prices further up (Cavalleri, Cournède and Ziemann, 2019[35]). The increase in tourism and the intensified use of short-term rental platforms has been fostered by the higher yield generated by short-term rentals compared with the yield generated on the long-term rental market. This has also led to a decline in available and affordable rental flats and a surge in rental prices in the capital city. In 2018, Prague was the 6th most visited city in Europe and 22nd in the world, with a total amount of 9.15 million tourists – ahead of other popular European destinations such as Amsterdam, Barcelona, Milan or Vienna (Euromonitor International, 2019[36]). In Prague, the share of peer-to-peer accommodation in the total hospitality accommodation capacity has been growing rapidly, from 34% in 2016 to almost 41% in 2018, almost matching the accommodation capacity of hotels (Deloitte, 2019[37]). While peer-to-peer listings account for less than 2% of Prague’s total housing stock and are mostly concentrated in the historical centre, almost a quarter of Prague’s Old Town flats are rented out for tourist short-term rentals (see Chapter 2 for examples of policies implemented by OECD countries to regulate holiday rentals). The COVID-19 crisis put a sudden halt to touristic activities in the Czech Republic, as in all other OECD countries, significantly impacting the short-term rental market. Many short-term rental properties have remained vacant, while some owners have turned their properties into long-term rentals. While this could result in stabilisation or even a decrease in rent prices, the effects are likely to be modest and short-lived, given that these short-term rentals account for only a small share of total accommodations and that tourism activity is expected to pick up again when the COVID-19 crisis is under control. An increasing share of the urban population lives outside urban centres, creating other social and environmental challenges The Czech Republic has one of the highest shares of urban population residing outside urban centres. The decentralisation index, i.e. the percentage of population residing outside the high-density peaks of an urban area, is approximately 10% higher in the Czech Republic than in the average OECD country (OECD, 2018[38]). Between 2009 and 2019, in all Czech FUAs except for Most, the population increased faster in the commuting zones of the FUAs than in their core cities, indicating a phenomenon of urban sprawl (Figure 1.12). Other indicators also confirm that Czech cities have been sprawling since 1990. Average population density, i.e. the average number of inhabitants in a km2 of land of an urban area, has decreased by 11%, while decentralisation has increased by 13%. This has also been accompanied by an 8% increase in polycentricity, i.e. the number of high population density peaks in urban areas. These numbers mean that more urban centres have emerged but a greater number of urban residents have moved outside of them (Figure 1.13) (OECD, 2018[38]). HOUSING AFFORDABILITY IN CITIES IN THE CZECH REPUBLIC © OECD 2021
54
Figure 1.12. Population change in FUAs, core cities and commuting zones, 2009-19
Total FUA Core city Commuting zone
%
20
15
10
5
0
-5
-10
-15
Source: Czech Statistical Office (2020[16]), Czech Statistical Office Statistics, https://www.czso.cz/csu/czso/statistics.
Figure 1.13. Change in urban sprawl indicators, 1990-2014
Relative change
1990-2000 2000-14
Dispersion
Decentralisation
Polycentricity
Fragmentation
Population density
-0.15 -0.1 -0.05 0 0.05 0.1 0.15
Note: Population density: average number of inhabitants per square kilometre (km²) of land. Dispersion: standard deviation of population density.
Polycentricity: number of high population peaks in an urban area. Fragmentation: number of urban fabric fragments per km² of built-up area.
Decentralisation: percentage of population residing outside areas of peak density.
Source: OECD (2018[38]), Rethinking Urban Sprawl: Moving Towards Sustainable Cities, https://doi.org/10.1787/9789264189881-en.
Urban sprawl has significant environmental, economic and social consequences, including higher
emissions from road transport (as sprawled cities are characterised by larger distances between homes
and jobs, more likely to be covered by car), and higher costs of providing key public services (such as
water supply, electricity and public transport, which are more expensive to provide in fragmented areas).
Main cities do have integrated transport systems and public transport is the main mode used by residents
in Prague and Ostrava (70% and 53.4% of residents respectively). However, the increase in
HOUSING AFFORDABILITY IN CITIES IN THE CZECH REPUBLIC © OECD 2021 55
suburbanisation, coupled with the rise in households’ incomes, has resulted in an increase in car ownership
in the Czech Republic. In Prague, car ownership grew by more than 40% between 2010 and 2019, leading
to congestion, noise and air pollution (OECD, 2018[39]; Czech Statistical Office, n.d.[40]). In the outer zone
of the city of Prague, car traffic volume increased over the past 10 years, while it decreased in the centre
of the city (Figure 1.14).
Figure 1.14. Car traffic volume has gone up in Prague’s outer zone, 2006-16
Passenger transport in Prague
Public transport Outer zone road traffic volume City centre road traffic volume
2006=100
125
100
75
2006 2007 2008 2009 2010 2011 2012 2013 2014 2015 2016
Note: Public transport: index based on the number of passengers transported. Traffic volume: index based on the number of vehicles over the
24 hours of an average workday. City centre: bounded by Petřín in the west, Letná in the north, Riegrovy sady in the east and Vyšehrad in the
south (the Strahov and Mrázovka tunnels lie outside the central cordon). Outer zone: traffic volume is measured where the main roads and
motorways enter the city centre.
Source: City of Prague (n.d.[41]), Prague Transportation Yearbook, Various years.
Czech cities face a shortage of housing supply
Started and completed dwellings have not caught up with their previously high levels
When housing supply is elastic enough, it ensures that the economy responds to housing needs in a timely
manner without large price increases, thus underpinning housing affordability. However, the high and
growing demand for housing in Czech cities has not been met by a sufficient increase in housing supply.
Construction activity declined after the global financial crisis and has yet to recover. The numbers of started
and completed dwellings per 1 000 inhabitants decreased sharply between 2008 and 2013. Although these
numbers picked up again since 2014, they have not caught up yet with the levels reached before 2008. In
2019, dwelling completions rose by 7.6% from the previous year to 36 406 units, following annual increases
of 18.5% in 2018, 4.6% in 2017 and 8.9% in 2016, according to the Czech Statistical Office (Czech
Statistical Office, 2020[16]). Likewise, dwelling starts were up by 16.8%, reaching 38 677 units in 2019.
However, the number of flats starts and completions per 1 000 inhabitants currently remains below their
2008 levels, with construction responding only very slowly to the increased demand for housing in recent
years (Figure 1.15).
Furthermore, according to calculations from the MMR, the total stock of housing decreased between 2011
and 2017. Not enough new dwellings were built to compensate for some of the wear and tear of old
HOUSING AFFORDABILITY IN CITIES IN THE CZECH REPUBLIC © OECD 202156
dwellings or the change in use from residential to commercial, for example. While the stock of housing
increased in 2018 and 2019, it has not gone back to its previous level. The COVID-19 pandemic also froze
all construction projects in spring 2020, leading to a sharp decrease in completed dwellings for 2020
(Figure 1.15).
Figure 1.15. Number of dwellings started and completed in the Czech Republic
Dwellings started per 1 000 inhabitants Housing stock (left axis)
Dwellings completed per 1 000 inhabitants Completed dwellings (right axis)
4.5 4 375 000 40 000
4 370 000 35 000
4
4 365 000
30 000
3.5 4 360 000
25 000
4 355 000
3 20 000
4 350 000
15 000
2.5 4 345 000
10 000
4 340 000
2
4 335 000 5 000
1.5 4 330 000 0
Source: Ministry of Regional Development and OECD calculations based on Czech Statistical Office (2020[16]), Czech Statistical Office Statistics,
https://www.czso.cz/csu/czso/statistics.
Construction activity does not happen where it is most needed
Such construction numbers at the national level hide wide variations among territories and cities. While
about 20% of all completed dwellings were built in Prague (around 6 700 completed flats and family houses
in 2019), the number of dwellings completed per 1 000 inhabitants is still low, with just above 5 completed
dwellings per 1 000 inhabitants. In most major Czech cities, the number of completed dwellings per 1 000
inhabitants in 2019 was also below 5. The only exceptions among the core cities of the 15 Czech FUAs
are Pilsen, Olomouc and Ceske Budejovice, where there were 7.4, 7.9 and 8.4 completed dwellings per
1 000 inhabitants respectively in 2019. Furthermore, in all Czech FUAs except Olomouc, the number of
completed dwellings per 1 000 inhabitants was higher in the commuting zones of FUAs than in core cities,
mirroring the higher population increase in the commuting zones and confirming the suburbanisation trend
discussed earlier (Figure 1.16).
Furthermore, the OECD-MMR housing survey shows that housing development in the Czech Republic has
been unrelated to price levels. When housing construction does happen, it does not seem to focus on high-
priced areas. Figure 1.17 shows the relationship between a municipality’s house prices and the number of
building permits per 1 000 inhabitants that were issued between 2015 and 2019. There is no indication
that municipalities with higher price levels have experienced increased construction activity, which
suggests that the growth in demand (reflected in higher prices) has not been buffered by an increase in
supply. In contrast, many municipalities with low price levels experienced considerable housing
development. In these municipalities, there is therefore a risk that this excess housing development creates
undesired side-effects in terms of urban sprawl as described earlier. This pattern of non-correlation
between house prices and construction levels is also observed at the level of the FUA. The two FUAs
where the most building permits were issued (Liberec and Mladá Boleslav) have only average housing
prices, while Prague did not have a significant amount of issued building permits even though it registers
the highest housing prices (Figure 1.18).
HOUSING AFFORDABILITY IN CITIES IN THE CZECH REPUBLIC © OECD 2021 57
Figure 1.16. Completed dwellings per 1 000 inhabitants in FUAs in the Czech Republic
Source: OECD calculations based on Czech Statistical Office (2020[16]), Czech Statistical Office Statistics,
https://www.czso.cz/csu/czso/statistics.
Figure 1.17. No correlation between price levels and construction activity (respondent
municipalities), 2015-19
Building permits per 1 000 inhabitants
200
180
160
140
120
100
80
60
40
20
0
0 10 000 20 000 30 000 40 000 50 000 60 000 70 000 80 000 90 000 100 000
Average price per m² for residential property
Note: The vertical axis shows the number of building permits granted during 2015-19 per 1 000 inhabitants. The horizontal axis provides average
residential property prices as estimated by local officials.
Source: OECD/MMR (2020[42]), OECD-MMR Housing Survey of Municipalities in the Czech Republic.
HOUSING AFFORDABILITY IN CITIES IN THE CZECH REPUBLIC © OECD 202158
Figure 1.18. No correlation between house price levels and construction activity in FUAs in the
Czech Republic
No. of building permits per 1 000 inhabitants Housing prices per m² (in CZK)
50 70 000
45
60 000
40
35 50 000
30
40 000
25
30 000
20
15 20 000
10
10 000
5
0 0
Note: The left-side axis shows the number of building permits granted during 2015-19 per 1 000 inhabitants. The right-side axis provides average
residential property prices as estimated by local officials.
Source: OECD/MMR (2020[42]), OECD-MMR Housing Survey of Municipalities in the Czech Republic.
Private sector housing supply faces several constraints
Several factors can explain the shortage of housing supply in the Czech Republic. First, partly due to a
very low unemployment rate (2.1% of the labour force in the fourth quarter of 2019 – the lowest
unemployment rate among all OECD countries), there has been a shortage of qualified workers in the
construction sector. This made it difficult for developers and local governments to find contractors and led
to lengthy construction times and higher construction costs. The overall number of construction companies
has actually decreased (with a decline in company births and an increase in company deaths), while the
number of job vacancies in the construction sector grew by more than 80% between 2010 and 2015 (from
4 239 to 7 689 job vacancies) (EC, 2018[43]).
Furthermore, the complex building permit process generates delays in obtaining building permits and
licences, creating bottlenecks in housing construction. The Czech Republic ranks 157 th out of 190 countries
surveyed in the World Bank’s Doing Business 2020 survey in terms of “dealing with construction permits”
(2019[44]). It takes 21 procedures and 246 days to build a warehouse in the Czech Republic, whereas in
the OECD on average, it takes 12.7 procedures and 152.3 days. As a result, the responsiveness of housing
supply to changes in housing demand is weak, which can lead to sudden price increases if demand rises
(Bétin and Ziemann, 2019[45]; Cavalleri, Cournède and Özsöğüt, 2019[46]).
According to the OECD-MMR housing survey, municipalities responded that the main constraints for
private developers were the cost of infrastructure provision, the lack of available land and the lack of
infrastructure capacity (Figure 1.19). In line with the aforementioned World Bank data, the complicated and
lengthy building permit process also ranked high on the list of constraints.
HOUSING AFFORDABILITY IN CITIES IN THE CZECH REPUBLIC © OECD 2021 59
Figure 1.19. Main constraints for private developers
Costs of infrastructure provision are too high
Land is unavailable for development due to ownership issues
Lack of infrastructure capacity
Lack of undeveloped land
Complicated building permit process
Opposition from current residents/stakeholders
Lengthy building permit process
Irregular land plots
Stringent energy efficiency standards
Land-use regulations make development impossible
Costs of development are too high
Land is kept undeveloped by owners/developers
Land use regulations make development costly
Land is physically unsuitable for development
High clearance and remediation costs for brownfields
Lack of capable construction firms
0 0.5 1 1.5 2 2.5 3 3.5
Note: The horizontal axis shows the average score of each constraint based on a Likert scale ranging from 0 for “no importance” to 5 for “very
high importance”.
Source: OECD/MMR (2020[42]), OECD-MMR Housing Survey of Municipalities in the Czech Republic.
Living in cities imposes a heavy financial burden on Czech households
As discussed previously, housing affordability is not only about the ability to buy or rent a house but also
the ability to live in it and to have enough remaining income to meet other basic needs. Two common
indicators in this regard are: i) the share of housing-related expenditures (i.e. rent or mortgage, water,
electricity, gas and other housing-related expenditures) relative to overall final consumption expenditures
of a household; and ii) the housing cost overburden, which is the share of households that spend more
than 40% of their disposable household income on rent or mortgage.
Housing-related expenditures put a substantial burden on Czech households
Housing costs take up a large share of the budget of Czech households and represent their largest single
expenditure. In 2018, Czech households on average devoted 26.5% of their expenditures to housing, i.e. to
rents or imputed rents, insurance, mandatory services and charges, maintenance and repairs, taxes and
the costs of utilities (water, electricity, gas and heating). This share is higher than the OECD average,
where housing-related expenditure constituted 22.3% of final household expenditure, and it is one of the
highest shares among all OECD countries (Figure 1.20). This share also represented an increase from
22.8% of final household consumption expenditure in 2000.
A relatively small share of Czech households’ expenditure goes towards rents due to the large share of
outright owners. Only 2.9% of final household consumption is spent on actual rents, compared to about
4% in the OECD on average. Spending on imputed rents, i.e. the estimated rent that owner-occupiers
theoretically pay to themselves, accounts for 13.9% of final consumption in the Czech Republic, slightly
above the OECD average of 13%. However, Czech households dedicate a relatively large share of
HOUSING AFFORDABILITY IN CITIES IN THE CZECH REPUBLIC © OECD 2021You can also read