GROWTH MINDSET AGRI FOCUS - ANZ RESEARCH APRIL 2019
←
→
Page content transcription
If your browser does not render page correctly, please read the page content below

ANZ RESEARCH
                                       AGRI FOCUS
                                         APRIL 2019

                                       GROWTH
                                       MINDSET

ANZ Research Agri Focus | April 2019
This is not personal advice. It does       Primary producers are benefiting from high in-market prices for
not consider your objectives or            export goods, which are being fed back to producers through
circumstances. Please refer to the
                                           elevated returns at the farm or orchard gate level. Industry
Important Notice.
                                           confidence varies between sectors with high debt levels in the
                                           dairy sector weighing on sentiment.
INSIDE
                                           Milk prices are trending up but the dairy industry remains cautious. Dairy farmers
Dairy                                  1   are focusing on ensuring their farming operations meet regulatory and consumer
Lamb & wool                            3
                                           expectations, as well as focusing on debt reduction.
Beef                                   6   Meanwhile, optimism is starting to creep back into the sheep and beef sector. Lamb
Deer                                   8   returns have held at exceptionally high levels throughout the season, while those for
Grain                             10       beef have been steady. Beef returns have benefited from the emergence of China as
                                           a strong alternative market, reducing the industry’s reliance on the United States.
Forestry                          11
Horticulture                      13       Horticultural markets remain robust. A record harvest of apples and kiwifruit
Rural property market             15       is expected. However, wine growers are not having such a great season, with
Economic overview                 17       indications to date that yields are well below expectations.
Key forecasts                     19       While commodity returns are generally strong at present, this is occurring against a
                                           backdrop of slowing global economic activity. This poses a key risk for our agriculture
                                           and horticulture sectors due to our very high exposure to export markets.
CONTRIBUTORS
                                           The wellbeing of China’s economy in particular is a key risk given that market
Susan Kilsby                               directly accounts for 24% of our exports. We also have further indirect exposure to
Agriculture Economist                      this market as many of our other export partners, such as Australia, are also highly
Telephone: +64 4 382 1992                  exposed to China. But for now demand from China is showing no signs of letting up.
Susan.Kilsby@anz.com
                                           Prices at farm/orchard level relative to 10yr average
Sharon Zollner
                                                     Dairy prices have continued to strengthen,                   Milk price
Chief Economist NZ
Telephone: +64 9 3574094                             supported by a reduction in global milk supply.
                                           Dairy
                                                     This has supported a lift in the milk price forecast
Sharon.Zollner@anz.com                                                                                      Low                 High
                                                     for the 2018/19 season as well as next season.
                                                     Lamb and mutton farmgate prices remain                       19kg lamb
                                                     exceptionally high, supported by strong in-
Publication date: 1 April 2019             Sheep     market prices. Lamb processing has been slower
                                                     than normal with lambs being grown to heavier          Low                 High
                                                     weights.
                                                     Farmgate returns have eased as processing                    Prime steer
                                                     throughput has lifted on the back of a reduction
                                           Beef      in pasture production. China is providing a
                                                     strong alternative market to the US, which is          Low                 High
                                                     supporting returns.
                                                                                                                  A-grade log
                                                    Steady demand from China is soaking up the
                                                    high volumes of logs being felled in NZ. Industry
                                           Forestry
                                                    confidence is high but labour shortages will limit      Low                 High
                                                    expansion.

ANZ Research Agri Focus | April 2019
DAIRY

DAIRY UPTURN                                                                 We now expect New Zealand’s milk supply to finish this
                                                                             season 2.75% ahead of last season. All of the gain was
Dairy commodity prices have continued to firm as                             achieved in the early part of the season. During the final
markets respond to an easing in global milk supply. The                      three months, milk volumes are expected to be nearly 5%
market supports a milk price for the current season in the                   weaker than last season. February volumes were virtually
vicinity of $6.40/kg milksolids (MS).                                        on par with last season.
A milk price of $7.30/kg MS is forecast for next season                      This milk production forecast is more bullish than
as higher commodity prices feed through to returns,                          Fonterra’s own forecast. Fonterra expect to collect 1,510
combined with a lower NZD. However, global economic                          million kg MS this season – just 0.3% more than the
risks are heightened. If these risks materialise, then this                  previous season, implying milk intake would need to
could negatively impact demand for dairy commodities                         be 9% weaker during the later months of the season
and therefore result in lower farmgate returns than                          to match Fonterra’s forecast. Fonterra’s forecast is not
currently forecast.                                                          directly comparable to a forecast for the whole of New
Commodity prices have firmed as milk supply tightens                         Zealand. But even after accounting for a drop in market
globally and stocks of dairy commodities have been                           share, Fonterra’s forecast for the rest of the season
eroded. Whole milk powder prices have continued to                           appears particularly pessimistic and certainly lower than
firm. This trend is expected to be supported through to                      our own expectations.
at least the middle of 2019 by New Zealand’s milk supply
                                                                             NEW ZEALAND MILK PRODUCTION
falling away more quickly than normal in the latter part of
the 2018-19 season.
                                                                                         275,000
                                                                                         250,000
DAIRY COMMODITY PRICES
                                                                                         225,000
                                                                                         200,000
                7,000
                                                                                         175,000
                                                                             000 kg MS

                6,000                                                                    150,000
                                                                                         125,000
                5,000
                                                                                         100,000
USD per tonne

                4,000                                                                     75,000
                                                                                          50,000
                3,000
                                                                                          25,000

                2,000                                                                         0
                                                                                                   Jun Jul Aug Sep Oct Nov Dec Jan Feb Mar Apr May

                1,000                                                                                 2015-16    2016-17    2017-18    2018-19

                   0
                                                                             Source: ANZ, DCANZ
                   Jun-11 Jun-12 Jun-13 Jun-14 Jun-15 Jun-16 Jun-17 Jun-18
                       WMP             Butter           AMF            SMP   Milk production volumes are expected to plateau near
                                                                             current levels for the foreseeable future. Variations
Source: GlobalDairyTrade
                                                                             in output from season to season will be weather
                                                                             dependent.

ANZ Research Agri Focus | April 2019                                                                                                             1
DAIRY

MILK VOLUMES DOWN EVERYWHERE                                   Although the slow-down in economic growth in Asia is
Milk production remains relatively weak in all major milk-     a concern the growth rates are still very high by global
producing regions. Australia has been particularly hard        standards, which bode well for continued growth in dairy
hit by the recent drought. The only states in Australia that   demand. Risk of uncertainty are however greater than
regularly produce a surplus of milk are Victoria, which        normal therefore milk price forecasts remain volatile.
produces two-thirds of Australia’s milk, and Tasmania.
Both of these regions have been hotter and drier than          MILK PRICES TO RISE
normal this summer. Australia’s milk volumes are down          An ongoing lift in dairy commodity prices has bolstered
5.8% for the season to the end of January. Those in            our milk price forecast for the current season. We now
Victoria were down 14.4% in the month of January and           forecast a $6.40/kg MS price for the 2018/19 season. This
haven’t recovered since then.                                  is aligned with Fonterra’s current forecast range of $6.30 -
In Europe, milk production in the final quarter of 2018        $6.60/kg MS.
was marginally lower than last season. January volumes         Our forecast for next season remains at $7.30/kg MS.
were behind last season for the EU, with the larger milk-      Next season’s price is supported by the expectation that
producing nations of Germany, France and Netherlands           we will eventually see a weakening of the New Zealand
all behind last season by at least 2%. The UK was the          dollar. Dairy commodity prices are assumed to continue
only relatively large producer to expand production in         to trend up before easing back towards the later part of
January. Milk intake in some key countries like Germany        2019, at which time we expect to see more support from
is starting to catch up with year-ago levels as spring         a lower currency.
approaches, but the markets are expected to readily            FARMGATE MILK PRICE
absorb any extra volume.
United States milk production is still growing, but at a                        8.5
slow rate. Growth rates have averaged just 0.8% over                            8.0
the past year. Domestic demand will readily absorb 1%                           7.5
growth in milk supply; therefore at the current growth                          7.0
                                                               $/kg milksolid

rate we won’t see any additional US product being
                                                                                6.5
exported.
                                                                                6.0
                                                                                5.5
DEMAND SIDE RISK HEIGHTENED
                                                                                5.0
As major global economies slow there is an increased
                                                                                4.5
risk that dairy consumption will ease, reducing demand
                                                                                4.0
for dairy commodities. The International Monetary Fund                                16           17             18         19        20
(IMF) projects global growth will decline to 3.5% in 2019,                       Spot milk price        2016-17    2017-18   2018-19   2019-20
down from an estimated 3.7% in 2018.
                                                               Source: ANZ, NZX, GDT
Economic growth is easing in major dairy consumption
regions including United States, EU and China. In
developing nations dairy product demand tends to be            FOCUS ON DEBT REDUCTION
inelastic (doesn’t change much) as most dairy products         Despite the improvement in the milk price outlook,
are considered a staple food. However in developing            dairy farmers remain in consolidation mode. The focus
economies dairy tends to be in the luxury category             is on debt repayment and investment in key on-farm
therefore dairy demand tends to fluctuate with incomes.        infrastructure needed to meet tightening regulations.
The majority of New Zealand’s dairy exports go to
developing or emerging nations. Asia is our largest
export region with China alone accounting for about a
quarter of our dairy exports. The IMF forecast growth in
Asia will fall from 6.5% in 2018 to 6.3% this year.

ANZ Research Agri Focus | April 2019                                                                                                             2
LAMB & WOOL

LAMB RETURNS STILL STRONG                                     Throughput has picked up a little in the North Island
                                                              recently but it is still a challenge for buyers to find
Lamb processing is still well behind normal, with weekly      sufficient lambs to keep processing plants operating at
throughput still below par. This has been supportive for      capacity. This season farmers have been able to get lambs
schedule prices, with prices easing at a slower rate than     and ewes away when they want to.
normal.
Lamb prices are steadily trending down, but the rate of       LAMB WEIGHTS UP
decline is moderate due to the lambs being finished at        Lambs are being processed at heavier weights than
a slower rate than normal, with lambs being grown to          normal. The average carcass weight for lambs this season
heavier weights. On the back of this, schedule prices are     (to the end of February) is 18.8kg, versus 17.9kg the
holding near $7 per kg carcass weight in the North Island     previous season. This additional weight was typically
but are closer to $6.60 in the South Island.                  added to lambs earlier in the season when pasture
The number of lambs processed from the beginning of           production was strong, and there was an incentive to
October until the end of February was 460,000 fewer than      grow lambs to heavier weights.
at the same time last season. Throughput during that          Processing weights are expected to have decreased a
time was particularly low in the South Island, where it was   little through March into April. Feed for finishing lambs
9% behind. In the North Island number are running about       has tightened, resulting in some farmers drafting lighter
1% behind, with processing catching up recently.              lambs for processing.
LAMB SLAUGHTER, SEASON TO DATE
                                                              DRY WEATHER KEEPS BUYERS AT BAY
               10                                             Soil remains drier than ideal across much of the country,
               9                                              including across all of the South Island (excluding the
               8                                              West Coast), and the majority of the North Island. March
               7                                              temperatures have been 0.8% to 2% hotter than normal,
million head

               6                                              virtually everywhere. Most of the country has received
               5                                              some rain but the quantity of rain that has fallen is less
               4                                              than normal in most regions.
               3
                                                              As a result, the store market for lambs is subdued at
               2
                                                              present. This is particularly the case in the South Island.
               1
               0                                              In the North Island, pasture growth is improving more
                     Last season          This season         rapidly and buyer demand is starting to lift. The warm
                    North Island       South Island           weather does bode well for pasture growth once soil
Source: MIA, AgriHQ                                           moisture levels lift.
                                                              So far, the additional interest from buyers has not
                                                              translated into higher prices for store lambs. But if the
                                                              autumn flush of pasture starts to take off, then store
                                                              market prices are expected to react accordingly.

ANZ Research Agri Focus | April 2019                                                                                        3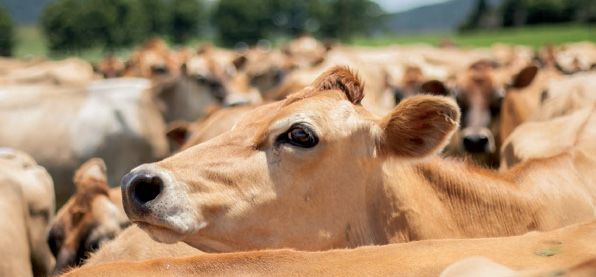
LAMB & WOOL

The number of store lambs available remains low, but if                         In the longer term, tariffs applied to UK lamb entering the
prices lift, we may see a few more come to market.                              EU could reduce farmgate returns for UK sheep farmers.
                                                                                It has been suggested that farmgate prices could drop
FURTHER EASING OF SCHEDULES                                                     about 17.5% and there have also been calls for extra
EXPECTED                                                                        government support for UK farmers.
By this time last season schedule prices were on the
rise again. But this season some further weakness in                            CHINA REMAINS STRONG
schedules can be expected, with still plenty of lambs to                        Diversification away from the UK towards China has
process. However, the magnitude of any reduction in                             reduced our reliance on the UK and the rest of Europe.
schedules is expected to be relatively small.                                   Should a disorderly Brexit occur, we can rely on China to
                                                                                absorb extra product, but this may not be at the price
LAMB FARMGATE RETURNS (19KG PRIME)
                                                                                point which is current being obtained from the traditional
                                                                                markets. At present the lamb and mutton we export to
                   9
                                                                                the UK is worth 50% more per kilogram than that sold to
                   8
                                                                                China.
                                                                                LAMB LEG – UK
NZ$ per kilogram

                   7

                   6                                                                               6

                   5
                                                                                                   5
                                                                                UK£ per kilogram

                   4

                   3
                                                                                                   4
                         Jun     Jul Aug Sep Oct Nov Dec Jan Feb Mar Apr May
                       2014-15       2015-16    2016-17    2017-18    2018-19

Source: AgriHQ                                                                                     3

The ever-present risk of international markets not
performing as expected is currently heighted due to                                                2
the ongoing Brexit saga. If a disorderly Brexit occurs, this                                           07   08   09   10   11   12   13   14   15   16   17   18   19
could disrupt flows of not only our lamb products but                           Source: AgriHQ
also UK-sourced lamb that typically flows freely into the
EU.                                                                             In the past 12 months the value of lamb and mutton
                                                                                exported by New Zealand to China was only marginally
BREXIT DIRECTION CHANGES DAILY                                                  less than the total value of lamb exports to the whole of
                                                                                Europe (including the UK). The UK currently accounts for
Forecasting the impact of Brexit is challenging given
                                                                                12% of our lamb and mutton exports by value. This is a far
the goalposts are moving on a daily basis. As NZ already
                                                                                cry from the early 1990s when the UK alone accounted
exports lamb directly into both the EU and the UK, we
                                                                                for more than 35% of total lamb exports and exports of
are relatively well positioned in the event of a hard Brexit.
                                                                                lamb to China were non-existent. That said, a hard Brexit
However, there would certainly be disruptions and
                                                                                would no doubt cause disruption.
possible delays on entry, since the workload of border
staff will lift considerably if all goods movements between
the UK and EU need to be monitored.                                             EWES COMMANDING HIGH PRICES
                                                                                The quantity of mutton processed this season is 23%
At present the UK exports about 40% of its lamb to
                                                                                down on last season with an even more significant
EU member countries. If this flow is constrained, it is
                                                                                decline in the South Island, where volumes are down
expected to result in a surplus of lamb in the UK market
                                                                                30%.
when their spring lambs hit the market later in the year.
New Zealand lamb typically fills the gap when UK lamb is                        This trend is unlikely to continue as the season continues,
out of season.                                                                  as we are now past the main processing period for ewes.

ANZ Research Agri Focus | April 2019                                                                                                                                    4
LAMB & WOOL

There have also been no significant delays in getting
ewes processed, due to lambs coming forth more slowly.
The lack of ewes being processed points to a greater level
of retentions and a general lift in industry confidence.
The high cost of replacement ewes is also having some
impact as anecdotal evidence suggests some ewes are
being retained for a further season, which might not have
been the case if they could have been replaced more
cheaply.
The mutton schedule in the North Island has sat at $5/
kg, on a carcass weight basis, since the beginning of
February, while in the South Island prices have eased back
at little to $4.80/kg.

WOOL – STUCK IN A HOLE
Prices for strong wool continue to bumble along at low
levels. As yet there is nothing on the horizon to drag
coarse wool prices up. Coarse wool prices are currently
about 30% below their long-run average.
At this time of the season it is mainly lamb wool
that is being offered through the regular Napier and
Christchurch auctions. Lamb wool is trading better than
coarse wool, and its price has trended up over the past
couple of months.
Poorer-quality wool remains difficult to sell, as is typically
the case when demand is weak. The proportion of
inferior-quality wool being harvested has increased as
genetics and management practices focus on maximising
meat production. In a lot of cases wool returns are not
even covering shearing costs, so it is unlikely that we will
see a refocus on wool any time soon.

STRONG WOOL (>35 MICRON)

                   8

                   7

                   6
USD per kilogram

                   5

                   4

                   3

                   2

                   1

                   0
                    Jul-06   Jul-08   Jul-10   Jul-12   Jul-14   Jul-16   Jul-18

Sources: ANZ, NZWSI, PGG Wrightson

ANZ Research Agri Focus | April 2019                                               5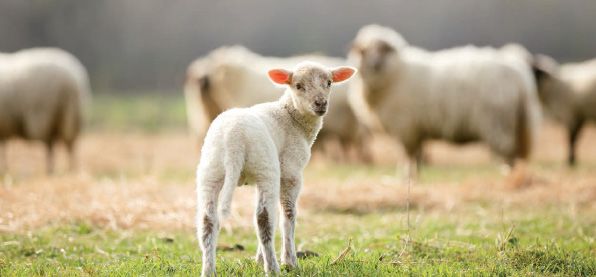
BEEF

BEEF – STABLE RETURNS                                                      PROCESSORS NEAR CAPACITY
Farmgate prices for cattle have softened in the past                       Beef processing facilities have been operating near
couple of months as the amount of stock available for                      capacity for the past month, with some backlogs of stock
processing has lifted. International markets remain well                   initially building now having been cleared. Prime stock
supported despite the increase in offer volumes. The                       has been held longer than normal due to the surplus
strength of demand in international markets will underpin                  of pasture available earlier in the season. This situation
farmgate prices and therefore limit downside to prices                     changed during February, with pasture covers tightening
that are offered by processors. The reduction in feed                      on many farms, resulting in a lift in the number of cattle
available on farms has reduced the value of stock heading                  sent to processors.
through the yards.                                                         This means that the processing season for prime stock
Beef schedule prices have softened over the past couple                    has run into the start of the cull cow season. Beef cows
of months as more stock has become available for                           started coming forward as the weaner sales commenced
slaughter. Prices at the farmgate level are now below the                  in February. We have also seen a lift in the number of dairy
five-year average for bull and cull cow, but pricing for                   cows being culled. Dry conditions mean dairy farmers
prime stock remains above the five-year average despite                    have offloaded some stock that they don’t plan to milk
recent softening.                                                          next season, in order to alleviate pressure on farm.
COW FARMGATE RETURNS (160-195KG GRADE)                                     Processing plants are expected to operate at capacity
                                                                           through the next couple of months. There have been
             5.00                                                          some backlogs for processing stock but thus far these
                                                                           have been moderate. Some additional stock is being
             4.75                                                          offloaded through the yards, but demand is low and
                                                                           reflected in prices on offer.
             4.50
                                                                           NZ CATTLE PROCESSING
NZ$ per kg

             4.25

                                                                                                90
             4.00
                                                                                                80
             3.75                                                                               70
                                                                           '000 head per week

                                                                                                60
             3.50
                    Jul   Aug Sep Oct Nov Dec Jan    Feb Mar Apr May Jun                        50
                    5yr average      2016-17        2017-18     2018-19                         40

Source: AgriHQ, ANZ                                                                             30

                                                                                                20
Store stock prices have also softened. Weaner fairs have                                        10
dominated sale yard action recently. Weaner prices are
                                                                                                 0
well below the levels achieved in the past few seasons                                               Oct Nov Dec Dec Jan Feb Mar Apr May Jun Jul Aug Sep
but are still at levels that provide a decent return for                                                      2017-18                 2018-19
breeders. Prices are down about 50c/kg LW or about $100                    Source: MIA, AgriHQ
per head, but this varies from sale to sale.
ANZ Research Agri Focus | April 2019                                                                                                                       6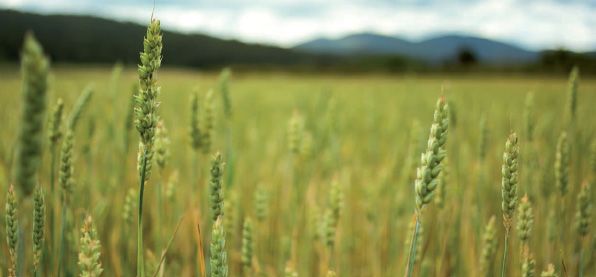
BEEF

LIFT IN AUSSIE PROCESSING                                      BULL BEEF PRICES
International markets have held up despite extra volume
                                                                                7.0
coming out of Australia. The devastating drought,
                                                                                6.5
followed by widespread flooding in Queensland in
                                                                                6.0
February, resulted in a surge in the number of stock
                                                                                5.5

                                                               $ per kilogram
processed. Significant on-farm losses are estimated,
                                                                                5.0
in the vicinity of 500,000 head or approximately 2% of
                                                                                4.5
Australia’s total beef cattle. Once on-farm conditions                          4.0
improve, a slowing in cattle processing in this market can                      3.5
be expected as farmers once again move into a herd-                             3.0
rebuilding phase. Prior to the flooding, Meat & Livestock                       2.5
Australia estimated cattle processing in 2019 would be                          2.0
3% down on the previous year.                                                         07   08   09 10 11 12 13 14 15 16 17                     18
                                                                                                US Bull Beef (USD, Manufacturing 95CL)
At present, processors in Australia are running at capacity                                     NZ Bull Beef Farmgate (NZD, 296-320kg grade)
with significant backlogs. This has resulted in extra beef     Source: USDA, AgriHQ
being exported from Australia. Australia has directed most
of the additional beef into China – a market that is happy     CHINA TRADE DRIVEN INTO OFFICIAL
to absorb as much volume as it can get.                        CHANNELS
                                                               The rise of China as a major importer of beef products
MARKET DIVERSITY KEEPS PRICES
                                                               has been phenomenal, but perhaps less surprising if you
STRONG                                                         consider the volume of meat that previously entered
The rise of China means New Zealand and Australian             China through ‘grey’ channels. While this informal
exporters have directed less meat into the United States.      importation channel can’t be accurately measured, the
Traditionally any whiff of a lift in supply from Australasia   tightening up of illegal imports has no doubt pushed
would push down the price US importers were willing to         some of this trade into formal channels. China’s demand
pay for bull and cow meat. However, in recent months,          for beef shows no signs of abating and is now providing a
both New Zealand and Australia have sent less beef to          real alternative to the US market for exporters.
the US, which has kept prices stable.
                                                               Japan is also back on the radar for New Zealand exporters
The price of imported bull (95cl) and cow (90cl) meat has      due to the reduction in tariffs associated with the CPTPP
actually lifted a tad in recent weeks and now sits about       agreement. Japan implemented its year one tariff
in line with the five-year average, when measured in USD       reductions on 1 January, and on 1 April tariff rates will
terms. Meanwhile, the price of US domestic (90cl) remains      move to year two levels. Japan is a major market for
below its long-term average. When measured in NZD              Australia, having enjoyed preferential access for its beef
terms, prices for imported bull and cow meat are even          since signing a Free Trade Agreement (FTA) in 2015. At
better, sitting 6% to 8% above the long-term average.          that point, New Zealand’s presence in that market waned,
As we progress through the season, the improved returns        and it is expected to take time to rebuild access now that
for beef will be reflected in farmgate prices. But while       we are back on a level playing field with Australia.
slaughter numbers are elevated, there is little incentive
for processors to pass this through. Procurement pressure
earlier in the season meant weaker international prices
were passed on to farmers at that time, so it is not
surprising that processors will now be clawing back
margins where they can.

ANZ Research Agri Focus | April 2019                                                                                                                7
DEER
DEER RETURNS ROBUST Deer processing is at its seasonal low point at present,
with the main stag cull now behind us. Cull hinds will be
Farmgate prices for stags have trended down since coming through now. Therefore, the farmgate prices that
October, but still remain well above the five-year average. were on offer at the peak processing period from October
The venison industry remains in good shape, as does the to February will have a greater influence on returns to
velvet industry. Confidence amongst farmers is high, with farmers than current prices.
herd expansion expected to continue at a steady level.
Returns for poorer manufacturing-grade meat have eased
High in-market prices have eroded some demand, and a little. The industry has been able to lift overall returns in
a build-up of stocks in key European markets is making recent years by extracting maximum value from all parts
selling activity a little more challenging for high-end of the carcass. Demand for lower-grade cuts, trim and
cuts into the traditional markets. However, returns are offal has softened a tad. These products tend to be sold
generally still strong. into Asian markets and are also in demand from pet food
Farmgate prices typically fall away after peaking in companies.
October. Early-season prices are normally higher as Overall, markets still look very positive for venison. The
processors source supply specifically for the Christmas value of venison exported from October to January was
markets in Europe. At that time of the year, product is priced slightly higher than at the same time the previous
supplied chilled, which is more valuable than frozen. By year. However, the volume exported during that time was
contrast, out of the European winter season more venison 20% lower than at the same time the previous year.
is frozen by processors, reducing returns.
Export volumes were relatively evenly split between the
VENISON FARMGATE PRICES (STAG AP60KG) United States and the main European markets – Germany,
Finland, Belgium and the Netherlands.
12
In terms of price, the European markets generally return
11 more value than the United States. Demand by Chinese
importers for venison is steadily lifting. Venison is not
10 a meat that is traditionally consumed in China, but
NZ$ per kg
exporters have had some success getting quality cuts
9
onto the menus at some high-end restaurants.
8 China was the fifth-largest export market for New Zealand
venison products during the period from October to
7
January, sitting behind the United States, Germany,
6 Finland and Belgium.
Jul Aug Sep Oct Nov Dec Jan Feb Mar Apr May Jun
5yr average 2016-17 2017-18 2018-19
Source: ANZ, AgriHQ
ANZ Research Agri Focus | April 2019 8DEER VELVET SOUGHT AFTER AS HEALTH FOOD Direct sales of velvet to Korean health food companies are delivering improved returns for New Zealand exporters. New Zealand-sourced velvet is sought after by high- end health food companies who value ongoing supply relationships and the attributes that New Zealand velvet delivers. DeerNZ estimate Korean health food companies now account for 25% of all velvet exports. The value that can be extracted by dealing with Korea directly is considerably more than selling product via China. Export data indicates the value of velvet exported directly to South Korea lifted to nearly 30% y/y in recent months. China remains our largest market for velvet, although much of the velvet that is exported to China also ends up in South Korea after processing. Exports that go directly to Korea are worth nearly twice as much, on a per kilogram basis, than product going to China. The biggest advantage of exporting directly to health food companies in South Korea is that it is possible to control the supply chain to ensure the authenticity of the product. ANZ Research Agri Focus | April 2019 9
GRAIN & FORESTRY
GRAIN

GRAIN                                                             Evaluation Index (FEI) results to ensure they don’t have their
                                                                  milk downgraded. Feeding high quantities of PKE (and some
Grain and feed prices have softened a little in recent            other types of feeds) can trigger higher FEI readings.
months. With the new-season harvest now in the silo for
most crops, there is ample supply available. Demand from          Contracts for PKE for next season are currently available in
the dairy industry for supplementary feed is subdued.             some areas at less than $230/t, which is relatively cheap
                                                                  compared to where prices have been in recent years. These
The main cereal harvest is virtually complete in Canterbury,      prices have prompted some farmers to sign contracts for
with mixed reports on yields. All that is left to be harvested    their next season requirements.
are the crops that were planted later than normal due to the
wet spring.                                                       NZ GRAIN PRICES
Demand for uncontracted feed wheat and barley remains
                                                                                  500
subdued. Dairy industry demand tends to be the swing
factor that drives spot market prices. Despite the recent dry                     450
conditions and favourable milk prices, dairy farmers are not
                                                                                  400
particularly keen to buy extra supplementary feed. The dairy
                                                                  NZD per tonne

industry is becoming more focused on profitability. This                          350
means some farmers are opting to run lower-cost systems
                                                                                  300
rather than to farm for higher production.
                                                                                  250
It appears that prices may have to soften a little if growers
are in a hurry to clear silos.                                                    200

Contracts for next season’s wheat and barley are currently                        150
being negotiated. But the gap between grower and seller                                 11     12       13     14     15   16     17     18
expectations remains too wide, in a lot of cases, for contracts                         Milling wheat        Feed wheat    Feed barley        PKE
to be finalised.                                                  Source: AgriHQ

MAIZE SEASON UNDERWAY
The maize silage harvest is virtually complete in the North
Island, and harvesting of maize grain is due to get underway.
In some regions maize silage yields have suffered due to dry
conditions earlier in the season. The acreage of maize silage
planted last spring was also down, which will further reduce
the quantity harvested.
International prices for Palm Kernel Expeller (PKE) have
eased. Prices in Malaysia are now about 20% lower than they
were a year ago. Local market prices have also softened a
little. There has been some additional late-season demand
for PKE but demand is generally subdued. Fonterra suppliers
who are feeding PKE will be closely monitoring their Fat

ANZ Research Agri Focus | April 2019                                                                                                                10
GRAIN & FORESTRY
FORESTRY
FORESTRY CHINA’S ECONOMY REMAINS A RISK
The forestry sector remains buoyant on the back of strong Despite the recent lift in demand, risks remain in place
export demand for logs. Global and domestic markets are regarding a slowing of China’s economy. China is feeling the
soaking up the extra volume of wood that is being felled. impact of its trade war with the US. Manufacturing activity
in China is on the decline, debt levels are high, and it is
Demand for logs and log pricing remains robust. China certainly not a given that government stimulus packages
continues to lead the market in terms of the volume of logs will be able to deliver the desired level of economic growth.
sought. They also lead the market in terms of pricing, with
other nations having to match the prices offered from this Some slowing of manufacturing activity in China is
market in order to secure supply. inevitable as its economy transitions from a manufacturing
to a knowledge-based economy, but for now being an
The volume of logs stockpiled on wharves in China eroded efficient producer of goods is what makes its economy
earlier in the year, indicating additional buying activity tick. Log exports are particularly exposed to China’s rate of
would be required to rebuild stocks. This is exactly what has residential construction, as the resulting timber is often used
happened. for boxing concrete.
Demand from other markets for New Zealand logs is steady
LOG EXPORTS LIFT
but prices would be considerably weaker without China
In February log exports shot up, with export values up 20% underpinning the market.
compared with the same month the previous year. This
was a combination of more logs being shipped and higher LOG PRICES STRONG
prices being obtained.
Prices of pruned logs are about 5% stronger than year-ago
Monthly data is influenced by the timing of ships sailing, but levels. In-market prices for unpruned logs are also firmer due
the volume of logs being exported continues to trend up. to ongoing strong demand. The fact that export log prices
In the past six month the quantity of logs and other wood have steadily firmed in recent months despite higher export
products exported was 10% greater than the same time the volumes is extremely positive.
previous year.
Further growth in harvesting is expected to be constrained
The Chinese New Year holiday period can impact the timing by labour availability. Automation of some aspects of
of shipments, but this is becoming less of an issue for our harvesting could alleviate some labour pressures.
log exporters than it once was. There is always a lull in
building activity in China at this time.
In China prices are still holding up well but some supply
competition does exist, which limits the potential for further
price increases. Lower-quality logs sourced from the US and
Uruguay compete with New Zealand logs. However, due to
the trade war, the quantity of US logs being purchased by
China is low. Logs from Uruguay are again competitive in
this market as shipping rates are currently low.
ANZ Research Agri Focus | April 2019 11FORESTRY
LOG PRICE (UNPRUNED A GRADE)
175
150
125
US$/JASm3
100
75
50
09 10 11 12 13 14 15 16 17 18
Source: AgriHQ
HARVESTING ACTIVITY STRONG
Roundwood removals in the second half of 2018 were 20%
greater than the five-year average. Harvesting rates fell away
slightly in the final quarter of the year, but there hasn’t been
any let-up in demand for tree felling crews.
Annual felling rates increased by 2.1 m³ roundwood in the
2018 compared to the previous year. That’s about an extra
74,000 truck and trailer loads.
ROUNDWOOD REMOVALS
40
35
30
million m3
25
20
15
10
08 09 10 11 12 13 14 15 16 17 18
Source: MPI
ANZ Research Agri Focus | April 2019 12HORTICULTURE
HARVEST TIME GOLD KIWIFRUIT IN VOGUE
Orchardists across the country are in the thick of picking The kiwifruit industry is setting itself up for a record
and processing fruit. The apple harvest is well underway, harvest. The industry has continued to expand, with
as is the grape harvest. The kiwifruit season has just some of this expansion coming on stream this season.
begun, while the hops harvest is complete. The volume of gold varieties harvested this season could
eclipse green for the first time.
Water restrictions through the dry summer have been
an issue in some areas and some impact on yields can Licenses continue to be granted by Zespri, which are
be expected. However, orchardists and viticulturists have eagerly being purchased by new operators and as
managed to juggle the water they have had available current operators looking to expand their area in vines or
and therefore the overall impact on yields at the national swap a portion of green production for gold.
level is expected to be small, notwithstanding the impact The harvest is just underway with some early maturing
on some individual growers could be considerable. fruit already in the packhouses. Gisborne tends to be the
Labour for picking, packing and processing remains a first region to start picking due to its climate resulting in
challenge as the various harvests overlap and seasonal earlier maturity dates. However, Bay of Plenty is also well
labour remains tight. But thus far a combination of underway, with fruit maturing slightly earlier than normal
seasonal labour and casual labour from backpackers due to the warm summer.
means the fruit is being processed. Resources for picking and processing kiwifruit are
expected to be at full stretch in the next couple of
QUALITY VINTAGE ON LOWER VOLUMES months. As more of the crop moves to gold (G3 variety),
The grape harvest has begun in earnest. Yields are greater resources are required, due to this variety having
expected to vary across the country. In Marlborough, the higher yield and a tighter optimal picking window than
main Sauvignon region, yields look to be well down. On the traditional varieties.
a brighter note, the quality of this vintage is expected to Picking of green varieties will also soon be underway
be excellent. with the picking season stretching through to June.
A lack of water for irrigation has been an issue in some It is a little too early to get a good steer on yields for the
parts of Marlborough, and this has impacted yields. The season but good fruit size indicates yields should be
lack of grapes means a strong spot market, but there will favourable.
be very few growers who have grapes that aren’t already
committed to contracts. Zespri recently undertook a share split on a three-for-
two basis, ie a shareholder with two shares received
Overall returns to growers could be down by 20%. three after the share split. At the same time, the share
The challenge for wine-makers will be to allocate the price dropped from $9 to $6, hence the overall value of
reduced crop the best they can in order to meet market the shares held is unchanged. A share split potentially
obligations. Costs will also be spread over a lower provides more liquidity and allows more precise parcels
volume, increasing both growing and processing costs of shares to be traded. Zespri is attempting to align its
on a per unit basis. shareholders more closely with its producers.
ANZ Research Agri Focus | April 2019 13HORTICULTURE Zespri shareholders are currently allowed to hold six shares for every tray of production based on the average of the best two out of the last five seasons. Those holding more shares than entitled have several years to sell their excess shares. Applications for allocation of 700ha of new SunGold licenses close on 10 April, with successful bidders notified after 29 April. Orchard gate returns for the 2018-19 season are forecast to be $140,195/ha for the SunGold variety (including organic). This compares to $63,796/ha for Green. Actual returns to growers can vary considerably due to premium and incentive payments. SunGold returns are up 22% on the previous season, while Green returns are up 6.5%. ROSY RED APPLES The apple harvest is well underway in the main producing regions. WINE Nelson growers are reporting that harvest volumes are a little lower than normal. Wet weather at flowering impacted fruit set, while water restrictions due to the dry summer meant some apple trees were irrigated at less- than-optimal quantity and/or frequency. Plenty of sunshine has resulted in good colouring on apples, which increases their appeal and potential value. The industry is buoyant at present with plenty of enthusiasm regarding future returns. This is being reflected in ongoing investment within the industry in orchards and processing facilities. HOPS READY FOR THE BREWERS The hop harvest is now over for the season. The harvest period is very condensed as the optimal harvest time for each variety lasts only a few days. Growers tend to grow several different varieties to maximise the use of processing facilities, as initial processing is done at the hop garden. Processing involves cutting down the vines, feeding them through a machine to separate the hops from the vines, then drying the hops in kilns before packaging in bales for delivery and further processing. The next stage of hop processing is pressing the dry hops into pellets, which is mainly done by the industry co- operative, NZ Hops. Once palletised, the hops are then packed and stored before being supplied to local and international brewers. A small quantity of hops is sold fresh to local brewers. ANZ Research Agri Focus | April 2019 14
RURAL PROPERTY MARKET

PROPERTY SLOW TO MOVE                                                     finalised. Therefore, unless vendors are willing to accept
                                                                          lower offers, they could well be stuck with their farms for a
Activity in the rural property market was subdued in the                  further season.
three months to February. This is the time in the season
when you would typically see a lot of dairy farms change                  In Taranaki a large number of properties has changed hands
hands. However, a lack of demand means there are a lot of                 after a tough couple of seasons. This region has suffered
farms on the market still looking for buyers.                             more than most from extreme weather in the past couple
                                                                          of years, which has taken its toll on equity positions and
Grazing properties are more sought after. Good returns from               industry confidence. However, it appears there are buyers
the sheep and beef sector is driving this demand, alongside               willing to step up to purchase first farms or expand existing
buyers looking for properties suitable to plant in trees.                 land holdings.
The horticulture sector is in expansionary mode, but the sales
                                                                          DAIRY PRICE INDEX
data is yet to reflect this sentiment.
                                                                           3,500
PROPERTY TRANSACTIONS SLOWING
Rural property price data lacks clear direction. Median prices             3,000

on a per hectare basis are bouncing along influenced by                    2,500
individual sales.
                                                                           2,000
What is clear is that the number of properties changing
hands has slowed. This is particularly the case for dairy farms.           1,500
The number of property transactions tends to be a lead
indicator for price movements. When demand is high, more                   1,000
property transactions occur and price movements tend
                                                                             500
to follow. The trend is less easy to see in a market where
demand is lower, as property prices don’t fall as readily as                   0
they go up. Typically in that situation prices stabilise and we                    96   98    00    02   04   06       08   10   12   14   16       18
see fewer transactions, as vendors tend to be reluctant to sell
                                                                          Source: REINZ
at prices below where they perceive the market to be.
                                                                          Dairy farm sales in Canterbury are virtually non-existent, with
DAIRY PROPERTIES HARD TO MOVE                                             REINZ reporting just two sales since August. The number of
Dairy farms are particularly sticky. Only one third of the                dairy farms changing hands in Southland is also muted.
Waikato dairy farms put up for sale in the spring have sold.
It is now getting late in the dairy season for sales to be

FARM SALES BY FARM TYPE
3-Month Seasonally Adjusted              Current Period Previous Period     Last Year        10 - Year Av. Chg. P/P         Chg. Y/Y Chg. P/10yr
               Number of Sales                37               42              58                  51              Ü             Ü              Ü
Dairy
               Median Price ($ per ha)      29,449          34,231           26,655            29,642              Ü             Û              Ü

Livestock -    Number of Sales                102              122            123                  74              Ü             Ü              Û
Finishing      Median Price ($ per ha)      29,405          29,255           30,794            21,088              Û             Ü              Û

Livestock -    Number of Sales                114              107            101                  152             Û             Û              Ü
Grazing        Median Price ($ per ha)      10,270          11,088           11,193            14,038              Ü             Ü              Ü

               Number of Sales                42               42              50                  44              Ü             Ü              Ü
Horticulture
               Median Price ($ per ha)      150,283         165,424         238,715            166,159             Ü             Ü              Ü
               Number of Sales                26               26              23                  22              Û             Û              Û
Arable
               Median Price ($ per ha)      31,914          106,220          28,889            27,246              Ü             Û              Û

               Number of Sales                13               14              15                  12              Ü             Ü              Û
Forestry
               Median Price ($ per ha)       5,567           6,218            7,083             7,027              Ü             Ü              Ü

               Number of Sales                339              359            365                  356             Ü             Ü              Ü
All Farms
               Median Price ($ per ha)      23,442          27,214           26,428            23,159              Ü             Ü              Û

ANZ Research Agri Focus | April 2019                                                                                                                     15
RURAL PROPERTY MARKET
FIRM DEMAND FOR GRAZING PROPERTIES
Demand for grazing and finishing properties is more robust.
Sector confidence is strong on the back of two very good
seasons for lamb prices, while beef returns remain solid.
This is keeping demand for both grazing and finishing
properties strong. Demand for forestry land is helping to
bolster values as well. While the Government has indicated
it does not want to see trees being planted on good-quality
farm land, there is nothing to stop this happening.
If we are to plant enough trees to offset our expected
emissions, then under current emission proposals about half
of the land used for sheep and beef farming would need
to be planted out. No doubt alternative ways to reduce or
offset greenhouse gases will emerge, or policies may evolve
differently. But it is clear that more trees will be planted and
this demand will support grazing land values.
MEDIAN PRICE PER HECTARE
35,000
30,000
25,000
20,000
NZD
15,000
10,000
5,000
0
96 98 00 02 04 06 08 10 12 14 16 18
Source: ANZ, REINZ
The horticulture sector remains very buoyant. The kiwifruit
industry is in expansion mode as Zespri continues to
release additional licenses for growing its sought-after
Sungold variety. Properties are being sought for greenfield
conversions to kiwifruit in the Bay of Plenty, but also in parts
of the Waikato.
ANZ Research Agri Focus | April 2019 16ECONOMIC OVERVIEW
GLOBAL ECONOMY Most labour market indicators show the economy is
operating at near full capacity, with employment close to its
A reduction in global growth remains a key risk to New
maximum sustainable level. However, recent data suggest
Zealand’s economy due to our reliance on our export sector.
that capacity pressures are starting to ebb and resource
All of our main trading partners are experiencing challenges pressures are past their peak.
maintaining economic growth.
Even with the economy running close to full capacity, there
The current slowing of global growth is expected to be a was little inflationary pressure. Inflation is tracking below the
mid-cycle slowdown rather anything more sinister. However desired 2% medium-term target, and with capacity pressures
any slowing of growth could negatively impact demand expected to ease, it is unlikely this target will be met.
for food products. The OECD forecasts a slight decline in
However, there are some factors that are stimulating
prices of dairy and meat products over the next decade. It
economic growth. The terms of trade remains strong – that
says demand growth from China is now decelerating while
is, the value of the goods we are exporting is strong relative
new sources of global demand are not sufficient to maintain
to the value of the goods being imported. Put another way,
growth.
when our terms of trade is strong, we can buy more smart
New Zealand is highly exposed to China, which is adjusting phones with each tonne of milk powder sold.
to structurally lower growth rates as the economy matures.
Monetary policy is also stimulatory at present. The OCR
China directly accounts for 24% of our exports, and we are
remains at 1.75%, having been at this low level since
also indirectly exposed to this market through our second-
November 2016. We expect the next move in the OCR will
largest trading partner, Australia.
be downward. The RBNZ has come around to this view,
At present, China’s appetite remains strong for the products indicating at the March OCR Review that the next move in
that New Zealand supplies. This demand has helped bolster the OCR is more likely to be down.
returns across the primary sector.
Government spending is also providing some boost to the
But economic uncertainty caused by political events such as economy and household spending remains strong.
the US-China trade war and the Brexit process, are adding to
headwinds for global economic growth. INTEREST RATES
Central banks are increasingly looking to adopt measures to Effective rural interest rates flattened in the later part of
stimulate growth. China plans to reduce the level of capital 2018, while total borrowing from New Zealand’s rural sector
banks need to hold in order to stimulate lending to the increased. The dairy sector, which accounts for the majority
private sector. Meanwhile, the US Federal Reserve now plans of the debt, is becoming increasingly focused on debt
to hold interest rate at current levels through to 2021, while repayment, with expansionary plans now more the domain
the European Central Bank also has its rates on hold and is of the horticultural and forestry sectors.
providing extra stimulus though cheap loans to its banks. The
RBA has also moved towards a more cautious stance.
KEY INTEREST RATES
NEW ZEALAND ECONOMY 10
Forecast
GDP data for the final quarter of 2018, released last week,
confirmed that economic growth has softened. The data 8
showed annual growth slipping from 2.6% to 2.3% y/y, after
growth in the final quarter of 2018 at 0.6% q/q. This rate of 6
growth was aligned with our expectations but was lower %
than the Reserve RBNZ had been expecting. And downward 4
revisions to previous quarters suggest that the slowing in
growth has been more pronounced than previously thought.
2
Our view is that the economy will struggle to accelerate from
here and that growth will continue to run close to or a bit 0
below 2.5% y/y over the next year. Drivers of growth such as 08 09 10 11 12 13 14 15 16 17 18 19 20
the impetus from construction, tourism and net migration OCR 90-Day Bill 10-Year Effective Rural Rate
have waned. Meanwhile, the economy is coming up against Source: ANZ, RBNZ
constraints that limit how quickly it can grow.
ANZ Research Agri Focus | April 2019 17ECONOMIC OVERVIEW
AGRICULTURE SECTOR DEBT
70
60
50
40
NZ$ billion
30
20
10
0
08 09 10 11 12 13 14 15 16 17 18 19
Source: RBNZ
EXCHANGE RATES
The New Zealand dollar has traded at an average rate
of US$0.6816 since the beginning of the year. The NZD
generally appreciated during this time when central banks
across the globe took a more dovish tone, indicating they
would either cut interest rate or postpone planned rate hikes.
The RBNZ announced last week that the next rate movement
is likely to be down. The NZD reacted to this dovish
statement by the RBNZ by rapidly depreciating. Prior to
the announcement the NZD was priced above US$0.69
but has now stabilised near US$0.68. In the second half of
2019 further softening in the NZD is expected, with timing
dependent on the expected OCR cuts and how other
economies perform.
The bank capital changes proposed by the RBNZ are
expected to have a material impact on the cost and
availability of credit in New Zealand. If implemented, this
policy could put further downward pressure on the NZD in
the later part of 2019.
NZD BUYS USD
0.90 Forecast
0.85
0.80
0.75
NZD/USD
0.70
0.65
0.60
0.55
0.50
08 09 10 11 12 13 14 15 16 17 18 19 20
Source: ANZ, Bloomberg
ANZ Research Agri Focus | April 2019 18KEY FORECASTS
ACTUAL FORECAST (END MONTH)
FX RATES
Feb-19 Mar-19 Today Jun-19 Sep-19 Dec-19 Mar-20 Jun-20 Sep-20 Dec-20
NZD/USD 0.681 0.683 0.68 0.65 0.64 0.64 0.63 0.63 0.63 0.63
NZD/AUD 0.960 0.959 0.96 0.93 0.91 0.91 0.90 0.90 0.88 0.84
NZD/EUR 0.599 0.608 0.61 0.60 0.58 0.56 0.53 0.50 0.50 0.50
NZD/JPY 75.82 75.81 75.81 71.5 69.1 69.1 66.2 66.2 66.2 66.2
NZD/GBP 0.513 0.524 0.52 0.48 0.47 0.47 0.46 0.45 0.45 0.44
NZ TWI 72.5 73.0 74.2 70.2 68.6 67.7 65.6 64.8 64.4 63.5
ACTUAL FORECAST (END MONTH)
INTEREST RATES
Feb-19 Mar-19 Today Jun-19 Sep-19 Dec-19 Mar-20 Jun-20 Sep-20 Dec-20
NZ OCR 1.75 1.75 1.75 1.75 1.50 1.25 1.00 1.00 1.00 1.00
NZ 90 day bill 1.89 1.85 1.84 1.83 1.58 1.33 1.16 1.16 1.16 1.16
NZ 10-yr bond 2.16 1.81 1.83 2.05 2.05 2.20 2.20 2.20 2.10 2.10
US Fed Funds 2.50 2.50 2.50 2.50 2.50 2.50 2.50 2.50 2.50 2.50
US 3-mth 2.62 2.60 2.60 2.65 2.65 2.65 2.65 2.65 2.65 2.65
AU Cash Rate 1.50 1.50 1.50 1.50 1.50 1.50 1.50 1.50 1.50 1.50
AU 3-mth 1.87 1.77 1.77 2.10 2.00 2.00 2.00 2.00 2.00 2.00
ECONOMIC INDICATORS Dec-18 Mar-19 Jun-19 Sep-19 Dec-19 Mar-20 Jun-20 Sep-20 Dec-20
GDP (% q/q) 0.6 0.6 0.7 0.5 0.7 0.6 0.7 0.6 0.7
GDP (% y/y) 2.3 2.4 2.2 2.4 2.5 2.5 2.5 2.6 2.6
CPI (% q/q) 0.1 0.2 0.5 0.4 0.2 0.6 0.5 0.5 0.2
CPI (% y/y) 1.9 1.6 1.7 1.3 1.4 1.8 1.8 1.8 1.8
LCI Wages (% q/q) 0.5 0.4 0.5 0.6 0.4 0.5 0.7 0.6 0.5
LCI Wages (% y/y) 2.0 2.1 2.0 2.0 2.0 2.0 2.2 2.2 2.2
Employment (% q/q) 0.1 0.5 0.4 0.4 0.4 0.3 0.3 0.3 0.3
Employment (% y/y) 2.3 2.3 2.0 1.3 1.7 1.5 1.4 1.4 1.3
Unemployment Rate (% sa) 4.3 4.3 4.3 4.2 4.2 4.2 4.2 4.2 4.2
Current Account (% GDP) -3.7 -3.6 -3.6 -3.6 -3.7 -3.7 -3.8 -3.9 -4.0
Terms of Trade (% q/q) -3.0 0.5 1.6 0.2 0.1 0.2 0.2 0.1 0.2
Terms of Trade (% y/y) -4.7 -2.3 -1.2 -0.8 2.4 2.1 0.8 0.7 0.8
Figures in bold are forecasts. q/q: Quarter-on-Quarter, y/y: Year-on-Year
ANZ Research Agri Focus | April 2019 19IMPORTANT NOTICE This document is intended for ANZ’s institutional, professional or wholesale clients, and not for individuals or retail persons. It should not be forwarded, copied or distributed. The information in this document is general in nature, and does not constitute personal financial product advice or take into account your objectives, financial situation or needs. This document may be restricted by law in certain jurisdictions. Persons who receive this document must inform themselves about and observe all relevant restrictions. Disclaimer for all jurisdictions: This document is prepared and distributed in your country/region by either: Australia and New Zealand Banking Group Limited (ABN11 005 357 522) (ANZ); or its relevant subsidiary or branch (each, an Affiliate), as appropriate or as set out below. This document is distributed on the basis that it is only for the information of the specified recipient or permitted user of the relevant website (recipients). This document is solely for informational purposes and nothing contained within is intended to be an invitation, solicitation or offer by ANZ to sell, or buy, receive or provide any product or service, or to participate in a particular trading strategy. Distribution of this document to you is only as may be permissible by the laws of your jurisdiction, and is not directed to or intended for distribution or use by recipients resident or located in jurisdictions where its use or distribution would be contrary to those laws or regulations, or in jurisdictions where ANZ would be subject to additional licensing or registration requirements. Further, the products and services mentioned in this document may not be available in all countries. ANZ in no way provides any financial, legal, taxation or investment advice to you in connection with any product or service discussed in this document. Before making any investment decision, recipients should seek independent financial, legal, tax and other relevant advice having regard to their particular circumstances. Whilst care has been taken in the preparation of this document and the information contained within is believed to be accurate, ANZ does not represent or warrant the accuracy or completeness of the information Further, ANZ does not accept any responsibility to inform you of any matter that subsequently comes to its notice, which may affect the accuracy of the information in this document. Preparation of this document and the opinions expressed in it may involve material elements of subjective judgement and analysis. Unless specifically stated otherwise: they are current on the date of this document and are subject to change without notice; and, all price information is indicative only. Any opinions expressed in this document are subject to change at any time without notice. ANZ does not guarantee the performance of any product mentioned in this document. All investments entail a risk and may result in both profits and losses. Past performance is not necessarily an indicator of future performance. The products and services described in this document may not be suitable for all investors, and transacting in these products or services may be considered risky. ANZ expressly disclaims any responsibility and shall not be liable for any loss, damage, claim, liability, proceedings, cost or expense (Liability) arising directly or indirectly and whether in tort (including negligence), contract, equity or otherwise out of or in connection with this document to the extent permissible under relevant law. Please note, the contents of this document have not been reviewed by any regulatory body or authority in any jurisdiction. ANZ and its Affiliates may have an interest in the subject matter of this document. They may receive fees from customers for dealing in the products or services described in this document, and their staff and introducers of business may share in such fees or remuneration that may be influenced by total sales, at all times received and/or apportioned in accordance with local regulatory requirements. Further, they or their customers may have or have had interests or long or short positions in the products or services described in this document, and may at any time make purchases and/or sales in them as principal or agent, as well as act (or have acted) as a market maker in such products. This document is published in accordance with ANZ’s policies on conflicts of interest and ANZ maintains appropriate information barriers to control the flow of information between businesses within it and its Affiliates. Your ANZ point of contact can assist with any questions about this document including for further information on these disclosures of interest. Country/region specific information: Unless stated otherwise, this document is distributed by Australia and New Zealand Banking Group Limited (ANZ). Australia. ANZ holds an Australian Financial Services licence no. 234527. For a copy of ANZ’s Financial Services Guide please click here or request from your ANZ point of contact. If trading strategies or recommendations are included in this document, they are solely for the information of ‘wholesale clients’ (as defined in section 761G of the Corporations Act 2001 Cth). Brazil, Brunei, India, Japan, Kuwait, Malaysia, Switzerland, Taiwan. This document is distributed in each of these jurisdictions by ANZ on a cross-border basis. Cambodia. This document is distributed in Cambodia by ANZ Royal Bank (Cambodia) Limited (ANZ Royal Bank). The recipient acknowledges that although ANZ Royal Bank is a subsidiary of ANZ, it is a separate entity to ANZ and the obligations of ANZ Royal Bank do not constitute deposits or other liabilities of ANZ and ANZ is not required to meet the obligations of ANZ Royal Bank. European Economic Area (EEA): United Kingdom. ANZ is authorised in the United Kingdom by the Prudential Regulation Authority (PRA) and is subject to regulation by the Financial Conduct Authority (FCA) and limited regulation by the PRA. Details about the extent of our regulation by the PRA are available from us on request. This document is distributed in the United Kingdom by Australia and New Zealand Banking Group Limited ANZ solely for the information of persons who would come within the FCA definition of “eligible counterparty” or “professional client”. It is not intended for and must not be distributed to any person who would come within the FCA definition of “retail client”. Nothing here excludes or restricts any duty or liability to a customer which ANZ may have under the UK Financial Services and Markets Act 2000 or under the regulatory system as defined in the Rules of the Prudential Regulation Authority (PRA) and the FCA. ANZ is authorised in the United Kingdom by the PRA and is subject to regulation by the FCA and limited regulation by the PRA. Details about the extent of our regulation by the PRA are available from us on request. Fiji. For Fiji regulatory purposes, this document and any views and recommendations are not to be deemed as investment advice. Fiji investors must seek licensed professional advice should they wish to make any investment in relation to this document. Hong Kong. This publication is issued or distributed in Hong Kong by the Hong Kong branch of ANZ, which is registered at the Hong Kong Monetary Authority to conduct Type 1 (dealing in securities), Type 4 (advising on securities) and Type 6 (advising on corporate finance) regulated activities. The contents of this publication have not been reviewed by any regulatory authority in Hong Kong. India. If this document is received in India, only you (the specified recipient) may print it provided that before doing so, you specify on it your name and place of printing. ANZ Research Agri Focus | April 2019 20
You can also read