New Zealand Property Focus - In question ANZ Research May 2020
←
→
Page content transcription
If your browser does not render page correctly, please read the page content below
ANZ Research     May 2020

New Zealand
Property Focus
In question

This is not personal advice. It        Summary
does not consider your                 Our monthly Property Focus publication provides an independent appraisal of
objectives or circumstances.
                                       recent developments in the residential property market.
Please refer to the Important
Notice.
                                       Feature Article: In question
                                       The outlook for the property market has shifted abruptly. This has raised many
INSIDE
                                       questions and we could arguably write an ANZ Property Focus on each. This
Feature Article: In question       3   month we give short answers to some of those big questions.
The Property Market in Pictures   12
Property Gauges                   16   1.   What are the economic impacts of the current crisis?
Economic Overview                 18
Mortgage Borrowing Strategy       19   2.   How might the crisis affect the property market?
Key Forecasts                     20
Important Notice                  21   3.   What will happen to house prices?
                                       4.   What is the RBNZ doing to help? Will it work?
                                       5.   Is it a good opportunity for first home buyers?
CONTRIBUTORS                           6.   What is the Government doing to help the economy? Will it work?
Liz Kendall
Senior Economist                       7.   What is the outlook for migration?
Telephone: +64 27 240 9969
Elizabeth.Kendall@anz.com              8.   Does New Zealand have a housing shortage?
David Croy                             9.   What regions are most vulnerable to house price falls?
Strategist
Telephone: +64 27 432 2769             10. How do banks fit into all of this?
david.croy@anz.com
                                       This document contains clickable links so that it is easy to navigate between
Sharon Zollner
Chief Economist                        questions. Questions/answers are written to be standalone.
Telephone: +64 27 664 3554
Sharon.Zollner@anz.com
                                       Economic overview
                                       The outlook is grim, with an unprecedented global economic slump underway.
                                       In New Zealand, we have made great progress containing the spread of
ISSN 2624-0629                         COVID-19 and a lot of activity has been able to resume with the move to Alert
                                       Level 2. But we are still a long way from normality, and this downturn will take
Publication date: 20 May 2020          a long time to recover from. Even as the economy gets underway again,
                                       demand will be weak and the economy will have to reshape, with industries like
                                       tourism affected in lasting ways. The Government has unveiled a big Budget
                                       with plenty of spending to help shore up the outlook. Likewise, the RBNZ is
                                       prepared to pull out all the stops and do what it can to support the recovery.
                                       We expect that QE will be expanded again at the August MPS. But a large
                                       economic hit is unavoidable, and the recovery is expected to be slow.

                                       Mortgage borrowing strategy
                                       Mortgage rates continue to fall with most fixed rates now lower than the last
                                       month’s already-record lows, and some specials now below 3%. This has been
                                       driven by a further lowering and flattening of the term structure of the
                                       government bond yield curve, which has in turn been driven by the Reserve
                                       Bank’s decision to employ quantitative easing (QE) now that the OCR is at its
                                       current practical lower bound of 0.25%. Although the OCR isn’t likely to go
                                       lower (or negative) any time soon, it might next year, and in the meantime we
                                       expect longer-term rates to fall as the Reserve Bank’s QE programme gets
                                       expanded. As such we favour the 1-year rate with a view to making a fresh
                                       decision then, when all rates are likely to be lower.

ANZ New Zealand Property Focus | May 2020                                                                               2
Feature Article: In question
Summary It will be harder for people who are out of work to
get jobs and some may need to reskill. Wage
The outlook for the property market has shifted
increases will be modest for quite some time.
abruptly. This has raised many questions and we could
arguably write an ANZ Property Focus on each. This General price inflation will be weaker due to
month we give short answers to some of those big reduced demand for goods and services. Inflation
questions. will fall below 1% over the coming year and
recover only gradually.
1. What are the economic impacts of the current
crisis? Many segments of the property market will be
affected (see question 2).
2. How might the crisis affect the property market?
Significant monetary and fiscal stimulus will be
3. What will happen to house prices?
needed to cushion the blow and support the
4. What is the RBNZ doing to help? Will it work? recovery (see question 3 and question 5).
5. Is it a good opportunity for first home buyers? Interest rates will remain low for a long time. See
our Mortgage Borrower Strategy (page 19).
6. What is the Government doing to help the
economy? Will it work? The global slump could see financial market jitters
re-emerge, especially as default rates rise in
7. What is the outlook for migration?
countries like the US.
8. Does New Zealand have a housing shortage?
As the magnitude of the global downturn becomes
9. What regions are most vulnerable to house price evident, we expect this will weigh on the exchange
falls? rate.
10. How do banks fit into all of this? Of course the outlook is very uncertain and there are
risks in both directions around these forecasts. See our
This document contains clickable links so that it is easy
Economic Overview (page 18) for more details.
to navigate between questions.
1. What are the economic impacts of the 2. How might the crisis affect the property
current crisis? market?
Last month, our ANZ Property Focus discussed the
The COVID-19 health crisis is also an economic crisis.
outlook for various segments of the property market.
GDP slumped as we moved into lockdown. And even
Our views have not changed materially since then.
as we progressively ease restrictions, it will be difficult
for the economy to bounce back from here. There will Property market data will likely be all over the place in
be an initial partial recovery, but the economic the period covering the lockdown period and the
damage will be long lasting. easing of restrictions. For example, in April, house
sales fell 75% m/m, according to REINZ (figure 1).
Unemployment is rising rapidly, and will increase even
New listings were so sparse in April that
more as firms are eventually forced to make difficult
realestate.co.nz did not do a normal data release.
choices. Household incomes and firms’ cash flow will
be significantly affected, and the outlook for Figure 1: House prices and sales
employment and investment is weak. Domestic 12 30
demand will be soft and restrictions will be with us for 11 25
a long time (especially border closures). The global 10
20
slump will also be marked, meaning weaker export 9
Annual % change
15
demand and lower export prices. 8
'000 (sa)
7 10
Overall, we expect: 6 5
5
GDP will fall 8-10% this year and not return to 0
4
pre-crisis levels until 2023. -5
3
Although the Government is doing what it can, 2 -10
some firms will fail and some jobs will be lost. 1 -15
Business revenue, household income and export 93 95 97 99 01 03 05 07 09 11 13 15 17 19
earnings will all be weak. House sales (adv 3 mths, LHS) REINZ HPI (RHS)
Unemployment will peak at 11% in the middle of Source: REINZ
the year, then fall to 8% by the start of next year,
declining only gradually from there.
ANZ New Zealand Property Focus | May 2020 3
Feature Article: In question
There will be some bounce back in transactions in a lot of uncertainty at present; many property market
May, with more sales able to occur in Level 2 and 3. participants are in limbo, with sales delayed, projects
But the size of the bounce is uncertain, and will cancelled, and the like. Construction firms will incur
depend on the resilience of housing demand. significant delay costs in the short term, reducing
profitability, and the pipeline of work will be weak over
When transactions are as low as they have been, it is
the medium term. Property developers may also be
difficult to determine general price trends, and price
under pressure due to delay costs, weakening demand
movements can be quite erratic. Over April, prices fell
and falling asset values.
a modest 1.1% m/m. However, downturns in prices
tend to lag sales, and it will take some months for a
3. What will happen to house prices?
weaker trend to be evident, with sales activity still
restricted and new listings very low. We expect that House prices are expected to fall, as usually happens
both sales and price data will be whippy for a while, during economic downturns (figure 2).
but that a softening in housing demand will become Figure 2. House prices and GDP
clear over time. 30 ANZ Forecasts
25
A number of factors will weigh on housing demand and
20
lead to a significant downturn in house prices, in our
Annual % change
15
view (see question 3 for more details). We are also
10
anticipating weaker home building, as consents drop
5
off and build plans are cancelled, especially in the
0
high-value residential space. Some regions will be
-5
more affected by this softening than others (see
-10
question 9 and our regional heatmap).
-15
Rents will also be affected by lower demand and -20
reduced ability to pay. More supply coming on stream -25
due to short-term rentals sitting vacant will also see 92 94 96 98 00 02 04 06 08 10 12 14 16 18 20 22
GDP House prices
the supply-demand balance shift and put rents under
downward pressure. This will become clear as new Source: REINZ, Statistics NZ, ANZ Research
tenancies are entered into, and in some cases where A number of factors will weigh on housing demand:
tenants negotiate down their rents to a level they can
afford. Landlords in some regions may not have much Firm revenue and household income expectations
negotiating power, given the increase in rentals will be lower, while unemployment and business
available. failure rates are expected to increase.
Many firms and households are relying on credit to get For some, it will be difficult to cover their debt-
through, with banks helping customers through this servicing costs, even though interest rates are low.
period. However, due to the riskier economic Uncertainty is huge, which in itself will put off
environment credit availability is likely to be somewhat some buyers.
constrained going forward, which could weigh on
housing demand and construction. See question 10 for Greater availability of short-term rentals alongside
more on the role of banks. a high level of new builds in progress will see
housing supply increase, tipping the balance of
Lower rents, falling prices and credit constraints are supply and demand for physical housing and
expected to affect the commercial property market dampening rents. See question 8 for what this
too. Indeed, impacts are likely to be greater there means for our housing shortage.
than on the residential side. The commercial property
market is particularly “cyclical” (which means it is very Some homeowners will experience financial
affected by cycles in GDP and incomes). This is distress and mortgage delinquencies will rise,
because there is a link between business activity and leading to fire sales.
demand for commercial buildings. Additionally, some Migration is expected to be lower (question 7).
participants in this market take on more risk. Riskier
ventures may be more vulnerable to asset price falls, Expectations that demand for housing will be weak
exacerbated by the fact that they are probably also in the future will impact house prices today, over
more likely to come up against credit constraints. and above changes in supply and demand right
now.
Some firms in industries connected to the property
market will be feeling the pinch. Cash flow is a Banks are likely to be cautious; credit availability
widespread problem, and many firms have not been will be hampered by lower asset values and worse
able to generate revenue at all for a time. There is also income prospects.
ANZ New Zealand Property Focus | May 2020 4Feature Article: In question
Households will look to deleverage and be cautious Reduced yields encourage existing holders of these
about taking on more debt. bonds to buy other, higher-yielding ones. This
creates beneficial spill-overs, suppressing other
But there are offsets:
yields too (eg on corporate debt).
Interest rates are very low and are expected to
This lowers interest rates in financial markets
remain low for a very long time.
more broadly, easing costs for a wide range of
Government policies are aimed at supporting borrowers, including households. This is because
household and firm cash flow. as the cost of borrowing falls for banks, mortgage
rates also tend to fall.
There will be fewer new listings.
This encourages economic activity by bolstering
New builds will not come online as quickly.
domestic demand and encouraging net exports. It
Loan-to-value restrictions have been removed (see also leads to higher inflation, and supports
question 4). inflation expectations.
Our forecasts have not changed since our last ANZ One of the ways that low borrowing costs support
Property Focus. We continue to expect house prices the economy is through the housing market.
will fall 10-15% over the year, compared with a fall of Current and expected low interest rates push up
8-10% in GDP. the value of housing (and other asset prices) and
this helps to boost demand, particularly household
On balance, we see downside risk to our forecast.
spending and construction.
Usually the housing market actually responds more to
downturns in GDP than we have assumed. This means The evidence suggests that quantitative easing has
there is a risk of an even greater fall. But with the been effective. Figure 3 shows the recent fall in
current downturn so far outside of usual historical Government and other bond yields. It’s difficult to
events, it is unclear what “normal” for the property measure how much of an impact this will have on the
market would be right here and now. economy, but it is significant. Estimates suggest that
the stimulus that the RBNZ has provided to the end of
With the virus in retreat in New Zealand, downside
April might be equivalent to an OCR of -2%.1
risks have receded slightly, particularly if the RBNZ
provide more stimulus than previously assumed (see Figure 3: Yields on selected New Zealand 4-5 year
question 4). We don’t think the RBNZ can prevent wholesale bonds
house prices from falling double-digit, but they may be 4.00
RBNZ announces
able to support a faster recovery. Nonetheless, 3.50 QE on LGFA
downside risks remain, particularly if financial market 3.00
jitters were to lead to a tightening in funding markets
2.50
and credit supply.
Yield (%)
2.00
4. What is the RBNZ doing to help? Will it 1.50
work? 1.00
0.50
The RBNZ has lowered the Official Cash Rate (OCR) to RBNZ announces
QE on NZGBs
0.25% and embarked on a quantitative easing (“QE”) 0.00
Feb-20 Mar-20 Apr-20 May-20
programme to help stimulate the economy.
5yr Government Bond 5yr LGFA Bond
Our recent FAQ explains what quantitative easing is 4yr ANZ Bond 5yr Fonterra Bond
5yr Kiwi Property Bond 5yr Meridian Bond
and how it works. Broadly, it goes like this:
Source: Bloomberg, RBNZ
The RBNZ purchases assets (primarily Government
The recent expansion of the programme from $33bn
bonds at this stage) in significant quantities from
to $60bn will provide even more stimulus than that,
holders in the secondary market (not directly from
but we expect that still more will be needed in time.
the Government).
The RBNZ is committed to doing what it can, and we
This makes these bonds easier to sell, suppressing think that the recovery will be slower than they are
borrowing costs for those (like the Government) currently assuming, and that the surge in bond
who are issuing these bonds. In mathematical issuance will be more of a headwind to markets
terms, the resulting higher prices for bonds equate (putting upward pressure on interest rates). We think
to lower yields (see a bond explainer here). It also QE will be expanded to $90bn at the August MPS.
tends to lower the exchange rate.
1
Based on “Shadow Short Rate” estimates by LJK Limited.
ANZ New Zealand Property Focus | May 2020 5Feature Article: In question
The RBNZ is also leaving its options open, with other 5. Is it a good opportunity for first home
tools like negative policy rates possible eventually, if
buyers?
required. But monetary stimulus won’t be enough to
stop the recession taking place or house prices from Whether or not it makes sense to enter the property
falling. However, it will contribute to a recovery in market – or purchase another house – always depends
house prices and GDP into 2021. on personal circumstances.
Unfortunately, the RBNZ cannot fix all economic The current situation could provide an opportunity for
problems. Monetary policy is a blunt tool used to first home buyers to enter the market when houses
stabilise the economy broadly; it cannot work against are more affordable and interest rates low (see
the specific business impacts of a health crisis. And it question 3 for our forecasts and question 9 for the
is also hitting its limits. Monetary policy and fiscal regional outlook). However, the outlook is highly
policy (question 6) need to work in tandem. And even uncertain and it is always very difficult to pick the
then, some economic impact and adjustment is bottom of the cycle. And it’s not just about house
inevitable – and necessary, unfortunately. But without prices and interest rates; much will also depend on
monetary stimulus from the RBNZ, the adverse credit availability, income prospects, and the like.
economic impact of this crisis would be much worse. For some, low mortgage rates may make purchasing
The RBNZ has also taken steps to ensure that bank more affordable. And at the margin, new opportunities
lending can flow effectively. To do this, the RBNZ has may arise for some buyers with low equity, given that
made funding facilities available to banks that can be low loan-to-value restrictions have been removed (see
drawn on if required. They have also delayed proposed question 4). Plus, lower rates of migration (see
increases in bank capital requirements. question 7) and reduced demand more generally
(question 3) may reduce competition in the market.
The increases in bank capital requirements that were These same factors may also encourage existing
planned would have increased the amount of owner-occupiers to upsize.
shareholder equity banks had to hold – meaning banks
would have more “skin in the game” and risks of But for some first home buyers, getting into the
financial distress would be lower. However, the housing market may now unfortunately be harder.
downside of banks holding more capital is that it is KiwiSaver balances may be lower, there may be more
quite costly, meaning costs to borrowers would be hoops to jump through to get credit, and employment
higher and in some cases less credit would be prospects may have changed. And although
available. Increasing capital requirements in the midst opportunities may present themselves, we expect
of the current crisis could have adversely impacted purchasers to be fairly cautious overall. The economic
banks’ scope to provide credit and led to more and property outlook is very uncertain, sentiment is
significant economic impacts. weak, and job security has deteriorated.
Figure 4: Share of new mortgage lending
The RBNZ has also removed loan-to-value (LVR)
70
restrictions, meaning that banks can lend to
purchasers with low deposits or equity in whatever 60
amount they see fit. This doesn’t mean banks will be
lending willy-nilly; banks risk assessments will be 50
crucial for determining whether lending to someone 40
with low equity is a good idea. But it provides %
additional flexibility so that banks can provide credit in 30
cases where it is considered appropriate, and in 20
particular, enables the mortgage payment deferment
scheme to work as intended (see question 10 for more 10
on the role of banks).
0
15 16 17 18 19 20
The removal of LVR restrictions might provide a little
Investor First home buyer Other owner-occupier
boost to the housing market at the margin, but
probably not a lot. This is because we wouldn’t expect Source: RBNZ, ANZ Research
the loan-to-value ratios to be particularly binding For those who purchased a property just before the
anyway at the moment, with demand soft, and both crisis hit, conditions may be particularly difficult or
households and banks cautious. uncertain at present, particularly if sales are still in
limbo or if purchases were made with low deposits. As
prices fall, those people could find their equity eroded:
they might suddenly owe a similar amount or
potentially more than what their property is worth. As
ANZ New Zealand Property Focus | May 2020 6Feature Article: In question
long as they can hold on through it, it’s just a paper Government debt is expected to increase substantially
loss, but it’s a highly unsettling situation to be in. as a result. Eventually, this will need to be paid back,
which may mean higher taxes, reduced spending or
For investors, although the removal of LVR restrictions
changes to entitlements eventually. But that’s a
ostensibly gives them more options, there are the
problem for another day. It does mean that it is
additional issues of finding tenants, the prospect of
important for additional measures to be targeted and
lower rents (question 2), and a higher risk of rent
temporary, in order to have the most effect for the
arrears. For this reason, we may see the proportion of
least cost. It will need to be directed to those firms
investors in the market reduce a little, and the share
and households who need it most.
of owner-occupiers could increase as some first home
buyers take the opportunity to enter the market. This The Government’s initiatives will help to support the
would see the recent upward trend in the share of new economy and keep people in jobs – the question is
lending to first home buyers continue (figure 4), even whether it will be enough, with potentially still more
if the dollar amount falls. spending required down the track. Fiscal stimulus and
support from the RBNZ (question 4) are both crucial
6. What is the Government doing to help for shoring up the outlook; if it weren’t for these, the
the economy? Will it work? outlook would be significantly worse than we currently
expect. But like monetary policy, the Government
The current crisis has necessitated an extraordinary
cannot entirely prevent the effects of the unfolding
response from the Government, which will affect the
health crisis and some economic impact will be
outlook for many years to come. A range of policy
inevitable.
initiatives were required in the early stages of the
crisis, including: For construction, the wage subsidy scheme provided
support while the industry was unable to work. But
The wage subsidy scheme and other initiatives
now activity has started again the bigger concern is
(including on tax) to support businesses.
the outlook for demand. The Government plans to
Household income support, including increased provide support by building more public housing
benefit and superannuation payments. (8,000 dwellings), with the aim to chip away at the
housing shortage (question 8). It’s perfect timing to
Lending schemes for businesses and mortgage
do it when the construction sector is likely to otherwise
deferment options for households.
be underemployed. Training and education
And at the Budget last week, a number of other programmes could also help with migrant labour now
initiatives were also announced, including: more difficult to come by, although fewer workers will
likely be needed for a time. And with some funds
A $4bn business support package, including a
unallocated in the Budget, there could be scope for
targeted $3.2bn wage subsidy extension.
more spending to come that benefits the industry.
$3bn of infrastructure investment and a
programme to build 8,000 public houses. 7. What is the outlook for migration?
$1.4bn for trades and free training and The outlook for migration is very uncertain and has
apprenticeships. significant bearing on the outlook for both GDP and
the housing market. We will have more to say about
A $1bn environmental jobs package. this in a future ANZ Property Focus. But broadly, our
$3.3bn of new funding to strengthen core services current expectation is that migration will be
including health and education. significantly weaker as a result of the current crisis,
particularly in the near term as a result of border
The Government has also left a lot of funds closures, but also over the medium term due to the
unallocated, acknowledging that yet more help will be weak economic outlook.
required in some areas, but that more time is required
to make best use of the funds. This totals about $20bn The data is likely to be volatile (even more so than
of the $50bn spend up, so there are other options on usual) and exactly where the trend will settle may be
the table, and more policies can be expected down the difficult to pin down for a while. With borders closed
track. and very few flights happening, international arrivals
are close to zero (figure 5). Very few people are
In addition to these initiatives, revenue will fall (a choosing, or able, to leave either. And this is expected
lower tax take) and spending will naturally increase to be the case for a while yet.
anyway (though higher benefits and the like). So the
full cost of the fiscal spend is going to be huge. New Zealand is relaxing restrictions on domestic
travel, but progress against the virus is needed
globally for international borders to start gradually
ANZ New Zealand Property Focus | May 2020 7Feature Article: In question
reopening. Migration is expected to hover close to zero having to be revised abruptly. This weaker outlook for
until that happens and flights resume. population growth also calls into question whether
New Zealand has a housing shortage, and how large it
Once flights are going again, we expect there will be a
might be, which leads us to question 8.
small recovery in net migration numbers. Given high
unemployment globally and heighted virus risk abroad,
8. Does New Zealand have a housing
some kiwis are expected to return home once more
opportunities to do so become available. The pull to shortage?
come back will be weaker in the likes of Australia Yes, but it’s hard to measure and the outlook is very
where good progress in controlling the outbreak has uncertain. Estimates of supply “shortages” are very
been made, though people who wish to return from simplistic. They take into account growth in the
there may be able to do so sooner. Those that do population, depreciation of the housing stock (ie
return from across the Tasman are more likely to be replacing existing houses as they become dilapidated)
facing financial difficulties, and/or haven’t been able to and the rate of new building. But they typically do not
find employment, meaning the boost their arrival take into account how household formation changes
provides to the housing market may be limited. when economic conditions change. When housing is
less affordable or employment prospects are worse,
Figure 5: Visitor arrivals
35,000
people tend to move into shared living arrangements –
this has been seen increasingly since 2014 as house
30,000
prices have risen further. And higher unemployment
25,000 also means bigger households.
20,000
Figure 6 shows that the balance between the physical
Number
15,000
demand and supply of houses ebbed and flowed
10,000 between 1992 and 2009. Houses became more
5,000 expensive, but this was driven in large part by rising
land values, rather than a dearth of new building.
0
Restricted supply of land, low interest rates, credit
1-Jan
8-Jan
1-Apr
8-Apr
15-Jan
22-Jan
29-Jan
15-Apr
22-Apr
29-Apr
4-Mar
11-Mar
18-Mar
25-Mar
6-May
13-May
20-May
27-May
5-Feb
12-Feb
19-Feb
26-Feb
availability and expectations of strong demand in the
future all contributed to rising land values and house
Jan Feb Mar Apr May
prices. But from 2009 insufficient building became
2019 - A 2020 - A
another key driver of high house prices, in addition to
Source: Statistics NZ
land values continuing to rise due to a
Following this initial influx, migration inflows are regulation-driven lack of supply.
expected to settle at a significantly lower level to Figure 6: Housing supply-demand balance
previous norms. Migrants from some lower-income 16,000
countries will still find New Zealand an attractive
14,000
destination if they are able to come here, so we still
12,000
Number of houses
expect to see positive migration flows. But
10,000
employment prospects here will be much worse than
8,000
they have been, even if New Zealand’s recovery is
6,000
more advanced than in other places.
4,000
Fewer jobs will be available for migrant workers, 2,000
particularly in industries like tourism, construction and 0
hospitality. And the recovery will be slow, which will -2,000
weigh on migration for quite some time. Firms
-4,000
previously reliant on migrant labour may be able to 92 94 96 98 00 02 04 06 08 10 12 14 16 18 20
more easily find domestic workers, although in some Excess demand (supply) Supply (advanced 2 qtrs) Demand
cases retraining may be required. A sharp drop in
Source: Statistics NZ, ANZ Research
migration also happened following the GFC for similar
reasons as labour market conditions deteriorated. A housing shortage has become increasingly evident in
recent years, contributing to high house prices and
This weaker outlook for migration means that the
rents, overcrowding and homelessness. This was a
prospects of significant population-led GDP growth in
product of strong migration-led population growth that
the recovery are slim. However, fewer Kiwis moving
was not matched by new building and infrastructure
abroad will put a floor under things. Nonetheless,
provision. Too few houses were built, though the exact
weaker rates of migration will weigh on house prices
magnitude of the shortage is unknown.
significantly, with expectations of future demand now
ANZ New Zealand Property Focus | May 2020 8Feature Article: In question
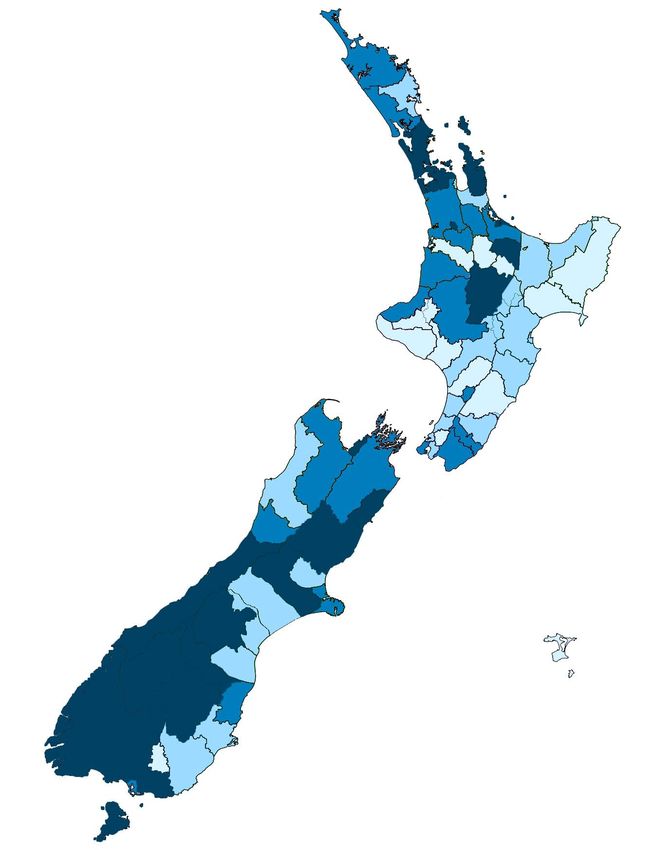
Based on our calculations, the shortfall looks to be at Areas that have seen rapid increases in house
least 50k, but it could be as high as 100k, depending prices recently, since expectations could change
on how many people would choose to live in smaller more dramatically.
households if houses were cheaper. Pinning down
We have assessed each region according to some of
estimates is difficult and may be particularly fraught at
these factors and have assigned a degree of
the turn of the cycle when behaviour can change quite
vulnerability to each. The most vulnerable regions are
quickly.
Queenstown-Lakes District, Mackenzie, Kaikoura,
However, we expect that excess demand pressures Westland, Taupo and Thames-Coromandel.
are no longer building and that supply will start to
Our overall assessment of vulnerability is based on a
outpace demand imminently. The shortfall will start to
weighting of exposure to tourism, migration and
erode, potentially very quickly from here. Even as new
building – all in per capita terms. See table and
building slows considerably, supply looks set to
heatmap overleaf.
outpace demand for a while, with migration close to
zero for a time and settling at a low level thereafter
10. How do banks fit into all of this?
(question 7).
Banks are naturally playing a role in helping customers
That said, the outlook is very uncertain going forward; through the difficult economic times that are unfolding.
a lot depends on what happens to new building, Lending is generally available, but there may be more
Government policy (the Budget included an 8,000 hoops to jump through given the increased riskiness of
dwelling public housing increase) and the outlook for the world at the moment. And credit demand is likely
population pressures, which are highly uncertain. We to be a bit softer in any case.
will talk about the outlook for these factors more in a
future ANZ Property Focus. As financial situations have changed, some existing
customers have chosen to move to interest-only loan
Certainly, there is scope for the Government to do repayments for a time, or extend the terms of their
what it can to support building and this may contribute loan. For others, the mortgage repayment deferment
to downward pressure on house prices. But if the scheme is helping ease pressures in the short term.
balance between population growth and new building However, interest still accrues, leaving debt levels
were to change quite rapidly, an overshoot to an higher than before, so it is a stop-gap measure, and
oversupply of houses is possible, which would dampen long-term prospects needs to be a key consideration.
house prices even further.
Banks have to be prudent in their decisions in the time
9. What regions are most vulnerable to ahead. Asset values will be falling and non-performing
loans look set to rise to some extent, as they always
house price falls?
do in downturns. Households’ financial positions will be
It’s hard to predict what regions will be most affected less favourable in aggregate, due to reduced income
by weakness in the housing market. There is likely to prospects, lower house prices and debt overhang. This
be a lot of volatility in housing market data for a time will affect collateral values and credit eligibility. Higher
(question 2), particularly in smaller regions, given that mortgage delinquencies and lower collateral values will
already-low transactions there could make price weigh on bank balance sheets and affect lending
signals even more erratic. decisions too.
We expect that house prices will fall 10-15% with Banks will need to act mindfully to protect their
downside risk (question 3), but regions will be balance sheets, shareholder equity and deposits. It is
impacted differently. We don’t have regional house important for banks to protect their ability to provide
price forecasts, but those regions that are more credit to the economy more broadly. Risk assessments
vulnerable to falls are: will continue to be important in determining where
Those regions that are significantly exposed to credit flows.
international tourism, since this will not recover for The RBNZ’s removal of low LVR restrictions (question
a long time. 4) may give banks the flexibility to provide more credit
Regions that tend to attract new immigrants and at the margin, but our expectation is that these
students from overseas (although people reskilling restrictions would not have been particularly binding in
will provide a partial offset in university centres). the current climate anyway.
Areas that have seen high rates of building Credit demand is expected to be weak in line with
recently, since the balance between supply and housing demand (question 3), but also because
demand (question 8) of physical housing may households will be somewhat cautious about taking on
change more rapidly in these places. debt, even though debt-servicing costs are low. To
shore up financial positions, we expect both
ANZ New Zealand Property Focus | May 2020 9Feature Article: In question
households and firms will embark on a period of Table 1. Vulnerability to house price falls by region
deleveraging such as occurred after the 2008/09 Vulnerability is estimated based on per capita exposure to
recession. tourism, migration and high rates of building (darker blue
indicates greater vulnerability)
Overall, it is likely that over time credit growth will
Tourism Migration Building Overall
decline as the housing market cools and banks operate Ashburton District Dark blue Lighter blue Lighter blue Light e r blue
cautiously, as occurred following the GFC. But while Auckland Dark blue Navy Navy N avy
Buller District
system-wide credit growth is likely to decline, we don’t
Dark blue Very light blue Dark blue Light e r blue
Carterton District Very light blue Dark blue Navy D a rk blue
expect banks to come under significant pressure. Central Hawke's Bay District Very light blue Dark blue Dark blue Light e r blue
Central Otago District
Banks have strong capital and liquidity positions to Chatham Islands Territory
Dark blue
Dark blue
Dark blue
Very light blue
Navy
Very light blue
N avy
V e ry light blue
weather this crisis, along with strong risk management Christchurch City Dark blue Navy Dark blue D a rk blue
processes. And the RBNZ’s QE programme (question Clutha District Lighter blue Dark blue Lighter blue Light e r blue
Dunedin City Dark blue Dark blue Lighter blue Light e r blue
4) and bank lending backstops will keep funding costs Far North District Dark blue Dark blue Lighter blue D a rk blue
contained generally, by keeping wholesale funding Gisborne District Lighter blue Lighter blue Very light blue V e ry light blue
Gore District
costs low for banks.
Dark blue Lighter blue Very light blue V e ry light blue
Grey District Dark blue Lighter blue Lighter blue D a rk blue
Hamilton City
The Government and RBNZ are also doing what they
Dark blue Navy Navy N avy
Hastings District Lighter blue Dark blue Dark blue Light e r blue
can to ensure the financial system can function Hauraki District Lighter blue Dark blue Dark blue Light e r blue
Horowhenua District
smoothly and banks can lend effectively. This reduces Hurunui District
Very light blue
Navy
Lighter blue
Very light blue
Navy
Navy
Light e r blue
N avy
the risk that the system gets stressed, credit is halted Invercargill City Lighter blue Navy Lighter blue D a rk blue
and significant fire-sale dynamics start to emerge. So Kaikoura District Navy Dark blue Navy N avy
Kaipara District Dark blue Lighter blue Navy D a rk blue
overall, we don’t expect to see a widespread credit Kapiti Coast District Lighter blue Dark blue Lighter blue Light e r blue
crunch, though this cannot be ruled out as a risk. Kawerau District Very light blue Navy Very light blue Light e r blue
Lower Hutt City Very light blue Dark blue Dark blue Light e r blue
If the RBNZ were to take the OCR negative, then this Mackenzie District Navy Very light blue Navy N avy
Manawatu District
could present profitability challenges and thereby stifle
Very light blue Very light blue Dark blue V e ry light blue
Marlborough District Dark blue Lighter blue Dark blue D a rk blue
bank lending. However, we do not expect that the Masterton District Lighter blue Lighter blue Dark blue Light e r blue
Matamata-Piako District
RBNZ will be looking to do this any time soon. In our Napier City
Lighter blue
Dark blue
Navy
Dark blue
Navy
Lighter blue
D a rk blue
Light e r blue
view, the hurdle to doing so is high, as discussed in Nelson City Dark blue Navy Dark blue N avy
our recent ANZ Weekly Focus and QE FAQ. New Plymouth District Lighter blue Dark blue Dark blue D a rk blue
Opotiki District Lighter blue Dark blue Lighter blue Light e r blue
Otorohanga District Very light blue Lighter blue Very light blue V e ry light blue
Palmerston North City Lighter blue Navy Dark blue D a rk blue
Porirua City Very light blue Lighter blue Dark blue Light e r blue
Queenstown-Lakes District Navy Navy Navy N avy
Rangitikei District Lighter blue Lighter blue Lighter blue Light e r blue
Rotorua District Navy Navy Very light blue N avy
Ruapehu District Navy Very light blue Lighter blue D a rk blue
Selwyn District Very light blue Dark blue Navy N avy
South Taranaki District Very light blue Dark blue Very light blue V e ry light blue
South Waikato District Lighter blue Very light blue Very light blue V e ry light blue
South Wairarapa District Dark blue Lighter blue Dark blue D a rk blue
Southland District Navy Dark blue Dark blue N avy
Stratford District Very light blue Lighter blue Lighter blue V e ry light blue
Tararua District Very light blue Very light blue Very light blue V e ry light blue
Tasman District Dark blue Lighter blue Navy D a rk blue
Taupo District Navy Lighter blue Navy N avy
Tauranga City Dark blue Navy Navy N avy
Thames-Coromandel District Navy Dark blue Navy N avy
Timaru District Lighter blue Lighter blue Lighter blue Light e r blue
Upper Hutt City Very light blue Lighter blue Lighter blue V e ry light blue
Waikato District Very light blue Lighter blue Navy D a rk blue
Waimakariri District Very light blue Lighter blue Navy Light e r blue
Waimate District Very light blue Dark blue Lighter blue Light e r blue
Waipa District Lighter blue Lighter blue Navy D a rk blue
Wairoa District Very light blue Very light blue Very light blue V e ry light blue
Waitaki District Dark blue Navy Dark blue D a rk blue
Waitomo District Dark blue Navy Very light blue D a rk blue
Wellington City Dark blue Lighter blue Dark blue D a rk blue
Western Bay of Plenty District Very light blue Navy Dark blue D a rk blue
Westland District Navy Very light blue Lighter blue N avy
Whakatane District Lighter blue Dark blue Lighter blue Light e r blue
Whanganui District Very light blue Dark blue Very light blue V e ry light blue
Whangarei District Dark blue Lighter blue Dark blue Light e r blue
Source: MBIE, Statistics NZ, ANZ Research
ANZ New Zealand Property Focus | May 2020 10Feature Article: In question
Heatmap: Vulnerability to house price falls by region
Key
Extremely vulnerable
Very vulnerable
Vulnerable
Less vulnerable
ANZ New Zealand Property Focus | May 2020 11Property Market in Pictures
Figure 1. Regional house price inflation House prices fell 1.1% m/m in April. However, this is
35 just the beginning, with the weaker labour market
30 and housing demand impulse yet to become fully
Annual % change (3-mth avg)
25 evident.
20
House prices fell 0.4% m/m in Auckland and 1.2%
15
elsewhere, with particularly large falls in Canterbury
10
(-3.4% m/m), Waikato (-3.3%), Manawatu-
5 Whanganui (-1.9%) and West Coast (-1.8%). In
0 annual terms, house price inflation is sitting at 8.5%
-5 y/y, reflecting the run-up in prices over the second
-10 half of last year.
-15
93 95 97 99 01 03 05 07 09 11 13 15 17 19
Housing demand is expected to be weaker (see
New Zealand Auckland Wellington Canterbury
question 2 in the feature article), weighing on house
prices (question 3), with some regions particularly
Source: ANZ Research, REINZ
affected (question 9).
Figure 2. REINZ house prices and sales Sales volumes and prices tend to be closely
8 40 correlated, although at times tight dwelling supply can
7 complicate the relationship.
30
House sales fell 75% m/m in April, with the country in
Sales per '000 dwellings
6
3-mth annualised
20 lockdown over the month. Often prices lag sales,
5
contributing to the smaller move in prices seen over
4 10
the month. We can expect a bounce in sales next
3 month, but to a lower level as weak demand becomes
0
evident.
2
1
-10 Sales fell 73% in Auckland and 75% elsewhere. Falls
were largest in Southland (-91% m/m), Tasman-
0 -20
91 93 95 97 99 01 03 05 07 09 11 13 15 17 19
Nelson-Marlborough (-87%), Otago (-84%) and
House sales (LHS) REINZ HPI (RHS)
Manawatu-Whanganui (-84%).
Source: ANZ Research, REINZ
Figure 3. Sales and median days to sell How long it takes to sell a house is also an indicator of
12 20 the strength of the market, encompassing both
11 25 demand and supply-side considerations. Larger cities
10
30 tend to see houses sell more quickly, but deviations in
9 a region from its average provide an indicator of the
Days (inverted, sa)
35
8 heat in a market at any given time.
'000 (sa)
7 40
6 45
The number of days it takes to sell a house has
5 generally been very low, but rose from 33 to 35 days
50
4 in April. This can be expected to lengthen further as
55 weak demand becomes evident. However, low new
3
2 60 inventory could cushion some of the impact on days
1 65 to sell and prices.
93 95 97 99 01 03 05 07 09 11 13 15 17 19
House sales (LHS) Days to sell (RHS)
Source: ANZ Research, REINZ
ANZ New Zealand Property Focus | May 2020 12Property Market in Pictures
Figure 4. REINZ and QV house prices There are three monthly measures of house prices in
30 New Zealand: the median and house price index
25 measures produced by REINZ, and the monthly
20
QVNZ house price index. The latter tends to lag the
other measures as it records sales later in the
Annual % change
15
transaction process. Moreover, movements do not
10
line up exactly, given differing methodologies (the
5 REINZ house price index and QVNZ measures
0 attempt to adjust for the quality of houses sold).
-5 The REINZ HPI – our preferred measure – softened a
-10 little to 8.5% y/y in April. This is above the QVNZ
-15
measure, which came in at 7.1% y/y. The REINZ
92 94 96 98 00 02 04 06 08 10 12 14 16 18 20 median also crept up to 15% y/y (3mma), but this
QV HPI REINZ HPI REINZ median (3m avg) likely reflects compositional effects.
Source: ANZ Research, REINZ, QVNZ
Figure 5. Arrivals to New Zealand Migration flows to and from New Zealand are one of
35,000 the major drivers of housing market cycles. The
30,000 early-1970s, mid-1990s, mid-2000s and most recent
25,000
house price booms have coincided with large net
migration inflows.
20,000
Number
15,000 Arrivals to New Zealand have fallen to zero, reflecting
border closures and the grounding of most
10,000
international flights for the foreseeable future. The
5,000
dearth of tourists will weigh on the outlook for
0 tourism and GDP, and see more properties flood the
1-Jan
8-Jan
1-Apr
8-Apr
15-Jan
22-Jan
29-Jan
15-Apr
22-Apr
29-Apr
4-Mar
11-Mar
18-Mar
25-Mar
6-May
13-May
20-May
27-May
5-Feb
12-Feb
19-Feb
26-Feb
rental market, putting downward pressure on rents.
Meanwhile, low rates of migration will result in
Jan Feb Mar Apr May significantly weaker housing demand. All of the
2019 - A 2020 - A above will contribute to lower house prices from
Source: Statistics NZ here.
Figure 6. Residential building consents Residential building consents fell 21% m/m in March,
4,000 with lockdown beginning at the end of the month.
Apartment consents fell 24% while houses fell 20%.
3,500
This is the largest fall since October 2008. More
3,000 weakness is set to come in the April data, with
Monthly number
consenting and building activity on pause during the
2,500
lockdown. An initial rebound is expected to follow
2,000 thereafter.
1,500 The previous backlog of consents will provide support
for building activity as construction gets back to
1,000
work, but some projects may be cancelled. Beyond
500
that, the outlook for softer demand is expected to
96 98 00 02 04 06 08 10 12 14 16 18 20 weigh on consents, and building activity. This may
Seasonally adjusted Trend expose some profitability and construction challenges
Source: ANZ Research, Statistics NZ in the industry.
ANZ New Zealand Property Focus | May 2020 13Property Market in Pictures
Figure 7. Construction cost inflation Construction cost inflation has softened since 2017,
25 and will likely soften further from here, with demand
weak. Growth in the cost of consented work per
20
square metre – a proxy – has fallen further recently,
15 to be down 2% y/y in March. We may see some
Annual % change
retracement from this dip, with this data extremely
10
volatile (largely due to the different types of
5 dwellings being consented). However, the recent
downward trend is expected to continue for some
0
time, reflecting the weak demand pulse.
-5
As is usual in times of economic strain, we expect
-10 big-ticket items such as house builds to take a
00 02 04 06 08 10 12 14 16 18 20 backseat. The economic downturn and weaker
Consents per sq-m Construction costs CPI housing demand will apply downward pressure on
Source: ANZ Research, Statistics NZ construction costs.
Figure 8. New mortgage lending and housing turnover New residential mortgage lending figures are
5.5 7.0 published by the RBNZ. These are gross (rather than
5.0 6.5 net) flows and can provide leading information on
4.5 6.0 household credit growth.
5.5
4.0 New mortgage lending fell 10% in March, reflecting
$bn (3mth avg)
5.0
3.5 that house sales and settlements slowed enormously
$bn
4.5 as the lockdown came into effect at the end of the
3.0
4.0 month. Looking forward, April will be weak, and then
2.5
3.5 there will be an initial bounce.
2.0 3.0
Beyond that, we expect weak income prospects,
1.5 2.5
downbeat sentiment and caution towards debt (and
1.0 2.0 the outlook generally) to weigh on households’
04 06 08 10 12 14 16 18 20
willingness and ability to purchase houses and new
Housing turnover (LHS) New mortgage lending (RHS)
lending. Meanwhile, we expect banks will be prudent
Source: ANZ Research, RBNZ
in their lending decisions.
Figure 9. New mortgage lending and housing credit Housing credit growth was up 0.4% m/m in March,
2.0 8 with softness in new lending flows weighing.
1.8 Consumer credit fell 2.8% m/m as the lockdown
7
1.6 began. We expect to see further weakness in the
1.4 near term as a result of the lockdown.
$bn sa (3mth avg)
6
$bn sa (3mth avg)
1.2
Beyond that, there are a number of offsetting forces,
1.0 5
with some households and businesses needing to
0.8 increase their reliance on debt to get through the
4
0.6 current difficult economic period, with lower interest
0.4
3
rates easing pressures a little. Meanwhile, others are
0.2 hunkering down, consolidating their financial
0.0 2 positions and putting off purchases. We expect the
06 07 08 09 10 11 12 13 14 15 16 17 18 19 20 latter forces will win the day, with credit growth
Increase in housing credit (LHS) New mortgage lending (RHS) expected to be weak for a time, and a period of
Source: ANZ Research, REINZ, RBNZ deleveraging ahead.
ANZ New Zealand Property Focus | May 2020 14Property Market in Pictures
Figure 10. Investor lending by LVR Lending to investors was down 13% m/m in March
3,000 (seasonally adjusted, ANZ estimate), following a 5%
fall in February. Lending to investors will drop further
2,500
in April, reflecting the stall in sales and settlements.
$m new lending (sa)
2,000 The share of riskier lending remains broadly stable
although there was a small tick up in interest only (for
1,500
all borrowers) in March. The removal of LVR
restrictions will give banks some more flexibility.
1,000
For investors, the share of investor lending at loan-to-
500 value ratios of less than 70% has barely shifted in
recent times and sits at 87%.
0
15 16 17 18 19 20
80%+ LVR 70-80% LVR Sub 70% LVR
Source: ANZ Research, RBNZ
Figure 11. Regional house prices to income One commonly cited measure of housing affordability
10 is the ratio of average house prices to incomes. It is a
9 standard measure used internationally to compare
housing affordability across countries. It isn’t perfect;
8
it does not take into account things like average
7 housing size and quality, interest rates, and financial
liberalisation. Therefore, it is really only a partial gauge
Ratio
6
as some of these factors mean that it is logical for this
5
ratio to have risen over time.
4
Nationally, the ratio has been stable at around 5.7
3 times income since early 2017. Auckland has seen its
2 ratio ease from 9 times in 2016 to an estimated 7.8
93 95 97 99 01 03 05 07 09 11 13 15 17 19 times in Q4 2019. Excluding Auckland, this is sitting at
New Zealand NZ ex Auckland Auckland 5.5 times incomes.
Source: ANZ Research, REINZ, Statistics NZ
Figure 12. Regional mortgage payments to income Another, arguably more comprehensive, measure of
60 housing affordability is to look at it through the lens of
55 debt serviceability, as this also takes into account
50 interest rates, which are an important driver of
45 housing market cycles.
40
% We estimate that for a purchaser of a median-priced
35
home (20% deposit), the average mortgage payment
30 to income nationally was 30% in Q4, having eased a
25 little on the back of lower mortgage rates. In Auckland
20 it was 42%. In the rest of New Zealand it was 29%.
15 Assumes a 25 year mortgage, with 20% deposit and the minimum This may start to ease as interest rates fall further.
interest rate available
10
93 95 97 99 01 03 05 07 09 11 13 15 17 19
New Zealand NZ ex Auckland Auckland
Source: ANZ Research, REINZ, RBNZ, Statistics NZ
ANZ New Zealand Property Focus | May 2020 15Property gauges
The housing market will be affected by the enormous slump underway. Volatility is very likely in coming months,
but a weaker housing demand impulse is expected to become evident, as typically happens in economic downturns.
At this stage, we expect house prices to fall 10-15% this year, with downside risk. Weaker incomes, unemployment
and uncertainty will weigh. Debt servicing will be difficult for some, even though interest rates are low. Banks are
expected to be prudent with new lending, and households cautious about taking on more debt. Regional markets
exposed to tourism will likely be hit hard, and expectations may shift abruptly.
We use ten gauges to assess the state of the property market and look for signs that changes are in the wind.
Affordability. For new entrants into the housing market, we measure affordability using the ratio of house
prices to income (adjusted for interest rates) and mortgage payments as a proportion of income.
Serviceability / indebtedness. For existing homeowners, serviceability relates interest payments to income,
while indebtedness is measured as the level of debt relative to income.
Interest rates. Interest rates affect both the affordability of new houses and the serviceability of debt.
Migration. A key source of demand for housing.
Supply-demand balance. We use dwelling consents issuance to proxy growth in supply. Demand is derived
via the natural growth rate in the population, net migration, and the average household size.
Consents and house sales. These are key gauges of activity in the property market.
Liquidity. We look at growth in private sector credit relative to GDP to assess the availability of credit in
supporting the property market.
Globalisation. We look at relative property price movements between New Zealand, the US, the UK, and
Australia, in recognition of the important role that global factors play in New Zealand’s property cycle.
Housing supply. We look at the supply of housing listed on the market, recorded as the number of months
needed to clear the housing stock. A high figure indicates that buyers have the upper hand.
House prices to rents. We look at median prices to rents as an indicator of relative affordability.
Policy changes. Government and macro-prudential policy can affect the property market landscape.
Direction
Indicator Level Comment
for prices
Affordability constraints are relevant. It’s hard to see people buying
Affordability Unaffordable ↓↓
super-expensive houses when the outlook is bleak.
Serviceability/ Serviceability is fine, but job security isn’t. Debt levels are high,
Jobs in jeopardy ↓↓
indebtedness incomes are expected to be lower, and uncertainty is rife.
Interest rates / The OCR is set to remain at 0.25% for at least 12 months. Funding
Flat ↔/↑
RBNZ costs will matter for mortgage rates too though.
Migration has been moderating. It could increase in the short term,
Migration Peaking ↔/↓ with kiwis coming home, but will likely soften with borders closed.
Supply-demand The balance has shifted to more supply, with short-term rentals
Shifted ↓
balance coming available.
Consents and The market is under pressure, which may see transactions and new
Turn ↓↓
house sales projects dry up, with prices moving lower.
The outlook is uncertain. Delayed capital changes will provide relief,
Liquidity Relief ↔
but funding pressure and credit constraints are still possible.
The global slowdown will weigh on housing markets around the
Global forces Weak ↓↓
world, with sentiment and incomes under pressure.
While the market has been playing catch up, a shift in the demand-
Housing supply Unclear ↔
supply balance could see less need than previously thought.
House prices to Buying remains relatively expensive. Low interest rates are
rents
Too high ↔/↓ suppressing yields, but incomes will be under pressure.
Policy changes have been a headwind. But the Government’s
Policy changes Dampening ↔/↑ COVID-19 response will help cushion the economic blow.
House prices are expected to be under significant downward
On balance Down ↓↓
pressure, eventually recovering when the economy does.
ANZ New Zealand Property Focus | May 2020 16Property gauges
Figure 1: Housing affordability Figure 2: Household debt to disposable income
70 200 16 180
% of disposable income
60 160
Index (1992Q1=100)
160
% of disposable income
12 140
50
120 120
40
% 100
30 8
80 80
20 60
40 4
10 40
0 0 20
92 94 96 98 00 02 04 06 08 10 12 14 16 18 0 0
House price-to-income adjusted for interest rates (RHS) 92 94 96 98 00 02 04 06 08 10 12 14 16 18
Proportion of average weekly household earnings required to Household debt to disposable income (RHS)
service a 25 year mortgage based on 2-year fixed rate and 20%
deposit on a median house (LHS) Interest servicing as % of disposable income (LHS)
Figure 3: New customer average residential mortgage Figure 4: Housing supply-demand balance
rate (Economic overview
Summary policy the key tool to combat this sort of crisis, and aid
the necessary structural adjustment. The guidance for
The outlook is grim, with an unprecedented global
future spending in last week’s Budget was big,
economic slump underway. In New Zealand, we have
although a significant portion is yet to be allocated, so
made great progress containing the spread of
it remains to be seen how effective it will be.
COVID-19 and a lot of activity has been able to
Initiatives like expanding lunches in schools are a
resume with the move to Alert Level 2. But we are still
relatively small but important part of the response,
a long way from normality, and this downturn will take
given that many households will unfortunately be
a long time to recover from. Even as the economy gets
struggling.
underway again, demand will be weak and the
economy will have to reshape structurally, with Government debt levels are set to balloon to pay for
industries like tourism affected in lasting ways. The the response, with an enormous amount of bonds set
Government has unveiled a big Budget with plenty of to be issued. But not all of this is to fund targeted
spending to help shore up the outlook. Likewise, the spending increases. Tax take is set to plummet and
RBNZ is prepared to pull out all the stops and do what welfare payments are set to increase, which will put
it can to support the recovery. We expect that QE will significant pressure on the Government’s books, and
be expanded again at the August MPS. But a large debt will need to increase to fill the gap. Debt guidance
economic hit is unavoidable, and the recovery is has some conservative buffers built in if the outlook
expected to be slow. disappoints – we think they will be needed.
So on the one hand, greater fiscal spending is positive
Our view
for the outlook. But on the other hand, ballooning
Globally, the economic slump that is underway is Government debt levels indicate just how bad the
unprecedented, commensurate with the health crisis economic situation could get, with our forecasts more
the world is facing. New Zealand is in a relatively good pessimistic than both the RBNZ and the Treasury.
position, having made significant progress in curbing
the spread of COVID-19 in New Zealand. This has put Reflecting this subdued outlook, we expect that the
us in a strong position to get the economy going again RBNZ will need to do more for its part to absorb the
with the move to Alert Level 2. However, we won’t be surge in bond issuance, in order keep debt-servicing
returning to “normal”. The road ahead will still be costs low and support the recovery from here. To do
difficult and the recovery slow: this, we expect that QE will be expanded to $90bn at
the August MPS, pushing the yield curve lower and
Confidence has been shattered, with firm cash flow flatter. The Government may need to do more than
lower and unemployment rising sharply. currently indicated too, in order to help support the
The property market will be under downward labour market, which is set to deteriorate significantly.
pressure. The outlook remains extremely uncertain, and there
Some households and firms will have increased are risks in either direction. On the one hand, we
their reliance on debt through this period and will might be able to generate a faster recovery if we can
need to deleverage. Many will be more reluctant to move to Alert Level 1 soon and pave a way forward for
spend. Demand will be weak. trans-Tasman travel. Monetary stimulus could also
pass through more effectively than expected,
Global demand will also be soft, which will weigh particularly if balance sheet consolidation and caution
on export revenue. are less of a drag on spending, investment and the
International travel is likely to be severely limited property market.
for a long time. Tourism and related industries will But on the other hand, significant downside risks
be affected in lasting ways, even if domestic and remain. A rise in case numbers is still a threat
trans-Tasman travel are possible. (although the risk of prolonged lockdown has
The economy will need to undergo a transition, reduced). A larger economic impact could place more
with industries having to reshape and some pressure on property values, credit demand and
needing to reskill. It will be difficult. banks’ balance sheets, risking a credit crunch. And
there is also the possibility that a rise in defaults
We see GDP 8-10% lower this year, and a peak in the globally causes financial market dysfunction globally,
unemployment rate of 11% in Q3, followed by a slow amongst other possibilities.
recovery from there. Inflation is expected to be
modest for many years. We are not out of the woods by any means, and the
RBNZ and Government will remain cognisant of these
The Government is playing its part to help cushion the risks. In that context, doing too much would be far
blow of the crisis and support the recovery, with fiscal better than doing too little.
ANZ New Zealand Property Focus | May 2020 18You can also read