Despegar.com : A start-up in Latin America
←
→
Page content transcription
If your browser does not render page correctly, please read the page content below
The Fuqua School of Business

Despegar.com : A start-up in Latin America

    "I truly believe that the Internet will change the way we work, live, play and learn in ways we are just beginning to explore.”
                                                                                         John Chambers, CEO, Cisco Systems, Inc.

           “…The Internet is a tidal wave. It chang es the rules. It is an incredible opportunity as well an incredible challenge…”
                                                                                                  Bill Gates, CEO, Microsoft Corp.

Although it was one of the warmest and sunniest weeks of the year in Miami, Roberto Souviron, Ernesto
Cadeiras, Martin Ratellino, Federico Fuchs and Christian Vilate spent it inside their downtown office,
working as hard as ever. Even though during the last months of 1999 venture capitalists (VC’s) were
enthusiastically pouring capital into internet start-ups, the Despegar team knew that next week’s business
plan presentation to US institutional investors was going to be tough. On the other hand, raising at least
US$ 8M on time was critical for their e-travel project to succeed.

Despegar.com w anted to become the most important web -based travel agency in Latin America. Less
than three years ago, Expedia had effectively kicked off the e-travel model throughout the US and was
soon followed by Travelocity and a number of similar companies. But none of them seemed to be
interested in replicating their business in the region. However, it wouldn’t take long before somebody
would try it. Roberto and his team were convinced that this was the right time for Latin America. They
believed that Despegar.com was ready to fill that vacuum but they needed to claim the e-travel throne
with speed…Internet speed.

For this purpose, the team was working hard to put together a solid business plan that could address
every possible doubt on the investors’ minds. From previous meetings, they were aware that the VCs’
main concerns focused on three key areas: (1) the risks of the Latin America Region, (2) the reliability of
the penetration and revenue projections, and finally (3) the competition from traditional players and
established on-line travel agencies. All these issues, combined with the fact that Despegar.com wanted to
become one of the first Latin American e-ventures to be financed by US VCs, made the whole project a
real challenge. Nonetheless, Roberto was confident that they could present a strong case for their
initiative if they could present a professional risk assessment of the region/project , a thorough
revenue/cash flow analysis and a smart scenario analysis.

While sitting in the chaotic room filled of binders, reports, laptops and pizza boxes, Roberto, Federico and
Martin recalled their MBA days at Fuqua when, while working on their Marketing and Valuation classes,
the business idea came up.

Nelson Dao, Alexander Streubel, Sergio Morales, Santiago Bellasi and Emilio del Rio prepared this case under the supervision of
Professor Campbell Harvey of The Fuqua School of Business at Duke University as the basis for class discussion rather than to
illustrate either effective or ineffective handling of an administrative situation.
Copyright © 2003 by the Fuqua School of Business. All rights reserved. No part of this publication may be reproduced, stored in
a retrieval system, used in a spreadsheet, or transmitted in any form or by any means - electronic, mechanical, photocopying,
recording, or otherwise - without the permission of the Fuqua School of Business.
Despegar.com : A start-up in Latin America The Fuqua School of Business
The Internet Revolution
Throughout the 80s and the 90s, the world was transformed by the appearance of the PC. The emergence
of the microprocessor allowed “micro computers” to become “personal computers”. Workstations
invaded homes, offices, universities and every single space of our lives. Under the tyranny of Moore’s
Law, the computer power relentlessly seemed to double every 18 months and soon enough Microsoft’s
vision came true: “A computer on every desk and in every home”. However, as the PCs in the workplace
and home multiplied, so did the desire to interconnect them.
In the early 1990s, the federal government, sponsored by Tennessee Senator Al Gore, issued the “High
Performance Computing Act” that set federal policy for creating a “national information infrastructure"
and thus encouraged broader access to an obscure but powerful network that had been only used by
academia and research labs: the Internet. The legislation not only promoted the creation of the first high-
speed network backbone, laying the foundation for further growth, but also opened the Internet to
commercial use and made it accessible to millions of individual users. (Exhibit 1)
As a result, in the late 90s, the “internet promise” was embraced by entire societies and economies.
Business analysts considered the Internet's influence as significant as that of major breakthroughs like the
automobile or electricity. Studies showed that Internet business solutions would result in significant cost
savings, production improvement and business opportunities. The Internet would be the single biggest
contributor to accelerating productivity growth over the next 10 years. Suddenly, words like
“vertical/horizontal portals”, “search engines”, “B2C”, “B2B” started to fill the press pages. A whole new
business arena was started to blast.
In August of 1995, a young and unknown company that had developed a disruptive new type of software
known as Web browser (which enabled users to “surf” the still-nascent World Wide Web) went public in
an unusual IPO managed by CSFB. On August 9, 1995, after a few hours of the market’s opening,
Netscape stock shot from $28 to $75 per share, closing at $58.25 at the end of its first day of trading. This
was an historic moment not only on Wall Street but also in the business community: it was the day that
many consider the Internet Era started. As one executive editor at Fortune magazine said “Nobody
expected what happened with Netscape. It was the first great Internet stock. It was just, 'Whoa! What is
this all about?’
Netscape explosive IPO conveyed to the business & technology sectors three strong messages: (i) from a
technological perspective, the appearance of the Web Browser positioned Internet in everyone’s life
through an easy-to-use and easy-to-install software. Netscape’s invention allowed the web to jump from
the obscure academic arena to the mass consumer market. (ii) From a business perspective, Netscape
triggered the notion that internet-related business plans were extremely seducing, and many people were
willing to invest in such high-growth ventures. (iii) But most importantly, from an individual
perspective, after those first-round investors got a taste for those high returns, more and more investors
became desperate to get their money into Internet companies. More and more VCs started looking for
those “big e-ideas” and more and more entrepreneurs rushed to present their business plans to investors.
Everything connected with the Internet was hot and promised attractive and quick returns (Exhibit 2).
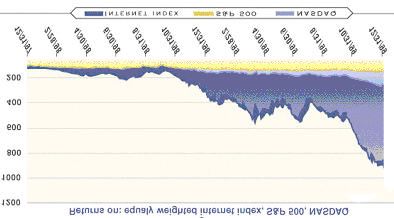
The individual investors, confident in the value of the dotcom propositions, helped boost the prices of
Internet-related stocks. Soon the dotcom stocks became the prima donnas, sending the main US market
indices, especially the tech heavy NASDAQ into the stratosphere from a low of 1541.80 in 10/98 to a high
of near 5000 in late 1999 (Exhibit 3). On the same lines, the number of IPOs shot up to 292 deals in 1999,
from an average of 38 deals during the previous 2 years. Of these, 70% were Internet-related and raised
2Despegar.com : A start-up in Latin America The Fuqua School of Business
more than $33 billion dollars. (Exhibit 4) IPOs commanded a great deal of attention among the media and
investors. Numerous financial websites focused solely on IPOs, and standard financial websites included
detailed analysis of both upcoming and past IPOs. On top, venture capital had also moved dotcoms to
new heights. In the first 3 quarters of 1999, venture capital funds received a record of $36 billion, and
more than 90% of that money was directed toward internet -related businesses (Exhibit 5).
The Travel and Tourism Market
According to the World Travel and Tourism Council, “tourism is the largest generator of wealth and
employment in the world. The tourism industry constitutes 11% of global GDP, supports 200 million jobs
worldwide, 8% of total employment…By 2010, the tourism economy contribution is estimated to grow to
12% of global GDP, and will support 250 million jobs, 9% of total employment”.
The Latin American Market
Latin America is comprised of 23 countries with a total population of approximately 500 million people.
Although divided by geographical and political boundaries, Latin Americans share many cultural
affinities, including common languages and religions, as well as a similar heritage. A majority of Latin
Americans speak Spanish or Portuguese, with only a small portion of the population being proficient in
English.
A substantial portion of the buying power in Latin America is concentrated within 20% of the population.
This group of approximately 100 million people controls an estimated 60% of the overall buying power in
the region and enjoys a standard of living comparable to the populations of Germany and Great Britain.
As a result, the Latin American market represents a highly desirable demographic profile for advertisers
and businesses in general and the travel industry in particular.
Although some of the Latin American countries already enjoyed considerable tourism, the area was only
recently becoming aware of the value of tourism as a contributor to socio-economic health. In countries
such as Argentina, Brazil, Chile and Mexico greater efforts were being made to market and promote
tourism more aggressively, both nationally and internationally. These efforts were being complemented
by investments in the development of lodge and transport infrastructure.
South America: Argentina, Brazil and Chile
This region saw a substantial increase in arrivals and departures. The growth in departures didn’t match
that of arrivals due mainly to persisting economic problems. The devaluation of the real in 1999
dampened the growth in departures in Brazil. In comparison, Argentina and Chile saw a more steady
growth in departures due to strength of their currencies. Looking forward, Argentina was expected to
exhibit the highest growth in departures and tourism expenditures, while Chile’s continuing economic
problems were likely to dampen growth in this market.
Although Brazil’s and Argentina’s travel retail markets had the highest growth rates, Chile’s travel retail
market also experienced good growth, although from a much lower base. Sales growth in the region was
a result of economic stability and increased confidence amongst the affluent population. Business was
becoming much more competitive, with firms competing on price, leading to cost reductions, bargain
holidays and discounted services. The retail travel sector for the three countries was expected to grow by
12.5% from 1999 – 2004, with Argentina growing by 36.7% and Brazil shrinking by 7.3%. Brazil’s travel
3Despegar.com : A start-up in Latin America The Fuqua School of Business
sector was expected to suffer due to the reduction in the commission rate from air tickets sales and by
increased competition for package holidays. Overall, intense price competition was expected to be a
feature of this market.
Mexico
Mexico ranked among the top 10 tourism destinations in the world by number of arrivals. Factors
contributing to continued growth in tourism were the extensive advertising, promotional campaigning,
and investment by the ministry of tourism. Mexico’s membership in NAFTA also significantly impacted
its income from tourism receipts, which increased from $6.2 billion in 1995 to $7.9 billion in 1998. That
year, for the first time in Mexican history, tourism earnings surpassed income from oil exports.
Outgoing tourism expenditure was growing significantly as economic recovery took hold in the country,
and people in the mid- and higher-income levels could afford to travel abroad. Euromonitor forecasted
that tourism expenditures would increase from $4.6 billion in 1999 to $5.3 billion in 2004.
After the peso crisis in 1995, the number of travel retail outlets decreased by almost 50%, leaving only
2578 operators on the market capable of providing the whole range of travel services. Flight booking was
by far the main service provided by travel agencies, followed by package tours and accommodation.
Travel agency sales grew from 284 million in 1995 to 475 million in 1998.
The On-Line Travel Opportunity - eTravel
The advent of the Internet offered traditional travel agents a new tool to market their products. In fact a
study by Morgan Stanley Dean Witter showed that travel scored high on two critical factors for on-line
commerce: consumer comfort with buying on-line and internet business opportunity. The later factor
captured the relevance of the advantages of the internet for a product group (Exhibit 6).
But traditional travel agents were also starting to see increased competition from pure online travel
agents. In fact, travel was one of the largest and most mature online commerce categories, with airplane
tickets being the top-selling consumer category on the internet (Exhibit 7). In 1998, US consumers booked
$2.2 billion of leisure and unmanaged business travel through the Internet, and this number was expected
to grow to $6.5 billion by 1999.
A Jupiter Consumer Survey indicated that 67% of online users researched travel online, and 37%
purchased travel online. Roughly 79% of online travel purchases corresponded to leisure travel and 21%
to unmanaged business travel. Air travel dominated online bookings (80.3% of total value), followed by
Lodging (12.8%) and car rental (6.5%) (Exhibit 8).
Jupiter Communications forecasted that US online travel would reach $28 billion by 2005, roughly 14% of
total leisure and unmanaged business travel. It was also expected that by 2005 air travel would reduce its
dominance to about 60% of online travel product categories, while lodging and car rental would increase
their participation to 23% and 15% respectively.
Although the market for online travel in Europe and Latin America was only a small fraction of the US
market, significant growth was expected between 1999 and 2005. By 2005, the European market was
forecasted to reach approximately 60% of the US market. Travel in Latin American countries showed
similar potential although starting at a later point in time (Exhibit 9).
4Despegar.com : A start-up in Latin America The Fuqua School of Business
Internet and eTravel in Latin America
While Internet use in Latin America was in a relatively early stage of development, it had grown rapidly
in recent years and was expected to significantly outpace worldwide growth of Internet usage over the
next several yearsi. The number of Internet users in the region was expected to increase to 24.3 million in
2003, from 7.7 million in 1999, representing a compounded annual growth rate of approximately 33%ii.
However, Internet penetration would remain very low when compared to Europe or North America, due
to the region’s pronounced inequity in income distribution. Internet penetration was expected to be
highest in Argentina and Chile, whereas Brazil and Mexico were expected to be close to the region’s
average penetration (Exhibit 10).
IDC estimated that in Latin America the volume of goods and services purchased over the Internet
would increase to $8 billion in 2003 from $170 million in 1998, representing a compounded annual
growth rate in excess of 117%. This high growth, both in the number of Internet users and the volume of
online transactions (Exhibit 11), created an unprecedented opportunity for businesses to achieve
substantial profits.
However, on-line ventures had to understand that although overall online consumer confidence would
rise over time, trust would be awarded to individual stores and brands. The heightened anxiety about on-
line payments in Latin America, the lack of a mail-order shopping history, and the prevailing “buyer
beware” mentality in off-line retail would result in a loyalty bonus for the store that won over a particular
consumer to online shopping (Exhibit 12). A high rate of credit card frauds in Latin America further
compounded this effect, making consumers even more cautious.
Of all the products to be transacted over the Web in Latin America, travel products are among the best
shaped to capitalize on the growth of this exploding market. The internet would allow overcoming the
geographical dispersion of consumers. It was also ideally suited for an information intensive buying
process, characterized by high transaction costs for the travel agencies. Additionally, Latin America
offered an opportunity window since the traditional travel retail sector was characterized by a lack of
dominant players, substandard customer service and a lack of transparency.
In 1998 airline tickets sales alone registered revenues of $23 billion. Furthermore, the region expected an
annual growth of air traffic of 5% p.a.iii The increasing complexity and time sensitivity of pricing
structures for travel services had generally outpaced traditional means of delivering accurate and reliable
information to customers at a time when many customers were demanding greater convenience and
flexibility in how, where and when they shopped for travel services. As a result, travel products and
services were the most solicited by Internet users: the most popular type of information sought online by
the typical Latin Americans were Travel related issues (90 percent) while other important categories
followed behindiv .
Latin American patterns of consumption over the net were very similar to the patterns of the U.S.v where
online travel sales increased from 7 percent of all goods and services sold on line in 1997 to 11 percent in
1998. Travel was expected to be the single largest category of products sold over the Internet in the next
century, accounting for 35 percent of all goods and services sold online in 2002vi. Ticket sales were 80% of
the total online travel sales. (Exhibit 13). The same trend should evolve over the next years in Latin
America, where it was expected that the market for online travel bookings would grow to $1.3 billion in
2004, from $130 millions in 1999, experiencing an annual growth rate of 82%p.a.
5Despegar.com : A start-up in Latin America The Fuqua School of Business
Despegar.com - The Vision & Business Model
Roberto Souviron, Martin Ratalino and Ernesto Cadeiras met at The Fuqua School of Business while they
were pursuing their MBA degree. Not only they were close because of their Argentinean nationalities, but
also because of their common interest in the internet revolution that was taking place. In many occasions
they spent many hours discussing the idea of creating an internet -related venture of their own in Latin
America. However, they were not sure about what type of business they should focus on, and which one
would be more viable for the region. On the other hand, the fact of being fully concentrated on their
studies prevented them from further exploring the idea. Although the three of them had already accepted
full time offers, they decided to think more about this internet business in their spare time.
A month later, in June 1999, Roberto Souviron called his two classmates and shared with them his new
vision: founding an online travel site for Latin America. Inspired by Travelocity and Expedia, Roberto
thought that a similar business model was missing in the region and that it could be easily replicated. He
was convinced that the “internet value proposition” was extremely important in an industry
characterized by huge information gaps and a fragmented network of suppliers & consumers. In fact,
some of his initial research show ed that travel related issues were the most popular type of information
sought online by the typical Latin Americans. Moreover, he also had studies that forecasted that Latin
America would have the highest growth rate of Internet penetration in the world.
The team knew that a lot of the internet based business models would not survive in the long-run, but
they realized that Roberto’s idea of the travel industry had a great chance to succeed. Convinced that it
was something promising, they all agreed to start giving shape to this idea. They initiated a development
process through email and weekend meetings. In order to speed up things and add some other skills,
Roberto brought to the team two of his undergraduate classmates: Federico Fuchs and Christian Vilate.
During three months, the team worked hard on the idea. Roberto and Federico focused on refining the
business model and building the financial estimates. Martin, leveraging on his network (mainly Fuqua
and MIT grads), concentrated in developing the alliances with the travel agencies across the region.
Ernesto, building on his previous internet experience, was in charge of studying the sale of advertising
for the site. And finally, Christian was responsible of detecting and contacting potential strategic partners
at the regional level. Additionally, the team decided to start building the technological backbone of the
site and fine tuning the legal aspect of a regional deployment.
By December 1999, the team was able to put together a business plan. They also were able to set up the
stage for most of the business (technology, partnerships and local representatives across the region). The
fundamental missing part was the capital to kick things off. Roberto and Federico called some financial
contacts and successfully lined up some interested US institutional investors that agreed to have a
meeting before the end of the year. In order to consolidate every part of the plan, the team decided to take
some days off from their works and get together in Miami to refine the investor presentation.
The Business Model
During their first meeting they concentrated on defining Despegar’s core strategy. In order to become the
leading online travel agency in Latin America, the company had to become the unique marketplace for
travel services, connecting thousands of consumers and hundreds of airlines, hotels, car rental agencies
and travel packages across several countries. Five strategies were identified to build Despegar: Regional
expansion, local presence, brand awareness, integrated service offering, and new segment introduction.
6Despegar.com : A start-up in Latin America The Fuqua School of Business
(i) Regional Expansion - The regional scope was critical to obtain sufficient scale and thus operational
synergies. A regional brand would create marketing synergies and facilitate the consolidation of regional
alliances. From a technology perspective, development costs would be spread across different markets.
(ii) Local Presence - Latin America is a very diverse set of countries. Local presence would allow a better
understanding of specific needs in each country, such as local regulations, payment methods and ticket
issuance. Additionally , local presence would enhance control of each operation and it would create
awareness opportunities to obtain better tariffs from local suppliers. To support this strategy, each
country would have a similar structure with a country manager, functional leaders and supporting
services.
(iii) Brand Awareness - A strong brand positioning and fast awareness building was critical to generate the
necessary traffic to the web-site. The promotion strategy would be a mix of aggressive presence in mass
media (TV, radio and billboards), strong public relations (press coverage and special events), and
alliances (travel suppliers, internet sites and co-brandings).
(iv) Integrated Service Offering - A “One-stop Shop” site allow ed customers to find all the information and
services they needed to plan and purchase their trip in a single site. This increased the ratio of site visits
to actual sales, and constituted an important competitive advantage over niche travel sites (i.e. airline
sites), allowing Despegar.com to gain preference and retain their customer base. In order to support the
strategy, the site would have high quality content, virtual discussion groups, customer reviews, 24 hours
customer service, and a user-friendly commercial fare searching system.
(v) New Segments - To leverage the “one shop” concept and allow for synergies, the business traveling
segment would also be developed. The corporate segment implied customizing the model to the specific
needs of companies and businesses. Once the consumer segment was consolidated, the corporate
segment would be developed.
The team knew that building Despegar would not be easy. The success depended on selecting the right
people to execute locally, developing adequate incentives to implement on time with the desired quality,
and having the flexibility to quickly adapt to the changing environment of the Latin American countries.
However, they first needed to raise money to start rolling out the plan and have a first mover advantage.
Therefore, it was critical to create a sound and robust business plan that revealed all the strengths of this
opportunity. They knew their plan should touch two important topics: (1) a risk analysis of Latin
America, (2) Competition.
The Latin American Region
For the region as a whole, 1999 would be the worst year in terms of real GDP growth since 1983 (-0,5%).
But the outlook for Latin America in 2000 was cautiously optimistic as conditions throughout the region
were expected to improve. The great diversity among Latin American economies made it difficult to
provide a unified forecast for the region. But, in analyzing the major countries’ individual economies and
the interaction amongst them, it was possible to identify some correlated factors that signaled an
improved outlook for the region in 2000 and supported a forecast of 4% GDP growth.
7Despegar.com : A start-up in Latin America The Fuqua School of Business
Building on policy credibility in 1999 was perhaps the most noteworthy development in the region.
Policymakers throughout Latin America acted quickly to stem the threat of contagion (from the recent
Asian crisis) by implementing sound adjustments to fiscal and monetary policies. In most countries,
budget deficits were trimmed and interest rates were increased to prevent capital outflows. While interest
rates were being relaxed again as the threat of a financial crisis has waned, the effort to bring fiscal
accounts more into balance had remained a cornerstone of many Latin American economic policies. The
inflation outlook for Latin America was positive, with only a few countries expected to register double-
digit inflation rates for 2000.
For 2000, most forecasters predicted that the U.S. economy would slow down somewhat from the 3.5 to 4
percent growth rate in 1999. One risk to the positive Latin outlook lied in the possibility that the U.S.
economy could slow down more than expected or that the slowdown could begin before the predicted
Latin American recoveries were fully under way. Perhaps the most significant risk to the forecast
revolved around the ability of Latin American policymakers to maintain (or, in some cases, establish)
credible economic policies. The last few years had been quite difficult for the region. Economic
stabilization and restructuring had been supposed to bring widespread benefits to Latin American
citizens. Economic and financial difficulties during these years had hampered this goal, but policymakers
had for the most part stuck to the path of economic reform. Still, in spite of these uncertainties, the
outlook for most Latin American countries was that 2000 would be a much better year than 1999 had
been. An important factor for all Latin American countries in achieving a positive performance in 2000
would be continued progress toward developing open market economies. A detailed description of the
major developments in mayor Latin American countries is provided in Exhibits 14 and 15.
Competitive Assessment
“The Internet has not only increased the channel choice, but the number of players as well.”viiRoughly the
competitors for travel bookings could be classified in three main categories: Suppliers, Retail Travel
Agencies, and On-line Travel Agents. However, as the market became more mature, partnerships and
channel combination of these three categories emerged.
Suppliers
Traditionally, suppliers had relied on agencies to sell their travel products at an agreed upon commission
rate. With the ability to access customers in a more cost-efficient way over the Internet, since 1996
suppliers in the U.S. were making aggressive efforts to encourage direct online bookings. Jupiter
Research expected that suppliers would garner 60 percent of total online bookings by 2003, if suppliers
became adept at catering to the needs of their customers and they invest appropriately over the
next several years (Exhibit 16).
In Latin America, the region’s airlines pressed by the need to cut costs and drive more traffic through
their own booking channels, had moved online very quickly, increasing the disintermediation
phenomenon (Exhibit 17). For instance, Mexican airline Aeromexico offered online services since the last
quarter of 1998.
Retail Travel Agencies
Retail travel agencies were the main distribution channel of the industry. They offered consumers travel
services at published retail rates obtained through global distribution services, such as Amadeus, Galileo
8Despegar.com : A start-up in Latin America The Fuqua School of Business
and SABRE. This channel received commissions and incentives on gross bookings. However, in recent
years, retail travel agencies experienced a shrinking of their commissions. Furthermore, increased
competition from travel service suppliers emerged, as these suppliers started to sell directly to
consumers.
On the other hand, traditional retail travel agents possessed in depth knowledge of the Latin American
travel industry. They also had long standing consumer- and supplier-side relationships. On the consumer
side, these travel agencies enjoyed high brand awareness, thousands of customer relationships, and large
customer databases. On the supplier side, the biggest agencies had the volume to negotiate fares and
possessed preferred relationships with suppliers. Moreover, traditional brick and mortar agencies with
reputed brands could initiate their own e-commerce strategy. In fact, some established brick and mortar
retailers like Samborn’s of Mexico and Lojas Americanas of Brazil had used their existing physical
presence and strong brand to build consumer confidence and attract reluctant consumers to make
purchases online.
A survey conducted in the U.S. in December 1999 by Jupiter found that 48 percent of online consumers
preferred to buy at a reliable online store with a reputation, even at a higher cost. Additionally, 47 percent
of consumers surveyed indicated that knowing that an online store was affiliated with an off-line store
was important when purchasing online. Suppliers and on-line travel agencies should consider the entry
of traditional agencies as a serious threat to their current and future market share. On the other hand, no
established player had built a significant internet presence in 1999. Moreover, in the U.S. traditional travel
retail channels lost 1.7% of their channel share only two years after Expedia.com had started operations in
1996. This number was project ed to grow to 9.6% by 2003. (Exhibit 18)
Online Agencies
The online travel services market was new, rapidly evolving and intensely competitive in many regions
of the world. In Latin America, only a few travel providers had started to offer online travel services.
These were mainly ordinary travel agents providing increased service to their current customers. The
only serious competitor in 1999 was Viajo.com. Their site provided extensive travel content as well as
ticket sales, currency conversion capability, language translation, and complete tour ism packages.
Viajo.com operated off-line and online stores to achieve wider distribution. The company aimed at
consolidating its online and off-line presence through aggressive investment in Web technology and
marketing tools.
Regional portals such as Star Media and Terra had struck alliances with agencies and reservation systems
to include travel as part of their core offering, and should be considered potential competitors in a near
future. Some U.S. based online travel agencies, particularly MSN Expedia and Travelocity, launched
sites catering to growing Internet user populations in Canada and the UK in 1998, with other
markets to follow soon.
The Challenges Ahead
The Despegar Team was working hard to have everything ready for the road show. They believed that
their plan was sound and that their estimations were fairly conservative. Most importantly, they were
convinced that Despegar was a perfect strategic fit for the regional industry: Latin America was growing
very fast as a travel market, internet adoption rates were extremely encouraging and the value
propositions of eTravel Portals were widely accepted by users and businesses.
9Despegar.com : A start-up in Latin America The Fuqua School of Business
However, many questions and doubts floated around. They knew that the company needed to raise 8 $M
to accomplish its “simultaneous regional deployment” mission. However, this was a lot of money for a
business plan designed by 5 recently graduated MBAs in a market overwhelmed by good ideas. The team
was aware that if they were to receive less than this amount, it wouldn’t be able to conquer its main
“competitive advantage” of covering the whole region. Furthermore, Roberto heard some rumors about
other people developing similar endeavors for Latin America. In fact, Viajo.com was consolidating its
presence in the strategic Mexican market, which raised some timing concerns.
The Miami office had become their home in the last week and many of them look really tired. However,
the team was doubling its efforts to address all these issues. They were convinced that if they could pull
up together a smart business and financial model (Exhibit 19 & 20), they would get the capital they were
looking for. Grabbing a cold slice of pizza, Roberto returned his eyes to his excel spreadsheet full of
confidence. He wasn’t afraid: his numbers showed an interesting business proposition for investment.
10Despegar.com : A start-up in Latin America The Fuqua School of Business
Exhibit 1 – Internet users Forecast
Exhibit 2 – Stock Market Returns
11Despegar.com : A start-up in Latin America The Fuqua School of Business
Exhibit 3 – Major US Indexes
NASDAQ NYSE
Exhibit 4 - IPOs
12Despegar.com : A start-up in Latin America The Fuqua School of Business
Exhibit 5 – Venture Capital
Exhibit 6 – Attractiveness matrix
Insurance/Financial Services
Computer Software/Hardware
Travel
CONSUMER COMFORT WITH BUYING ONLINE
Books
Magazines
Music/Videos
Flowers/Gifts
Automobiles
Toys
Office Products
Specialized Sporting Goods
Consumer Electronics/Appliances
Apparel
Groceries/Food
General Sporting Goods
Tools/Home Repair
Home Furnishings
Cigars
I NTERNET BUSINESS O PORTUNITY
Source: Morgan Stanley Dean Witter
13Despegar.com : A start-up in Latin America The Fuqua School of Business
Exhibit 7 – On-line spending by category in 1998 – USA
$1,355
ts
ke $1,085
tic
ne
la
d
irp
r
ha
$636
A
ft/
so
s
PC
ift
G
$562
t
en
m
$518
in
rta
s
te
ok
En
Bo
$414
ies
er
$316
oc
Gr
el
ar
pp
$44
A
nt
te
on
0 200 400 600 800 1000 1200 1400 1600
C
US$ MM
Exhibit 8 – Booking Share
14Despegar.com : A start-up in Latin America The Fuqua School of Business
Exhibit 9 – International on-line travel markets
International On-line Travel Projections, 1999-2005
$ 30.0 $ 28.2
$ 25.0
$ 25.0
$ 21.7
$ 20.0 $ 18.3
($in billions)
$ 16.9 US
$ 14.8
$ 15.0 $ 12.8 Europe
$ 11.0
$ 9.6 Latin America
$ 10.0
$ 6.5 $ 6.7
$ 4.2
$ 5.0 $ 2.2
$ 0.8 $ 0.6 $ 1.0 $ 1.4
$ 0.0 $ 0.1 $ 0.2 $ 0.3
$-
1999 2000 2001 2002 2003 2004 2005
Exhibit 10 – Expected internet penetration in Latin America
Expected Internet Penetration in Latin America
12%
10% Argentina
Brazil
8%
Mexico
6% Chile
Colombia
4%
Venezuela
2% Total
0%
1999 2000 2001 2002 2003 2004 2005
15Despegar.com : A start-up in Latin America The Fuqua School of Business
Exhibit 11 – The on-line Travel Market in Latin America
Internet Users (MM) Internet Ticket Sales (MM)
50 $1,500
40 $1,200
30 $900
20 $600
10 $300
- $-
1999 2000 2001 2002 2003 2004
Exhibit 12 – Types of Travel Sites Visited
Exhibit 13 – Tickets Sales in Latin America ($ millions)
$- $100 $200 $300 $400 $500
$69
Brazil $405
$21
Mexico $294
$9
Argentina $145
$13
Chile $144
$9
Colombia $124
$3
Venezuela $85
Peru 1999
$20
$10
2004
Others $89
16Despegar.com : A start-up in Latin America The Fuqua School of Business
Exhibit 14 – Regional Analysis
Argentina:
Economic reform introduced, currency made fully convertible --> foreign portfolio investments by residents possible. "Convertible law" passed
1990
fixing the exchange rate to the dollar, abolishing all exchange and capital controls
"Convertible law" fixing the exchange rate to the dollar, abolishing all exchange and capital controls. Law passed to protect dollar
1991
denominated deposits. "Omnibus decree" signed, ordering the reform of the state, and deregulation of financial markets.
"Brady plan" agreed to restructure the total foreign debt of the country. Import tariff on capital goods abolished. S&P assigns a rating of BB-
1993
to sovereign debt.
Foreign investors withdraw their capitals from Latin America --> devaluation of the currency, banking crisis, increased interest rates, and
1994
Central Bank liquidity assistance to maintain survivor banks. New economic reforms introduced.
Central Bank announced the creation of an emergency fund to strengthen the banking sector. Labor reform introduced to reduce payroll
1996
expenses by firing workers without severance pay. Income tax increase proposed.
1997 S&P raised sovereign debt rating to BB. Asian crisis hits Latin America by the end of the year.
IMF issued a 3-year $2.8bn line of credit to support the country's third economic reform in the decade. Major tax package reduced by 50%
1998
the VAT tax. Corporate tax rate boost to 35%. MERVAL stock index plummeted.
The devaluation of the Brazilian "Real" casts a shadow over the Argentinean equity market. GDP contracted by 3% (half year), and
1999
unemployment rose to 14.5%. President Fernando de la Rua elected, ending President Carlos Menem 10-year Peronist party rule.
Brazil:
Early 1990s The government successfully opened the economy. But, President Fernando Collor de Melo impeached.
President Fernando Henrique Cardoso won the elections. Government approved a reform setting a temporary financial transaction tax.
1992
Restructuration of bank debt.
Financial transaction tax for foreign investments in fixed-income instruments, and in borrowings introduced. New tax on all consumer loans
1994 and installments payments approved. Weaknesses in the public banking system, deficiencies in regulatory and accounting framework, and
inadequate banking supervision led to a banking crisis.
Government signed the "Real plan". Financial transaction tax reduced, new currency ("Real"), new exchange system based on bands. Later,
1995
the "Real" was devalued, import quotas introduced, and tariffs increased.
A 5% market entrance tax enacted, profits and dividends remitted abroad were exempted, but a new tax on direct foreign investments
1996
imposed. Again Congress approved the financial transaction tax.
President Cardoso wan majority in Congress. Decree issued to increase by 29% all state worker's salaries. S&P upgraded Brazil's sovereign
1997
debt to B+. Asian crisis hits Latin America. Austerity package issued to try to recover foreign reserves.\
Introduction of a relaxation of the currency-trading band. Central government budget deficit worsened (6.5% of GDP). Raising interest rate
1998 that caused a 1.5% industrial production decline. Moody's announced a downgrade on sovereign bonds to Caa1. Announcement of a
$10.8bn fiscal deficit-reduction measures. In November, the IMF granted a $41.5bn emergency line.
The Central Bank let the "Real" float freely --> plunge of 41% in the exchange rate. Again a tax on financial transactions and on foreign
1999 investments profits levied. At the end of the year, the stock market rallied because a bill was passed allowing foreigners to invest in local
equity markets.
Chile
In the late 1980s a military dictator ruled the country. A pact was reached and democratic elections were held. President Patrizio Aylwin wan.
1980s and
Extensive economic reform to reorganize the economical system. Independent Central Bank established. Labor and tax laws reformed. Law
early 1990s
allowing foreign capital investments applied. Tariffs reduced to 11%. A program to sell state-owned enterprises started
1992 The reference rate for the Chilean "Peso" changed and pegged to 3 currencies. S&P assigned a BBB rating to sovereign debt.
The second democratic elections and a pro-business Eduardo Frei won. The new government continued to introduce reforms to open the
1993 economy, passing a capital markets reform bill easing restrictions on pension funds investments, improving financial markets regulations,
and developing new financial instruments.
Chile accepted into the MERCOSUR trade agreement. "Peso" revalued because a foreign exchange liberalization package was adopted.
1994
Foreign exchange positions held by banks eliminated.
1995 Exchange controls relaxed on exporters. Pension funds investments liberalized. Moody's and S&P upgraded Chilean credit ratings.
Overnight lending rate cut by 25bp to 7.25%. Rules governing investments abroad amended. Economic slowdown due to Asian crisis.
1997
Declined in exports to Asia. New banking law passed, expanding activities in which banks may engage.
Exports to Asia declined further by 23%. The government raised minimum wage. Unremunerated reserve requirement on capital inflows
1998
eliminated. Political crisis aroused because former President Augusto Pinochet was arrested in Great Britain.
1999 Exchange rate band abolished. Unemployment rate reached a maximum of 11% due to economic slowdown.
Note: Data obtaines from http://www.duke.edu/~charvey/country_risk/chronology
17Despegar.com : A start-up in Latin America The Fuqua School of Business
Exhibit 14 – Regional Analysis (cont.)
Colombia:
Country besieged by the Marxist guerrilla and the drug cartels. Nevertheless, Colombia has been able to maintain one of the most stable
democratic systems in the region. Open-market reforms have been introduced to try to help develop the country.
Reform package that included the elimination of the requirements that all foreign currencies has to be sold to the Central Bank, and the
1990
introduction of the Insider Trading Law.
1991 and The government pushed a set of laws and decreed to let foreigners to have the same rights as domestic investors., to restructure bank debt,
1992 to modify the exchange rate system and free-floating the Colombian "Peso."
1993 and S&P and Moody's assigned ratings of BBB- and Ba1 to Colombian sovereign debt. Because of the increased capital inflows the reserve
1994 requirements on foreign loans was imposed again. Control on interest rates lifted.
1995 Minimum required net foreign exchange position of banks eliminated
Drug cartels' problem escalated. The guerrilla made several attacks in cities. The US government announced a negative assessment of
1996
Colombia's cooperation with anti-drug campaigns.
Tax on fixed-income instruments enacted, and income tax increased to cover Federal budget deficit. Inflation in that year was the lowest in
1997
over 10 years.
Asian crisis caused foreign investors to withdraw from Colombian equity markets. Overnight interest rose to 26%. Government intensified the
battle against drug cartels and guerrillas, consequently the US government upgraded Colombia's rating. In June, Andres Pastrana won the
1998
elections. First measure --> let the "Peso" devaluate at a faster rate. Moody's announced the country's rating under review. The Inter-
American Bank and the World Bank issued a $2bn credit line to defend the "Peso."
An earthquake devastated the nation's coffee-growing region. The Central Bank devalued the "Peso" and abandoned its defense. First
1999
quarter GDP declined 4.8%. IMF approved an aid package of $2.7bn.
Mexico:
Policies set in order to issue market-oriented reforms. Liberalized restrictions on foreign capital participation in investments. "Brady plan"
Late 1980s
agreed. Privatization of state-owned enterprises initiated. Deposits and loan rates loosened.
1990 Moody's announced a Ba2 rating on sovereign debt.
1991 Taxes on dividends eliminated. NAFTA agreement negotiations began.
Government announced a repurchase of $7.2bn of external debt in the secondary market. NAFTA agreed. S&P assigned an AA- rating to
1992
senior "Peso" denominated debt.
Currency reform introduced with the "Nuevo Peso" introduced. Removal of entry barriers for the banking sector passed. Currency crisis at the
end of the year began, and the Central Bank stepped in to support the exchange rate. 2 events marked the beginning of a political uncertainty
1993
period: Chiapas uprising and the assassination of presidential candidate Luis Donaldo Colosio. The market crashed by 10.2%. President
Ernesto Zedillos won the elections. In December, the "Nuevo Peso" is devalued.
The US government issued a $13.5bn bailout loan to help with the "Nuevo Peso" problem. New economic plan imposed. Banking crisis
1995
exploded
New guerrilla attacks in Chiapas. A "pacto" was signed among business owners, government, and labor unions establishing economic prices
1996
and wage targets for 1997.
Economic recovery. The government paid the last part of the bailout loan to the US government. S&P upgraded Mexico's economic outlook
1997
to "positive."
1998 Oil prices reached a 12-year low. Surprise budget surplus.
The Central Bank announced a 13% inflation rate for the year by tightening monetary policy. Consumer price index fell. Interest rates
1999 decreased to 19.75%. Moody's upgraded the country's sovereign debt to one notch below investment grade. The Congress approved a law
lowering the corporate tax rate to 30%.
Venezuela:
1980s and The government commenced to pursue market-oriented reforms. Agreement of the "Brady plan" Privatization of SOE started. Interest rates
early 1990s liberalized. Foreign exchange and price controls abolished. New taxes implemented.
1992 Because of the measures taken and the escalation of political unrest for several months, events culminated in two-failed coup attempts.
1993 VAT tax law passed. New banking law opening the sector enacted. Populist Rafael Caldera won the elections.
Largest banking crisis in the continent, with the government taking control of 60% of the bank assets. Collapse of the "Bolivar." Restrictions
1994
on prices, and exchange rate imposed. Repatriation of capitals prohibited.
1995 The government restored political and economical rights for Venezuelan citizens. Emergency loan from the IMF. Devaluation.
Exchange rate liberalized and substituted with the creation of a foreign exchange band system. Economic reform introduced. Inflation topped
1996
115%
1997 Privatization of bank assets initiated. Gasolines prices increased by 23%. New auctions of oil fields started.
Oil prices dropped to a 12-year low. Agreement with OPEC to cut production by 1.15m barrels per day. 18% drop in foreign reserves. In
1998
december, President Hugo Chavez won the elections (leader of the 1992 coup attempts).
The new government announced a financial transaction tax. The Congress granted the President unprecedent legislative powers. Elections
1999
for a Constituent Assembly charged with the task of drafting a new Constitution. New Constitution approved.
Note: Data obtaines from http://www.duke.edu/~charvey/country_risk/chronology
18Despegar.com : A start-up in Latin America The Fuqua School of Business
Exhibit 15 – Regional Analysis – Relevant Figures
a a
Argentina Brazil
b b b b b b
1995 1996 1997 1998 1999 2000 2001 1995 1996 1997 1998 1999 2000 2001
GDP ($ bn) 258.1 272.1 292.9 298.1 GDP ($ bn) 774.9 801.6 775.4 518.9
GDP Growth (%) -4.0 4.8 8.6 3.9 -3.8 2.4 4.4 GDP Growth (%) 2.8 3.2 -0.1 0.2 0.2 3.1 3.9
Inflation (%) 3.4 0.2 0.5 0.9 -1.9 -0.3 0.2 Inflation (%) 15.8 6.9 3.2 4.9 9.0 7.9 6.3
Population (m) 34.8 35.2 35.7 36.1 Population (m) 157.5 159.6 161.8 163.7
External Debt ($ bn) 93.9 105.2 123.2 138.9 External Debt ($ bn) 179.5 193.7 199.9 200.4
Exch. Rate (avg./$) 1.0 1.0 1.0 1.0 1.0 1.0 1.0 Exch. Rate (avg./$) 1.0 1.1 1.2 1.8 1.9 2.0 1.9
c c
Country Rating 38.8 38.9 41.3 41.8 42.4 Country Rating 34.9 38.3 39.5 38.1 36.5
a: From The Economist Intelligence Unit. Country Report: Fourth Quarter 1999. a: From The Economist Intelligence Unit. Country Report: Fourth Quarter 1999.
b: Estimates, except for Institutional Investor Country Rating b: Estimates, except for Institutional Investor Country Rating
c: Institutional Investor Country Rating. September of each year. c: Institutional Investor Country Rating. September of each year.
a a
Chile Colombia
b b b b b b
1995 1996 1997 1998 1999 2000 2001 1995 1996 1997 1998 1999 2000 2001
GDP ($ bn) 65.2 68.6 75.8 73.0 GDP ($ bn) 80.5 86.4 96.7 94.0
GDP Growth (%) 10.6 7.4 7.6 3.4 -0.7 4.8 5.0 GDP Growth (%) 5.8 2.1 3.1 0.6 -5.0 3.0 2.4
Inflation (%) 8.7 7.0 6.5 5.3 2.5 3.9 3.8 Inflation (%) 20.9 20.2 18.9 20.4 9.7 9.1 8.5
Population (m) 14.2 14.4 14.6 14.8 Population (m) 38.8 39.5 40.2 40.9
External Debt ($ bn) 25.6 27.4 31.4 37.8 External Debt ($ bn) 25.0 28.9 31.8 34.7
Exch. Rate (avg./$) 396.8 412.3 419.3 460.3 549.1 549.4 560.0 Exch. Rate (avg./$) 826.5 912.8 1,036.7 1,141.0 1,986.0 2,115.0 2,259.0
c c
Country Rating 57.4 61.2 63.5 62.0 61.0 Country Rating 46.5 46.7 47.2 46.2 44.1
a: From The Economist Intelligence Unit. Country Report: Fourth Quarter 1999. a: From The Economist Intelligence Unit. Country Report: Fourth Quarter 1999.
b: Estimates, except for Institutional Investor Country Rating b: Estimates, except for Institutional Investor Country Rating
c: Institutional Investor Country Rating. September of each year. c: Institutional Investor Country Rating. September of each year.
a a
Mexico Venezuela
b b b b b b
1995 1996 1997 1998 1999 2000 2001 1995 1996 1997 1998 1999 2000 2001
GDP ($ bn) 286.1 329.5 401.4 415.0 GDP ($ bn) 77.3 70.3 87.5 104.3
GDP Growth (%) -6.2 5.2 6.8 4.8 3.4 3.9 4.4 GDP Growth (%) 4.0 -0.2 5.9 -0.7 -6.4 5.3 4.0
Inflation (%) 35.0 34.4 20.6 15.9 13.1 10.9 10.1 Inflation (%) 59.9 99.9 50.0 35.8 20.4 23.1 21.0
Population (m) 91.2 92.9 94.7 96.5 Population (m) 21.6 22.7 23.2 23.7
External Debt ($ bn) 166.8 157.8 149.7 158.5 External Debt ($ bn) 35.8 35.3 35.4 36.2
Exch. Rate (avg./$) 6.4 7.6 7.9 9.1 10.0 10.9 11.9 Exch. Rate (avg./$) 176.8 417.3 488.6 547.4 638.5 822.0 967.5
c c
Country Rating 41.8 41.6 43.5 45.4 48.2 Country Rating 31.4 32.0 35.4 36.1 33.8
a: From The Economist Intelligence Unit. Country Report: Fourth Quarter 1999. a: From The Economist Intelligence Unit. Country Report: Fourth Quarter 1999.
b: Estimates, except for Institutional Investor Country Rating b: Estimates, except for Institutional Investor Country Rating
c: Institutional Investor Country Rating. September of each year. c: Institutional Investor Country Rating. September of each year.
Exhibit 16 – Online Booking Share
19Despegar.com : A start-up in Latin America The Fuqua School of Business
Exhibit 17 – Disintermediation Outlook
Exhibit 18 – Online vs. Offline Value
20Despegar.com : A start-up in Latin America The Fuqua School of Business
Exhibit 19 - Cash Flows
E-Travel Market
1999 2000 2001 2002 2003 2004 2005
Argentina
Population (k) 36,648 37,124 37,607 38,096 38,591 39,093 39,601
% internet users 2.0% 3.6% 4.9% 6.2% 7.6% 9.3% 11.0%
Internet users (k) 722 1,330 1,838 2,354 2,928 3,631 4,351
% online ticket buyers 0.5% 1.5% 3.8% 8.6% 12.9% 16.8%
Online ticket buyers (k) 7 28 88 253 470 732
Spending per person ($) 720 720 720 720 720 720
Ticket bookings ($ k) 4,788 19,849 63,550 181,823 338,228 526,884
Total Airline Ticket Bookings ($ k) 2,500,000 2,680,000 2,872,960 3,079,813 3,301,560 3,539,272 3,794,100
Online spending as % total 0.2% 0.7% 2.1% 5.5% 9.6% 13.9%
Share of e-market 33.0% 33.0% 33.0% 33.0% 33.0% 33.0%
Untapped market potential 25.0% 0.0% 0.0% 0.0% 0.0% 0.0%
Company gross bookings ($ k) 1,185 6,550 20,971 60,001 111,615 173,872
Brazil
Population (k) 174,825 178,322 181,888 185,526 189,236 193,021 196,881
% internet users 2.2% 2.8% 3.6% 4.2% 4.8% 5.9% 7.0%
Internet users (k) 3,825 4,994 6,521 7,793 9,032 11,336 13,728
% online ticket buyers 1.0% 3.0% 6.9% 11.7% 16.4% 21.3%
Online ticket buyers (k) 50 196 538 1,059 1,862 2,931
Spending per person ($) 650 650 650 650 650 650
Ticket bookings ($ k) 32,461 127,150 349,525 688,622 1,210,039 1,904,978
Total Airline Ticket Bookings ($ k) 6,280,000 6,732,160 7,216,876 7,736,491 8,293,518 8,890,651 9,530,778
Online spending as % total 0.5% 1.8% 4.5% 8.3% 13.6% 20.0%
Share of e-market 20.0% 20.0% 20.0% 20.0% 20.0% 20.0%
Untapped market potential 33.0% 0.0% 0.0% 0.0% 0.0% 0.0%
Company gross bookings ($ k) 4,350 25,430 69,905 137,724 242,008 380,996
Mexico
Population (k) 98,881 100,859 102,876 104,933 107,032 109,173 111,356
% internet users 1.6% 2.2% 3.1% 4.3% 5.1% 6.1% 7.1%
Internet users (k) 1,537 2,205 3,148 4,465 5,479 6,680 7,927
% online ticket buyers 1.0% 2.5% 5.0% 8.5% 12.8% 16.6%
Online ticket buyers (k) 22 79 223 466 852 1,314
Spending per person ($) 650 650 650 650 650 650
Ticket bookings ($ k) 14,329 51,153 145,126 302,715 553,605 854,035
Total Airline Ticket Bookings ($ k) 5,139,000 5,509,008 5,905,657 6,330,864 6,786,686 7,275,327 7,799,151
Online spending as % total 0.3% 0.9% 2.3% 4.5% 7.6% 11.0%
Share of e-market 20.0% 20.0% 20.0% 20.0% 20.0% 20.0%
Untapped market potential 33.0% 0.0% 0.0% 0.0% 0.0% 0.0%
Company gross bookings ($ k) 1,920 10,231 29,025 60,543 110,721 170,807
Chile
Population (k) 15,211 15,515 15,826 16,142 16,465 16,794 17,130
% internet users 2.2% 3.0% 3.9% 5.0% 6.2% 7.4% 8.6%
Internet users (k) 342 473 616 801 1,019 1,241 1,471
% online ticket buyers 0.4% 1.2% 3.0% 6.0% 10.2% 15.3%
Online ticket buyers (k) 2 7 24 61 127 225
Spending per person ($) 1,200 1,200 1,200 1,200 1,200 1,200
Ticket bookings ($ k) 2,268 8,866 28,825 73,361 151,898 270,076
Total Airline Ticket Bookings ($ k) 2,088,000 2,238,336 2,399,496 2,572,260 2,757,463 2,956,000 3,168,832
Online spending as % total 0.1% 0.4% 1.1% 2.7% 5.1% 8.5%
Share of e-market 33.0% 33.0% 33.0% 33.0% 33.0% 33.0%
Untapped market potential 33.0% 0.0% 0.0% 0.0% 0.0% 0.0%
Company gross bookings ($ k) 501 2,926 9,512 24,209 50,126 89,125
Colombia
Population (k) 37,822 38,578 39,350 40,137 40,940 41,759 42,594
% internet users 1.8% 2.3% 2.9% 3.6% 4.4% 5.5% 6.4%
Internet users (k) 664 878 1,155 1,450 1,822 2,276 2,747
% online ticket buyers 0.4% 1.2% 3.0% 6.0% 9.0% 12.6%
Online ticket buyers (k) 4 14 43 109 205 346
Spending per person ($) 650 650 650 650 650 650
Ticket bookings ($ k) 2,283 9,005 28,265 71,050 133,146 224,979
Total Airline Ticket Bookings ($ k) 1,671,000 1,791,312 1,920,286 2,058,547 2,206,762 2,365,649 2,535,976
Online spending as % total 0.1% 0.5% 1.4% 3.2% 5.6% 8.9%
Share of e-market 33.0% 33.0% 33.0% 33.0% 33.0% 33.0%
Untapped market potential 33.0% 0.0% 0.0% 0.0% 0.0% 0.0%
Company gross bookings ($ k) 505 2,972 9,328 23,447 43,938 74,243
Venezuela
Population (k) 24,170 24,653 25,146 25,649 26,162 26,686 27,219
% internet users 1.5% 1.8% 2.3% 2.8% 3.3% 4.1% 5.1%
Internet users (k) 374 445 573 708 854 1,085 1,379
% online ticket buyers 0.4% 1.2% 3.0% 6.0% 9.0% 12.6%
Online ticket buyers (k) 2 7 21 51 98 174
Spending per person ($) 650 650 650 650 650 650
Ticket bookings ($ k) 1,156 4,469 13,796 33,322 63,473 112,940
Total Airline Ticket Bookings ($ k) 975,000 1,045,200 1,120,454 1,201,127 1,287,608 1,380,316 1,479,699
Online spending as % total 0.1% 0.4% 1.1% 2.6% 4.6% 7.6%
Share of e-market 25.0% 25.0% 25.0% 25.0% 25.0% 25.0%
Untapped market potential 50.0% 0.0% 0.0% 0.0% 0.0% 0.0%
Company gross bookings ($ k) 144 1,117 3,449 8,330 15,868 28,235
Total 6 Countries
Population (k) 387,557 395,052 402,693 410,483 418,426 426,525 434,782
% internet users 1.9% 2.6% 3.4% 4.3% 5.1% 6.2% 7.3%
Internet users (k) 7,464 10,324 13,849 17,570 21,134 26,249 31,603
% online ticket buyers 0.8% 2.4% 5.3% 9.5% 13.8% 18.1%
Online ticket buyers (k) 86 330 938 1,999 3,612 5,721
Spending per person ($) 668 668 671 676 678 681
Ticket bookings ($ k) 57,286 220,492 629,087 1,350,892 2,450,388 3,893,893
Total Airline Ticket Bookings ($ k) 18,653,000 19,996,016 21,435,729 22,979,102 24,633,597 26,407,216 28,308,536
Online spending as % total 0.3% 1.0% 2.7% 5.5% 9.3% 13.8%
Share of e-market 22.3% 22.3% 22.6% 23.3% 23.4% 23.6%
Untapped market potential 32.7% 0.0% 0.0% 0.0% 0.0% 0.0%
Company gross bookings ($ k) 8,606 49,226 142,190 314,255 574,277 917,278
21You can also read