Google Health Trends performance reflecting dengue incidence for the Brazilian states - BMC Infectious Diseases
←
→
Page content transcription
If your browser does not render page correctly, please read the page content below
Romero-Alvarez et al. BMC Infectious Diseases            (2020) 20:252
https://doi.org/10.1186/s12879-020-04957-0

 RESEARCH ARTICLE                                                                                                                                   Open Access

Google Health Trends performance
reflecting dengue incidence for the
Brazilian states
Daniel Romero-Alvarez1,2*, Nidhi Parikh2, Dave Osthus3, Kaitlyn Martinez2,4, Nicholas Generous5, Sara del Valle2 and
Carrie A. Manore2

  Abstract
  Background: Dengue fever is a mosquito-borne infection transmitted by Aedes aegypti and mainly found in tropical
  and subtropical regions worldwide. Since its re-introduction in 1986, Brazil has become a hotspot for dengue and has
  experienced yearly epidemics. As a notifiable infectious disease, Brazil uses a passive epidemiological surveillance
  system to collect and report cases; however, dengue burden is underestimated. Thus, Internet data streams may
  complement surveillance activities by providing real-time information in the face of reporting lags.
  Methods: We analyzed 19 terms related to dengue using Google Health Trends (GHT), a free-Internet data-source, and
  compared it with weekly dengue incidence between 2011 to 2016. We correlated GHT data with dengue incidence at
  the national and state-level for Brazil while using the adjusted R squared statistic as primary outcome measure (0/1).
  We used survey data on Internet access and variables from the official census of 2010 to identify where GHT could be
  useful in tracking dengue dynamics. Finally, we used a standardized volatility index on dengue incidence and
  developed models with different variables with the same objective.
  Results: From the 19 terms explored with GHT, only seven were able to consistently track dengue. From the 27 states,
  only 12 reported an adjusted R squared higher than 0.8; these states were distributed mainly in the Northeast, Southeast,
  and South of Brazil. The usefulness of GHT was explained by the logarithm of the number of Internet users in the last 3
  months, the total population per state, and the standardized volatility index.
  Conclusions: The potential contribution of GHT in complementing traditional established surveillance strategies should
  be analyzed in the context of geographical resolutions smaller than countries. For Brazil, GHT implementation should be
  analyzed in a case-by-case basis. State variables including total population, Internet usage in the last 3 months, and the
  standardized volatility index could serve as indicators determining when GHT could complement dengue state level
  surveillance in other countries.
  Keywords: Google health trends, Digital epidemiology, Brazil, Volatility, Epidemiology, Internet data streams, Internet
  penetration

* Correspondence: daromero88@gmail.com; da.romero@ku.edu;
dan_rom@lanl.gov
1
 Department of Ecology & Evolutionary Biology and Biodiversity Institute,
University of Kansas, Lawrence, Kansas, USA
2
 Information Systems and Modeling (A-1), Los Alamos National Laboratory,
Los Alamos, NM, USA
Full list of author information is available at the end of the article

                                        © The Author(s). 2020 Open Access This article is licensed under a Creative Commons Attribution 4.0 International License,
                                        which permits use, sharing, adaptation, distribution and reproduction in any medium or format, as long as you give
                                        appropriate credit to the original author(s) and the source, provide a link to the Creative Commons licence, and indicate if
                                        changes were made. The images or other third party material in this article are included in the article's Creative Commons
                                        licence, unless indicated otherwise in a credit line to the material. If material is not included in the article's Creative Commons
                                        licence and your intended use is not permitted by statutory regulation or exceeds the permitted use, you will need to obtain
                                        permission directly from the copyright holder. To view a copy of this licence, visit http://creativecommons.org/licenses/by/4.0/.
                                        The Creative Commons Public Domain Dedication waiver (http://creativecommons.org/publicdomain/zero/1.0/) applies to the
                                        data made available in this article, unless otherwise stated in a credit line to the data.
Romero-Alvarez et al. BMC Infectious Diseases   (2020) 20:252                                                        Page 2 of 15

Background                                                       available information from Twitter, Google, Wikipedia,
Dengue fever is transmitted by the homonymous                    among others, to follow traces of disease patterns in the
arthropod-borne virus (i.e., arbovirus) from the family Fla-     population [32–34]. Following the pioneering work of
viviridae [1]. There are four dengue virus (DENV) sero-          Eysenbach G. on using web-based search queries to track in-
types with a potential fifth serotype described [2], all of      fluenza [35] and other efforts that used Google-derived data
them distributed in tropical and subtropical regions world-      for influenza in the United States [36, 37] and dengue in dif-
wide [3, 4] with emerging cases in northern latitudes [5, 6].    ferent countries [38, 39], Google developed Google Flu
The pathogen is mainly transmitted by Aedes aegypti and          Trends (GFT) in 2009 and Google Dengue Trends (GDT)
Ae. albopictus mosquitoes [1, 7, 8]. Dengue disease symp-        in 2011, as specific disease surveillance tools for digital epi-
toms range from asymptomatic, mild fever, rash, and joint        demiology. However, a close examination of the predicting
pain (i.e., dengue with and without warning signs), to life      power of these algorithms, specifically GFT, showed signs of
threatening syndromes involving hemorrhagic fever and            over and under prediction and low performance [40–43]
shock (i.e., severe dengue) [1]; severe clinical presentations   cautioning against the broader implementation and applic-
are related with immunological cross-reactivity between          ability of these tools. As a consequence, both GFT and GDT
dengue serotypes [9, 10]. As a viral infection, treatment is     were shut down in 2015 [44]. Nevertheless, two portals
based mainly on support measures during the acute and            remained open to harvest search queries from Google, Goo-
critical phase of the infection [1, 11]. Although there has      gle Trends (GT, https://trends.google.com/trends/?geo=US),
been progress on the development of vaccines, more re-           and Google Health Trends (GHT). GT was released in 2006
search is needed before they are used as an effective public     as a free and publicly available source, whereas GHT, al-
health mechanism for control [1, 12, 13].                        though free, it requires access through an application private
   The burden of dengue fever is high; around half of the        interface (API, https://www.google.org/flutrends/about/).
world population is estimated to be at risk of infection [14]    Many researchers have continued using Google-derived data
and every year, ~ 100 million symptomatic cases are detected     to assess epidemiological patterns and inform epidemio-
[14, 15]. This poses a significant burden to the health sys-     logical models for different pathogens with encouraging or
tems in at least 128 countries worldwide [15] as well as eco-    conflicting results [45–51].
nomic impacts [16] that likely will expand to new regions in        For Brazil, digital tools to quantify dengue reporting have
the future [3, 8, 17]. In Brazil, dengue was re-introduced in    been previously explored, in fact Chan et al. (2011) inspired
1986 in the state of Roraima [18, 19] and quickly spread to      the creation of GDT in the first place, showing a strong
the rest of the country [13]. In 2018, the total number of       correlation with dengue cases in Brazil, among other coun-
cases reported in Brazil was 265,934 [20] and so far 1,439,      tries [38]. Recently, Marques-Toledo et al. (2017) found
471 cases have been reported in 2019 through August [21].        that Twitter was useful in characterizing dengue incidence
   As a notifiable infectious disease, any case of dengue        for different Brazilian cities [52], and the authors further
detected in the Brazilian public health system must be re-       compared their results against GT and Wikipedia query
ported to the corresponding health authorities [22]. Case        logs at the country level finding close agreement among
notification relies on a passive surveillance framework in       several models [52]. Moreover, Yang et al. (2017) recently
which disease reporting builds on patients seeking medical       used an autoregressive model with Google search queries
attention [23]. However, cases are often missed by the offi-     as exogenous variables (ARGO) to predict dengue cases in
cial reporting system because of non-severe presentations,       Brazil and showed good model performance at the country
lack of accessibility to health care infrastructure, misdiag-    level [53]. Neither of these studies examined the ability of
nosis, or even misreporting. Thus, reported case counts are      Google-derived data to characterize dengue incidence at
assumed to be an underestimation of the true disease bur-        the state level, and in fact, only few studies have examined
den [22]. Moreover, availability of health data based on         Google-based algorithms at smaller political administrative
traditional public health surveillance is usually constrained    levels [39, 50, 54]. To address this gap, we explore the abil-
by time, bureaucracy, and staffing, with a lag of 2 weeks for    ity of GHT to characterize weekly dengue cases from 2011
the best systems [24], partial notifications in high burden      to 2016 in Brazil. For this goal, we used 19 dengue-related
settings [25], or even complete lack of reporting due to pol-    search terms for all 27 Brazilian states and quantified how
itical instability as recently evidenced [26]. Timely disease    Internet penetration data, demographic variables, and a
reporting is critical for preparedness and executable real-      standardized volatility index could determine a-priori where
time interventions to curb outbreaks [27].                       GHT might be a reliable tool.
   As a consequence, the exploitation of Internet data as a
source to characterize epidemiological patterns for commu-       Methods
nicable and non-communicable diseases has been promoted          Dengue incidence data
since the mid-90’s under the concept of digital epidemiology     We obtained weekly dengue case counts for Brazil and
[28–31]. These efforts have focused on leveraging freely         all its 27 states from January 1st, 2011 to July 31st 2016.
Romero-Alvarez et al. BMC Infectious Diseases   (2020) 20:252                                                     Page 3 of 15

Data was given by the Brazilian Ministry of Health as a          between models with full vs. reduced number of terms,
weekly aggregated data sheet with cases identified as counts     and between full and individual terms per state using
without any identity information (e.g., names, gender, age,      pair-wise analysis of variance (ANOVA).
etc) [55]. This data encompasses the number of confirmed            Given the heterogeneous Internet access throughout
and suspected dengue cases reported by the official surveil-     Brazil, we analyzed the role that accessibility could play
lance system, which follows specific guidelines of               in explaining our ability to track dengue incidence via
mandatory disease notification [22]. Incidence rates were        GHT. Since 2005, Brazil has monitored the accessibility
calculated as the number of cases per week divided by the        of their population to information and communication
total population per state according to the official Brazilian   technologies [59, 60] through the “Survey for Internet
population census of 2010 [56, 57]; for our analysis we used     Access, Television and Mobile Phone Possession for Per-
incidence instead of case counts to allow comparisons of         sonal Use (Acesso à Internet e a Televisão e Posse de
dengue burden between Brazilian states [57].                     Telefone Móvel Celular para Uso Pessoal, Portuguese)”
                                                                 [61]. The survey is part of the National Household Sam-
Google health trends data                                        ple Survey (Pesquisa Nacional por Amostra de Domicí-
The private API of GHT provides Internet search query            lios (PNAD), Portuguese) conducted by the Brazilian
data starting in 2004. Queries are sampled from the over-        Institute for Geography and Statistics (Instituto Brasi-
all Google dataset in the form of a relative proportion, div-    leiro de Geografia e Estatística (IBGE), Portuguese [61]).
iding the number of searches for a specified term over a         We analyzed data from the 2015 survey, which included
particular time interval (i.e., days, weeks, months, or years)   a sample of 356,904 individuals and 151,189 households
by the total number of term searches in that time, and           distributed across the country and was subsequently ex-
multiplied by a predefined constant [58]. Thus, it differs       trapolated to a total of 177,657 million people and 68,
from GT which provides a ranked score from 0 to 100              037 million households [61, 62]. From all the available
based on the highest frequency of searches in a particular       variables provided in this survey (~ 150), we used: (1)
period of time [58]. We obtained weekly GHT data for the         the total number of people above 10 years using Internet
same timeframe of dengue cases using 19 disease and              in the last 3 months, (2) the number of households that
mosquito vector related terms in Portuguese and English,         have used Internet in the last 3 months, (3) the number
including: “aedes”, “Aedes aegypti”, “aedes egípcio”,            of people with mobile phones, and (4) the number of
“aegypti”, dengue”, “dengue é vírus”, “dengue fever”, “den-      households with computers, as working predictors. In
gue hemorrhagic fever”, “dengue sintomas”, “dengue               addition to these four variables, we used their logarith-
vírus”, “DENV”, “DHF” (i.e., dengue hemorrhagic fever),          mic transformation considering their positive (i.e., right)
“egípcio”, “mosquito”, “mosquito dengue”, “mosquitoes”,          skewed distribution, for a total of eight variables.
“novo vírus da dengue”, “sintomas da dengue”, and “vírus            We explored all the available demographic variables
da dengue”. We downloaded the data on June 26th, 2017            from the 2010 official census provided by the IBGE [56].
and gathered information for the 27 Brazilian states and         The census includes information at the municipality level
for the whole country.                                           for multiple socio-economic factors including education,
                                                                 sanitation, income, etc., with a total of 237 potential pre-
Statistical analysis                                             dictors. We aggregated the information to the state level
We fitted a linear regression model using GHT search             and examined them together with their logarithmic trans-
terms as predictors of dengue incidence at the state level       formations as explained above for a total of 474 variables.
and recorded the adjusted R squared statistic as the pri-        Because they represent information with different magni-
mary outcome measure (0/1). Then, we fitted a multiple           tudes in the form of total counts, percentages, and rates,
linear regression model using all the terms retrieving in-       we normalized all the variables before the analysis. We ex-
formation by state (i.e., all terms model). Due to the po-       amined each variable individually with a pair-wise univari-
tential overlap from conceptually related terms (e.g.,           ate linear regression using the R squared for GHT against
“aedes” and “Aedes aegypti”), we also calculated Pear-           dengue cases as a dependent variable; we selected those
son’s correlation among terms and developed multiple             variables with an adjusted R squared higher than 0.6, and
linear regression models with those with a correlation           performed a Pearson’s correlation among those selected
less than 0.7 (i.e., uncorrelated terms model). Finally, we      to keep those with a score below 0.8. We then performed
fitted models using four terms: “dengue”, “dengue sinto-         a multiple linear regression using the same dependent
mas”, “aedes”, and “mosquito”, which although corre-             variable. We compared the ability of the selected variables
lated, have the potential to capture the full spectrum of        to quantify GHT usefulness in Brazil using a principal
searches considering the information they provide re-            component analysis (PCA) with the 474 predictors and
lated to the disease and the mosquito vector (i.e., four         selecting those components recovering more than 90% of
terms model). We addressed the statistical differences           the variance. The Pearson’s correlation statistic was also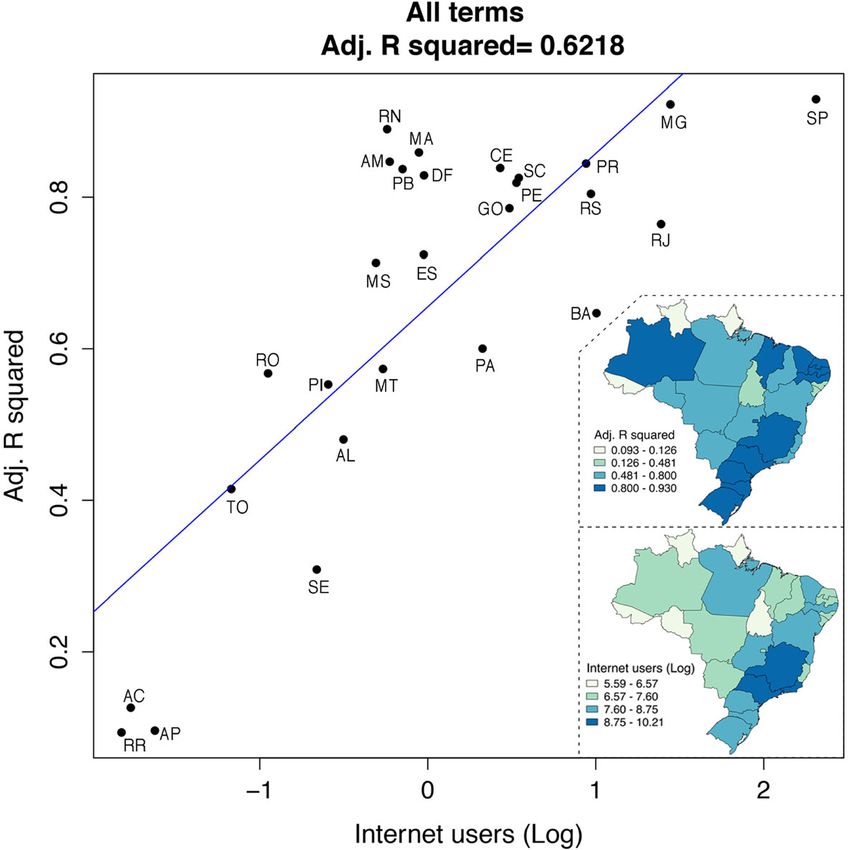
Romero-Alvarez et al. BMC Infectious Diseases   (2020) 20:252                                                     Page 4 of 15

implemented in order to assess the relatedness between          informative in only one case: “dengue hemorrhagic fever”
Internet and demographic variables.                             for São Paulo, and “DENV” for Brazil (Table 1).
  Finally, to determine if variability in the signal of den-       As expected, models developed with all the available
gue incidence influences GHT accuracy, we computed a            terms per state fitted better to the weekly incidence den-
standardized volatility index for the dengue incidence          gue data than models developed with only four terms, un-
data in each state. First, we normalized the dengue inci-       correlated terms, or with any of the individual terms when
dence time series, subtracting the mean and dividing it         measuring the adjusted R squared statistic (Fig. 2, Table 2,
by its standard deviation. For this normalized time             and Additional file 2: adjusted R squared for individual
series, we averaged the absolute difference between each        terms). Individually, the most informative terms among
point in the data for each state—incidence per week in          those conceptually related with the disease included “den-
this case—to obtain a value representing the stability of       gue sintomas”, “dengue”, and “sintomas da dengue”
dengue incidence (i.e., stable vs. unstable). All analyses      (Fig. 2). Among the terms related with the vectors, “mos-
were performed in R programming language [63] using             quito dengue” and “mosquito” were the most informative
standard packages for statistical analysis.                     (Fig. 2). Correlated and uncorrelated terms for each state
                                                                are shown in Additional file 3. We used a pair-wise
Results                                                         ANOVA between models developed with all terms vs.
The Brazilian states with the overall highest yearly median     models developed with reduced combination of terms
number of dengue case counts from 2011 to 2016 are: São         (i.e., four terms and uncorrelated terms), and the individ-
Paulo (829; min = 52; max = 61,944), Goiás (693; min = 29;      ual terms for each state. From 328 comparisons—different
max = 9094), Minas Gerais (687; min = 13; max = 43,424),        number of terms were available for different states (Ta-
and Rio de Janeiro (635; min = 12; max = 18,602), followed      bles 1 and 2)—only in ten comparisons a reduced model
by Ceará (526; min = 5; max = 6754), Bahia (507; min = 12;      was statistically comparable (i.e., not different, F statistic
max = 6654), Espírito Santo (382; min = 11; max = 4279),        with a p > 0.05) to the model with all the terms, namely:
and Pernambuco (326; min = 19; max = 5881; Fig. 1 and           the models based on four and uncorrelated terms and the
Additional file 1: cases/incidences). States such as Rio        model with the word “dengue” for Amapá, models devel-
Grande do Sul and Santa Catarina had a median of 4 and 3        oped with four terms for Distrito Federal, Maranhão, Pará,
cases, with a minimum of 0 cases and a maximum of 324           Rio Grande do Norte, Santa Catarina, and Sergipe, and
and 561 respectively, during the whole study period (Fig. 1     models developed with uncorrelated terms for Roraima.
and Additional file 1). Conversely, when considering the        Thus, for the subsequent analysis we used the adjusted R
weekly dengue incidence, there were two states with the         squared statistic from the models built using all the avail-
overall highest yearly median values: Goiás (1.154x10e-4;       able terms in each state.
min = 4.83x10e-6; max = 1.515x10e-3) and Espírito Santo            As demonstrated previously, GHT fit the aggregated
(1.087x10e-4; min = 3.129x10e-6; max = 1.217x10e-3),            country-level dengue incidence well (All terms adjusted
followed by Rio Grande do Norte (8.996 × 10e-5; min = 0;        R squared = 0.888, Table 2 and Additional file 4: all plots
max = 1.893x10e-3), Tocantins (8.638x10e-5; min =               for Brazil). For Distrito Federal, GHT data was only
3.614x10e-6; max = 4.539x10e-4), Alagoas (8.236x10e-5;          available starting November 24th, 2013; thus, for this
min = 1.602x10e-6; max = 4.637x10e-4), Mato Grosso              case we performed all the analysis starting that date
(7.034x10e-5; min = 6.59x10e-7; max = 7.762x10e-4), Acré        (Additional file 5: all plots for the 27 states). When ana-
(6.271x10e-5; min = 0; max = 2.931x10e-3), and Ceará            lyzing each state separately, GHT was useful in some
(6.223x10e-5; min = 5.915x10e-7; max = 7.991x10e-4; Fig.        states but uninformative in others (Fig. 3). The highest
1); Santa Catarina and Rio Grande do Sul remained the           adjusted R squared was for Minas Gerais (0.923) and
states with the lowest median of weekly dengue incidence        São Paulo (0.930), while the worst fit was for Amapá
in the whole study period (4.801x10e-7 and 3.740x10e-7,         (0.096) and Roraima (0.093; Fig. 3 and Table 2). Overall,
respectively; Fig. 1 and Additional file 1).                    by using all the terms combined, GHT was able to track
  From the 19 GHT terms, seven were useful in recover-          weekly dengue incidences for 12 states with an adjusted
ing information for all the Brazilian states, namely: “ae-      R squared higher than 0.8, namely: Amazonas, Ceará,
des”, “dengue”, “mosquito”, “aegypti”, “Aedes aegypti”,         Distrito Federal, Maranhão, Minas Gerais, Paraiba, Per-
“sintomas da dengue”, and “dengue sintomas”. From the           nambuco, Paraná, Rio Grande do Norte, Rio Grande do
remaining 12 terms, five never provided information and         Sul, Santa Catarina, and São Paulo (Table 2). Consider-
therefore were discarded in further analysis (Table 1). Six     ing an adjusted R squared value of 0.7, we can include
terms tracked dengue for some but not all the states; for       four more states in this list: Espírito Santo, Goiás, Mato
example, the word “mosquitoes” were valuable for Distrito       Grosso do Sul, and Rio de Janeiro, for a total of 16 states
Federal, Minas Gerais, and Paraná, but unimportant for          were GHT might be implemented for tracking dengue
Acré, Mato Grosso, or Santa Catarina. Two terms were            dynamics (Table 2).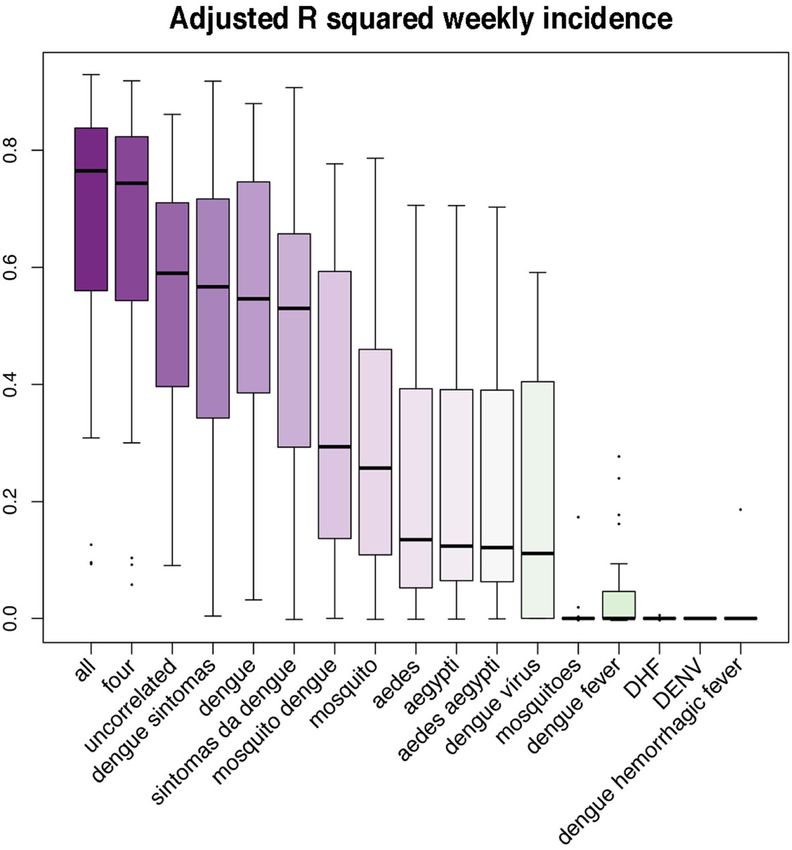
Romero-Alvarez et al. BMC Infectious Diseases      (2020) 20:252                                                                        Page 5 of 15

 Fig. 1 Dengue weekly incidence and case counts at the state level in Brazil aggregated across 2011–2016. States with low (yellow) and high (red)
 weekly incidence (top panel) and case counts (bottom panel) are depicted according to the median for the whole study period from 2011 to
 2016. Boxplots (right panel) represent the variability of each state during the same time period. Maps were created with shape files from https://
 www.naturalearthdata.com/. Labels are the official abbreviations of Brazilian states: AC: Acré, AL: Alagoas, AP: Amapá, AM: Amazonas, BA: Bahia,
 CE: Ceará, DF (arrow): Distrito Federal, ES: Espírito Santo, GO: Goiás, MA: Maranhão, MT: Mato Grosso, MS: Mato Grosso do Sul, MG: Minas Gerais,
 PA: Pará, PB: Paraiba, PR: Paraná, PE: Pernambuco, PI: Piauí, RJ: Rio de Janeiro, RN: Rio Grande do Norte, RS: Rio Grande do Sul, RO: Rondônia, RR:
 Roraima, SC: Santa Catarina, SP: São Paulo, SE: Sergipe, TO: Tocantins

   All the Internet data variables were highly correlated                   with the highest number of Internet users [61], the ad-
with each other (Additional file 6: correlation plot). The                  justed R squared for GHT and dengue incidence was
logarithm of the number of Internet users per state par-                    high (Fig. 4, log scale); on the other hand, states such as
tially explains when GHT will be able to track dengue                       Acré, Amapá, or Roraima with low numbers of Internet
incidence (all terms adjusted R squared = 0.621, Fig. 4).                   users [61] had a lower R squared value (Fig. 4, log scale).
For instance, in the case of São Paulo and Minas Gerais,                    States such as Rio Grande do Norte, Amazonas, Paraiba,
Romero-Alvarez et al. BMC Infectious Diseases             (2020) 20:252                                                                                  Page 6 of 15

Table 1 Availability of Google Health Trends to track dengue trends in Brazil and its states by term
                         Terms                                                           Number of         States
                                                                                         terms
Informative terms        “aedes”, “dengue”, “mosquito”, “aegypti”, “Aedes aegypti”,              7         Brazil and all states
                         “sintomas da dengue”, “dengue sintomas”
Uninformative terms “aedes egípcio”, “egípcio”, “vírus da dengue”, “novo                         5         Brazil and all states
                    vírus da dengue”, “dengue é ‘virus”
Ambiguous terms          “dengue fever”                                                          6         Brazil and BA, CE, ES, GO, MG, PB, PR, RJ, RS, SP (10
                                                                                                           states)
                         “dengue hemorrhagic fever”                                                        SP (1 state)
                         “DENV”                                                                            Brazil
                         “DHF”                                                                             Brazil and BA, GO, MT, MG, PR, PR, PE, RJ, RS, SP (10
                                                                                                           states)
                         “dengue vírus”                                                                    Brazil and AM, BA, CE, DF, ES, GO, MA, MS, MG, PA, PB,
                                                                                                           PR, PE, RJ, RN, RS, RO, SC, SP (19 states)
                         “mosquitoes”                                                                      Brazil and DF, MG, PR, RJ, RS, SP (6 states)
From the 19 terms explored, only seven were able to consistently track dengue incidence from Google Health Trends in Brazil (i.e., national level) and its
individual states. Abbreviations of Brazilian states: AC: Acré, AL: Alagoas, AP: Amapá, AM: Amazonas, BA: Bahia, CE: Ceará, DF: Distrito Federal, ES: Espírito Santo,
GO: Goiás, MA: Maranhão, MT: Mato Grosso, MS: Mato Grosso do Sul, MG: Minas Gerais, PA: Pará, PB: Paraiba, PR: Paraná, PE: Pernambuco, PI: Piauí, RJ: Rio de
Janeiro, RN: Rio Grande do Norte, RS: Rio Grande do Sul, RO: Rondônia, RR: Roraima, SC: Santa Catarina, SP: São Paulo, SE: Sergipe, TO: Tocantins

  Fig. 2 Adjusted R squared according to Google Health Trends search terms. All available terms per state and combined terms (i.e., all, four, and
  uncorrelated terms) were assessed in their ability to track weekly dengue incidences during 2011–2016. Combined terms showed the median
  highest adjusted R squared values (purple)
Romero-Alvarez et al. BMC Infectious Diseases (2020) 20:252 Page 7 of 15
Table 2 Adjusted R squared for multiple linear models using all, uncorrelated, and four available terms
State Adjusted R squared Adjusted R squared – Adjusted R squared –
– All terms model (n) Uncorrelated terms model (n) Four terms model (n = 4)
Acré (AC) 0.126 (7) 0.110 (6) 0.092
Alagoas (AL) 0.481 (8) 0.418 (3) 0.470
Amapá (AP) 0.096 (7) 0.099 (6) 0.103
Amazonas (AM) 0.847 (9) 0.590 (2) 0.821
Bahia (BA) 0.647 (11) 0.603 (3) 0.624
Ceará (CE) 0.839 (10) 0.746 (3) 0.812
Distrito Federal (DF) 0.829 (10) 0.433 (2) 0.830
Espírito Santo (ES) 0.725 (10) 0.537 (3) 0.688
Goiás (GO) 0.785 (11) 0.660 (3) 0.768
Maranhão (MA) 0.859 (9) 0.615 (2) 0.856
Mato Grosso (MT) 0.573 (9) 0.453 (3) 0.559
Mato Grosso do Sul (MS) 0.713 (9) 0.583 (3) 0.694
Minas Gerais (MG) 0.923 (12) 0.718 (4) 0.919
Pará (PA) 0.600 (9) 0.277 (2) 0.596
Paraiba (PB) 0.837 (10) 0.683 (3) 0.832
Paraná (PR) 0.845 (12) 0.741 (4) 0.821
Pernambuco (PE) 0.819 (10) 0.714 (2) 0.808
Piauí (PI) 0.553 (8) 0.377 (3) 0.542
Rio de Janeiro (RJ) 0.765 (12) 0.704 (5) 0.744
Rio Grande do Norte (RN) 0.890 (9) 0.706 (2) 0.891
Rio Grande do Sul (RS) 0.804 (12) 0.724 (4) 0.779
Rondônia (RO) 0.568 (9) 0.415 (4) 0.544
Roraima (RR) 0.093 (7) 0.091 (6) 0.058
Santa Catarina (SC) 0.826 (9) 0.788 (2) 0.825
São Paulo (SP) 0.930 (13) 0.861 (6) 0.919
Sergipe (SE) 0.308 (8) 0.216 (3) 0.300
Tocantins (TO) 0.415 (8) 0.342 (4) 0.401
Brazil 0.888 (14) 0.852 (7) 0.850
Different numbers of terms (n) were available depending on the state (e.g., São Paulo vs. Acré) and were correlated considering a state-by-state basis (e.g., Amapá
vs. Maranhnão; Additional file 3: terms per state). Four terms model was developed with “dengue”, “dengue sintomas”, “aedes”, and “mosquito”. Bold represent
adjusted R squared values above 0.8. Data for Brazil is shown in the last row
and Distrito Federal, had high GHT fit and a low num- and number of Internet users (r = 0.98). Within the PCA
ber of Internet users, and viceversa for Rio de Janeiro framework, the first six PCs recovered 91% of the variance
and Bahia (Fig. 4). and a model developed with these components yielded
From the 474 census demographic predictors, only 49 similar results as the ones obtained using either the loga-
had an adjusted R squared higher than 0.6, all of which rithm of the number of Internet users or the logarithm of
corresponded to variables related to the logarithmic trans- total population per state (Adjusted R squared = 0.654;
formation of the state population (see Additional file 7: 49 Additional file 8: PCA results).
demographic variables). The 49 variables were highly cor- States with the highest standardized volatility index, or
related with each other (minimum r = 0.946); thus, a model high variability in reported dengue incidence, had less
including only the logarithm of the total population per informative adjusted R squared when fitting GHT to in-
state (Fig. 5 top-left panel) was similar to the one using the cidence. States with smoother signals of dengue inci-
logarithm of the total number of Internet users (Fig. 4—ad- dence, and therefore low volatility, had a better fit of
justed R squared = 0.6218—vs. Fig. 5 top-left panel—ad- GHT to incidence, resulting in adjusted R squared values
justed R squared = 0.6143), a consequence of the high above 0.8 (Fig. 4 and Fig. 5). However, even with a stable
correlation between the predictors involved: population dengue incidence signal, GHT was not able to trackRomero-Alvarez et al. BMC Infectious Diseases (2020) 20:252 Page 8 of 15 Fig. 3 Google Health Trends and weekly dengue incidence in four Brazilian states, 2011–2016. Models built with all the terms available per state were useful for tracking dengue incidence during the study period for some (top panel) but not all (bottom panel) Brazilian states. The states that are not well predicted have noisier signals and lack strong seasonal dengue case counts, which may account for poor correlation with Google Health Trends in these regions. Lower access to Internet may also be a factor (Fig. 4) dengue in Acré (Fig. 5 top-right panel). A model using the using the individual terms of the logarithm of total popula- logarithm of the number of Internet users, the volatility tion, the number of Internet users, or the selected PCs index, and their interaction as predictors of GHT had the (Figs. 4, 5, and Additional file 8). Eliminating Acré, the state highest adjusted R squared among all the variables ex- with low volatility but low GHT accuracy (i.e., outlier), we plored (= 0.694, Fig. 5 bottom-right panel). The same saw an improvement in the models using the standardized model with the logarithm of population instead of Internet volatility index plus its interactions with Internet users or users showed a similar adjusted R squared (= 0.688, Fig. 5 total population (All terms vs. volatility index model, ad- bottom-left panel). These models were comparable to those justed R squared = 0.717; all terms vs. Internet users (log) +
Romero-Alvarez et al. BMC Infectious Diseases      (2020) 20:252                                                                        Page 9 of 15

 Fig. 4 Logarithm of Internet users and Google Health Trends adjusted R squared. Maps (right panels) depict the adjusted R squared statistic per
 state when assessing Google Health Trends with their corresponding dengue incidence (linear regression plot). Twelve of 27 states showed
 values above 0.8 (top, dark blue). The logarithm of Internet users shows that the majority of the Brazilian states with high numbers of Internet
 users were concentrated at the southeast of Brazil (bottom, dark blue), but the remaining states show limited Internet penetration (pale green).
 Some states showed low number of Internet users but high GHT data fit (e.g., Amazonas, Maranhão, Paraiba, Distrito Federal). Maps were created
 with shape files from https://www.naturalearthdata.com/. Abbreviations of Brazilian states: AC: Acré, AL: Alagoas, AP: Amapá, AM: Amazonas, BA:
 Bahia, CE: Ceará, DF: Distrito Federal, ES: Espírito Santo, GO: Goiás, MA: Maranhão, MT: Mato Grosso, MS: Mato Grosso do Sul, MG: Minas Gerais, PA:
 Pará, PB: Paraiba, PR: Paraná, PE: Pernambuco, PI: Piauí, RJ: Rio de Janeiro, RN: Rio Grande do Norte, RS: Rio Grande do Sul, RO: Rondônia, RR:
 Roraima, SC: Santa Catarina, SP: São Paulo, SE: Sergipe, TO: Tocantins

standardized volatility index, adjusted R squared = 0.793;                  that quantified GHT usefulness with similar accuracy to
and all terms vs. population + standardized volatility index                that of Internet penetration data (Fig. 5). The standardized
adjusted R squared = 0.809).                                                volatility index in combination with the number of Internet
                                                                            users or the total population provided the highest accuracy
Discussion                                                                  when predicting GHT usefulness (Fig. 5).
Digital surveillance systems have been shown to be useful                      Harvesting epidemiological information from Internet-
for predicting country-wide dengue incidence in several                     data streams remains an active area of research for health
countries [38, 53, 64]. Here, we evaluate the usefulness of                 purposes [31, 46, 49]. Despite its caveats [40], it has the po-
GHT in tracking dengue incidence both at the country and                    tential to improve and complement traditional disease sur-
the state level in Brazil, by evaluating GHT correlation with               veillance methods. In particular, they may be useful in
weekly dengue incidence data over 6 years. We have shown                    timely outbreak detection and in settings where health sur-
that the performance of GHT varies across states (Fig. 3,                   veillance is underdeveloped [31, 65]. However, before im-
Table 2, and additional file 3); however, it is highly corre-               plementation, tools such as GHT should be explored at
lated with dengue incidence (adjusted R squared > 0.8) in                   spatial resolutions smaller than countries [39, 50, 54]. Ours
12 Brazilian states that are geographically dispersed. More-                is one of the few studies addressing this gap showing that
over, we showed that proxies of Internet penetration such                   GHT usefulness will be heavily impacted by the political
as the number of Internet users in the last 3 months only                   boundaries at which we wish to predict [52, 54]. In our
partially explain the usefulness of GHT (Fig. 4). In fact, the              case, GHT had an adjusted R squared score higher than
logarithm of the total population, from among 474 poten-                    0.8 in 12 states, distributed among the five macro-regions
tial demographic predictors, allowed us to build a model                    of Brazil. The majority of states where GHT successfully
Romero-Alvarez et al. BMC Infectious Diseases (2020) 20:252 Page 10 of 15 Fig. 5 Total population and volatility index as predictors of Google Health Trends adjusted R squared. From 474 predictors, variables related with population where the most informative anticipating GHT behavior (top-left). The volatility index was useful detecting GHT accuracy although imprecise in some states such as Acré (top-right). Models considering the standardized volatility index and either the total population (bottom- left) or the number of Internet users (bottom-right) were the most informative anticipating GHT accuracy. Abbreviations of Brazilian states: AC: Acré, AL: Alagoas, AP: Amapá, AM: Amazonas, BA: Bahia, CE: Ceará, DF: Distrito Federal, ES: Espírito Santo, GO: Goiás, MA: Maranhão, MT: Mato Grosso, MS: Mato Grosso do Sul, MG: Minas Gerais, PA: Pará, PB: Paraiba, PR: Paraná, PE: Pernambuco, PI: Piauí, RJ: Rio de Janeiro, RN: Rio Grande do Norte, RS: Rio Grande do Sul, RO: Rondônia, RR: Roraima, SC: Santa Catarina, SP: São Paulo, SE: Sergipe, TO: Tocantins track dengue incidence were located in the Southeast— macro-regions are considered the most economically de- Minas Gerais and São Paulo—, South—Paraná, Santa Cat- veloped of Brazil [66]. The Southeast and the South arina, Rio Grande do Sul—, and Northeast of the coun- macro-regions have, in general, lower dengue incidence try—Ceará, Maranhão, Paraiba, Pernambuco, Rio Grande despite having the majority of cases (Fig. 1), highlighting do Norte—, with the latter concentrating states with higher the importance of normalizing measures to allow disease incidences (Figs. 1 and 4, Table 2). In general, these three burden comparisons [57]. We calculated incidence rates
Romero-Alvarez et al. BMC Infectious Diseases   (2020) 20:252                                                      Page 11 of 15

based on the total population of each state to compare          Brazilian states within our study period (Tables 1 and 2,
dengue burden, showing that high number of dengue cases         Additional file 3), from the other terms, information was
in the Southeast are explained by the presence of high-         recovered only in specific instances (e.g., “dengue virus”,
density populations. Among the Southeast, Rio de Janeiro        “dengue fever” for Bahia but not for Acré; Table 1). Models
state might benefit from integrating GHT surveillance into      developed with all terms were statistically different from
dengue modeling and prediction efforts, considering an ad-      models developed with any of the subset term schemes
justed R squared of 0.765 (Fig. 1 and Fig. 4, Table 2). At      (i.e., uncorrelated terms, four terms, individual terms) with
the Northeast, Ceará and Rio Grande do Norte showed             the exception of ten comparisons. From them, Distrito Fed-
higher dengue incidence (= 6.223x10e-5 and 8.996x10e-5,         eral, Maranhão, Rio Grande do Norte, and Santa Catarina
respectively) with a high GHT fit to incidence data (ad-        were states in which GHT adjusted R squared was higher
justed R squared = 0.839 and 0.890, respectively) followed      than 0.8 (Fig. 4 and Table 2) and the four term model was
by Paraiba and Pernambuco (adjusted R squared = 0.837           not statistically different from the full term model (p > 0.05
and 0.819, respectively; Figs. 1 and 4, Table 2).               in an ANOVA pair-wise comparison). Still, this was not the
   The remaining states where GHT was able to track den-        case for any of the other comparisons (i.e., 318), and more
gue incidence were found in the Central-West—Distrito           importantly, not for any of the terms individually. We rec-
Federal—, and the North—Amazonas—macro-regions,                 ommend gathering GHT data using multiple terms in
with one state each (Fig. 1 and Fig. 4, Table 2). Both          order to track dengue incidence dynamics at the state level
macro-regions represent the fourth and fifth economies of       in Brazil, potentially, this approach would be useful in other
Brazil, respectively [66]. GHT for the Amazonas state           countries. While the approach for determining search
could complement traditional clinical surveillance ap-          terms vary, we posit that they should include both key-
proaches (adjusted R squared = 0.847) considering its large     words (e.g., “dengue”) and conceptual words (e.g., “dengue
area extent, moderate dengue incidence aggregated across        sintomas”) [35] and should be selected according to the of-
all years (= 3.014x10e-5), and geographical location (West-     ficial and common languages of the country studied, Portu-
ern portion of the North macro-region and far from the          guese and English in our case; for instance, in Singapore
developed Brazilian Southeast; Fig. 1 and Additional file 1).   searches using English terms were superior than searches
The North macro-region also included the states of Acré,        using the Malay or Tami local languages [39].
Amapá, Roraima, and Tocantins where GHT showed a                   Intuitively, the ability to determine if Internet data is go-
poor behavior due to the low number of Internet users           ing to be useful should depend on access to information
(Table 2 and Fig. 4). Both the North and Central-West           and communication technologies. In this study, we found
areas include states with high dengue incidence consisting      that the number of Internet users acts as a moderate pre-
of Acré, Goiás, Mato Grosso, and Tocantins (Fig. 1, Add-        dictor for GHT performance (Fig. 4). Similarly, Internet
itional file 1); among them, only Goiás showed a high           penetration has been demonstrated as a dubious variable
GHT fit (adjusted R squared = 0.785); meanwhile the other       for data derived from Google search engines [53, 54], and
states showed adjusted R squared values lower than 0.5          here, we showed that at least for states with both high and
(Table 2 and Fig. 4).                                           low Internet access (e.g., São Paulo, Minas Gerais vs. Acré,
   Among the North and Northeast Brazilian macro-               Roraima, Fig. 4), this variable can be regarded as a good
regions, Maranhão, Pará, and Sergipe have the lower den-        predictor. However, for states such as Amazonas, Distrito
gue incidence (Fig. 1). For these states, only Maranhão         Federal, Paraiba, and Rio Grande do Norte, only relying
showed a good GHT fit (adjusted R squared = 0.859). The         on the number of Internet users would have been an
state of Alagoas showed a moderate dengue incidence ag-         equivocal signal of GHT usefulness; thus, our data support
gregated across all years (=8.236x10e-5; Fig. 1 and Add-        a case-by-case investigation of Internet data.
itional file 1) but poor GHT behavior (adjusted R                  Variables related to the total population per state were
squared = 0.481) despite being surrounded by states with        informative in determining GHT performance (Add-
good GHT performance (e.g., adjusted R squared Pernam-          itional file 7: demographic variables) and these predic-
buco = 0.819 and Bahia = 0.647; Figs. 1 and 4, Table 2).        tors were highly correlated with the total number of
We expected Alagoas to have similar dynamics as the rest        Internet users (r = 0.98). As Internet penetration in-
of its surrounding states due to similar environmental and      creases worldwide [67], the total population per studied
epidemiological trends, all limited by the Atlantic Ocean       political unit, might be a reliable predictor to inform
with a comparable area extent (Fig. 1). However, variabil-      whether or not dengue surveillance based on digital epi-
ity in local surveillance and mosquito control strategies       demiology tools can complement traditional surveillance.
might account for the differences [13, 22].                     However, other demographic predictors could also serve
   We suggest that multiple search terms should be ex-          as indicators of GHT performance. We explored this
plored when using GHT. In our case, only 7 from the initial     possibility using various variable selection methods in-
19 terms, retrieved information consistently in all the         cluding Pearson’s correlation on the full 474 variables, a
Romero-Alvarez et al. BMC Infectious Diseases   (2020) 20:252                                                      Page 12 of 15

stepwise (i.e., forward and backward) multiple linear regres-    patterns in an improved way than the ranked scores
sion, and an elastic net regression with L1 normalization        from GT. In the majority of studies using the latter, a
(i.e., Least Absolute Shrinkage and Selection Operator or        transformation is needed in order to continue with the
Lasso) using leave-one-out cross validation fashion (Add-        analysis [45], this step might add noise to prediction
itional file 9: variable selection). Although a combination of   studies with GT.
five demographic variables allowed us to develop an im-             In the present work, we did not split our data on
proved prediction than total population alone (adjusted R        training-testing datasets, which is a limitation of our ap-
squared = 0.670), how those variables may translate to other     proach. However, instead of dealing with prediction ability
countries is not immediately clear (e.g., percentage of popu-    (i.e., forecasting [39, 49, 53, 54]), we based our evaluation
lation that lives in urban households with garbage collecting    on how GHT reflects dengue incidence in the Brazilian
services; Additional files 9 and 10: other demographic vari-     states and where it could inform and complement trad-
ables). In addition, models developed using multivariate         itional epidemiological surveillance. Further, we did not in-
linear regressions with different variable combinations          clude environmental variables known to alter dengue
never outperformed the model developed using PCA (Add-           dynamics [54]. To implement GHT as complementary
itional files 8 and 9), or those involving population and the    surveillance tool, other sources of uncertainties should be
standardized volatility index (Fig. 5, bottom-left panel).       considered, among them, dengue information-seeking
   The volatility index discussed here might also aid on         behavior might be confounded by the surge of other
addressing when to use GHT predictions for dengue                arbovirus-diseases such as chikungunya or Zika [68], or less
(Fig. 5). In the context of detailed Internet access data, a     well-known pathogens such as Mayaro, Oropouche, or
model considering volatility and Internet users might be         West Nile viruses [69–71], all transmitted by different vec-
a straightforward exploration (Fig. 5). From a practical         tors from the order Diptera, which could trigger local web
perspective, due to the potential lack of fine-resolution        search behavior. This is especially true because of unspe-
data on Internet accessibility in other countries, the total     cific initial clinical presentations for those pathogens,
number of people plus the described standardized vola-           media-induced panic or interest [72], and because health
tility index might be useful indicators of GHT perform-          campaigns are often aimed towards vector control due to
ance. Finally, as has been discussed previously, we also         the lack of specific treatments [11]. Moreover, the GHT
explored if the total number of dengue cases would be a          platform is unstable and could potentially be altered by any
useful predictor to assess GHT performance [31, 54],             update or improvement on Google’s search algorithm itself
but this predictor was less useful than any of the others        [40] hindering replicability of these kind of studies [65].
explored (i.e., GHT for all terms vs. logarithm of total            Although GHT and other digital tools might be also cap-
number of dengue cases, adjusted R squared = 0.274).             turing information from non-infected individuals, searching
   There are some limitations and caveats to our study.          for the disease terms with different goals or induced by
For the Distrito Federal state, GHT data was available           panic related media, it is likely also capturing a portion of
for half of the study period, thus, we tested the GHT            the population that is missing medical care for multiple rea-
against weekly dengue incidence only for the corre-              sons. As has been shown for dengue surveillance in Brazil,
sponding timeframe, which involved ~ 3 years. The state          the number of patients that are hospitalized and recorded
of Distrito Federal corresponds to a small geographical          as true “dengue” cases are more than ~ 50% the number of
region established as the capital of the country in 1960         patients that are actually registered in the official epidemio-
(Fig. 1); we hypothesize that the lack of data was an            logical surveillance system [22], which is a broad phenom-
artifact of Google’ algorithm missing the corresponding          ena described also for other countries [73]. Thus, an
state before November 2013. Although we do not have              agreement between suspected dengue cases and GHT
any specific evidence of this, it is possibly related to what    would indicate at least the presence of an outbreak.
has been called “blue team dynamics” [40], that is,                 Despite critics of models based on Google-derived data,
changes on the search engine can affect how and when             several studies are demonstrating the potential usefulness
GHT gathers data. In the same way, GHT retrieves in-             of this approach for epidemiological research and how it
formation as a relative proportion of search volumes, as         can complement other forecasting models [49, 51, 53, 74].
a consequence GHT data for the Brazilian states will not         Nonetheless, further studies face another problem: the
sum up to the same data at the country level and there-          availability of reliable health data, which is seldom shared
fore GHT data for the whole country should be evalu-             in homogeneous user-friendly formats for representative
ated as an independent unit from its states [58]. This           timeframes [75, 76]. Only by assuring a constant supply of
explains issues such as those presented in Table 1 where,        sound, consistent, and truly open access health reports,
for example, the term “DENV” was only available for the          digital epidemiology could exploit the potential of big data
whole country and not for any particular state. Regard-          considering the massive, but usually inaccessible, informa-
less, GHT’s relative proportion volume represents search         tion from the public health domain [76].
Romero-Alvarez et al. BMC Infectious Diseases           (2020) 20:252                                                                   Page 13 of 15

Conclusions                                                               GHT: Google Health Trends; GT: Google Trends; IBGE: Instituto Brasileiro de
Digital epidemiology approaches based on GHT or other                     Geografia e Estatística (Brazilian Institute for Geography and Statistics,
                                                                          English); PNAD: Pesquisa Nacional por Amostra de Domicílios (National
tools should be explored beyond country level to consider                 Household Sample Survey, English)
its actual ability to inform local public health departments.
In the case of dengue in Brazil, 12 out of 27 states showed               Brazilian states
                                                                          AC: Acré; AL: Alagoas; AP: Amapá; AM: Amazonas; BA: Bahia; CE: Ceará;
an adjusted R squared higher than 0.8, which suggests the                 DF: Distrito Federal; ES: Espírito Santo; GO: Goiás; MA: Maranhão; MT: Mato
potential ability of GHT to complement classical epi-                     Grosso; MS: Mato Grosso do Sul; MG: Minas Gerais; PA: Pará; PB: Paraiba;
demiological surveillance, even though some states had                    PR: Paraná; PE: Pernambuco; PI: Piauí; RJ: Rio de Janeiro; RN: Rio Grande do
                                                                          Norte; RS: Rio Grande do Sul; RO: Rondônia; RR: Roraima; SC: Santa Catarina;
low incidence during the 6-year study period (i.e., 2011–                 SP: São Paulo; SE: Sergipe; TO: Tocantins
2016). Models developed with multiple terms were most
informative than models using reduced sets or individual                  Acknowledgements
                                                                          We would like to thanks the rest of Los Alamos National Laboratory team
terms. Variables such as number of Internet users and                     working actively on epidemiology including Geoffrey Fairchild, Jessica
total population per state are useful in determining where                Conrad, Katherine Kempfert, and Amanda Ziemann.
GHT could complement current surveillance strategies in                   Further, we extend our thanks to Marcelo Henrique de Araujo, who pointed
                                                                          us to the information and communication technology survey in Brazil.
several Brazilian states. Moreover, both variables benefit
from the use of a standardized volatility index for selection             Authors’ contributions
of areas of GHT usefulness. The methods proposed here                     DRA and CM drafted the first version of the manuscript. DRA, NP, and KM
                                                                          collected data and performed analysis. DO developed statistical indices. DRA,
might be applied in other countries to test the ability of
                                                                          NP, and CM designed and coordinated the study. NG, SV, and CM, conceived
GHT to support dengue surveillance. Future studies might                  the study and supervised the project. All authors read, reviewed, and
also explore the ability of GHT to track dengue using de-                 approved the final manuscript.
tailed measures of dengue transmission such as the force
                                                                          Funding
of infection, only confirmed cases, finer political boundar-              This research was partially funded by the Laboratory Directed Research
ies (e.g., GHT data is available to particular cities in the              Development Program at Los Alamos National Laboratory (20190581ECR and
world), or different temporal schemes.                                    20200033DR), and by NIH/NIGMS under grant R01GM130668. Los Alamos
                                                                          National Laboratory is operated by Triad National Security, LLC under
                                                                          Contract No. 89233218CNA000001 with the U.S. Department of Energy. The
                                                                          content is solely the responsibility of the authors and does not necessarily
Supplementary information                                                 represent the official views of the sponsors. The funders had no role in study
Supplementary information accompanies this paper at https://doi.org/10.
                                                                          design, data collection and analysis, decision to publish, or preparation of
1186/s12879-020-04957-0.
                                                                          the manuscript.

 Additional file 1. Total, median, minimum, and maximum numbers of        Availability of data and materials
 dengue cases and incidence from the period 2011–2016.                    Datasets analyzed in the present study are available from the corresponding
 Additional file 2. Adjusted R squared between Google Health Trends       author on reasonable request.
 and weekly incidence of dengue for Brazil and all the 27 states for
 individual search terms.                                                 Ethics approval and consent to participate
                                                                          The Ministry of Public Health from Brazil handed out weekly case counts. No
 Additional file 3. Available, correlated and uncorrelated terms, and
                                                                          information associated with personal information of the cases was disclosed
 adjusted R squared for multiple linear models with their corresponding
                                                                          or used for the development of this study.
 correlation plots.
 Additional file 4. Plots of multiple and simple linear models between    Consent for publication
 Google Health Trends data and weekly dengue incidence for Brazil.        Not applicable.
 Additional file 5. Plots of multiple and simple linear models between
 Google Health Trends data and weekly dengue incidence for each of the    Competing interests
 27 Brazilian states.                                                     The authors declare that they have no competing interests.
 Additional file 6. Correlation plot of the Internet access variables
 selected in the study.                                                   Author details
                                                                          1
                                                                           Department of Ecology & Evolutionary Biology and Biodiversity Institute,
 Additional file 7. Definition of 49 demographic variables showing an     University of Kansas, Lawrence, Kansas, USA. 2Information Systems and
 adjusted R squared higher than 0.6 on a pair-wise linear regression      Modeling (A-1), Los Alamos National Laboratory, Los Alamos, NM, USA.
 models.                                                                  3
                                                                           Statistical Sciences (CCS-6), Los Alamos National Laboratory, Los Alamos,
 Additional file 8. Results of the principal component analysis of 474    NM, USA. 4Applied Math and Statistics, Colorado School of Mines, Golden,
 predictors.                                                              CO, USA. 5National Security & Defense Program Office (GS-NSD), Los Alamos
 Additional file 9. Variables selected by applying different variable     National Laboratory, Los Alamos, NM, USA.
 selection routines and definitions of each of the selected predictors.
                                                                          Received: 11 November 2019 Accepted: 10 March 2020
 Additional file 10. Description of variables selected according to
 different methods.
                                                                          References
                                                                          1. Guzman MG, Gubler DJ, Izquierdo A, Martinez E, Halstead SB. Dengue
                                                                              infection. Nat Rev Dis Prim. 2016;2:16055.
Abbreviations                                                             2. Mustafa MS, Rasotgi V, Jain S, Gupta V. Discovery of fifth serotype of
API: Application private interface; DHF: Dengue hemorrhagic fever;            dengue virus (DENV-5): a new public health dilemma in dengue control.
DENV: Dengue virus; GDT: Google Dengue Trends; GFT: Google Flu Trends;        Med J Armed Forces India. 2015;71:67–70.
Romero-Alvarez et al. BMC Infectious Diseases (2020) 20:252 Page 14 of 15
3. Messina JP, Brady OJ, Golding N, Kraemer MU, Wint GW, Ray SE, et al. The vector-borne diseases, and implications for spillover in the region. Lancet
current and future global distribution and population at risk of dengue. Nat Infect Dis. 2019;19:e149–61.
Microbiol. 2019;4:1508–15. 27. Kluberg SA, Mekaru SR, Mclver DJ, Madoff LC, Crawley AW, Smolinski MS,
4. Messina JP, Brady OJ, Pigott DM, Brownstein JS, Hoen AG, Hay SI. A global et al. Global capacity for emerging infectious disease detection, 1996–2014.
compendium of human dengue virus occurrence. Sci Data. 2014;1:140004. Emerg Infect Dis. 2016;22:10.
5. Tomasello D, Schlagenhauf P. Chikungunya and dengue autochthonous 28. Salathé M. Digital epidemiology: what is it, and where is it going? Life Sci
cases in Europe, 2007–2012. Travel Med Infect Dis. 2013;11:274–84. Soc Policy. 2018;14:1–5.
6. Semenza JC, Suk JE. Vector-borne diseases and climate change: a European 29. Brownstein JS, Freifeld CC, Reis BY, Mandl KD. Surveillance sans Frontières:
perspective. FEMS Microbiol Lett. 2017;365:fnx244. internet-based emerging infectious disease intelligence and the HealthMap
7. Kraemer MU, Sinka ME, Duda KA, Mylne AQ, Shearer FM, Barker CM, et al. project. PLoS Med. 2008;5:e151.
The global distribution of the arbovirus vectors Aedes aegypti and Ae. 30. Hugh-Jones M. Global awareness of disease outbreaks: the experience of
Albopictus. Elife. 2015;4:e08347. ProMED-mail. Public Health Rep. 2001;116:S27–31.
8. Kamal M, Kenawy MA, Rady MH, Khaled AS, Samy AM. Mapping the global 31. Pollett S, Althouse BM, Forshey B, Rutherford GW, Jarman RG. Internet-based
potential distributions of two arboviral vectors Aedes aegypti and Ae. biosurveillance methods for vector-borne diseases: are they novel public
albopictus under changing climate. PLoS One. 2018;13:e0210122. health tools or just novelties? PLoS Negl Trop Dis. 2017;11:e0005871.
9. de Alwis R, Williams KL, Schmid MA, Lai CY, Patel B, Smith SA, et al. Dengue 32. Jordan SE, Hovet SE, Fung ICH, Liang H, Fu K-W, Tse ZTH. Using twitter for public
viruses are enhanced by distinct populations of serotype cross-reactive health surveillance from monitoring and prediction to public response. Data. 2018;4:6.
antibodies in human immune sera. PLoS Pathog. 2014;10:e1004386. 33. Priedhorsky R, Osthus D, Daughton AR, Moran KR, Generous N, Fairchild G, et al.
10. Guzman MG, Alvarez M, Halstead SB. Secondary infection as a risk factor for Measuring global disease with Wikipedia: success, failure, and a research agenda.
dengue hemorrhagic fever/dengue shock syndrome: an historical Proc 2017 ACM Conf Comput Support Coop Work Soc Comput. 2017;1:1812–34.
perspective and role of antibody-dependent enhancement of infection. 34. Milinovich GJ, Williams GM, Clements ACA, Hu W. Internet-based
Arch Virol. 2013;158:1445–59. surveillance systems for monitoring emerging infectious diseases. Lancet
11. World Health Organization (WHO). Special Programme for Research and Infect Dis. 2014;14:160–8.
Training in Tropical Diseases (TDR). Dengue: guidelines for diagnosis, 35. Eysenbach G. Infodemiology and infoveillance: framework for an emerging
treatment, prevention, and control. Geneva: WHO; 2009. https://www.who. set of public health informatics methods to analyze search, communication
int/tdr/publications/training-guideline-publications/dengue-diagnosis- and publication behavior on the internet. J Med Internet Res. 2009;11:e11.
treatment/en/. 36. Ginsberg J, Mohebbi MH, Patel RS, Brammer L, Smolinski MS, Brilliant L.
12. Gil L, Lazo L. Effective dengue vaccines: a pipe dream? Viral Immunol. 2019;32:236–8. Detecting influenza epidemics using search engine query data. Nature.
13. Salles TS, Sá-Guimarães TDE, Alvarenga ESLD, Guimarães-Ribeiro V, Meneses 2009;457:1012–4.
MDF, Castro-Salles PF, et al. History, epidemiology and diagnostics of 37. Polgreen PM, Chen Y, Pennock DM, Nelson FD, Weinstein RA. Using internet
dengue in the American and Brazilian contexts: a review. Parasit Vectors. searches for influenza surveillance. Clin Infect Dis. 2008;47:1443–8.
2018;11:264. 38. Chan EH, Sahai V, Conrad C, Brownstein JS. Using web search query data to
14. Bhatt S, Gething PW, Brady OJ, Messina JP, Farlow AW, Moyes CL, et al. The monitor dengue epidemics: a new model for neglected tropical disease
global distribution and burden of dengue. Nature. 2013;496:504–7. surveillance. PLoS Negl Trop Dis. 2011;5:e1206.
15. Stanaway JD, Shepard DS, Undurraga EA, Halasa YA, Coffeng LE, Brady OJ, 39. Althouse BM, Ng YY, Cummings DAT. Prediction of dengue incidence using
et al. The global burden of dengue: an analysis from the global burden of search query surveillance. PLoS Negl Trop Dis. 2011;5:e1258.
disease study 2013. Lancet Infect Dis. 2016;16:712–23. 40. Lazer D, Kennedy R, King G, Vespignani A. The parable of Google Flu: traps
16. Shepard DS, Coudeville L, Halasa YA, Zambrano B, Dayan GH. Economic in big data analysis. Science. 2014;343:1203–5.
impact of dengue illness in the Americas. Am J Trop Med Hyg. 2011;84:200–7. 41. Cook S, Conrad C, Fowlkes AL, Mohebbi MH. Assessing Google flu trends
17. Campbell LP, Luther C, Moo-Llanes D, Ramsey JM, Danis-Lozano R, Peterson performance in the United States during the 2009 influenza virus a (H1N1)
AT. Climate change influences on global distributions of dengue and pandemic. PLoS One. 2011;6:e23610.
chikungunya virus vectors. Philos Trans R Soc B. 2015;370:20140135. 42. Ortiz JR, Zhou H, Shay DK, Neuzil KM, Fowlkes AL, Goss CH. Monitoring
18. Rodriguez-Barraquer I, Cordeiro MT, Braga C, Souza WV, Marques ET, influenza activity in the United States: a comparison of traditional
Cummings DAT. From re-emergence to hyperendemicity: the natural surveillance systems with Google flu trends. PLoS One. 2011;6:e18687.
history of the dengue epidemic in Brazil. PLoS Negl Trop Dis. 2011;5:e935. 43. Pollett S, Boscardin WJ, Azziz-Baumgartner E, Tinoco YO, Soto G, Romero C,
19. Gubler DJ. Dengue, urbanization and globalization: the unholy trinity of the et al. Evaluating Google flu trends in Latin America: important lessons for
21st century. Trop Med Health. 2011;39:S3–S11. the next phase of digital disease detection. Clin Infect Dis. 2016;64:34–41.
20. Ministério da Saúde, Brasil. Secretaria de Vigilância em Saúde. Boletim 44. Google AI Blog. The next chapter for Flu Trends. https://ai.googleblog.com/2
Epidemiológico 04. Semana Epidemiológica 52 de 2018, vol. 50; 2019. 015/08/the-next-chapter-for-flu-trends.html. Accessed 28 October 2019.
http://portalarquivos2.saude.gov.br/images/pdf/2019/janeiro/28/2019-002. 45. Kapitány-Fövény M, Ferenci T, Sulyok Z, Kegele J, Richter H, Vályi-Nagy I,
pdf. Accessed 28 Oct 2019. et al. Can Google trends data improve forecasting of Lyme disease
21. Ministério da Saúde, Brasil. Secretaria de Vigilância em Saúde. Boletim incidence? Zoonoses Public Health. 2019;66:101–7.
Epidemiológico 22. Semana Epidemiológica 34 de 2019, vol. 50; 2019. 46. Arora VS, Mckee MM, Stuckler D. Google trends: opportunities and limitations
https://portalarquivos2.saude.gov.br/images/pdf/2019/setembro/11/BE- in health and health policy research. Health Policy. 2019;123:338–41.
arbovirose-22.pdf. Accessed 28 Oct 2019. 47. Teng Y, Bi D, Xie G, Jin Y, Huang Y, Lin B, et al. Dynamic forecasting of Zika
22. Coelho GE, Leal PL, Cerroni MDP. Sensitivity of the dengue surveillance epidemics using Google trends. PLoS One. 2017;12:e0165085.
system in Brazil for detecting hospitalized cases. PLoS Negl Trop Dis. 2016; 48. Cervellin G, Comelli I, Lippi G. Is Google trends a reliable tool for digital
10:e0004705. epidemiology? Insights from different clinical settings. J Epidemiol Glob
23. Nsubuga P, White ME, Thacker SB, Anderson MA, Blount SB, Broome CV, et al. Health. 2017;7:185–9.
Chapter 53: Public health surveillance: a tool for targeting and monitoring 49. Rohart F, Milinovich GJ, Avril SMR, Cao KL, Tong S. Disease surveillance
interventions. In: Jamison DT, Breman JG, Measham AR, et al., editors. Disease based on internet-based linear models: an Australian case study of
control priorities in developing countries. 2nd ed. Washington, DC: World Bank previously unmodeled infection diseases. Sci Rep. 2016;6:38522.
and Oxford University Press; 2006. p. 997–1015. 50. Ho HT, Carvajal TM, Bautista JR, Capistrano JDR, Viacrusis KM, Hernandez
24. Moran KR, Fairchild G, Generous N, Hickmann K, Osthus D, Priedhorsky R, LFT, et al. Using Google trends to examine the spatio-temporal incidence
et al. Epidemic forecasting is messier than weather forecasting: the role of and behavioral patterns of dengue disease: a case study in metropolitan
human behavior and internet data streams in epidemic forecast. J Infect Manila, Philippines. Trop Med Infect Dis. 2018;3:118.
Dis. 2016;214:S404–8. 51. Osthus D, Daughton AR, Priedhorsky R. Even a good influenza forecasting
25. Romero-Alvarez D, Peterson AT, Escobar LE. Surveillance fatigue (fatigatio model can benefit from internet-based nowcasts, but those benefits are
vigilantiae) during epidemics. Rev Chil Infectol. 2017;34:289–90. limited. PLoS Comput Biol. 2019;15:e1006599.
26. Grillet ME, Hernández-Villena JV, Llewellyn MS, Paniz-Mondolfi AE, Tami A, 52. Marques-Toledo CDA, Degener CM, Vinhal L, Coelho G, Meira W, Codeço
Vincenti-Gonzalez MF, et al. Venezuela’s humanitarian crisis, resurgence of CT, et al. Dengue prediction by the web: tweets are a useful tool forYou can also read