An experimental scaling law for particle-size segregation in dense granular flows
←
→
Page content transcription
If your browser does not render page correctly, please read the page content below

Downloaded from https://www.cambridge.org/core. IP address: 78.147.81.167, on 20 Apr 2021 at 14:57:36, subject to the Cambridge Core terms of use, available at https://www.cambridge.org/core/terms. https://doi.org/10.1017/jfm.2021.227
J. Fluid Mech. (2021), vol. 916, A55, doi:10.1017/jfm.2021.227
An experimental scaling law for particle-size
segregation in dense granular flows
T. Trewhela1, †, C. Ancey1 and J.M.N.T. Gray2
1 École
Polytechnique Fédérale de Lausanne, Écublens 1015 Lausanne, Switzerland
2 Departmentof Mathematics and Manchester Centre for Nonlinear Dynamics, University of Manchester,
Oxford Road, Manchester M13 9PL, UK
(Received 15 June 2020; revised 31 January 2021; accepted 11 March 2021)
Particles of differing sizes are notoriously prone to segregation in shear driven flows under
the action of gravity. This has important implications in many industrial processes, where
particle-size segregation can lead to flow problems and reduced product quality, as well
as longer product development and start-up times. Particle-size segregation also readily
occurs in many hazardous geophysical mass flows (such as snow avalanches, debris flows
and volcanic pyroclastic flows) and can lead to the formation of destructive bouldery
flow fronts and significantly longer runouts. Although general theories exist to model
particle-size segregation, the detailed functional dependence of the segregation flux on
the shear rate, gravity, pressure, particle concentration, grain size and grain-size ratio
is still not known. This paper describes refractive-index matched oscillatory shear-cell
experiments that shed light on the segregation velocity in the two extreme cases of (i) a
single large intruder rising up through a matrix of smaller grains, and (ii) a single small
intruder percolating down through a matrix of large particles. Despite the sometimes
markedly different time scales for segregation in these two situations, a unifying scaling
law has been found that is able to collapse all the experimental data over a wide range
of shear rates and grain-size ratios in the range [1.17, 4.17]. The resulting functional
form is easily generalizable to intermediate concentrations and can quantitatively capture
laboratory experiments and numerical simulations with a 50 : 50 mix of large and small
grains.
Key words: granular media, particle/fluid flow
† Email address for correspondence: tomas.trewhela@epfl.ch
© The Author(s), 2021. Published by Cambridge University Press. This is an Open Access article,
distributed under the terms of the Creative Commons Attribution licence (http://creativecommons.org/
licenses/by/4.0/), which permits unrestricted re-use, distribution, and reproduction in any medium,
provided the original work is properly cited. 916 A55-1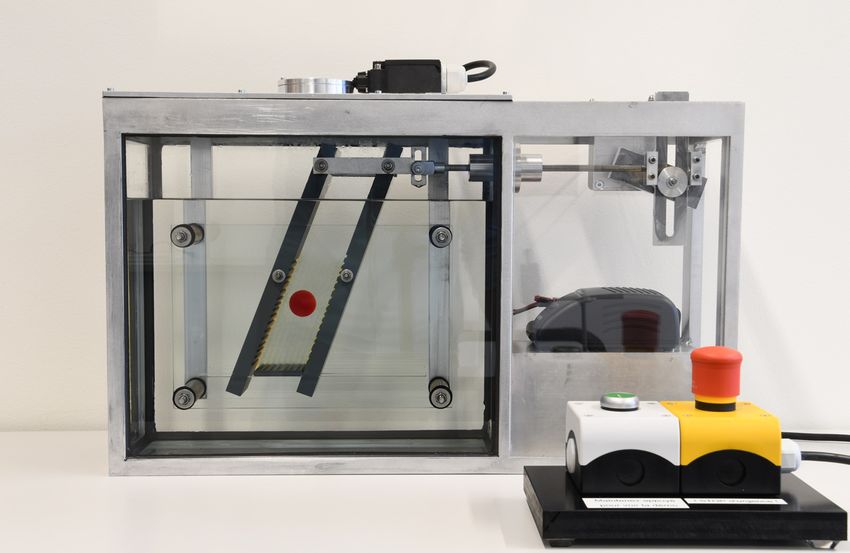
Downloaded from https://www.cambridge.org/core. IP address: 78.147.81.167, on 20 Apr 2021 at 14:57:36, subject to the Cambridge Core terms of use, available at https://www.cambridge.org/core/terms. https://doi.org/10.1017/jfm.2021.227
T. Trewhela, C. Ancey and J.M.N.T. Gray
1. Introduction
Shallow granular free-surface flows (or granular avalanches) are one of the most common
particle transport mechanisms in industrial bulk solids handling processes. They form in
chute flows (Savage & Hutter 1989; Gray, Wieland & Hutter 1999), as well as in thin
fluid-like layers at the free surface of heaps (Williams 1968; Baxter et al. 1998; Fan et al.
2012), silos (Bates 1997; Schulze 2008; Liu, Gonzalez & Wassgren 2019; Isner et al. 2020)
and rotating tumblers (Gray & Hutter 1997; Hill et al. 1999; Khakhar, Orpe & Hajra
2003; Schlick et al. 2015; Gilberg & Steiner 2020). These high density, gravity driven,
shear flows are highly efficient at segregating particles by size. Despite many years of
research, particle-size segregation continues to present considerable practical problems in
many industrial processes (Johanson 1978; Isner et al. 2020). Sometimes the segregation
is useful, such as in the mining industry (Wills 1979). However, in the bulk chemical,
pharmaceutical, agricultural and food industries it is the single biggest cause of product
non-uniformity (Bates 1997). This can lead to complete product batches having to be
discarded at significant cost. In addition, the evolving local particle-size distribution may
feedback on the rheology of the bulk flow and cause unexpected flow problems (Pouliquen,
Delour & Savage 1997; Pouliquen & Vallance 1999; Baker, Johnson & Gray 2016) that are
still poorly understood. Segregation-induced frictional feedback is also thought to play a
vital part in the formation of bouldery flow fronts (Pierson 1986; Denissen et al. 2019) and
static levees (Iverson & Vallance 2001; Baker et al. 2016; Rocha, Johnson & Gray 2019)
in geophysical mass flows (such as snow avalanches, debris flows and pyroclastic flows),
which can significantly enhance their run out.
In the avalanching region of these industrial and geophysical flows, small grains
percolate towards the base of the shearing layer and large grains rise towards the free
surface. Complex interactions between the shear flow and an underlying static, or slowly
moving region of grains, can lead to the development of amazing patterns in the deposit
(e.g. Williams 1968; Gray & Hutter 1997; Baxter et al. 1998; Hill et al. 1999; Barker
et al. 2021). However, for a steady-state flow on a fixed base, an inversely graded
particle-size distribution develops, with the large particles concentrated at the top of the
flow and the finer grains concentrated near the base. The segregation occurs due to the
combination of two processes; kinetic sieving (Middleton 1970) and squeeze expulsion
(Savage & Lun 1988). Essentially, as the layers of grains shear past one another they
act as random fluctuating sieves, which preferentially allow small particles to percolate
downwards into gaps that open up beneath them (known as kinetic sieving), while all
particles are squeezed upwards with equal probability (known as squeeze expulsion),
which maintains an approximately constant solid volume fraction (GDR-MiDi 2004). This
has been termed gravity driven segregation (Gray 2018) for short, to reflect the fact that
gravity is fundamental to the smaller grains falling into the gaps between the larger grains,
and therefore setting the direction for segregation. The grains also diffuse within the shear
flow, which produces a smoothly varying inversely graded particle-size distribution at
steady state (with the large grains concentrated on top of the fines) rather than being
sharply segregated.
The earliest continuum model for bidisperse particle segregation was developed
by Bridgwater, Foo & Stephens (1985). It consists of a spatially one-dimensional
time-dependent advection–diffusion equation, with a shear-rate-dependent segregation
flux that shuts off when the species concentration reaches zero and one hundred per cent.
The key elements of this theory are still present in more recent multi-dimensional models
that use either a quadratic (e.g. Savage & Lun 1988; Dolgunin & Ukolov 1995; Khakhar
et al. 2003; Gray & Thornton 2005; Gray & Chugunov 2006; Thornton, Gray & Hogg
916 A55-2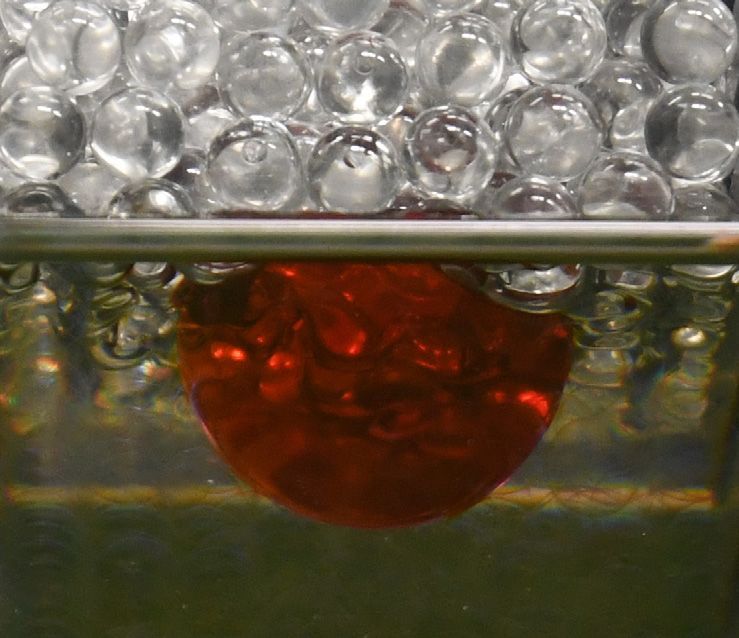
Downloaded from https://www.cambridge.org/core. IP address: 78.147.81.167, on 20 Apr 2021 at 14:57:36, subject to the Cambridge Core terms of use, available at https://www.cambridge.org/core/terms. https://doi.org/10.1017/jfm.2021.227
An experimental scaling law for particle-size segregation
2006; Gray & Ancey 2011; Wiederseiner et al. 2011; Tripathi & Khakhar 2013; Gajjar
& Gray 2014; Tunuguntla, Bokhove & Thornton 2014; Gray & Ancey 2015; Schlick et al.
2015; Xiao et al. 2016; Liu et al. 2019; Gilberg & Steiner 2020) or cubic (e.g. Gajjar & Gray
2014; van der Vaart et al. 2015; Jones et al. 2018) small particle concentration dependence
in the segregation flux.
Wiederseiner et al. (2011) filmed the spatially two-dimensional steady-state segregation
of large black and small white particles through the sidewall of a chute. By using a
calibration curve, they were able to determine the local small particle concentrations
as the grains segregated from a sharply segregated normally graded inflow (with all
the small particles on top of the large grains) to a fully developed inversely graded
steady state. Wiederseiner et al. (2011) showed that by using the measured downslope
velocity, and choosing appropriate constant values for the segregation velocity magnitude
and the diffusivity, it was possible to accurately model the spatial development of the
concentration using Gray & Chugunov’s (2006) theory. Thornton et al. (2012) performed
discrete particle model (DPM) simulations in a periodic box using bidisperse mixtures
of particles with different size ratios. The final steady-state numerical results were then
compared to the exact steady-state solution of Gray & Chugunov (2006). In this solution
the length scale for the transition between high concentrations of large and small particles,
is inversely proportional to the Péclet number for segregation. This is defined as the flow
thickness times the segregation velocity magnitude divided by the diffusivity. Thornton
et al. (2012) showed that the Péclet number increased with increasing grain-size ratio and
peaked at a value close to 8 at a grain-size ratio just below two. However, Wiederseiner
et al. (2011) found experimental values of the Péclet number between 11 and 19 for similar
size ratios. This discrepancy may be due to the coupling with the bulk velocity, which was
an exponential profile in Wiederseiner et al.’s (2011) experiments, but was Bagnold-like
(Silbert et al. 2001) in Thornton et al.’s (2012) simulations, since they are not affected by
sidewall friction.
In order to better visualize the segregation in experiments, van der Vaart et al. (2015)
performed a series of refractive-index matched particle-size segregation experiments in
an oscillating shear box. This has the advantage that the shear rate is independent of
depth, and the flow field is explicitly prescribed rather than spontaneously developing
in a chute flow. The experiment was stopped after each complete oscillation and the
three-dimensional particle-size distribution was determined by scanning a laser sheet
across the cell while taking a series of photographs. From these extremely detailed data,
van der Vaart et al. (2015) showed that there was a fundamental asymmetry to particle-size
segregation. In particular, a single small intruder will percolate down through a matrix of
large grains much faster than a single large intruder will rise up through a matrix of fines.
This suggests that the segregation flux function is not quadratic, but has a more cubic-like
dependence on the small particle concentration (Bridgwater et al. 1985; Gajjar & Gray
2014; van der Vaart et al. 2015; Jones et al. 2018).
The annular shear-cell experiments of Golick & Daniels (2009) also provide important
insights into the functional dependence of the segregation flux. The experiment was driven
by a moving bottom plate, but the top plate was also free to move vertically in response to
the pressure generated during the flow. Their experiments showed that there were subtle
packing effects, as a normally graded initial configuration mixed and then segregated into
a final inversely graded steady state. The ability of the grains to pack tighter together in
a shearing bidisperse mixture caused the top plate to drop from its initial height, and
then recover as the particles segregated again. Intriguingly, Golick & Daniels (2009)
showed that when a weight was placed on the top plate the rate of segregation was
916 A55-3
Downloaded from https://www.cambridge.org/core. IP address: 78.147.81.167, on 20 Apr 2021 at 14:57:36, subject to the Cambridge Core terms of use, available at https://www.cambridge.org/core/terms. https://doi.org/10.1017/jfm.2021.227
T. Trewhela, C. Ancey and J.M.N.T. Gray
dramatically decreased. This suggests that the segregation velocity magnitude is pressure
and/or solids volume fraction dependent. This has been investigated further by Fry et al.
(2019) using DPM simulations of a confined shear flow. Their simulations suggest that the
percolation velocity, and hence the segregation velocity magnitude, is proportional to the
reciprocal of the square root of the pressure. It follows that segregation is suppressed in
Golick & Daniels’ (2009) experiments, when a weight in applied, because the pressure
reduces the segregation rate while having no effect on the diffusion.
A definitive form for the segregation flux function that makes sense of, and hopefully
unifies, all the observations is still lacking. It is clear that it is dependent on the shear
rate (Bridgwater et al. 1985; Savage & Lun 1988; May et al. 2010; Fan et al. 2014), the
pressure (Golick & Daniels 2009; Fry et al. 2019), gravity (Vallance & Savage 2000; Gray
& Thornton 2005; Gray & Chugunov 2006; Fry et al. 2019), the mean particle size (Fry
et al. 2019; Chassagne et al. 2020) and the particle size ratio (Savage & Lun 1988; Gray &
Thornton 2005; Thornton et al. 2012; Fan et al. 2014), as well as that it has a non-quadratic
concentration dependence (Bridgwater et al. 1985; Gajjar & Gray 2014; van der Vaart et al.
2015; Jones et al. 2018). However, there may also be additional functional dependencies
on the friction of the grains (Guillard, Forterre & Pouliquen 2016; Jing, Kwok & Leung
2017) and the evolving local solids volume fraction (Golick & Daniels 2009; Gilberg &
Steiner 2020).
This paper aims to shed further light on the functional form of the segregation
flux by using refractive-index matched shear-cell experiments and dimensional analysis.
Section 2 reviews the governing equations and explains the rationale behind studying the
extreme end states of a single large, and a single small, intruder. Section 3 describes
the experimental shear box and the refractive-index matching technique. Section 4 uses
dimensional analysis and a series of key observations to motivate a simple functional form
for the flux. Sections 5 and 6 compare the theoretical large and small intruder trajectories
to those measured in experiment, for a wide range of shear rates and size ratios, and show
that the data can be collapsed using the same non-dimensional coefficients. Section 7
shows that the theory quantitatively matches van der Vaart et al.’s (2015) shear box
experiments with a 50 : 50 mix of particles using the same non-dimensional coefficients
and the simplest possible function to map between the size-ratio dependence of the large
and small intruders. Section 8 introduces the concept of increased packing efficiency as
the grain-size ratio becomes large and discusses how this is able to moderate the overall
segregation. Section 9 then concludes and makes some interesting observations about the
functional form of the segregation flux that is implied by the theory.
2. Bidisperse particle-size segregation
2.1. Governing equations
Consider a mixture of large and small particles whose pore space is occupied by an
interstitial fluid. Each of the constituents occupies a volume fraction Φ ν ∈ [0, 1] per unit
mixture volume, where the constituent letters ν = l, s and f , refer to large particles, small
particles and fluid, respectively. It is also possible to define volume fractions of large and
small particles per unit granular volume
Φl Φs
φl = , φs = . (2.1a,b)
Φl + Φs Φl + Φs
This is useful, because in many situations of practical interest the solids volume fraction
Φ = Φ l + Φ s does not change very much (Silbert et al. 2001; GDR-MiDi 2004) and can
916 A55-4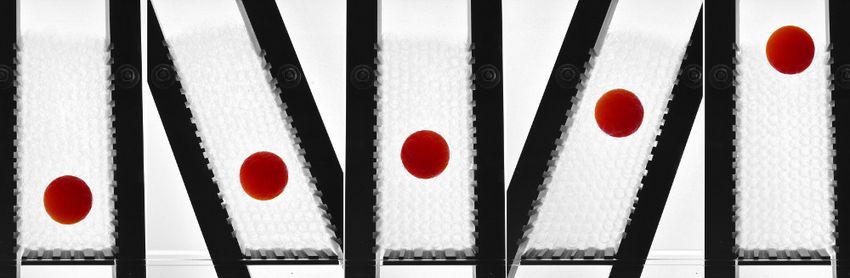
Downloaded from https://www.cambridge.org/core. IP address: 78.147.81.167, on 20 Apr 2021 at 14:57:36, subject to the Cambridge Core terms of use, available at https://www.cambridge.org/core/terms. https://doi.org/10.1017/jfm.2021.227
An experimental scaling law for particle-size segregation
therefore be scaled out of the equations (Thornton et al. 2006). In this situation, the general
form of the bidisperse segregation equations for the volume fractions (concentrations) of
the large and small particles (see e.g. Gray 2018) are
∂φ l l s g
+ ∇ · (φ u) − ∇ · fsl φ φ
l
= ∇ · (Dsl ∇φ l ), (2.2)
∂t |g|
∂φ s s l g
+ ∇ · (φ u) + ∇ · fsl φ φ
s
= ∇ · (Dsl ∇φ s ), (2.3)
∂t |g|
respectively, where u is the bulk granular velocity field, fsl is the segregation velocity
magnitude, g is the gravitational acceleration vector and Dsl is the diffusivity of the large
and small particles. Since by definition the concentration of large and small particles sum
to unity
φ l + φ s = 1, (2.4)
the sum of (2.2) and (2.3) implies that the bulk velocity field is incompressible
∇ · u = 0. (2.5)
This is reasonable leading-order approximation that is made in the incompressible
μ(I)-rheology (GDR-MiDi 2004; Jop, Forterre & Pouliquen 2006; Barker & Gray 2017)
for example (where μ is the friction and I is the inertial number). It should be noted,
however, that in reality there is some compressibility and indeed compressibility is needed
to make the rheology thermodynamically consistent (Goddard & Lee 2018) and well posed
(Barker et al. 2017; Schaeffer et al. 2019). In this paper, however, the solids volume fraction
is assumed to be equal to a constant uniform value of Φ = 0.6.
2.2. Segregation fluxes and velocities
In (2.2) and (2.3) the large and small particle segregation fluxes are
g
F l = −fsl φ l φ s , (2.6)
|g|
g
F s = +fsl φ s φ l , (2.7)
|g|
respectively. These are aligned with the direction of gravitational acceleration g to reflect
the fact that the downward percolation of small particles due to kinetic sieving is a gravity
driven process. In order to maintain bulk incompressibility there is a net reverse flow of
large particles towards the surface due to squeeze expulsion. In the absence of diffusion
the segregation velocity of the large and small particles relative to the bulk flow are
g
ûl = ul − u = −fsl φ s , (2.8)
|g|
g
ûs = us − u = +fsl φ l , (2.9)
|g|
respectively. The summation constraint (2.4) implies that the segregation fluxes (2.6)–(2.7)
are zero when either of the particle species is in a pure phase. If fsl is independent of φ s
and φ l then (2.4) implies that the large particle segregation flux is quadratic in φ s and is
symmetric about φ s = 1/2. Equation (2.8) shows that the corresponding large particle
segregation velocity is linear in φ s and hence implies that the maximum segregation
916 A55-5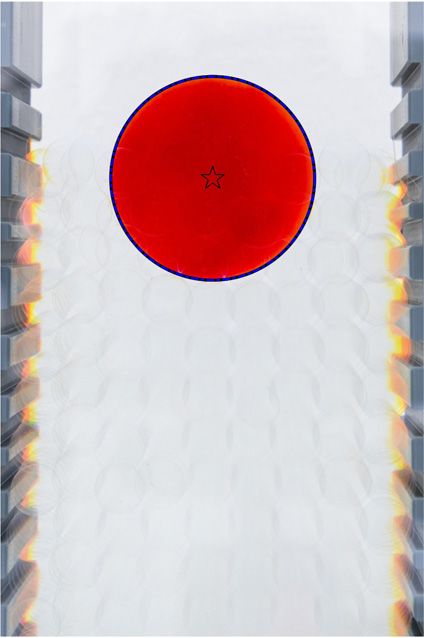
Downloaded from https://www.cambridge.org/core. IP address: 78.147.81.167, on 20 Apr 2021 at 14:57:36, subject to the Cambridge Core terms of use, available at https://www.cambridge.org/core/terms. https://doi.org/10.1017/jfm.2021.227
T. Trewhela, C. Ancey and J.M.N.T. Gray
(a) (b) 1.0
0.25 Large grains
0.5
ŵ l
0.20
0
0.15
fsl φ sφl
–0.5
0.10
ŵ s –1.0
Small grains
0.05
χ=1 –1.5
χ=0
0 0.2 0.4 0.6 0.8 1.0 0 0.2 0.4 0.6 0.8 1.0
φs φs
(c) (d) (e)
Figure 1. (a) Segregation flux functions and (b) the large and small particle segregation velocities as a function
of the small particle concentration φ s (adapted from Gajjar & Gray 2014; Gray 2018). These assume that
fsl = Aχ (1 − χφ s ), where χ ∈ [0, 1] and Aχ is a normalization factor giving all the flux functions the same
amplitude as the quadratic flux when χ = 0 (red lines). The blue lines show the cubic flux model of Bridgwater
et al. (1985) for χ = 1 and the green lines show the intermediate cases when χ = 0.2, 0.4, 0.6, 0.8. For
s = (1 + χ)/(3χ) (circular markers a) and a group of large
χ ∈ [1/2, 1] these develop an inflection point at φinf
particles rise fastest at φcrit = 1/(2χ) (circular markers b). Sketches showing (c) the rapid percolation of a
s
single small intruder in a matrix of large grains, (d) the slow rise of a single large particle in a matrix of fine
and (e) the faster rise of a group of large particles at intermediate concentrations for a sufficiently skewed flux
function.
velocity is equal to fsl and is attained when there is a single large grain at concentration
φ s = 1− (note the superscript minus is used to show that the concentration is not 100 %
small particles, i.e. there is a large intruder, but it does not significantly change the local
concentration from unity). Similarly, the small particle segregation velocity is linear in
φ l and the maximum segregation velocity equals −fsl and is attained when there is a
single small grain at concentration φ s = 0+ . The quadratic large particle segregation flux
function and the associated linear segregation velocities are plotted in figure 1(a,b).
Using shear box experiments van der Vaart et al. (2015) showed that there was
an underlying asymmetry to the particle-size segregation, i.e. a single small particle
916 A55-6
Downloaded from https://www.cambridge.org/core. IP address: 78.147.81.167, on 20 Apr 2021 at 14:57:36, subject to the Cambridge Core terms of use, available at https://www.cambridge.org/core/terms. https://doi.org/10.1017/jfm.2021.227
An experimental scaling law for particle-size segregation
percolating down through a matrix of large particles moves much faster than a single large
particle being squeezed up through a matrix of fines. This is illustrated schematically in
figure 1(c,d) and is not captured in the simple quadratic flux model. Gajjar & Gray (2014)
showed that this asymmetry could, however, be captured by skewing the peak segregation
flux towards smaller concentrations of fine grains, as illustrated for a cubic flux function
in figure 1(a). As the peak of the large particle segregation flux moves to the left, the
maximum downward small particle segregation velocity (at φ s = 0+ ) is progressively
increased even though the maximum amplitude of the flux function stays the same. As the
cubic flux curves become skewed, the large particle segregation velocity at concentration
φ s = 1− is progressively diminished below that of the quadratic flux model. Moreover,
as the skewness parameter χ rises above one half, an inflection point develops in the
flux function and the maximum segregation velocity of large particles no longer occurs
at φ s = 1− , but at an intermediate concentration φ s within the range [1/2, 1]. As a result
a group of large particles will rise faster than an individual large intruder as illustrated
schematically in figure 1(d,e).
The theory shows that studying (i) a large intruder being squeezed up through a matrix
of fine particles and (ii) a small intruder percolating down through a matrix of large grains
can yield a considerable amount of information about the shape of the segregation flux
function. A series of single-intruder refractive-index matched shear box experiments have
therefore been performed in this paper.
3. Refractive-index matched shear box experiments
3.1. Experimental apparatus
The shear box apparatus is shown in figure 2(a). It consists of two polyvinyl chloride
(PVC) rough lateral side plates that are able to pivot about two transverse steel rods, that
are located at their centres and bolted to glass panes at the front and back of the shear box.
The top ends of the PVC plates are attached to a steel bar that keeps the plates parallel and
connects them to a horizontally moving plunger driven by a rotational motor. The bottom
of the sheared domain consists of another rough PVC plate of length L = 4.5 cm, which
sets the distance between the two rotating walls, and is free to move horizontally within
slotted grooves in the transparent front and back walls. As the top of the PVC side plates
are driven backwards and forwards the plates pivot about their centres and push the base
plate from side to side as shown in figure 2(b). To try to prevent the formation of crystalline
particle structures the three PVC plates have a random stepped roughness profile, whose
average length and depth are of the scale of the background particles. For instance, in the
experiment shown in figure 2 the average profile length and depth are 4 mm and 2 mm,
respectively, and the background medium size is ds = 6 mm. To give structural stability
the four corners of the glass panes were screwed to steel spacer tubes to maintain the
transverse separation width W = 7 cm of the shear cell. The volume between the three
PVC plates is filled to a height h = 12 cm with a mixture of large and small borosilicate
glass beads of diameter dl and ds , respectively. The whole cell is then submerged in a
refractive-index matched fluid to make the semi-opaque intruder easy to identify and track.
All the materials used to make the box were selected to be compliant with the refractive
index matching technique. The dimensions of the shear cell have been selected to impose
a slightly dilated bulk shearing motion on all the grains in the cell. Earlier prototypes had
a larger separation distance between the pivoting walls that allowed crystalline particle
packings to develop in regions of the flow, which is undesired. A relatively small spacing
between the two rotating walls appears to prevent such effects.
916 A55-7Downloaded from https://www.cambridge.org/core. IP address: 78.147.81.167, on 20 Apr 2021 at 14:57:36, subject to the Cambridge Core terms of use, available at https://www.cambridge.org/core/terms. https://doi.org/10.1017/jfm.2021.227
T. Trewhela, C. Ancey and J.M.N.T. Gray
(a)
Plunger Motor
z Crank
θ h
Power supply
(b)
Figure 2. (a) A photograph of the experimental apparatus showing the power supply, motor, crank and plunger
that drive the upper end of the pivoted parallel PVC plates from side to side. The two pivot points are located
in the middle of the sidewalls and one of them is indicated on the photo. The base plate sits in a notched groove
and is able to move freely from side to side in response to the driving motion. The volume between the pivoted
PVC plates is filled with a granular material of thickness h that is composed of large and small borosilicate
glass beads with diameters dl and ds , respectively. The whole system is submersed in a refractive index matched
fluid, consisting of benzyl alcohol and ethanol, which makes the majority of particles transparent and allows
the position of the semi-opaque red intruder to be easily identified. (b) An image sequence showing the rise
of a large red intruder of diameter dl = 25 mm through a background medium of small particles of diameter
ds = 6 mm over a number of oscillatory cycles. The small grains are just visible so it is possible to see the
free surface. A supplementary movie available at https://doi.org/10.1017/jfm.2021.227 showing the operation
of experimental apparatus is available online.
Figure 2(b) and the first supplementary movie show how, over a series of cycles, the
large red intruder is progressively squeezed upwards until it reaches the top of the cell.
To analyse this motion it is useful to define a coordinate system Oxyz with the horizontal
x-axis orientated in the direction of shear, the horizontal y axis across the cell and the z
axis pointing vertically upwards. Assuming that the PVC plates are pivoted at a height
z = zpivot their imposed horizontal displacement field is
x = (z − zpivot ) sin(ωt) tan θmax , (3.1)
where ω is the frequency and θmax is the maximum angle of displacement of the sidewalls
measured from the vertical axis. Typically θmax ranges between 22.5◦ and 25◦ in the
916 A55-8Downloaded from https://www.cambridge.org/core. IP address: 78.147.81.167, on 20 Apr 2021 at 14:57:36, subject to the Cambridge Core terms of use, available at https://www.cambridge.org/core/terms. https://doi.org/10.1017/jfm.2021.227
An experimental scaling law for particle-size segregation
experiments presented here. Assuming that the resulting velocity u within the granular
material is spatially uniform in each (x, y)-plane, the resulting velocity components are
u = (z − zpivot )ω cos(ωt) tan θmax , v = 0, w = 0, (3.2)
respectively. The shear rate γ̇ = 2D where D = 2 tr(D )
1 2
is the second invariant of
the strain-rate tensor D = (∇u + (∇u)T )/2. For the imposed bulk velocity field (3.2) it
follows that the shear rate
du
γ̇ = = ω| cos(ωt)| tan θmax . (3.3)
dz
This varies in time, but is spatially uniform throughout the shear cell. The average shear
rate over one complete cycle is
2π/ω
ω 2ω
γ̇m = γ̇ dt = tan θmax . (3.4)
2π 0 π
The motor which drives the oscillatory shear cell has a variable voltage input, so the
applied shear rate depends directly on the voltage and the amplitude of the crank
connected to the plunger. Monodisperse experiments with four 6 mm opaque tracers
in a 6 mm translucent media sheared at γ̇m = 1.1 s−1 have been performed to check
that the segregation is not caused by secondary convection in the underlying flow. A
supplementary movie showing this is available online.
3.2. Refractive-index matching, image acquisition and particle tracking
The experiments rely on the refractive-index matching (RIM) technique to make the
intruder visible. This is achieved by using transparent borosilicate glass beads for the
background media and submerging them in a mixture of benzyl alcohol and ethanol.
A summary of the material properties is given in table 1. A calibration procedure was
required to get the right index match. An Atago RX 5000 α refractometer was therefore
used to measure samples of the interstitial fluid. The initial mixture was based on the
measurement tables of Chen, Lin & Tu (2012). Further adjustments to obtain the desired
value of nr = 1.4726 were done by adding small quantities of either ethanol or benzyl
alcohol. A value of nr in between 1.471 and 1.472 were acceptable to clearly observe the
intruder, a condition that improved for a period of time due to the faster evaporation of
ethanol. For the same reason, values over 1.473 were undesirable despite an initially good
match. The effect of the RIM is shown in figure 3(b) where a large red intruder can clearly
be seen in the submersed lower two thirds of the image, but is completely obscured by the
small particles in the dry upper third of the image.
The RIM technique allows the intruder to be clearly seen throughout the experiment
(figure 2b). Image acquisition was performed with a Basler acA2000-165uc camera
positioned in front of the shear box. Different frame rates were used for each experiment,
but for most experiments recording was done at 10 frames per second. Particle
identification was done using the imfindcircles routine implemented in Matlab. The
single-intruder tracking was performed using the code of Crocker & Grier (1996). As
well as tracking the opaque intruder this code also helped to identify, and exclude, false
intruders, which could occur when the intruder size was close to that of the background
medium (figure 3c). Figure 4 shows two space–time plots constructed by taking the vertical
line of pixels through the centre of the intruder at each frame and plotting them adjacent to
916 A55-9Downloaded from https://www.cambridge.org/core. IP address: 78.147.81.167, on 20 Apr 2021 at 14:57:36, subject to the Cambridge Core terms of use, available at https://www.cambridge.org/core/terms. https://doi.org/10.1017/jfm.2021.227
T. Trewhela, C. Ancey and J.M.N.T. Gray
(a)
(b) (c)
Figure 3. (a) Close-up photograph to show how the random profile structure of the pivoting and sliding walls
helps to prevent the formation of crystalline structures in the particles surrounding the intruder. (b) Image
showing the contrast between dry and wet conditions using the RIM technique with transparent borosilicate
glass beads and a mixture of benzyl alcohol and ethanol. (c) Semi-opaque red intruder identified with the
image analysis code.
Material nr ρ∗ (g cm−3 ) η (cP) Supplier
Borosilicate glass 1.4726 2.2 NA Schäffer Glas
Benzyl alcohol 1.5396 1.044 5.474 Acros Organics
Ethanol 1.3656 0.789 1.2 Fisher Scientific
Table 1. Refractive indices nr , intrinsic densities ρ∗ , viscosities η and suppliers for the materials used in the
refractive-index matched experiments.
916 A55-10Downloaded from https://www.cambridge.org/core. IP address: 78.147.81.167, on 20 Apr 2021 at 14:57:36, subject to the Cambridge Core terms of use, available at https://www.cambridge.org/core/terms. https://doi.org/10.1017/jfm.2021.227
An experimental scaling law for particle-size segregation
(a) (b)
0.10
0.09
0.08
0.07
0.06
z (m) 0.05
0.04
0.03
0.02
0.01
0
50 100 150 200 250 300 350 400 450 20 40
t (s) t (s)
Figure 4. (a) Space–time plot of a large intruder of diameter dl = 19 mm segregating upwards in a medium
of small particles of diameter ds = 6 mm subject to an average shear rate γ̇m = 0.26 s−1 (taken from set 2
in table 2). The space–time plot is made by plotting the vertical line of pixels that passes through the centre
of the large particle at each time. The intruder therefore appears as a band of red, while the index matched
interstitial fluid and the background medium of small particles appear green. The trajectory of the centre of the
large intruder as a function of time is shown with the white dashed line. (b) Space–time plot of small intruder
particle of diameter ds = 6 mm percolating down through a matrix of large particles of diameter dl = 14 mm
at a shear rate γ̇m = 0.34 s−1 (taken from set 4 in table 2). In this experiment the background medium appears
black while the intruder is orange. The intruder centre as a function of time is shown with a white dashed line.
one another. It is striking that for comparable size ratios and shear rates the large intruder
takes much longer to be squeezed up to the free surface than the small intruder takes to
percolate down to the base. It is also very significant that the trajectories of the intruder
centres are both curved.
3.3. Experimental data sets
A series of five sets of experiments were performed in order to understand the functional
dependence of the segregation velocity magnitude fsl . Sets 1 and 2 correspond to
experiments with a single large intruder rising through a medium of small particles. In set
1 the diameter of the large and small particles are held constant and the shear rate is varied,
while in set 2 the diameter of the small particles and the shear rate are held constant and
the diameter of the large intruder is changed. These sets represent experimental conditions
where φ = 1− . Sets 3, 4 and 5 all relate to a small intruder segregating through a matrix of
large grains, when φ = 0+ . In sets 3 and 4 the shear rate is varied for two different small
intruder diameters, while in set 5 the shear rate is held constant and the small intruder
diameter is changed. The experimental conditions of all the sets are summarized in table 2.
4. Preliminary interpretation of the data
4.1. Dimensional analysis
The experimental data are complex and contain a number of functional dependencies that
are hard to interpret without a clear initial hypothesis. It is therefore useful to consider what
dimensional analysis can say about the functional behaviour of the segregation velocity
916 A55-11Downloaded from https://www.cambridge.org/core. IP address: 78.147.81.167, on 20 Apr 2021 at 14:57:36, subject to the Cambridge Core terms of use, available at https://www.cambridge.org/core/terms. https://doi.org/10.1017/jfm.2021.227
T. Trewhela, C. Ancey and J.M.N.T. Gray
Set Intruder dl (mm) ds (mm) R = dl /ds γ̇m (s−1 )
1 Large 19 6 3.17 0.26
19 6 3.17 0.42
19 6 3.17 0.59
19 6 3.17 0.77
2 Large 10 6 1.67 0.26
12 6 2 0.26
19 6 3.17 0.26
25 6 4.17 0.26
3 Small 14 8 1.75 0.34
14 8 1.75 1.10
14 8 1.75 2.30
4 Small 14 6 2.33 0.34
14 6 2.33 0.63
14 6 2.33 0.87
5 Small 14 12 1.17 0.34
14 10 1.4 0.34
14 8 1.75 0.34
14 6 2.33 0.34
14 4 3.5 0.34
Table 2. Diameters of the large particles dl , small particles ds , the size ratio R = dl /ds and average shear rates
γ̇m for each experimental set 1–5. Sets 1–2 correspond to a single large intruder rising through a matrix of
small particles, whereas sets 3–5 correspond to a single small particle percolating down through a matrix of
large grains.
magnitude fsl before presenting the results. For a dry bidisperse mixture of large and small
particles, fsl is considered to be an output of the system. The inputs are the particle sizes
dl and ds , the intrinsic density of the grains ρ∗ , the volume fraction of small particles
φ s = 1 − φ l per unit granular volume, the solids volume fraction Φ, the bulk shear stress
τ , the pressure p, gravity g and the shear rate γ̇ . This is a total of nine variables with three
primary dimensions (mass, length and time), so dimensional analysis implies that there
are six independent non-dimensional quantities
τ γ̇ d̄ p dl
μ= , I=√ , Φ, P= , R= , φs, (4.1a–f )
p p/ρ∗ ρ∗ gd̄ ds
where μ is the friction, I is the generalized inertial number in which d̄ is the volume
fraction weighted average particle diameter
d̄ = φ l dl + φ s ds , (4.2)
P is the non-dimensional pressure and R = dl /ds is the grain-size ratio. In this analysis, the
experimental system size and any higher gradients of the variables are implicitly assumed
not to be of importance. For a monodisperse system in the absence of gravity, only the
first three non-dimensional variables in (4.1a–f ) are relevant, and (4.2) reduces to the
monodisperse particle diameter. It was this type of dimensional analysis combined with
observations from DPM simulations and experiments that led to the development of the
incompressible μ(I)-rheology (GDR-MiDi 2004; Jop et al. 2006), which has advanced our
understanding of the rheology of monodisperse granular flows.
Dimensional analysis also provides a powerful way of interpreting the segregation
experiments in this paper. It is assumed that it is the combination of shear-induced gravity
916 A55-12Downloaded from https://www.cambridge.org/core. IP address: 78.147.81.167, on 20 Apr 2021 at 14:57:36, subject to the Cambridge Core terms of use, available at https://www.cambridge.org/core/terms. https://doi.org/10.1017/jfm.2021.227
An experimental scaling law for particle-size segregation
driven percolation (kinetic sieving) and squeeze expulsion (Middleton 1970; Bridgwater
et al. 1985; Savage & Lun 1988; Gray & Thornton 2005; Gray 2018) that generate the
dominant mechanism for segregation in dense granular flows. In particular, dimensional
analysis implies that the segregation velocity magnitude should scale as
fsl ∼ γ̇ d̄ G (μ, I, Φ, P, R, φ s ), (4.3)
where γ̇ d̄ is chosen as a reference scale and G is an arbitrary function of the six
non-dimensional variables defined in (4.1a–f ). The five sets of experiments detailed in
table 2 provide key observations that help to constrain the functional form of G .
4.2. Fundamental observations and resulting hypothesis
This paper makes four key assumptions based on the observations (a)–(d) below:-
(a) Experimental data sets 1, 3 and 4 imply that the segregation velocity magnitude fsl
scales linearly with the shear rate γ̇ for both large and small intruders. (b) Experimental
set 2 implies that the rise velocity of large intruders scales linearly with the particle size
ratio R, and since it necessarily shuts off when R = 1, this implies that fsl scales linearly
in R − 1 in the limit φ s = 1− . (c) Set 5 shows that in the limit φ s = 0+ small intruders
exhibit an approximately quadratic dependence on R − 1 for large size ratios, but have the
same linear dependence on R − 1, as the large intruders, for small size ratios in the range
[1, 1.5]. (d) All of the data sets in 1–5 show that the large and small intruders move along
curved trajectories (see e.g. figure 4), with slower percolation and rise rates deeper in the
flow, where the lithostatic pressure is higher. These trajectories are well approximated by
quadratic curves. Since the pressure is lithostatic in the shear cell, this suggests that fsl is
proportional to 1/(C + P), where the non-dimensional constant C has been introduced to
prevent a singularity when P = 0 at the free surface.
The four key experimental observations (a–d) above suggest that the segregation
velocity magnitude can be written as
F (R, φ s )
fsl = B γ̇ d̄ , (4.4)
C+P
where B and C are non-dimensional constants and F is a function of R and φ s . The particle
size-ratio dependence is encapsulated in F , which satisfies the limits
F (R, 1− ) = R − 1, (4.5)
F (R, 0+ ) = R − 1 + E (R − 1)2 , (4.6)
where E is another non-dimensional constant. A simple functional form that captures the
single large and small intruder cases (4.5) and (4.6) is
F = (R − 1) + E Λ(φ s )(R − 1)2 , (4.7)
where the function Λ satisfies the constraints
Λ(0) = 1, and Λ(1) = 0. (4.8a,b)
A very simple linear function for Λ will be investigated further in § 7.
Substituting for the non-dimensional pressure P from the scaling (4.1a–f ) the
segregation velocity magnitude can be written as
ρ∗ gγ̇ d̄2
fsl = B F (R, φ s ). (4.9)
C ρ∗ gd̄ + p
This formula captures the key processes of gravity, shear and pressure that drive kinetic
sieving and squeeze expulsion during the segregation of particles of different sizes and
916 A55-13Downloaded from https://www.cambridge.org/core. IP address: 78.147.81.167, on 20 Apr 2021 at 14:57:36, subject to the Cambridge Core terms of use, available at https://www.cambridge.org/core/terms. https://doi.org/10.1017/jfm.2021.227
T. Trewhela, C. Ancey and J.M.N.T. Gray
size ratios. The local small particle concentration φ s = 1 − φ l enters through the average
grain size (4.2) and the nonlinear size-ratio dependence (4.7), and automatically generates
asymmetry in the segregation flux functions. Equation (4.9) neglects any dependence on
the friction of the particles μ and the solids volume fraction Φ. Such dependencies may
exist (see Golick & Daniels 2009; Guillard et al. 2016; Jing et al. 2017), but they √ add an
extra level of complexity that goes beyond the scope of this paper. Since I = γ̇ d̄/ p/ρ∗
is linear in the shear rate γ̇ , (4.9) can be reformulated to have a linear inertial number
dependence instead of a linear shear-rate dependence. Importantly the experimental
observation (a), above, implies that there is either a linear shear-rate dependence or a
linear inertial number dependence, but to leading order, at least, other shear rate or inertial
number dependencies are not permitted.
4.3. Effect of the interstitial fluid
Equations (4.4) and (4.9) take no account of the interstitial fluid present in the experiments
in § 3. Thornton et al. (2006) used a three phase mixture theory, composed of large grains,
small grains and an interstitial fluid, to show that the segregation velocity magnitude fsl
was moderated by the relative density difference
f
ρ ∗ − ρ∗
ρ̂ = , (4.10)
ρ∗
f
where ρ∗ is the density of the fluid. If this multiplicative factor is included then fsl = 0
f
when ρ∗ = ρ∗ , and the particles do not segregate. This is consistent with the fluid density
matched bidisperse experiment of Vallance & Savage (2000) in which no significant
segregation was observed. Vallance & Savage (2000) also made the rather counterintuitive
observation that the segregation was slightly weaker in water than in a water–ethanol
mixture that was 3.7 times more viscous. The viscosity therefore does not suppress
segregation as Vallance & Savage (2000) had hypothesized, but, instead, it is the relative
density difference ρ̂ that explains their results (Thornton et al. 2006). All the experiments
in this paper are performed with the same interstitial fluid, and for simplicity the factor ρ̂
is not explicitly included throughout most of the paper. However, in § 8 the dry DPM
simulations of Thornton et al. (2012) are considered, and to compare the theory it is
necessary to correct the experimentally measured value of B to account for the absence of
interstitial fluid.
4.4. Intruder trajectories
In the shear box the gravitational acceleration vector g points downwards parallel to the z
axis, i.e. g = −gk, where k is the unit vector in the z-direction. For the bulk velocity field
defined in (3.2) it follows from (2.8) that, in the absence of diffusion, the vertical velocity
of the large particles satisfies
dzl
wl = = fsl φ s , (4.11)
dt
where fsl is given by (4.9). For the case of a single large intruder, φ s = 1− , and hence the
average particle size d̄ = ds . The large particle trajectory therefore satisfies the ordinary
916 A55-14Downloaded from https://www.cambridge.org/core. IP address: 78.147.81.167, on 20 Apr 2021 at 14:57:36, subject to the Cambridge Core terms of use, available at https://www.cambridge.org/core/terms. https://doi.org/10.1017/jfm.2021.227
An experimental scaling law for particle-size segregation
differential equation (ODE)
dzl ρ∗ gγ̇ ds2
=B F (R, 1− ). (4.12)
dt C ρ∗ gds + p
Substituting for F (R, 1− ) from (4.5) and assuming that the pressure in the grains is
lithostatic
p = ρ∗ gΦ(h − z), (4.13)
the ODE (4.12) reduces to
dzl γ̇ ds2 (R − 1)
=B . (4.14)
dt C ds + Φ(h − zl )
This is separable and can be integrated, subject to the initial condition that zl = zl0 at t = 0,
to show that time is a quadratic function Z l of the vertical coordinate zl , i.e.
Φ
Kl t = Cds (zl − zl0 ) + [(h − zl0 )2 − (h − zl )2 ] = Z l (zl ), (4.15)
2
where the constant
Kl = B γ̇ ds2 (R − 1), (4.16)
is different for each individual experiment. Note that ds and Φ, which arise in the definition
of Z l in (4.15), are the same for all the experiments in sets 1 and 2. The quadratic equation
(4.15) can be solved to give an explicit formula for the trajectory of the large intruder
1
z =
l
C ds + Φh − C ds + 2C ds Φ(h − z0 ) + Φ (h − z0 ) − 2Φ K t .
2 2 l 2 l 2 l (4.17)
Φ
An exactly analogous argument implies that at φ s = 0+ the trajectory of a small intruder
satisfies the ODE
dzs γ̇ d2 [(R − 1) + E (R − 1)2 ]
= −B l . (4.18)
dt C dl + Φ(h − zs )
This is also separable and can be integrated, subject to the initial condition that zs = zs0 at
t = 0, to show that time is a quadratic function Z s of the vertical coordinate zs ,
Φ
Ks t = −C dl (zs − zs0 ) − [(h − zs0 )2 − (h − zs )2 ] = Z s (zs ), (4.19)
2
where the constant
Ks = B γ̇ dl2 [(R − 1) + E (R − 1)2 ], (4.20)
changes between experiments. In all the experiments in sets 3–5 the values of dl and Φ in
the definition of Z s are the same. The quadratic equation (4.19) can be solved to give an
explicit formula for the small intruder trajectory
1
zs = C dl + Φh − C 2 dl2 + 2C dl Φ(h − zs0 ) + Φ 2 (h − zs0 )2 + 2Φ Ks t . (4.21)
Φ
A key test of this scaling argument and the fundamental assumptions (a)–(d) in § 4.2 is
whether the intruder trajectories (4.17) and (4.21) are able to collapse all of the data with
the same choices of the non-dimensional constants B , C and E .
916 A55-15Downloaded from https://www.cambridge.org/core. IP address: 78.147.81.167, on 20 Apr 2021 at 14:57:36, subject to the Cambridge Core terms of use, available at https://www.cambridge.org/core/terms. https://doi.org/10.1017/jfm.2021.227
T. Trewhela, C. Ancey and J.M.N.T. Gray
4.5. The role of particle diffusion
It is important to note that the intruder trajectories calculated in § 4.4 implicitly assume that
there is no diffusion. In fact, experimental observations suggest that there is a significant
amount of self-diffusion that leads to the intruders performing random walks around the
mean path. Utter & Behringer (2004) used a two-dimensional Couette cell to make detailed
experimental measurements of the self-diffusion in a monodisperse system of disks. They
concluded that the diffusion was anisotropic, but that to leading order the diffusivity was
proportional to γ̇ d2 , where d was the particle diameter. The natural generalization of this
result to polydisperse systems is to replace the particle diameter with the mean particle
diameter (4.2) to give
Dsl = Aγ̇ d̄2 , (4.22)
where A is a non-dimensional constant. Figure 9(b) in Utter & Behringer’s (2004) paper
shows that the tangential diffusivity implies A = 0.223, whereas the radial diffusivity
implies A = 0.108. The simulations in § 7 adopt the lower value of A, because it is based
on measurements of the diffusivity made normal to the direction of shear, which is also the
predominant direction for diffusion and segregation in the shear box experiments. Note,
that since d̄ = ds for a large intruder and d̄ = dl for a small intruder equation (4.22) implies
that there will be much more diffusion, and hence variability, for the small intruder paths
than for the large intruders.
5. Large intruder experiments
The segregation of a single large intruder is stable and robust, especially when the size
ratio is large. This is a reflection of the fact that, according to the diffusion scaling (4.22),
the underlying self-diffusion within the small particle matrix is lower than for a large
particle matrix. Larger size ratio intruders also have a lot of contacts with the surrounding
small grains, which provides another mechanism for averaging the natural fluctuations.
As a result the large intruders only occasionally migrate to the PVC side plates, where
they can become stuck when the particle size ratio R is close to unity. To determine the
values of B and C a global least squares fit is made to all the large intruder trajectories in
experimental sets 1 and 2. This suggests that
B = 0.3744, and C = 0.2712. (5.1a,b)
In practice, the constant C only changes the gradient of the trajectory close to the free
surface, and this is least well constrained because the experimental free surface is not
clearly defined at the particle scale. Good fits to the data can also be obtained by assuming
C = 0, in which case B = 0.3615. This is only a 3.45 % difference. Setting C = 0 does,
however, introduce a pressure singularity at p = 0, which implies that the segregation
velocity becomes infinite at the free surface. This singularity is not only unphysical, but
causes difficulties in numerical methods, so in the sections that follow C is assumed to
take its global value defined in (5.1a,b).
5.1. Variable shear rate for the large intruders
The experimentally measured position of a large 19 mm intruder in a matrix of small
6 mm particles as a function of time is shown in figure 5, for four different shear rates.
These experiments correspond to set 1 in table 2. The intruder struggles to segregate
upwards when it is close to the bottom of the cell, but once it moves past a few layers
it segregates faster and faster towards the surface. As a result the intruder trajectories all
916 A55-16Downloaded from https://www.cambridge.org/core. IP address: 78.147.81.167, on 20 Apr 2021 at 14:57:36, subject to the Cambridge Core terms of use, available at https://www.cambridge.org/core/terms. https://doi.org/10.1017/jfm.2021.227
An experimental scaling law for particle-size segregation
0.10 γ˙m = 0.26 s–1, Kl = 7.2 × 10⁻⁶ m2 s–1
γ˙m = 0.42 s–1, Kl = 1.0 × 10⁻⁵ m2 s–1
0.09 γ˙m = 0.58 s–1, Kl = 1.4 × 10⁻⁵ m2 s–1
γ˙m = 0.77 s–1, Kl = 1.8 × 10⁻⁵ m2 s–1
Quadratic fit
0.08
(×10–5)
0.07
2.0
zl (m) 0.06
1.5
Kl (m2 s–1)
0.05
1.0
0.04
0.5
0.03
0.02 0 0.2 0.4 0.6 0.8
γ˙m (s–1)
0 100 200 300 400 500 600 700 800
t (s)
Figure 5. Experimentally measured position of a 19 mm large intruder segregating through a 6 mm matrix of
small particles as a function of time, for four different imposed shear rates γ̇m = 0.26, 0.42, 0.59 and 0.77 s−1 .
Darker red lines correspond to higher shear rates. These data correspond to set 1 in table 2. For each case,
(4.15) is fitted to the experimental data to determine the constant Kl assuming that the depth h = 12 cm and
C = 0.2712 is given by the global best fit to all the large intruder data. The fitted intruder trajectory in time
(4.17) is then plotted for each γ̇m with dashed lines for comparison. The coefficient of determination ranges
between 0.96 and 0.97 for the proposed fits. The inset shows the fitting constants Kl as a function of γ̇m . These
points are closely approximated by the global best fit straight (red dashed) line that passes through the origin
(5.2), implying that fsl has a linear shear-rate dependence.
show a pronounced curvature in time that are well fitted by the quadratic curves derived
in § 4.4 using the global value of C defined in (5.1a,b). For each individual trajectory,
(4.15) is fitted to the experimental data by determining the constant Kl that gives the best
approximation. Typically the fits were extremely good, with a coefficient of determination
lying in the range 0.96–0.97. As the shear-rate γ̇m is increased the large intruder segregates
to the surface faster and therefore the time to reach the surface decreases, while the fitting
constant increases. The four values of Kl are plotted as a function of γ̇m in the inset plot
in figure 5, together with the theoretical straight line passing through the origin defined in
(4.16), i.e.
Kl = B γ̇m ds2 (R − 1), (5.2)
where it is assumed that γ̇ = γ̇m and B is given by the global value in (5.1a,b). The
points all lie close to the straight line, although for this subset of data the global fit is not
quite the best fit. The data are, however, close to the global fit and is consistent with the
fundamental assumption (a) in § 4.2 that the segregation velocity magnitude is linear in the
shear rate.
916 A55-17Downloaded from https://www.cambridge.org/core. IP address: 78.147.81.167, on 20 Apr 2021 at 14:57:36, subject to the Cambridge Core terms of use, available at https://www.cambridge.org/core/terms. https://doi.org/10.1017/jfm.2021.227
T. Trewhela, C. Ancey and J.M.N.T. Gray
0.10 R = 1.7, Kl = 2.9 × 10⁻⁶ m2 s–1
R = 2, Kl = 4.2 × 10⁻⁶ m2 s–1
R = 3.2, Kl = 7.2 × 10⁻⁶ m2 s–1
0.09
R = 4.2, Kl = 1.2 × 10⁻⁵ m2 s–1
Quadratic fit
0.08
(×10–5)
0.07 1.4
1.2
zl (m) 0.06 1.0
Kl (m2 s–1)
0.05 0.8
0.6
0.04
0.4
0.03 0.2
0 1 2 3 4
0.02
R–1
0 200 400 600 800 1000 1200 1400 1600 1800
t (s)
Figure 6. Experimentally measured position of a large intruder of size dl = 10, 12, 19 and 25 mm (darker red
lines correspond to larger intruders) in a matrix of 6 mm small particles as a function of time, and at the same
imposed shear rate γ̇m = 0.26 s−1 . This corresponds to set 2 in table 2. For each case, (4.15) is fitted to the
experimental data to determine the constant Kl assuming that the depth h = 12 cm and C = 0.2712 is given by
the global best fit to all the large intruder data. The fitted intruder trajectory in time (4.17) is then plotted for
each size ratio R with dashed lines for comparison. The coefficient of determination ranges between 0.93 and
0.98. The inset shows the measured constants Kl as a function of R − 1. These points are well approximated
by a global best fit straight (red dashed) line that passes through the origin (5.2), implying that fsl has a linear
dependence on R − 1.
5.2. Variable size ratio for the large intruders
Figure 6 shows experimental set 2 (from table 2) in which both the shear rate γ̇m =
0.26 s−1 and the small particle diameter ds = 6 mm are held constant, while the diameter
of the large intruder dl is varied. In this limit the average particle size d̄ = ds , but the size
ratio R changes between experiments. As the size ratio is increased the particles segregate
faster and the time for a particle to rise from the bottom to the top of the cell decreases. In
each case the large intruders describe curved trajectories in time as they rise through the
cell. This implies that near the bottom of the cell the segregation rate is considerably lower
than close to the surface, where the intruder moves notably faster. The intruder trajectories
are all well approximated by the quadratic curves derived in § 4.4, although there is some
evidence that the curves become more linear at high size ratios. The curves are fitted
using a similar procedure to § 5.1, i.e. by determining the best value of the constant Kl for
each experiment using the global value of C defined in (5.1a,b). The fitted values of Kl are
plotted as a function of the size ratio R − 1 in the inset of figure 6. The points lie extremely
close to the theoretical straight line (5.2) that passes through the origin, indicating that the
segregation rate magnitude fsl is linear in R − 1 even at high size ratios, as assumed in
hypothesis (b) in § 4.2.
916 A55-18You can also read