The Impact of Over-the-Top Television Services on Pay-Television Subscription Services in South Africa - MDPI
←
→
Page content transcription
If your browser does not render page correctly, please read the page content below
Journal of Open Innovation:
           Technology, Market, and Complexity

Article
The Impact of Over-the-Top Television Services on
Pay-Television Subscription Services in South Africa
Nokuphiwa Udoakpan *                and Robertson Khan Tengeh *
 Graduate Centre for Management, Faculty of Business and Management Sciences, Cape Peninsula
 University of Technology, Cape Town 7535, South Africa
 * Correspondence: 204446147@mycput.ac.za or nudoakpan@icloud.com (N.U.); tengehr@cput.ac.za (R.K.T.);
   Tel.: +27-21-460-3450 (R.K.T.); Fax: +27-86-778-0394 (R.K.T.)

 Received: 13 October 2020; Accepted: 8 November 2020; Published: 10 November 2020

 Abstract: Globally, developments and innovations in television technology, including the launch and
 growth of over-the-top television services (OTT TV), have affected traditional pay-TV operators’ ability
 to grow a subscriber base and retain existing customers. Despite attempts made by the Independent
 Communications Authority of South Africa (ICASA) to ascertain the impact of the OTT TV on pay-TV
 services, the results have remained inconclusive. In the absence of a comprehensive assessment and
 credible evidence, this paper sought to ascertain the impact that OTT TV services have on traditional
 pay-TV services in South Africa. A quantitative research method was adopted using a non-probability
 sampling technique for data collection. A total of 391 responses were collected utilising an online
 survey questionnaire and analysed using descriptive statistics on IBM® SPSS® version 26. The main
 findings of the study showed that OTT TV services are a complementary service to pay-TV services
 as opposed to a substitute. Low-income earners are using free/paid mobile applications to consume
 TV content, and for those who have neither OTT TV nor pay-TV services, free-to-air services are the
 preferred platform for TV consumption. This study benefits all stakeholders in digital media and
 business strategy, as well as marketing students.

 Keywords: over-the-top television (OTT TV); Pay-TV; cord-cutting; cord-shaving; cord-nevers

1. Introduction
      Television consumers are increasingly streaming television content online using OTT TV services
that distribute online videos through the Internet or other Internet Protocol (IP)-based transmission
paths [1,2]. These services are also known as subscription video-on-demand (SVOD) or online video
streaming platforms, and throughout this document, the term OTT TV will be used [3]. Owing to
accessibility, availability, and increasingly cheap broadband data, consumer television viewing habits
are changing, and thus, consumers are adopting online streaming platforms as they want to watch
what they want and when they want.
      Noting that South Africa is not immune to global changes in the television broadcasting sector,
the Group CEO of MultiChoice South Africa (MCSA) complained that OTT TV service operators have
an unfair advantage as there is little or no regulation [4]. Furthermore, the same source notes that this
makes it difficult to compete, and thus MCSA requested the Independent Communications Authority
of South Africa (ICASA) to regulate the industry. However, the consumer survey initiated by ICASA to
“understand consumer behaviour concerning television broadcasting and video-on-demand services”,
in its preliminary findings, disputed these complaints, noting that the impact in South Africa is small
and imperceptible owing to the unavailability of affordable and quality broadband data [5].
      In response to ICASA’s preliminary findings, MCSA argues that the findings are unreliable owing
to the vagueness and lack of credibility of the survey questions. MCSA further notes that the survey

J. Open Innov. Technol. Mark. Complex. 2020, 6, 139; doi:10.3390/joitmc6040139   www.mdpi.com/journal/joitmc
J. Open Innov. Technol. Mark. Complex. 2020, 6, 139 2 of 28
questions did not consider that consumers are adopting alternative devices for television consumption.
Thus, consumers are either cancelling their pay-TV services or downgrading premium packages for
lower packages to substitute with OTT TV services. Moreover, the study did not take into consideration
that there are new subscribers who are choosing OTT TV over pay-TV subscription services for the
first-time subscription [6].
Elsewhere, there are suggestions that there is a relationship between the adoption of OTT TV
services and the subscription base of the traditional pay-TV services [7–9]. That relationship is not
clear in South Africa. In the absence of a comprehensive and credible assessment of the impact
that OTT TV services have on traditional pay-TV subscription services, a scientific investigation and
evidence were necessary to enable regulatory bodies to make informed decisions on the real impact.
Therefore, this research study’s main objective was to ascertain the impact that OTT TV services have
on traditional pay-TV services in South Africa.
Although OTT TV services proliferate, the literature on this subject is limited, and the majority of
the research focuses on the U.S. markets [2]. Therefore, this paper will assess the impact of OTT TV
services on pay-TV in the South African context. A critical review of empirical and theoretical studies
relevant to this paper is discussed. This is followed by discussions of the research methodologies
adopted to carry out the study to achieve its objectives. After that, the study findings are presented and
discussed. Finally, discussion of the findings correlated with the study’s research objectives takes place
with conclusions drawn from the findings provided, including recommendations and suggestions for
future research.
2. Literature Review
2.1. Overview of Pay-TV Subscription Services in South Africa
South Africa has an estimated population of 58.78 million, and according to the general household
survey conducted by Statistics South Africa (Stats SA) in 2018, 82.2% of South African households own
a TV set. Almost 90% of the population owns a mobile handset [10,11]. South Africa has free-to-air
television (FTA) stations and pay-TV services. The primary FTA services are the state-owned national
broadcaster, the South African Broadcasting Corporation (SABC), and the privately-owned broadcaster, eTV,
including OpenView. eMedia holdings own both eTV and OpenView. OpenView launched in 2013 [12].
Pay-TV refers to paid television services provided to a consumer for a fee [6]. Home Box Office
(HBO) was the first network to distribute television content via satellite in 1972 and this was a significant
technological advancement in the TV broadcasting sector and the beginning of cable television. Over the
years, the world has seen the emergence of other pay-TV providers [13]. In South Africa, such pay-TV
operators are DStv and StarSat, and the estimated number of pay-TV subscribers in South Africa is
about 6.8 million [14].
Pay-TV services in South Africa launched in 1986 with the launch of the M-Net company by
the Naspers group, which subsequently formed MultiChoice in 1995. MultiChoice launched digital
satellite television services (DStv) in 1995. DStv was the first pay-TV product launched outside of the
United States of America (USA) and the African region [15]. MultiChoice’s DStv has been a dominant
player in the pay-TV industry for decades up until the issue of pay-TV operators licences in 2007,
leading to the birth of pay-TV operators such as StarSat and many others who subsequently failed to
launch their services [16]. StarSat launched in 2007 following the acquisition of TopTV [17].
Dramatic changes across the world, including South Africa, have seen the emergence of OTT TV
service providers such as Netflix, YouTube Premium, Amazon Prime, Black, and Showmax. These OTT
TV service providers disrupt the television broadcasting space, change TV content consumption and
give viewers more choice [6]. These developments are painting the future of pay-TV as we know it,
perhaps threatening its survival, and thus, it is not business as usual in South Africa.
Further to this, reduction trends in data costs, including the accessibility of the internet through
public Wi-Fi free zones and the workplaces have contributed to the growth of OTT TV [18,19].J. Open Innov. Technol. Mark. Complex. 2020, 6, 139 3 of 28
These trends have made it possible for consumers to access TV content conveniently, using any device
of their choice [6]. The calls and recommendations for broadband data cost reduction, including pressure
from the #DataMustFall campaign, predict a further reduction in data costs in the future [20]. There has
already been a reduction in data costs, as MTN and Vodacom announced a data price reduction in
South Africa by almost 30% following the competition council pronouncement [21].
Given these developments, it is arguable that TV viewing behaviour may be changing as we know
it, and this prompts a question about the impact of these developments on South African traditional
pay-TV services.
2.2. Overview of OTT TV Services in South Africa
Some of the significant OTT TV services providers operating in South Africa are Netflix, Showmax,
YouTube Premium, and Amazon Prime Video [6]. Table 1 provides a summarised view of these OTT
TV services.
Table 1. Summarised overview of OTT TV service providers.
OTT TV Service Provider About
Describes itself as a leading online streaming service provider with over
190 million subscribers across 190 countries globally [22]. Estimated to have
Netflix over 400,000 subscribers since it officially launched in South Africa in 2016,
and it is still experiencing continual growth [6]. According to SimilarWeb [23],
Netflix ranks in third place for streaming in South Africa.
An online video subscription service owned by the MultiChoice Group and
launched in South Africa in 2015 in competition with global OTT TV
services [24]. This OTT TV platform has an estimated subscriber base of
595,000 [25]. Like other OTT TV service providers, its services are accessible
on a smart TV, tablet, smartphone, and laptop. Showmax offers international
content and also produces local content.
MultiChoice provides Showmax as a value-added benefit to its DStv Premium
Showmax subscribers at no cost [26].
MultiChoice launched ShowmaxPro on 19 August 2020, which enables
consumers to stream movies, including live sport on its platform as a
standalone subscription on higher or standard definition quality [27].
Interestingly, during the national lockdown in South Africa owing to the
COVID-19 pandemic, Showmax reported an increase in online streaming
through its platform, depicting a change in customer viewership and
increased consumption of content by consumers using OTT TV services [28].
YouTube is a significant video application, ranked as the top website for TV
movie viewing and streaming in South Africa [23]. YouTube has a broader
reach, making it the most significant OTT TV player in South Africa,
YouTube Premium as broadcasters such as eTV and the SABC use its platform for streaming
services. Its subscriber base is over 20 million subscribers globally,
combined with music services offerings [29]. However, subscriber numbers in
South Africa have not been made public.
A streaming service owned by Amazon, with over 2000 TV titles in its library.
It was the first to offer its customers the ability to download content offline for
later viewing. This is a data cost-saving, especially in South Africa,
where broadband data is still unaffordable for the majority of the population.
Its platform has over 100 million subscribers and is available in more than
Amazon Prime Video
200 countries worldwide [30].
Amazon Prime Video launched in South Africa in December 2016, and it
offers online streaming video content to its subscribers for a minimal fee of
ZAR 43.00 per month, and this makes it the lowest subscription fee compared
with other OTT TV operators in South Africa, as depicted in Figure 1 [31].J. Open Innov. Technol. Mark. Complex. 2020, 6, 139 4 of 28
J. Open Innov. Technol. Mark. Complex. 2020, 6, x FOR PEER REVIEW 4 of 30
Video streaming services standard subscription
fees in South Africa
Amazon Prime Video R43.79
YouTube Premium R71.99
Showmax R99.00
Netflix R99.00
Figure
Figure 1.
1. OTT
OTT TV
TV standard
standard subscription
subscription fees,
fees, Adapted
Adapted from
from [32,33].
[32,33].
2.3. Theoretical
2.3. Theoretical Perspective
Perspective
The uses
The uses and
and gratifications
gratifications theory
theory establish
establish the
the influences
influences of
of consumers’
consumers’ television
television consumption
consumption
habits. Furthermore, it aids in studying, predicting, and understanding how TV consumption
habits. Furthermore, it aids in studying, predicting, and understanding how TV consumption can can
evolve [34].
evolve [34].
The Uses
The Uses and
and Gratifications
Gratifications Theory
Theory
The uses
The uses and
and gratifications theory emerged
gratifications theory emerged in in the
the late
late 1940s
1940s [35]. This theory
[35]. This theory “represents
“represents an an
attempt to explain something of how individuals use communications, among other
attempt to explain something of how individuals use communications, among other resources in their resources in their
environment, to
environment, to satisfy
satisfytheir
theirneeds
needsandandtotoachieve
achievetheir goals,
their and
goals, to do
and so by
to do so simply asking
by simply them”
asking [36].
them”
[36]. It is applied to measure consumers’ motivation for using chosen media platforms such as
newspapers, television,
It is applied and smartphones
to measure consumers’[35]. It propelsfor
motivation consumers’
using chosenchoicemedia
of theplatforms
type of mediasuchandas
content consumed to satisfy social and psychological needs [37]. The uses and
newspapers, television, and smartphones [35]. It propels consumers’ choice of the type of media and gratifications theory
states that
content people are
consumed affectedsocial
to satisfy differently by the same needs
and psychological media [37].
content,
The based on their
uses and ideas andtheory
gratifications what
they want to do with the media [38]. Additionally, it implies that the consumer’s
states that people are affected differently by the same media content, based on their ideas and whatchoice and selection
of media
they wantdepend on individual
to do with the media [38].personalities, values,
Additionally, background,
it implies race,
that the and gender
consumer’s [37,39].
choice and selection
The need for information, convenience utility, entertainment, and
of media depend on individual personalities, values, background, race, and gender [37,39].social connection interaction
informs gratification sought from media consumption [39,40].
The need for information, convenience utility, entertainment, and social connection interaction
informs
• gratification sought
Information—This refersfrom media
to the needconsumption [39,40]. online for self-education for various
to obtain information
reasons, including entertainment.
Information—This refers to the needTherefore, for online TV
to obtain information content,
online this refers to for
for self-education consumers
various
browsing different sites to obtain information or to find a specific programme
reasons, including entertainment. Therefore, for online TV content, this refers to consumers to view at a specific
time baseddifferent
browsing on their preference and what
sites to obtain is convenient
information to their
or to find lifestyleprogramme
a specific or needs. to view at a
• Convenience
specific on theirTV
utility—OTT
time based services are
preference anda what
convenient media source
is convenient to search
to their fororcontent
lifestyle needs.without
Convenience utility—OTT TV services are a convenient media source to searchfurthermore,
being bound by geographical location, unlike with pay-TV subscription services; for content
information is sourced at any place and on any device.
without being bound by geographical location, unlike with pay-TV subscription services;
• Entertainment—OTT
furthermore, information TV services
is sourced canatbe a source
any place andof entertainment
on any device. for consumers. They kill time
and aid in relaxation. TV services can be a source of entertainment for consumers. They kill time
Entertainment—OTT
• Social
and aidinteraction—This
in relaxation. refers to users’ ability to interact with others and ease of access to
online interaction—This
Social TV content. This, refers
therefore, is anability
to users’ advantage, as consumers
to interact with others can
andinteract
ease ofwith
accessothers and
to online
communicate
TV their experiences
content. This, therefore, is of aan
specific programme
advantage, in real-time;can
as consumers for interact
instance, with
whenothers
a particular
and
programme
communicateis their
airing, users can have
experiences hashtagsprogramme
of a specific on social platforms such for
in real-time; as Twitter
instance, to when
discuss
a
the programme.
particular programme is airing, users can have hashtags on social platforms such as Twitter to
discuss the programme.J. Open Innov. Technol. Mark. Complex. 2020, 6, 139 5 of 28
Entertainment is, therefore, a significant factor that influences consumers to adopt streaming
services. Thus, the need for entertainment is a better predictor of cord-cutting than the need for
information seeking and companionship.
Further to this, Tefertiller [7] citing Ruggiero (2000) state that “with the arrival of digital media,
three concepts closely related to Web technology would facilitate audience behaviours related to
gratification seeking: interactivity, demassification, and asynchroneity”.
• Demassification—Refers to users’ ability to select programmes or content from a wide variety of
menus. One can argue that pay-TV services enable consumers to access a wide variety of content,
similar to OTT TV services.
• Asynchroneity—Refers to users’ ability to control a message when it is received. Given that OTT
TV services such as Netflix, Showmax, and Amazon Prime have a variety of programmes in their
digital library and allow users to select programmes they wish to see at a time convenient to them,
this then can predict users’ intentions to cut the cord with pay-TV service operators.
Therefore, consumers may alternate between several media, and pick one over the other based on
the level of satisfaction of their specific needs. Thus, consumers may choose OTT TV services over
pay-TV based on the need to fulfil and gratification to derive from these services. Therefore, this paper
sought to ascertain the impact of these OTT TV services on pay-TV subscription services.
2.4. Impact of OTT TV Services on Pay-TV Operators
Customers are increasingly cord-cutting, which means they are abandoning pay-TV services
in favour of OTT TV services [41]. There is a wave of consumers who are cord-shaving, which is
downgrading their traditional premium pay-TV subscription services to standard/lower packages and
combining their pay-TV services with OTT TV services [42]. Some first-time subscribers have never
subscribed to traditional pay-TV services and favour OTT TV services for the first-time subscription;
these consumers are called cord-nevers [43].
The cord-cutting, cord-shaving phenomena, including the cord nevers, have resulted in revenue
reduction for the pay-TV service providers, while OTT TV service providers are making remarkable
market gains [44]. As the world’s economies are going into recession, consumers are cutting down
on expenditure, and pay-TV is the initial cost to cut. In the US, pay-TV operators such as DirecTV
have lost nearly two million subscribers due to subscription cancellations. Most pay-TV operators’
key selling point is the live sport, and in the absence of sport due to COVID-19, most consumers are
turning to game consoles, including OTT TV services [45].
2.4.1. Cord-Cutting
As fixed broadband data subscription grows, so do OTT TV services’ revenues. In contrast,
the pay-TV service operators are experiencing the loss of subscribers, with a decline in subscriber
numbers, and are struggling to retain existing customers as more consumers are embracing OTT TV
services for TV consumption [46]. This phenomenon is proliferating, and the projections are that it will
reach over 40 million by the year 2021 [9]. The accessibility to original TV content and convenience by
these providers has made it easier for the consumer to access the content. Therefore, OTT TV services
are direct competitors of traditional pay-TV operators, as their rise is contributing significantly to the
cord-cutting phenomenon.
Cord-Cutting by Demographic Population
From a demographic perspective, several authors report that:
• The older generation, including those who are not tech-savvy, are hesitant to cut the cord with
pay-TV operators because of the fear of adapting to new technologies, including difficulties in
learning new technologies [47].J. Open Innov. Technol. Mark. Complex. 2020, 6, 139 6 of 28
• Millennials and Generation Z are highly likely to cut the cord as the cost of purchasing a TV set,
including a setup box, is deemed a costly exercise compared with a portable laptop used for dual
purposes. Young people do not have a steady income. With the continuous rise in subscription
fees, these age groups tend to opt for OTT TV services convenient to their lifestyle and which they
deem affordable [43]. This trend will continue to grow, especially with these age groups [7].
Reasons for Cord-Cutting
Several authors, including Christenson [48] and Lee, Nagpal et al. [49] concur that reasons for
abandoning pay-TV services for OTT TV services are as stated below:
• Increase in subscription fees. As broadband data becomes affordable, consumers may re-evaluate
the cost of a pay-TV subscription, considering the cost of broadband data which is used for
multiple purposes.
• Ability to choose channels, including TV content of one’s choice. Pay-TV subscribers, in general,
want to pay for what they use; therefore, availability of this option may indeed lead to cord-cutting.
• Convenience—the ability to consume TV content using any preferred device at any time.
Consumers do not wish to be restricted to one choice of device and place to consume TV content.
Crawford [46] states that cord-cutting emanates from the following factors:
• Consumption of TV content to satisfy personal needs and lifestyle. Although this may be fulfilling
to consumers, it has setbacks, such as limited content available.
• From a cost–benefit analysis, pay-TV subscription services are perceived not to be worth the price.
Moreover, considering the setup costs, including broadband data subscription and time available
to consume content, it may not be beneficial. However, it is also arguable that pay-TV offers a
variety of genres and content which spans sport, reality TV, documentaries, and news channels.
• Technology preferences based on the number of available devices at their disposal.
Moreover, migration from pay-TV to OTT TV services is due to the following:
• The perceived advantages that OTT TV services have over pay-TV services such as the ability
to consume television content using any device from more than one service provider, cost of
subscription fees, including frustrations with old technology and the inability to obtain features
available on OTT TV services [7].
• Poor customer service [49]. How consumers perceive customer service and their experience may
indeed influence cord-cutting, despite the quality of content.
During the COVID-19 pandemic in the US, 1.8 million households cancelled their pay-TV
subscriptions with pay-TV operators because of unemployment, high subscription fees, and the lack of
live sport. There are now as many non-pay-TV subscribers as there were pay-TV subscribers in 1988.
The COVID-19 pandemic will accelerate the cord-cutting phenomenon, while OTT TV services such
as Hulu and YouTube Premium continue to grow with Disney+ signing up 54.5 million customers
worldwide during this pandemic [50].
Although the cord-cutting phenomenon is high in countries like the US, this trend is not significant
in other markets, such as the Korean market. This is due to pay-TV operators combining their
traditional offerings with OTT TV services as part of their retention strategy, thus giving these pay-TV
operators a competitive advantage [51]. Furthermore, in Japan, a local TV network took over Hulu;
this, therefore, can be argued as a strategy to ‘kill the competitor’, retaining existing and attracting new
customers [51]. In the South African market, MCSA that owns DStv has combined its offering with
Showmax and JOOX music streaming services, a value-add to its top-tier subscribers at no cost [52].
In addition to these strategies, Park [44] states that pay-TV providers are responding to the
cord-cutting phenomenon by:J. Open Innov. Technol. Mark. Complex. 2020, 6, 139 7 of 28
• implementing a multiscreen which enables consumers to access television everywhere
and anywhere;
• obtaining exclusive rights to television content;
• having online packages which do not require a setup box. In South Africa, the MultiChoice Group
that owns DStv announced a launched of a ‘dishless’ services which do not require a setup box,
and this is called Showmax Pro [27].
• having cloud pay-TV accessible using smart TV sets; and
• offering consumers the option to select and pay for the channels they use [53].
Although the cord-cutting phenomenon poses threats to pay-TV operators, they continue to
increase subscription fees, despite growing concerns of losing subscribers. In South Africa, year after
year, DStv continues to increase subscription fees despite the threat of cord-cutting [54]. The projections
are that traditional pay-TV services subscribers will decrease even further, with the OTT TV market
growing significantly [9].
Notwithstanding this, although OTT TV services are growing exponentially, pay-TV is here
to stay, as people turn to their television sets during times of crisis and watch live shows such
as American Idol [43]. There is still a 57% revenue increase for cable and satellite companies [47].
For instance, in the Turkish market, OTT TV services are expected to be complementary to pay-TV
services due to the availability of broadband internet services, including the fact that pay-TV service
operators offer OTT TV services to their customers as a value-add at no cost or a small fee [55].
It is also worth noting that, despite COVID-19 and the threat of OTT TV services, MultiChoice South
Africa (MCSA), that owns DStv, reported an increase of 5% in their subscriber base and 3% in revenue.
Furthermore, MCSA announced a distribution partnership with Netflix and Amazon Prime [56].
OTT TV services are, therefore, a more significant part of the consumer experience, and this strategy is
a simplification of the customer experience and a game-changer, as noted globally.
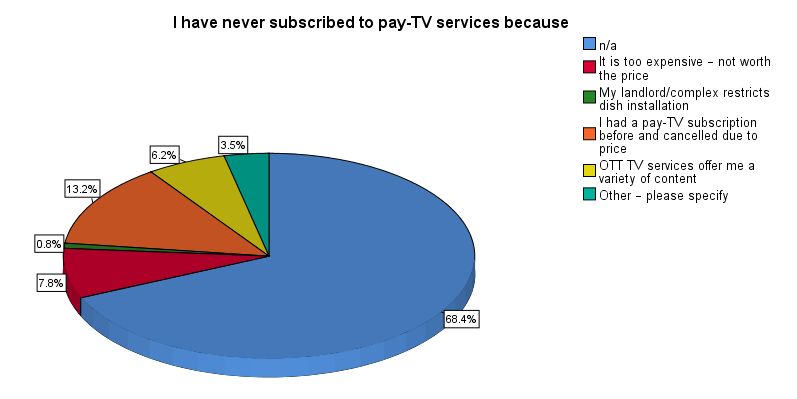
2.4.2. Cord-Nevers
Cord-nevers refer to first-time subscribers who have never subscribed to pay-TV services in favour
of OTT TV services. The projections are that the cord-nevers will increase, reaching over 41 million in
2021, with 24% of users being from 18–34 years, and the primary reason being the burden of pay-TV
services subscription fees [9]. In the US, more than a quarter of millennials have never subscribed to
pay-TV services, favouring OTT TV services for a first-time subscription [57].
Cord-nevers are the biggest threat to pay-TV operators’ survival compared with cord-cutters and
play a considerable role in pay-TV’s declining subscriber numbers [58]. In the US alone, the projections
are that 50% of adults under the age of 30 will not subscribe to pay-TV services by the year 2025 [59].
The adult population of cord-nevers and cord-cutters forecast in the US by eMarketer [60] reveals that
there is a growing trend of cord-nevers.
From a demographics perspective, consumers between the ages of 18 and 34 years indicate that
they have never subscribed to pay-TV because they can access content through OTT TV services [48].
Considering that 35.7% of the total population in South Africa comprises young people between the
ages of 18 and 34, one might argue that there are rising cord-nevers in South Africa [61]. According to
Statista [62], the unemployment rate among the youth in South Africa is currently at 52.85%, and this
raises the question of whether this presents a threat of growing and potential cord-nevers based on
international trends.
2.4.3. Cord-Shavers
Cord-shaving refers to the downgrading of premium pay-TV subscription services for lower
packages, although not cancelling services, and complementing the current services with OTT TV
services. This phenomenon presents a more significant threat to pay-TV service providers owing to
revenue loss, although there is no total loss of the subscriber [7]. Drastic changes in subscription feesJ. Open Innov. Technol. Mark. Complex. 2020, 6, 139 8 of 28
influence the cord-shaving phenomenon, meaning that when prices go up, consumers are highly likely
to downgrade subscription services to lower packages and complement them with cheaper OTT TV
services [6]. The risk with the cord-shavers is that once this group is dissatisfied with pay-TV services,
they become cord-cutters [43].
The cord-shaving phenomenon is highly likely to increase as fibre is rolled out to more areas in
South Africa, and as data prices are reduced [6]. In the UK, 36% of OTT TV subscribers downgraded
their premium pay-TV services. A further 71% of OTT TV subscribers have combined their subscription
with pay-TV subscription services owing to the inability of OTT TV services to offer elite sport, and this
phenomenon is called cord-stacking [63].
2.4.4. Summary
Given all these trends and changes, the landscape in the broadcasting sector is changing rapidly.
As revealed in the literature, as access to affordable and quality broadband data becomes available,
consumer viewing behaviours change. These changes differ among generational age groups. More TV
consumers are adopting different devices to consume TV content. The cost of a subscription fee is the
main reason for cord-cutting because of the perceived value of OTT TV services and expensive pay-TV
services costs. The cord-shaving phenomenon and rising cord-nevers present a more significant threat
to pay-TV operators’ business sustainability.
Arguably, the emergence of OTT TV services will change the pay-TV services sector significantly.
However, the OTT TV services subscriber base may eventually decrease as consumers realise that lower
subscription fees mean restricted content. Moreover, pay-TV service providers may remain dominant
players; thus, these new platforms will not replace the existing platforms; instead, they will benefit
some market segments. The lack of regulation gives OTT TV service providers a more significant
advantage, and thus they can offer services more cheaply, which impacts traditional pay-TV operators’
ability to compete and their business sustainability.
The COVID-19 outbreak also depicts the future of TV consumption, as Netflix reported having
more than doubled subscriber numbers during the outbreak, which is more than double their projections
for 2020. With consumers being at home, more and more are looking for new applications to consume
TV content. As indicated in the reviewed literature, these trends have given rise to the cord-cutting,
cord-nevers, and cord-shaving phenomena said to have an impact on pay-TV operators [48].
Based on the reviewed literature, this study therefore asks the following questions:
• Sub-RQ 1—Are OTT TV services a substitute for or complementary to traditional pay-TV
subscription services in South Africa?
• Sub-RQ 2—Do first-time subscribers favour OTT TV subscription services over pay-TV services in
South Africa? If so, which OTT TV services do they favour for the first-time subscription?
3. Research Design and Methodology
The objectives of the paper were to investigate if OTT TV services are a substitute for or
complementary to traditional pay-TV subscription services and to establish if first-time subscribers
favour OTT TV services over pay-TV subscription services in South Africa. Therefore, the researchers
adopted a descriptive research design using a single cross-sectional design as data is collected from the
targeted population’s respondents only once [64,65]. Following the study’s objectives and research
questions, as indicated in Section 2.4.4, the researchers elected a survey strategy to ensure reliable
data collection from an ample population in a cost-effective manner [66]. Moreover, based on the
positivism philosophical assumptions adopted for the study, a quantitative research approach was
most suited, as the main objective was to ascertain the impact of OTT TV services on pay-TV services in
South Africa. This paper described and made predictions on future trends based on the study findings,
including global trends based on reviewed literature.J. Open Innov. Technol. Mark. Complex. 2020, 6, 139 9 of 28
3.1. Population and Sampling Strategy
The study targeted people who consume television content using OTT TV services and pay-TV
services in South Africa between the ages of 18 and 55+, with internet access [64].
The sampling frame could not be established for the targeted population owing to restrictions
around disclosure of customer data from the pay-TV and OTT TV operators and also considering the
protection of private customer information as stipulated in POPIA [67,68]. Therefore, using a similar
approach to Chen [1], the researchers asked the participants at the beginning of the survey if they
were pay-TV and OTT TV subscribers with internet access in order to qualify them to participate in
the study.
The researchers elected a non-probability sampling technique, as the chance of someone chosen to
take part in the study is not known, nor can it be determined [67]. The advantage of a non-probability
sampling method is that the researcher can still generalise the population, although not on numerical
grounds. Owing to the accessibility of the participants within the researchers reach and because of
limited financial resources, the study adopted a convenience sampling method [69,70].
3.2. Sampling Size
The size of the population could not be determined owing to restrictions around disclosure of
customer data from the pay-TV operators and also considering the protection of private customer
information as stipulated in POPIA [68]. However, according to Statista [71], it is estimated that there
are 6.8 million pay-TV households, and 3.46 million video streaming users in South Africa, although the
demographic profile is unknown. Following the approach used by Tengeh and Talom [72], the sample
size was calculated using the function illustrated below.
z2 × p(1 − p)
n0 = (1)
e2
Table 2 depicts the calculations of the sample size as follows: based on the estimated number
of pay-TV subscribers in South Africa, under the confidence level of 95% with a margin error of
5%, the required sample size for this study was 384 valid responses, which are within the statistical
requirements for data analysis in quantitative studies.
Table 2. The formula for population size calculation.
Confidence Level 95%
Population proportion 0.5
Margin of error 5%
Population size 6,800,000.00
Alpha 0.03
Z-score 1.96
Sample size 384
(Source: authors).
3.3. Data Collection and Analysis
A structured online survey questionnaire was administered from 22 April 2020 and closed on
6 June 2020. The survey link was shared within the researcher’s network using WhatsApp, Twitter,
and LinkedIn for convenience, broader reach, and the popularity of these social media networks
by the targeted population [73]. Further to this, the promotion of the survey link was on Facebook,
targeting the studied population. The researchers took care to set the demographic characteristics and
interest criteria on Facebook to ensure the respondents were residing in South Africa and were members
of the targeted population. The total number of valid questionnaires collected was 391, and therefore,
the researchers obtained the requisite sample for data analysis and to generalise. The collected dataJ. Open Innov. Technol. Mark. Complex. 2020, 6, 139 10 of 28
were captured and analysed using the descriptive analysis to describe and compare variables, using a
numeric format based on the research study’s objectives and questions IBM SPSS Statistics [66,74].
3.4. Reliability and Validity
Validity and reliability in research address issues relating to error and measurement of the research
instruments [67]. Furthermore, reliability and validity refer to an understanding of questions by the
respondents as intended by the researcher and the researcher’s understanding of the answers provided
by the respondent as intended by the respondent [66].
3.4.1. Reliability
Reliability refers to the degree to which the data-collection instrument would produce consistent
results time and again if it were to be replicated by another researcher at a different time [65,67].
To ensure reliability, the survey questionnaire was piloted to 15 participants to test if the questions
sounded right, were understood by the respondents in simple terms without any complicated jargon,
and elicited the respondents’ interest. Based on the feedback received, some of the questions were
removed and paraphrased. Furthermore, to get the respondents’ attention, the biographical questions
were moved to the end of the questionnaire [75]. Cronbach’s alpha was used to test the internal
consistency and reliability of the responses based on the feedback received from the respondents
in the survey questionnaire to establish if respondents understood the questions asked and if they
responded truthfully. The researcher identified six variables that are summarised in Table 3 along with
Cronbach alpha scores, which are illustrated in Appendix A Table A1. The Cronbach coefficient score
was above the recommended score of 0.65 to 0.8 or higher; thus, these results suggest the reliability of
the measurement as satisfactory [76].
Table 3. Reliability analysis.
Cronbach’s Alpha Cronbach’s Alpha Based on Standardised Items N of Items
0.922 0.926 6
Source: survey data (2020).
3.4.2. Validity
Validity comprises internal and external validity, where internal validity refers to “the extent to
which a particular treatment in an experiment produces the sole effect on the dependent variable”.
External validity is “the degree to which the study’s findings can be generalised and representable of
the targeted population” [67]. Several authors concur that the evaluation of a questionnaire’s validity
is through content and construct validity, and is criterion-related [65,66].
Based on this, the researchers ensured content and construct validity by using two experts in the
research field to scrutinise and assess the questionnaire, including establishing if the questions were
necessary and made sense and checking for inconsistencies by piloting to 15 participants. The pilot of
the survey questionnaire further tested if the respondents were able to answer the questions asked by
the researcher [75].
4. Results and Discussions
Skip logic was applied to the survey to ensure the respondents only see questions that apply to
them based on how they answered the current questions. The purpose of this was to ensure that the
respondents do not answer the questions randomly, for a high completion rate and relevance of the
questions [77]. The coding of these questions reflects as non-applicable (n/a).
The population consisted of 219 pay-TV subscribers (highlighted in yellow), 138 OTT TV
subscribers with FTA services (highlighted in green), and 34 consumers who use free or paid
applications to consume TV content online, as reflected in Table 4. In total, 55.2% of the pay-TV
respondents were DStv subscribers, reflecting the dominance and influence of DStv in South Africa.J. Open Innov. Technol. Mark. Complex. 2020, 6, 139 11 of 28
Table 4. Sample size reflecting population per category.
Frequency Percent Valid Percent Cumulative Percent
DStv 216 55.2 55.2 55.2
StarSat 3 0.8 0.8 56.0
I have free-to-air
(FTA—SABC, eTV, OVHD, 43 11.0 11.0 67.0
etc.) and OTT TV services
I only have OTT TV services
95 24.3 24.3 91.3
(Netflix, Showmax, etc.)
I use free/paid mobile apps
34 8.7 8.7 100.0
to consume TV content.
Total 391 100.0 100.0
Note: Highlighted in yellow are the pay-TV subscribers, the colour green represents OTT TV subscribers with FTA
services and in grey are free/paid mobile apps users. Source: authors.
4.1. Demographic Profiles
Table 5 depicts the demographic profile of the sampled population. Of the 391 respondents,
65.5% identified as male, followed by the female at 31.2%. The gender profiles were significantly
different from a similar study conducted by Elias [43], where the majority of the respondents were
female at 60.3% and male at 39.7%. Furthermore, the gender profile findings were consistent with a
report from Stats SA, which states that gender identifying as males consume more TV content than
females or any other gender profile [78].
Table 5. Demographic profiles (n = 391).
Variable Frequency Percentage
I identify as Female 122 31.2
Male 256 65.5
Gender fluid 2 0.5
Non-binary 4 1.0
Prefer not to say 7 1.8
My age is 18–24 51 13.0
25–34 67 17.1
35–45 142 36.3
46–54 79 20.2
55+ 52 13.3
My household income per month,
including any additional jobs, Less than ZAR 10,000.00 103 26.3
but excluding government grants is
R10,000.00–R17,000.00 75 19.2
R18,000.00–R22,000.00 48 12.3
R23,000.00–R32,000.00 49 12.5
R33,000.00+ 87 22.3
My province of residence Eastern Cape 33 8.4
Free State 22 5.6
Gauteng 86 22.0
Kwa-Zulu Natal 32 8.2
Limpopo 9 2.3
Mpumalanga 18 4.6
North West 19 4.9
Northern Cape 9 2.3
Western Cape 163 41.7
The largest age groups were between the ages of 35 and 45 years at 36.3%, followed by 46 and
54 years at 20.2%. Of the studied population, 13.0% was between the ages of 18 and 24 years, while 13.3%
of the respondents were aged 55+. The generational age group of the respondents was slightly differentJ. Open Innov. Technol. Mark. Complex. 2020, 6, x FOR PEER REVIEW 12 of 30
R10,000.00–
75 19.2
R17,000.00
J. Open Innov. Technol. Mark. Complex. 2020, 6, 139 R18,000.00– 12 of 28
48 12.3
R22,000.00
R23,000.00–
from the study conducted by Elias [43] in Portugal, where the R32,000.00 49
majority of the population were12.5
equally
millennials and Generation Z. In contrast, millennials/Generation Y and
R33,000.00+Gen Xers dominated
87 this study.
22.3
The age group profile of the respondents
My province of residence is attributed to the Eastern
fact thatCape
these are the33people responsible
8.4
for the payment of subscription fees. Free State 22 5.6
Of the 362 respondents who answered the question aboutGauteng income levels, the 86
majority were22.0from
the lowest income groups, earning less than ZAR 10,000.00Kwa-Zulu at 28.5%,Natal 32
with the highest income8.2 group
Limpopo 9 2.3
earning ZAR 33,000.00+ at 24.0%. These results reflect income distribution levels in South Africa,
Mpumalanga 18 4.6
as stated by Stats SA [79]. All provinces were represented in the study and reflected the population
North West 19 4.9
size of each province as the most significant provinces are theNorthernGauteng, KwaZulu-Natal,
Cape 9 Western 2.3Cape,
and Eastern Cape provinces, with the Northern Cape having the smallest
Western Cape population
163 at 2.2% of the
41.7
South African population [11].
4.2. Sub-RQ 1—Are OTT TV Services a Substitute for or Complementary to Traditional Pay-TV
4.2. Sub-RQ 1—Are OTT TV Services a Substitute for or Complementary to Traditional Pay-TV Subscription
Subscription Services in South Africa?
Services in South Africa?
4.2.1. Respondents
4.2.1. Respondents Who
Who Have
Have Upgraded
Upgraded Pay-TV
Pay-TV Subscription
Subscription
Of the
Of the 219
219 respondents
respondents who who indicated
indicated that
that they
they had
had aa pay-TV
pay-TVsubscription,
subscription,1.3%
1.3%(n (n== 5)
5) did
did not
not
answer the
answer the question.
question. Of the remaining
Of the remaining 214214 respondents,
respondents, as as illustrated
illustrated in
in Figure
Figure 2,2, the
the summarised
summarised
findings revealed that 37.0% (n = 143) of the respondents disagreed or strongly
findings revealed that 37.0% (n = 143) of the respondents disagreed or strongly disagreed that disagreed that they
they
had not upgraded their pay-TV subscription in the last six months, while only 11.1%
had not upgraded their pay-TV subscription in the last six months, while only 11.1% (n = 43) agreed (n = 43) agreed
or strongly
or strongly agreed
agreed that
that they
they had
had upgraded
upgraded their
their pay-TV
pay-TV subscription
subscription services
services in
in the
the last
last six
six months.
months.
The study further revealed that of the 43 respondents who had upgraded their subscription,
The study further revealed that of the 43 respondents who had upgraded their subscription, the majority the
majority of those were premium subscribers
of those were premium subscribers (n = 21). (n = 21).
Figure 2. Pay-TV subscription upgrade (Source: authors).
Figure 2. Pay-TV subscription upgrade (Source: authors).
4.2.2. Cord-Cutters
4.2.2.Of
Cord-Cutters
the 219 respondents who indicated they were pay-TV subscribers, the summarised findings
illustrated
Of thein Figure
219 3 reveals
respondents thatindicated
who = 163)
42.2% (nthey of pay-TV
were the respondents either
subscribers, thedisagreed
summarised or strongly
findings
disagreed
illustratednot to have3cancelled
in Figure their42.2%
reveals that pay-TV
(n subscription.
= 163) of the In contrast, only
respondents 5.5%
either (n = 21) agreed
disagreed that
or strongly
they had cut the cord with their pay-TV service provider in favour of OTT TV services. This is in line
with the claims by the ICASA [5] as reviewed in the literature that the cord-cutting phenomenon is
small in South Africa owing to the unavailability of affordable and quality broadband data. Further toabandonment of pay-TV services in favour of OTT TV services. Only one respondent between the
ages of 18 and 24 indicated having cancelled his or her pay-TV subscription in favour of OTT TV
subscription. Furthermore, most of the respondents (n = 10) earn between ZAR 10,000.00 and
17,000.00 per month, as illustrated in Table 7. Of the high-income earners of the studied population,
J. Open
only Innov.
two Technol.
either Mark.or
agreed Complex. 6, 139 with having cut the cord with their pay-TV service provider
2020,agreed
strongly 13 of 28
in favour of OTT TV services.
this, The Westernreveal
the findings Cape that
province
OTT TVhadservices
more cord-cutters than thefor
are not a substitute rest of the services,
pay-TV provinces, asthis
and illustrated
concurs
in Table 8. As illustrated in Table 9, mostly males indicated having cut the cord with
with Cell C’s assertion that OTT TV services are not a direct threat to pay-TV operators, although their pay-TV
this
service provider in favour of OTT TV services.
may change in the future as many do not have internet access [5].
Figure 3.
Figure Cord-cutters(Source:
3. Cord-cutters (Source:authors).
authors).
Table 6 illustrates that of the 5.5% (n = 21) who indicated they had cut the cord with pay-TV
Table 6. Cord-cutting by age.
services, the majority (n = 7) of the cord-cutters were between the ages of 35 and 45. These findings
I Have by
concur with the assertion Cancelled My that
Elias [43] Pay-TVtheSubscription
ages betweenServices
35 andin 45
Favour of OTTaTV
represent higher risk to
Subscription.
the abandonment of pay-TV services in favour of OTT TV services. Only one respondent between Total
the ages of 18 and 24 Strongly Strongly
n/aindicated having cancelled
Disagreehis or her pay-TV subscription
Neutral in favour of OTT
Agree
Disagree Agree
TV subscription. Furthermore, most of the respondents (n = 10) earn between ZAR 10,000.00 and
18–24 35 7 6 1 0 1 50
17,000.00 per month, as illustrated in Table 7. Of the high-income earners of the studied population,
25–34 28 14 16 4 2 3 67
only
My agetwo
is either
35–45 agreed59 or strongly
26 agreed with 34having cut the14cord with their
1 pay-TV service
6 provider
140
in favour of OTT TV32
46–54 services. 15 19 8 1 4 79
55+ 17 13 13 4 2 1 50
Table 6. Cord-cutting by age.
Total 171 75 88 31 6 15 386
I Have CancelledSource: authors.
My Pay-TV Subscription Services in Favour of
OTT TV Subscription.
Total
Strongly Strongly
n/a Disagree Neutral Agree
Disagree Agree
18–24 35 7 6 1 0 1 50
25–34 28 14 16 4 2 3 67
My age is 35–45 59 26 34 14 1 6 140
46–54 32 15 19 8 1 4 79
55+ 17 13 13 4 2 1 50
Total 171 75 88 31 6 15 386
Source: authors.J. Open Innov. Technol. Mark. Complex. 2020, 6, 139 14 of 28
Table 7. Cord-cutting by income levels.
I Have Cancelled My Pay-TV Subscription Services in Favour of OTT
TV Subscription.
Total
Strongly Strongly
n/a Disagree Neutral Agree
Disagree Agree
My household income Less than R10,000.00 51 12 20 11 2 5 101
per month, including R10,000.00–R17,000.00 33 13 13 6 3 7 75
any additional jobs, R18,000.00–R22,000.00 23 10 12 2 0 1 48
but excluding R23,000.00–R32,000.00 18 11 11 8 0 0 48
government grants is R33,000.00+ 31 25 24 3 1 1 85
Total 156 71 80 30 6 14 357
Note: Comparison of cord-cutters by income levels; Source: authors.
The Western Cape province had more cord-cutters than the rest of the provinces, as illustrated in
Table 8. As illustrated in Table 9, mostly males indicated having cut the cord with their pay-TV service
provider in favour of OTT TV services.
Table 8. Cord-cutting by province.
I Have Cancelled My Pay-TV Subscription Services in Favour
of OTT TV Subscription.
Total
Strongly Strongly
n/a Disagree Neutral Agree
Disagree Agree
Eastern Cape 14 7 8 2 0 1 32
Free State 12 5 1 2 1 0 21
Gauteng 47 15 16 7 1 0 86
KwaZulu- Natal 16 6 3 3 0 4 32
My province
Limpopo 3 5 0 0 1 0 9
of residence
Mpumalanga 7 3 3 1 1 1 16
North West 8 7 1 2 0 0 18
Northern Cape 5 0 3 0 0 1 9
Western Cape 59 27 53 14 2 8 163
Total 171 75 88 31 6 15 386
Source: authors.
Table 9. Cord-cutting by gender.
I Identify as
Gender Prefer Not Total
Female Male Non-Binary
Fluid to Say
I have cancelled n/a 37 124 0 4 6 171
my pay-TV Strongly disagree 36 36 2 0 1 75
subscription Disagree 32 56 0 0 0 88
services in Neutral 11 20 0 0 0 31
favour of OTT Strongly agree 0 6 0 0 0 6
TV subscription Agree 6 9 0 0 0 15
Total 122 251 2 4 7 386
Source: authors.
Reason for Future Cancellation Consideration
Summarised findings in Figure 4 illustrate the reasons that could prompt pay-TV subscribers
to cancel their current subscription. The study revealed that the top reasons that could prompt the
respondents to cancel their pay-TV subscription would be choosing their own channels at 17.1%
(n = 67) and if OTT TV services had live sport at 13.8% (n = 54). These findings slightly differ from
those of Lee, Nagpal et al. [49] as reviewed in the literature, who indicated that the majority of those
who plan to cut the cord with their pay-TV services is because of the high subscription fees.subscription, and an increase in price subscription was the least of the reasons to consider for
cancellation of pay-TV subscription at 10.0% (n = 39).
A follow up open-ended question was asked to ascertain other reasons that would prompt pay-
TV subscribers to cancel their pay-TV subscription as illustrated in Table 10. Therefore, the
availability of reliable, fast broadband data and poor TV content would prompt cancellation of pay-
J. Open Innov. Technol. Mark. Complex. 2020, 6, 139 15 of 28
TV subscription fees in favour of OTT TV services.
Figure
Figure 4.
4. Reasons
Reasons for
for future
future cancellation
cancellation considerations
considerations (Source:
(Source: authors).
authors).
Interestingly, 9.5%Table = 37)
(n 10. indicated
Other that
reasons for nothing
future would
cancellation make them cancel their pay-TV
considerations.
subscription, and an increase in price subscription was the least of the reasons to consider for
“Should theofarea
cancellation I stay
pay-TV in have a stable
subscription and(nestablished
at 10.0% = 39). internet infrastructure, there is a strong
A follow
possibility ofup open-ended
cancelling question
the pay-tv was asked to ascertain other reasons that would prompt pay-TV
subscription.”
subscribers
“If for sometoreason,
cancel their pay-TV
I would subscription
lose my job.” as illustrated in Table 10. Therefore, the availability of
reliable, fast broadband data and poor TV content would prompt cancellation of pay-TV subscription
“If another competitor with strong content comes along and if subscription would be more than
fees in favour of OTT TV services.
R1000.”
Table 10. Other reasons for future cancellation considerations.
“If they cancel or stop my favourite TV programmes.”
“Should
“We get the
poorarea I stay in have a stable and established internet infrastructure, there is a strong possibility of
content.”
cancelling the pay-tv subscription.”
“Should the area I stay in have a stable and established internet infrastructure, there is a strong
“If for some reason, I would lose my job.”
possibility of cancelling
“If another competitor the
with pay-tv
strong subscription.”
content comes along and if subscription would be more than R1000.”
Source: authors.
“If they cancel or stop my favourite TV programmes.”
“We get poor content.”
4.2.3. Cord-Shavers
“Should the area I stay in have a stable and established internet infrastructure, there is a strong possibility of
Figurethe
cancelling 5 illustrates the summarised findings of the respondents who have downgraded their
pay-tv subscription.”
current pay-TV subscription in favour of OTT TV. authors.
Source: 35.1% (n = 136) of the respondents either disagreed
or strongly disagreed
4.2.3. Cord-Shavers that they have not downgraded their pay-TV premium subscription services in
favour of OTT TV services. Only 13.0% (n = 49) of the population either strongly agreed or agreed
Figure 5 illustrates the summarised findings of the respondents who have downgraded their
current pay-TV subscription in favour of OTT TV. 35.1% (n = 136) of the respondents either disagreed
or strongly disagreed that they have not downgraded their pay-TV premium subscription services in
favour of OTT TV services. Only 13.0% (n = 49) of the population either strongly agreed or agreed
with having downgraded their premium pay-TV subscription in favour of OTT TV services. Of the 219
respondents, 1.0% did not answer the question.
Therefore, the cord-shaving phenomenon in South Africa is lower than in countries like the UK,
where, according to Ofcom [63], 36% of pay-TV subscribers downgraded their premium services
and complemented them with OTT TV. Given these findings, it is agreed that the reason for the lowcombined their pay-TV services compared with other gender groups, as illustrated in Table 11. A
significant number (n = 36) of high income-earners earning ZAR 33,000.00+ were more prevalent in
downgrading their pay-TV for OTT TV services, followed by those earning between ZAR 10,000.00
and 17,000.00 (n = 19); this is illustrated in Table 12. Arguably, the high-income earners have access
to broadband data, hence are more likely to downgrade premium pay-TV packages and complement
J. Open Innov. Technol. Mark. Complex. 2020, 6, 139 16 of 28
them with an OTT TV subscription.
Most of the cord-shavers were between the ages of 35 and 45 years (n = 40), followed by ages of
25–34 and 35–46.
cord-shaving The illustration
phenomenon is due toof thethe summarisedof
unavailability findings is reflected
affordable and fast in Table 13. data.
broadband The Western
Moreover,
as Cape
data province
becomeshad the accessible
more most cord-shavers (n = 36) followed
and affordable, by Gauteng
there could be an (n = 20) as illustrated
increase in Table
in the cord-shaving
14.
phenomenon as predicted by the ICASA [6].
Figure5.5. Cord-shavers
Figure (Source:authors).
Cord-shavers (Source: authors).
From the perspective of the demographic characteristics, the male gender predominantly combined
Table 11. Cord-shaving by gender.
their pay-TV services compared with other gender groups, as illustrated in Table 11. A significant
number (n = 36) of high income-earners earning ZAR 33,000.00+ I Identify as more prevalent in downgrading
were
their pay-TV for OTT TV services, followed by those Gender ZARPrefer Total
Not and
Female Maleearning betweenNon-Binary 10,000.00 17,000.00
Fluid to Say
(n = 19); this is illustrated in Table 12. Arguably, the high-income earners have access to broadband
I have downgraded n/a 37 125 0 4 6 172
data, hence are more likely to downgrade premium pay-TV packages and complement them with an
my premium pay-TV Strongly disagree 20 39 0 0 1 60
OTT subscription
TV subscription.
for a Disagree 34 42 0 0 0 76
lower-priced package Neutral 14 16 0 0 0 30
Table 11. Cord-shaving by gender.
in favour of OTT TV Strongly agree 14 17 2 0 0 33
services Agree 2 14 I 0Identify as 0 0 16
Total 121 253 2
Gender 4 7
Prefer Not 387
Total
Female Male Non-Binary
Source: authors. Fluid to Say
I have downgraded n/a 37 125 0 4 6 172
my premium Strongly disagree 20 39 0 0 1 60
pay-TV subscription Disagree 34 42 0 0 0 76
for a lower-priced Neutral 14 16 0 0 0 30
package in favour of Strongly agree 14 17 2 0 0 33
OTT TV services Agree 2 14 0 0 0 16
Total 121 253 2 4 7 387
Source: authors.
Table 12. Cord-shaving by income levels.
My Household Income Per Month, Including any Additional Jobs, but Excluding Government Grants Is
Less than Total
R10,000.00–R17,000.00 R18,000.00–R22,000.00 R23,000.00–R32,000.00 R33,000.00+
R10,000.00
n/a 51 33 23 18 32 157
Strongly disagree 13 6 5 5 6 35
I have combined my
Disagree 17 11 8 14 8 58
pay-TV with OTT
Neutral 8 4 1 1 5 19
TV subscription
Strongly agree 5 5 6 7 17 40
Agree 6 14 5 3 19 47
Total 100 73 48 48 87 356
Source: authors.
Most of the cord-shavers were between the ages of 35 and 45 years (n = 40), followed by ages of
25–34 and 35–46. The illustration of the summarised findings is reflected in Table 13. The Western Cape
province had the most cord-shavers (n = 36) followed by Gauteng (n = 20) as illustrated in Table 14.You can also read