Integrating Shared Autonomous Vehicles into Municipal Transit Systems - 2017-T6-13
←
→
Page content transcription
If your browser does not render page correctly, please read the page content below
Integrating Shared Autonomous
Vehicles into Municipal Transit Systems

                  J. Andrew Johnson, B.U.R.Pl.
                            #000376926

               Transportation Engineering Technology
                 Building and Construction Sciences
                           Mohawk College
                          Hamilton, Ontario

  2017-T6-13                                   October 20, 2017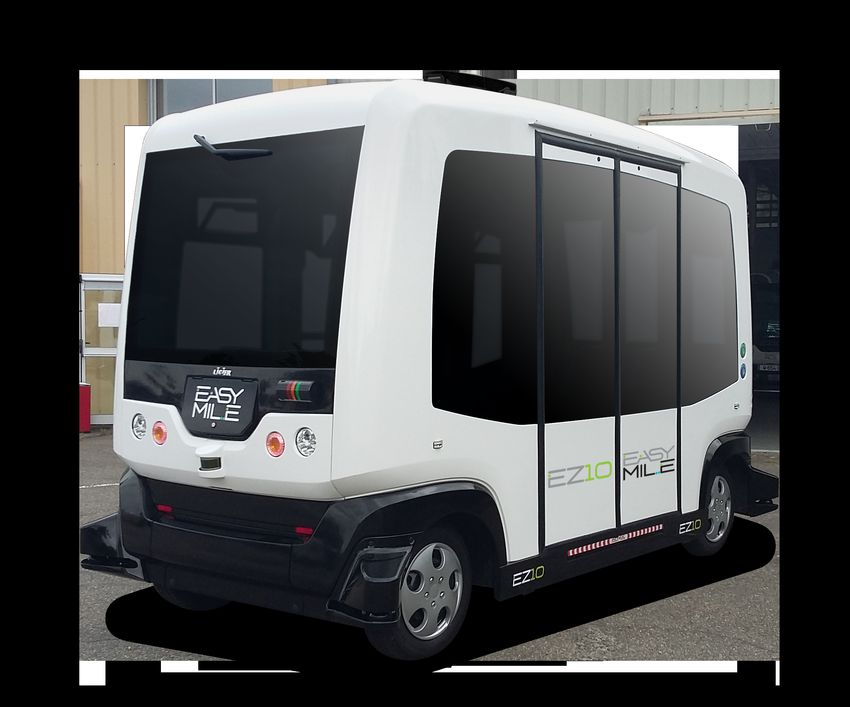
Transportation Engineering Technology                          TRAN TR692 Transportation Project 2

Mohawk College
135 Fennell Avenue West
P.O. Box 2034
Hamilton, ON
L8N 3T2

ATTENTION: Mr. Craig Sherwood
           Professor, Transportation Engineering Technology
           Building & Construction Sciences

Mr. Sherwood,

This report entitled Integrating Shared Autonomous Vehicles into Municipal Transit Systems has
been prepared in accordance with the requirements and terms of reference for course TRAN
TR692 - Transportation Project 2.

This report details a scenario in which Shared Autonomous Vehicles (SAVs) can be integrated
into an existing conventional fixed-route municipal transit system using a system of zones and
hubs to replace traditional fixed-route bus service in low-density suburban areas. For this report,
the City of Hamilton and the Hamilton Street Railway (HSR) were used as the case study.

The analysis was performed using a variety of data sources, including 2016 Census data and
2011 Transportation Tomorrow Survey data, and was compiled in a combination of ArcGIS and
Microsoft Excel.

The report concluded that the implementation of SAVs would save the HSR an estimated
$3.575 million annually if full implementation was undertaken in 2024. Recommendations range
from further study, to network configuration, to implementation suggestions.

This report is my own work and has not been submitted for credit at any other educational
institution.

Regards,

J. Andrew Johnson, B.U.R.Pl.

2017-T6-13                                                                        October 20, 2017
Integrating Shared Autonomous
Vehicles into Municipal Transit Systems

                 J. Andrew Johnson
                     #000376926

                    A Technical Report
      Submitted to Building and Construction Sciences
           Mohawk College, Hamilton, Ontario

         In Partial Fulfillment of the Requirements
               for the Advanced Diploma in
          Transportation Engineering Technology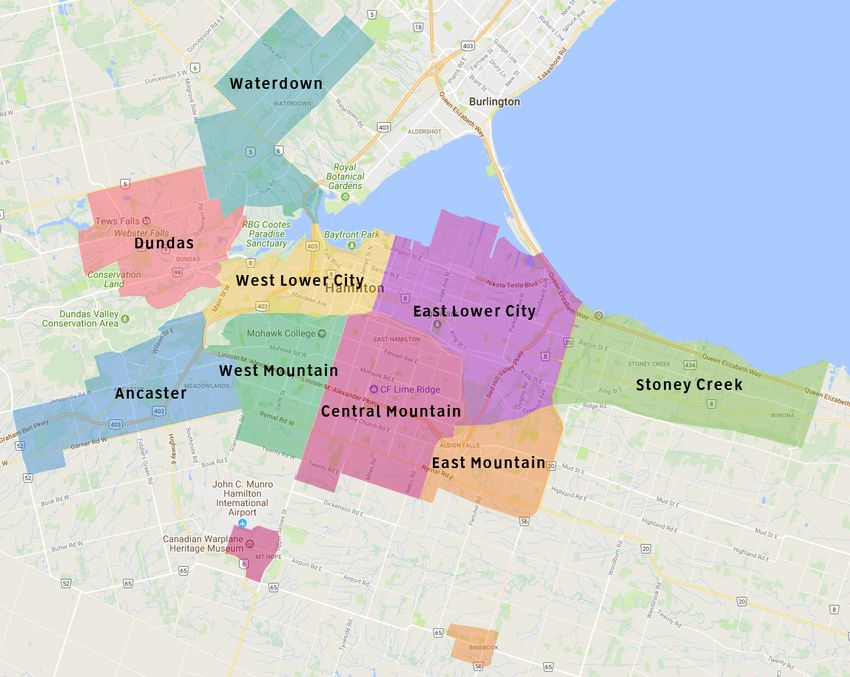
Transportation Engineering Technology                          TRAN TR692 Transportation Project 2

Acknowledgements

I would like to thank the Hamilton Street Railway for allowing me to undertake this analysis
during my co-op placement with the Transit Strategies & Infrastructure group. In particular, I
would like to thank Tanya Detmar, Andy McLaughlin, Christie Meleskie, Sebastian Stula, and
Jason VanderHeide for their guidance, support, and expertise.

I would also like to thank Professor Craig Sherwood, who has guided me through the
preparation of this document, and has ensured the final product that I have produced has been
done so to the best of my ability.

Finally, I would like to thank all those who are dedicating their careers to creating and
improving Autonomous Vehicle technologies, and those who are thinking up new ways and
better ways in which to implement them. Being on the cutting edge of such a new field is rarely
easy, and your continued dedication in the present is ensuring a safer, cleaner, better future for
all of us.

Regards,

J. Andrew Johnson, B.U.R.Pl.

2017-T6-13                                       !ii                               October 20, 2017

Transportation Engineering Technology                            TRAN TR692 Transportation Project 2

Executive Summary

This report provides a vision for how Shared Autonomous Vehicles (SAVs) can be adapted to
function within an existing municipal transit network. In this report, the transit agency into which
SAVs are adapted is the Hamilton Street Railway (HSR), the municipal transit agency in
Hamilton, Ontario. Hamilton will be introducing a Light Rail Transit (LRT) line into their network
in 2024, which will require adjusting their existing bus-only network to maximize the utility of this
new line. As a result, and given the expected maturity of SAV technology by that point, this
report uses 2024 as the implementation year for this SAV project.

Adapting the existing transit network to accommodate SAVs is accomplished by reducing the
fixed-route network to core routes, and abandoning the low ridership, low cost recovery fixed
routes through low density suburban areas. These routes are then replaced with an on-demand
SAV service that picks up passengers at a location that they specify, and drops them off at a
nearby SAV Hub, which is strategically located to provide an easy transfer to the fixed-route
network, and is often located at a major trip generator.

The SAVs used for the purpose of this analysis are completely autonomous and electric, have
seating capacity for 6 people (with capacity for another 6 standing), and are fully accessible.
This vehicle type may differ from what is often defined as a ‘Shared Autonomous Vehicle’, which
is often taken to mean a typical car-sized vehicle that in essence operates as a shared taxi. This
type of vehicle was specifically not used for this analysis, as they have too small a capacity for
the implementation envisioned in this report, and they also have accessibility issues that make
them incompatible with a public transit service in Ontario.

The report includes both qualitative and quantitative analysis of the proposed system. The
qualitative analysis focuses primarily on the specifics of the system, detailing how the concepts
of Zones and Hubs was conceived and applied, and what the optimal configuration for this setup
is. It also examines how this system would be used by the average passenger, providing a
detailed flow chart and description of a typical trip involving SAVs.

The quantitative analysis examines both the capital and operating costs of implementing such a
system. It found that an SAV system incorporated into the HSR’s existing transit system would
require 115 SAVs during the peak hour, with a total operating cost of $15,525,000 per year. The

2017-T6-13                                        !iii                              October 20, 2017
Transportation Engineering Technology                          TRAN TR692 Transportation Project 2

combination of SAVs and a re-constructed core fixed-route network is estimated to reduce
operating costs by $3,575,000 per year, as compared to the current system. The total capital
cost of implementing such a system is estimated to be $42,345,000, with $36,225,000 of that
being for the vehicles themselves, and $6,120,000 for the construction of the Hubs (charging
stations, servicing, and civil works).

Since SAV technology is very much in its infancy, and considering that technological maturation
and economies of scale generally drive costs down over time, it is expected that these costs,
particularly the vehicle acquisition and operating costs, will decrease over time. However, given
there are no reliable estimates for the extent of this decrease, 2017 pricing was used in all
calculations.

2017-T6-13                                      !iv                                October 20, 2017
Transportation Engineering Technology                     TRAN TR692 Transportation Project 2

Table of Contents
  1.0 Introduction                                                                  1

  2.0 The Problem – The Love Affair with the Car: Part 2                            2

  3.0 The New Model – Countering AVs with SAVs                                      5
       3.1 The Vehicle
       3.2 Service Structure
             3.2.1 Network Configuration & Stop Spacing
             3.2.2 Hub Location
             3.2.3 Transfer Configuration
             3.2.4 SAV Timing

  4.0 The Passenger Experience                                                    12
       4.1 The Current Experience
       4.2 The New Experience
             4.2.1 Request
             4.2.2 Pick-Up Location
             4.2.3 SAV Trip
             4.2.4 Transfer
             4.2.5 Return Trip

  5.0 Alternative Options Considered                                              17
       5.1 Traditional Autonomous Vehicles
       5.2 Point-to-Point Service

  6.0 Data Analysis Methodology                                                   19
       6.1 Population Data
       6.2 Ridership Data
       6.3 Spatial Analysis
       6.4 Ridership Analysis
       6.5 Pricing and Quantities
       6.6 Data Limitations

  7.0 Analysis Conclusions                                                        26
       7.1 Ridership
       7.2 Fleet & Hub Requirements
       7.3 System Cost
       7.4 Comparison with the Current Network
       7.5 Implementation

2017-T6-13                                     !v                           October 20, 2017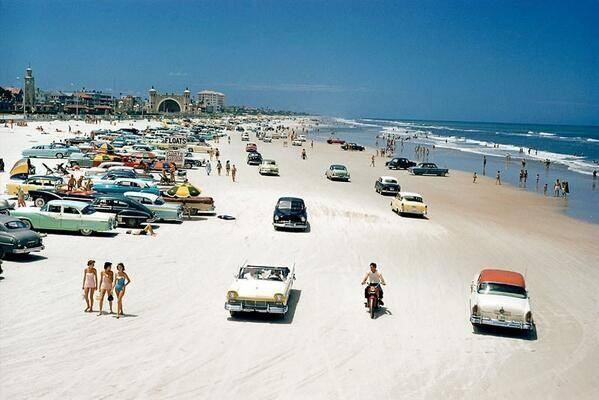
Transportation Engineering Technology             TRAN TR692 Transportation Project 2

  8.0 Recommendations                                                     31
       8.1 Further Study
       8.2 Monitor
       8.3 Phasing

  References                                                              33

  Appendix A - Ridership & Operating Costs Data Tables                    34

  Appendix B - Zone/Hub Breakdowns & Capital Costs Data Tables            35

2017-T6-13                              !vi                         October 20, 2017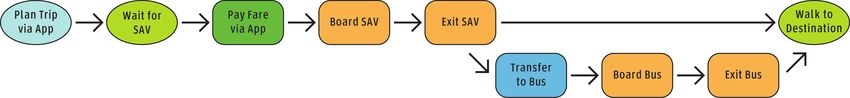
Transportation Engineering Technology                             TRAN TR692 Transportation Project 2

1.0 Introduction

The purpose of this report is to outline how a Shared Autonomous Vehicle (SAV) network can be
adapted to function within an existing municipal transit network. For this report, the Hamilton
Street Railway (HSR), the municipal transit agency for the municipality of Hamilton, Ontario,
was chosen.

Hamilton has a population of 536,917 (2016) [1], making it the 10th most populous city in
Canada. Hamilton’s identity for most of the 20th century has been centred around the
production of steel, the mills for which still dominate the waterfront today. Much of the HSR’s
route configuration is still based off of routes that were optimal in the 1960s and 1970s, where
steel mill workers required service to and from these mills. Since the decline of the steel industry
beginning in the 1970s, Hamilton has been trying to re-invent itself, with medical and post-
secondary institutions like McMaster University and Mohawk College playing a large part in that.

The City has existed in its current political form since 2001, when it was amalgamated by the
Province of Ontario with its neighbouring municipalities of Ancaster, Dundas, Flamborough,
Glanbrook, and Stoney Creek, all of which previously existed under the Region of Hamilton-
Wentworth. Despite this amalgamation, these former municipalities still maintain a unique
identity, with Hamilton being one of the only cities in Canada to feature Area Rating.

Area Rating was introduced after amalgamation, and stipulates that “different parts of the city
pay different tax rates toward transit and, in turn, receive service levels commensurate with how
much they contribute. (Rural areas of the city outside the urban boundary pay nothing.)” [2] This
system has hamstrung transit expansion, as service levels are often set based on how much an
area pays towards transit, and not so much based on demand.

This report will examine how SAVs can be introduced into the HSR’s transit network, while still
maintaining a core, fixed-route transit network. In 2024, Hamilton will be introducing a Light Rail
Transit (LRT) line into its transit network, which will require reconfiguration of the existing
system. As a result, the year 2024 is proposed as the implementation year for this project.

2017-T6-13                                        !1                                  October 20, 2017
Transportation Engineering Technology                               TRAN TR692 Transportation Project 2

2.0 The Problem – The Love Affair with the Car: Part 2

The 2020s, at least from a transportation perspective, are going to look a lot like the 1950s. The
era from the end of World War II to the early 1970s, peaking in the 1950s was dominated by two
themes when it came to transportation: the rise of and love affair with the automobile, and the
decimation of public transit as a competitive transportation option.

                                                       The driver for this change was part
                                                       technological, part demographic, and part
                                                       racial (particularly in the United States). A
                                                       perfect storm of a technology now becoming
                                                       available to the masses, the disproportionately
                                                       high percentage of young adults starting
                                                       families (the “baby boom”), and racial tensions
                                                       leading to “white flight” in many US cities,
Figure 1: Daytona Beach in the 1950s [3]               combined into an unprecedented expansion in
                                                       suburban, low-density housing, which in turn
lead to a massive proliferation of the automobile as the transportation mode of choice.

This proliferation had a profoundly negative effect on public transit on two fronts: service, and
ridership. While many cities had their pre-war development pattern focused around transit (see:
the streetcar suburb, Figure 2), the post-war development pattern, which strongly favoured the
automobile (Figure 3), made serving these new communities by transit very cost ineffective.
Municipalities were unable or unwilling to extend their streetcar networks out into these new
areas to effectively service them, and successful lobbying by General Motors and others had
many cities abandon their streetcar networks entirely, with Toronto being one of the few
exceptions. The Hamilton Street Railway (HSR) was one of those systems that abandoned its
streetcar network. Despite what the name may suggest, Hamilton does not currently have a
single ‘street railway’ route operating, and relies entirely on buses.

This abandonment of the streetcar networks lead to a proliferation of buses as the vehicles of
choice for transit agencies. While they do provide more flexible route options, the travel
experience is generally inferior. And when compared with the travel experience in a private

2017-T6-13                                        !2                                    October 20, 2017
Transportation Engineering Technology TRAN TR692 Transportation Project 2
automobile, many who could afford to make the switch to a car did, which lead to a significant
reduction in transit ridership as a percentage of mode share, particularly in these new suburban
areas.
Figure 2: College St in Toronto, a streetcar Figure 3: Levittown, NY in 1948, prototype for the
suburb, developed around transit [4] low-density suburb, developed around the car [5]
Eventually, the problems of congestion and pollution began a shift back towards public transit,
which largely began in the late 1990s and continues today. Transit is experiencing a
renaissance as Millennials, unlike their Baby Boomer parents, are opting for more compact
urban living, with access to transit being a key factor in where they choose to live.
However, the pending proliferation of the
Autonomous Vehicle may return the balance
between the private auto and transit back to a
1950s state. The three largest detractions to
auto use (pollution, congestion, and parking)
are likely to either be significantly mitigated or
eliminated entirely when AVs become the
majority of cars on the road.
Figure 4: Los Angeles streetcars awaiting
demolition in 1956 after the city abandoned its
streetcar network [6]
2017-T6-13 !3 October 20, 2017Transportation Engineering Technology TRAN TR692 Transportation Project 2 Since AVs are almost certainly going to be electric vehicles, point source pollution will no longer be an issue (whether they are 100% clean depends on how the energy to power them is generated). AVs are also likely to reduce congestion, as they will likely have significantly lower collision rates (human error accounts for 90% of all collisions), and intelligent traffic demand management systems will make better use of our road space. Cars today also require drivers to be attentive at all times, meaning that any time spent driving a car can be spent on little else. A shift to AVs will mean that even if a vehicle occupant is stuck in traffic, they can still make productive use of that time. AVs will also not require parking at or near the end of the trip, significantly reducing the cost of and space required for parking in dense urban areas. With the three largest detractions to private auto use largely mitigated, the stage will be set for a second love affair with the car. The focus of this report will be how transit agencies can adapt their networks to also incorporate AVs, in order to not suffer a similar fate as they did in the 1950s. 2017-T6-13 !4 October 20, 2017
Transportation Engineering Technology                             TRAN TR692 Transportation Project 2

3.0 The New Model – Countering AVs with SAVs

In order for transit to operate effectively in the age of AVs, transit networks will need to be
redesigned and reconfigured in order to implement Shared Autonomous Vehicle (SAV)
technology. As Level 4 or Level 5 AVs, SAVs operate using the same basic technology as AVs,
but are vehicles that can carry more passengers, and are intended to be used as a short
distance, low capacity public transit option [7]. Some SAV options still use traditional vehicle
sizes, which have capacity for around 4 people, while some SAV options use a mini-bus
configuration, which has capacity for around 12 people. For the purposes of this project, SAV is
intended to mean a mini-bus for approximately 12 people, unless otherwise noted. The type
vehicle used for analysis is the EZ10, operated by EasyMile (shown in Figure 5).

The current model for transit networks generally features three types of routes: rapid, core, and
local. Rapid routes generally form part of a higher order transit network, ranging from Heavy
Rail Subway, to Light Rail Transit, to Bus Rapid Transit. They generally operate with a degree of
separation from general traffic varying from dedicated lanes to complete separation. Hamilton
currently has no true rapid transit routes, though it does have the pre-BRT B-Line express bus,
a significant portion of which will be upgraded to LRT by 2024. It is the opening of this LRT that
influenced the 2024 timeframe of this report, as the opening of the LRT will force a
reconfiguration of the overall transit network in order to fully support it.

Core routes are generally primary routes that carry heavier volumes of passengers along major
corridors, but have not yet been given separation from general traffic. Hamilton examples of this
type of route include the 27 Upper James and the 44 Rymal.

Local routes are generally secondary routes that carry lighter volumes of passengers within
neighbourhoods, connecting to a transit hub where they can transfer to a higher volume route.
They generally operate at relatively low frequencies, and often have poor cost recovery ratios.
Hamilton examples of this type of route include the 16 Ancaster and the 18 Waterdown.

It is these local routes that SAVs will seek to replace. By eliminating these fixed-route transit
lines and replacing them with on-demand SAVs, the service can be better tailored to the
demand, minimizing the wastefulness of running empty or nearly empty buses. The service can
also be more direct, as an SAV can make only a few or even no stops between picking up a

2017-T6-13                                         !5                                October 20, 2017
Transportation Engineering Technology TRAN TR692 Transportation Project 2
passenger and dropping them off at the nearest Hub. This is a stark contrast to a fixed-route
line, which must run the full meandering route through the entire subdivision, even if no one is
waiting at the designated stops.
SAVs also offer greater options in terms of accessibility. Whereas fixed-route services require a
prospective passenger to walk to the nearest bus stop, which depending on the location may be
a fair distance away, SAVs can pick a perspective passenger up right at their door. Instead of
waiting at a frozen bus stop in the middle of winter, a passenger can wait inside their residence
for the vehicle to arrive if it’s raining or snowing, significantly increasing the comfort and
convenience of transit. It is also beneficial for passengers with accessibility requirements, such
as a walker, wheelchair, or a visual impairment. The distance that the passenger is required to
navigate in order to access the service is significantly reduced under this scenario.
3.1 The Vehicle
The type vehicle used for this project is the EZ10 [8], operated by EasyMile and manufactured by
Ligier, a French automobile maker. The EZ10 has been in operation since 2008, and can
transport up to 12 people (6 seated and 6 standing). Since there is no steering wheel or
operator area, the vehicle is bi-directional, meaning it has no pre-determined front or back. This
means that while in operation the vehicle requires no 3-point turns or loops to change directions.
The specifications for the vehicle are as follows:
Capacity: 12 persons (6 seating and 6
standing)
Cruising speed: 20 km/h
Maximum speed: 40 km/h
Propulsion engine: Electric asynchronous
Autonomy: up to 14 hours of operations.
Battery: Lithium-ion (LiFeP04)
Battery Charger: 230V 16A
Air-Conditioning: Yes
Length: 3.928 m
Width: 1.986 m
Height: 2.750 m
Wheelbase: 2.800 m
Payload: 1700 kg
Fully loaded: 2750 kg
Figure 5: EZ10 [8]
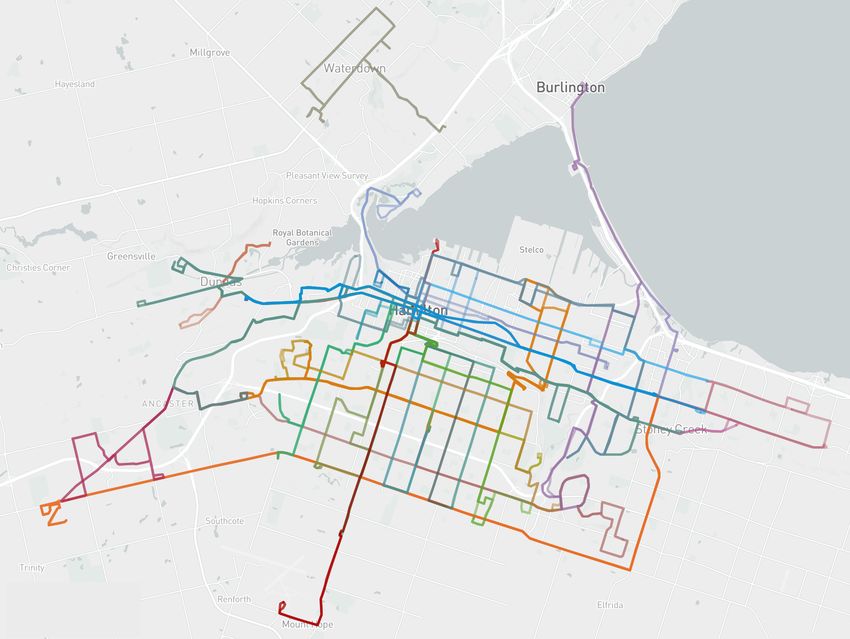
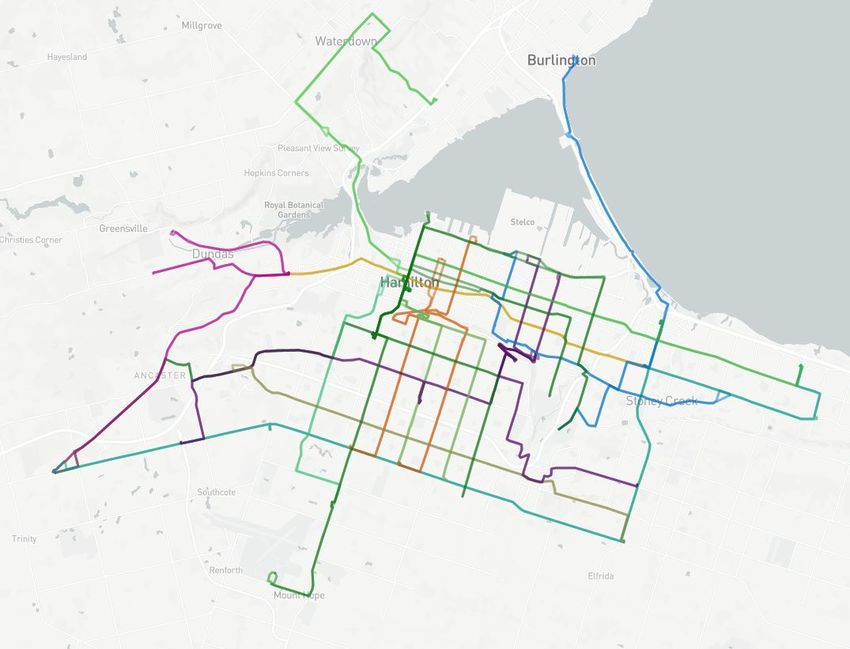
2017-T6-13 !6 October 20, 2017Transportation Engineering Technology TRAN TR692 Transportation Project 2 On-demand SAVs have been implemented today in several different operational scenarios. The most common implementation thus far is as a shuttle service within suburban office parks, connecting the park to a nearby rapid transit or commuter rail station [9]. These service patterns generally have low ridership, and running a fixed-route service with a manually operated bus would be unlikely to even begin approaching an acceptable cost-recovery ratio. However, with the cost of an operator removed and the lower per kilometre trip cost, this on-demand SAV model can be a much more cost-effective solution for this type of trip pattern. 3.2 Service Structure 3.2.1 Network Configuration & Stop Spacing The basic network model post-SAV implementation will be to have high-frequency, semi-express routes using ‘traditional’ buses running along major corridors, and connecting to major destinations or trip generators. Stops will generally be 400-500 metres apart, but can be closer together in more dense urban areas or where trip patterns dictate a need. Much of Hamilton’s street grid is a remnant of the original farming lot and concession system put in place in the 1800s. Unlike most of the rest of the Greater Toronto-Hamilton Area (GTHA), which has a 2km by 2km line and concession grid, Hamilton’s grid is 1km (north-south) by 800m (east-west). Implementing a semi-express service pattern on this size of grid would generally involve stops at major concession roads, as well as one mid-block stop. On north-south arterials, this would mean a stop spacing of about 500m, and on east-west arterials a spacing of about 400m. This spacing puts all development directly along the grid within 200-250m of a bus stop, supporting potential densification along the corridors. The two figures on the following page depict the current HSR network, and what the fixed-route network could look like post-SAV implementation. Notice the reduction in routes serving low- density areas. 2017-T6-13 !7 October 20, 2017
Transportation Engineering Technology                          TRAN TR692 Transportation Project 2

        Figure 6: Existing HSR system, reproduced in Remix

        Figure 7: Proposed fixed-route HSR system, reproduced in Remix

2017-T6-13                                      !8                               October 20, 2017
Transportation Engineering Technology TRAN TR692 Transportation Project 2 3.2.2 Hub Location Underneath the network of high-frequency, semi-express routes (hereafter referred to as the core network), the city will be divided into zones, which serve as service area subdivisions for SAVs. These Zones will generally be 5 to 15km2, representing under 10 minutes to drive from one edge of the zone to the other. Within each Zone will be multiple “Hubs”, located at strategic locations in order to provide a fixed transfer point between the SAVs and the core network. These Hubs will generally be off- road, and will act as a waiting area for transferring passengers, and as a charging area for SAVs awaiting their next passengers. Figure 8: Proposed Hub & Zone system structure, produced in Google MyMaps Municipally-owned properties such as community centres, recreation centres, libraries, and other municipal facilities are preferred locations for SAV Hubs, since no expropriation is required to implement them. However, many desirable locations for Hubs are on private property, which given prevailing land use patterns are usually commercial in nature. In these instances, 2017-T6-13 !9 October 20, 2017
Transportation Engineering Technology                           TRAN TR692 Transportation Project 2

agreements will need to be reached between the HSR and the land owner to have an SAV Hub
installed on their property. HSR currently has multiple agreements in place with commercial
property owners for off-road terminals, including at Lime Ridge Mall and University Plaza. In
addition, since the SAVs are bi-directional and thus do not require space to turn around, the
property requirements in order to implement a Hub are significantly reduced.

Since the core network lines will often form the boundary between service zones, Hubs will
often be located on the edge of Service Zones, which allows that Hub to service multiple Zones.
Service Zones will generally contain at least two Hubs, often located at near-opposite ends of
the Service Zone. This separation allows for people (or more often, the app-based trip planning
system) to determine which Hub is a more convenient drop-off point based on their trip direction
and destination. For example, a passenger in the middle of one of the Mountain Service Zones
who is bound for downtown will likely be dropped off at the Hub on the north end of their
respective Service Zone, directly adjacent to a stop for a downtown-bound core network bus.
However, if the passenger’s origin and destination is within the same Zone, a drop-off point that
is not a Hub will be allowed.

3.2.3 Transfer Configuration

                                                     Hubs and associated core network stops will
                                                     be placed relative to each other in such a
                                                     way as to minimize walking distance and
                                                     street crossings. For example, if a Hub is
                                                     located on the southeast corner of an
                                                     intersection, the north-south route should
                                                     have its northbound stop on the near side of
                                                     the intersection (no crossing required), and
                                                     its southbound stop on the far side of the
                                                     intersection (one crossing required). A similar
                                                     configuration should be implemented for any
                                                     east-west stops as well.

Figure 9: Sample transfer configuration

2017-T6-13                                     !10                                 October 20, 2017
Transportation Engineering Technology TRAN TR692 Transportation Project 2 If the SAV is carrying a passenger with accessibility requirements, the SAV can make an additional stop directly at the stop platform at which they will be transferring to a core network bus, in order to further minimize transfer distances. Generally, due to stop configuration at intersections, making stops directly at all platforms at an intersection is impractical, and thus should only be accommodated as a result of accessibility needs. 3.2.4 SAV Timing The ‘default’ mode of the system will be to have at least one SAV parked at the Hub at all times (when possible), so that alighting passengers from the core network bus have an SAV waiting there for them in order to complete their trip. Having minimal delay at the transfer point is more important than having minimal delay at the start of the trip, as people are generally more comfortable waiting in or in front of their own home for an SAV than waiting at the transfer point for one. The SAV trips will also be timed in order to provide less than a two-minute wait between alighting the SAV and boarding the core network bus for the inbound trip. The sequence and timing in which passengers within a service area will be picked up will be determined by a routing algorithm that minimizes distance and travel time for the majority of passengers. Similar algorithms are already being employed by Uber and other ride-sharing services. This seamless integration of the core network and SAV Service Zones will allow passengers to begin their trip at their doorstep, make a direct transfer to a core network bus to complete their trip. In instances where an SAV is required at the other end as well, an additional direct transfer can be undertaken. 2017-T6-13 !11 October 20, 2017
Transportation Engineering Technology                            TRAN TR692 Transportation Project 2

4.0 The Passenger Experience

While technical specifications and configuration options are important factors to consider when
designing an SAV-based system, determining how the passenger will use the system is equally
important. This section will examine the passenger experience today, as well as how it will
change (and potentially be improved) with the implementation of SAVs. Many of the
recommendations can be implemented independently of SAVs as well, though they should be
considered as pre-requisites for a fully-functional SAV system.

4.1 The Current Experience

At its core, the current transit experience has remained unchanged for over a century.
Passengers wait at a pre-determined pick-up location (which may be several hundred metres
away from their actual starting point), board the vehicle, pay their fare, wait until the vehicle has
arrived at the closest stop to their destination (which, again, may be several hundred metres
away from their destination), and alight. For some trips, a transfer from one vehicle to another is
required. The route’s timing is fixed, the fare is fixed, and the stop locations are fixed.

Figure 10: Current typical trip flow diagram

While technological improvements such as fare payment cards (Presto in the GTHA), real-time
bus information accessible via smartphone apps, and trip planners have improved the customer
experience, at its core the model remains the same one that was implemented with horse-drawn
carriages.

2017-T6-13                                        !12                                 October 20, 2017
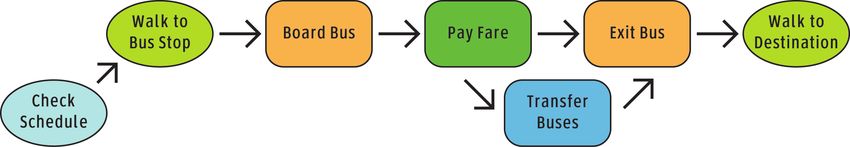
Transportation Engineering Technology                           TRAN TR692 Transportation Project 2

4.2 The New Experience

In order for transit to remain competitive in the age of AVs, and in order for a transit system that
incorporates SAVs to reach their full potential, fundamental changes to the user experience are
required. To do so, below is a summary of what a trip could look like under this new system.
Each element will be elaborated upon under the graphic.

Figure 11: Future typical trip flow diagram

4.2.1 Request

Firstly, SAVs require a completely different ‘request’ system than current fixed-route transit.
Unlike the current “wait here for the bus which will arrive at this time” system, an on-demand
request system will need to be implemented. Fortunately, ride share services like Uber have
already largely solved this issue. Unlike Uber however, which is a private company and thus has
no legislated accessibility requirements, a transit service cannot rely solely on a smartphone
app in order to have people access their service, as some customers could be unwilling or
unable to afford or use a smartphone. An alternative option is required in order to remove this
barrier.

Fortunately, paratransit and dial-a-bus services (DARTS and TransCab in Hamilton,
respectively) have also solved this issue, where customers can call a number to request a
vehicle. While this option isn’t nearly as automated or cost-effective (the person answering the
phone needs to be paid) as an electronic app-based request system, it nonetheless avoids the
barrier to access issue. While these services require some level of pre-booking for the vehicle,
these requirements are more logistical than technological. If an algorithm-determined dynamic
routing system is already in place, theoretically call-in customers can have access to the same
on-demand system as app-based passengers do.

The trip start and end points would be inputted into the app (or told to the customer service
representative over the phone), and the algorithm would determine the optimal routing. If a

2017-T6-13                                       !13                                October 20, 2017
Transportation Engineering Technology                             TRAN TR692 Transportation Project 2

transfer to conventional transit is required, it would determine which hub would be the most
appropriate connection point, given the trip destination and the bus required to get there.

The user at this point will also have the option to include the number of passengers waiting with
them, and whether they or anyone in their party has any accessibility requirements. Inputting
this information allows the system to determine whether or not capacity will be exceeded (and
thus to send another vehicle), or if the ramp will need to be deployed automatically at a given
location because the passenger at that location uses a mobility device. Users would also have
the ability to save “favourite trips” in the app so that the variables of start location, end location,
desired start time or end time, number of passengers, and accessibility requirements would not
need to be entered each time. This would be especially useful if someone commutes using the
same pattern to and from work or school daily.

Once the user has inputted those variables, estimates for total trip time and initial wait time will
be calculated. The pick-up time would be determined by a combination of vehicle availability,
routing, the number of other passengers in the vicinity also requesting SAVs, desired arrival
time at the destination, and transfer time at the Hub. Ideally, the SAV should be timed to arrive
at the Hub mere minutes before the bus arrives, in order to minimize wait times at the Hub.
While many bus stops do provide amenities such as a shelters and benches, for many people
waiting in or outside their own home is preferable to waiting in a bus shelter. On the passenger’s
end, the app will display a wait time countdown clock, which provides the user will real-time
information on when the SAV will arrive.

4.2.2 Pick-Up Location

Unlike the current transit model, where the pick-up location is pre-determined, the pick-up
location in an SAV model is determined by whatever address is provided by the user. The app
will provide a countdown clock for the user, and once the vehicle has arrived it will only wait a
short amount of time (one minute is suggested, but that can be adjusted) for the passenger to
board before departing. This policy should be enacted in order to minimize delays to both the
system and other passengers waiting for or already in the vehicle.

2017-T6-13                                         !14                                 October 20, 2017
Transportation Engineering Technology                            TRAN TR692 Transportation Project 2

The fare payment window will begin once the requested vehicle arrives at the pick-up point, and
if the passenger is late and the vehicle departs without them, that fare window will remain open
for the entire allotted time period, allowing them to request another vehicle if needed. This policy
is intended to reduce the number of ‘prank’ vehicle requests, where users request vehicles with
no intention of actually boarding them. Rather than waiting for a passenger to actually board a
vehicle in order for the payment to be processed, it will be processed once the vehicle arrives at
that pick-up point.

4.2.3 SAV Trip

Once the vehicle arrives, the doors will open passengers will be able to board the vehicle. If
they have pre-specified that they have mobility issues, the ramp will automatically deploy. If they
haven’t, there are buttons on the side of the door they can press which will activate the ramp.

After the doors close, the vehicle will start moving at speeds of up to 40 km/h. While current
models are only capable of that speed, natural improvements in technology by 2024 should
increase that top speed. However, since these vehicles are primarily being deployed on local
streets where the speed limit is often 40 km/h anyway, this is not a significant issue.

Depending on how many other pick-up requests that vehicle has, travel time to the Hub can be
anywhere up to a maximum of 10 minutes. If the passenger’s destination point is within that
same Zone, their drop-off point will be treated the same way as a pick-up point in the vehicle’s
dynamic routing system.

4.2.4 Transfer

Once at the Hub, passengers will disembark and walk to the bus platform at which their
connecting bus will arrive. As mentioned in Section 3.2.3, platforms will be configured in such a
way that passengers will have to cross at most one leg of the intersection in order to reach the
platform. However, if a passenger who has identified as having a mobility issue is on-board the
SAV, then the SAV will make a stop directly at that bus platform prior to terminating its trip at the
Hub. This feature is not available for all passengers due to the turning movement issues
associated with stopping at multiple bus platforms surrounding an intersection.

2017-T6-13                                       !15                                October 20, 2017
Transportation Engineering Technology                            TRAN TR692 Transportation Project 2

The transfer will be timed so that the bus arrives within 2-3 minutes of the SAV arriving at the
Hub, providing a near-seamless transfer experience.

4.2.5 Return Trip

For the return trip, the passenger would input their trip origin and destination into the
smartphone app, as they did with the initial trip. Once their bus arrived at the stop adjacent to
the Hub, they would disembark and walk over to the Hub area, where an SAV would be waiting
for them. Even though the default setting of the system is to keep the SAV parked at the Hub to
allow it to recharge, the system would ensure that a vehicle would be available for the
passenger when they arrived. An exception to this would be if there was higher than usual
demand, in which case the app would alert them when a vehicle will be arriving.

The SAV would then drop them off at their specified destination within the Zone, and their trip
would be complete.

2017-T6-13                                       !16                                 October 20, 2017
Transportation Engineering Technology                            TRAN TR692 Transportation Project 2

5.0 Alternative Options Considered

In addition to the preferred option detailed in Section 3.0, alternative options were also
considered, and ultimately rejected, for implementation. This section will detail what these
options are, what their benefits are, and the reasons why they were ultimately rejected.

5.1 Traditional Autonomous Vehicles

Traditional Autonomous Vehicles refer to vehicles that are the same size and seating capacity
as the majority of the vehicles on the road today (occupancy of about 4 people). While these
vehicles would offer the same on-demand service as the SAV buses proposed above, their
capacity would be about 1/3rd of them. This would likely mean triple the amount of vehicles
required to service the same area and the same passenger volume.

                                                         There is also the issue of accessibility.
                                                         One of the main benefits of SAVs when it
                                                         comes to accessibility is the ability to walk
                                                         straight into the vehicle (via a ramp if
                                                         necessary), and to not have to bend down
                                                         or climb up to reach the cabin space,
                                                         unlike a traditional auto, which requires the
                                                         occupant to lower their centre of gravity in
Figure 12: Google’s test Autonomous Vehicle [10]         order to enter the vehicle. Given that these
                                                         vehicles are intended to be operated
without a human operator, people with mobility issues may be unable to enter a traditional
vehicle without assistance. The SAV buses also provide sufficient headroom for most people
(unless very tall) to stand perfectly upright within the vehicle. SAV buses also have sufficient
space to accommodate wheelchairs or strollers as-is, whereas traditionally-sized vehicles would
require them to be stowed in the trunk, or not be accommodated at all.

5.2 Point-to-Point Service

Other SAV pilot projects or proposals, such as those in Austin, Texas [11], or Lisbon, Portugal [12],
were initially considered for adaptation or implementation for this project. These services

2017-T6-13                                         !17                                October 20, 2017
Transportation Engineering Technology TRAN TR692 Transportation Project 2 operate much as UberPool does today, whereby passengers request an SAV to pick them up at their door or at a pre-determined stop in close proximity to their door, and they get dropped off directly at their destination. Depending on the capacity of the vehicle and proximity of other requests, the vehicle may pick up additional passengers along the way. The issue with this type of service is that point-to-point service is incredibly inefficient from a public transit perspective. While it is most certainly more convenient for the passengers, the number of vehicles required on the road in order to satisfy demand would be substantial. The amount of overlap that would occur on the common sections of many trip patterns (ex: into downtown in the AM peak) would result in significant duplication of service. This model also in essence turns a public transit service into a semi-private taxi service, which is not the intent of public transit (and may raise the ire of the taxi industry). By limiting SAVs to operating within designated zones, and dropping passengers off at Hubs if they choose to travel outside of that zone, the common portions of many trip patterns will still be served by traditional buses or higher order transit modes, which are far more efficient at moving large numbers of passengers. This also would improve response times, as zones have been designed to be able to be covered in no more than 10 minutes travel time, regardless of where the vehicle is within the zone. However, point-to-point service has been maintained within a given zone, as these trips represent a marginal increase in travel time compared to travel to a Hub, and will make up a small minority of total trips taken. An example of where such a trip pattern would be useful is a senior citizen who wishes to go a few blocks down the street to the grocery store and back. By limiting the implementation of SAVs to a first-mile/last-mile solution, it ensures that passengers are being carried by the transportation option that is most efficient for the system. Replacing low-demand fixed routes with an on-demand service increases operating efficiency, while maintaining fixed-route transit on high-demand corridors avoids unnecessary duplication of service. 2017-T6-13 !18 October 20, 2017
Transportation Engineering Technology                                   TRAN TR692 Transportation Project 2

6.0 Data Analysis Methodology

In order to more accurately evaluate the preferred SAV model, quantitative analysis was
required. This analysis utilized 2016 Canadian Census data, 2011 Transportation Tomorrow
Survey (TTS) data, route information generated through the transit planning software Remix,
and digital drawings generated using Google MyMaps. The methodologies used to generate the
conclusions presented in Section 7.0 are described below.

6.1 Population Data

The population data used for this analysis was 2016 Census data [1], which was analyzed at the
Dissemination Block (DB) level. This level was chosen because it provided the greatest amount
of detail when it comes to population, as Dissemination Blocks are the smallest geographic
areas available from the Census.

Given that the target year for this project is 2024, 2021 would be the most recent year for
Census data available at that time, with the following Census not taking place until 2026. In
order to extrapolate 2016 population data to 2021 population data, the Government of Ontario’s
population projection for the Hamilton area [13] was used to determine a growth factor 1.065597.
This factor was then multiplied into every Dissemination Block to determine the 2021 population.

Figure 13: Provincial Growth Projection for the City of Hamilton [13]

While it is acknowledged that growth is rarely geographically uniform, more detailed growth
forecasting by smaller geographic areas was not available. In order to provide analytical
flexibility, the initial ridership calculations were performed using both the 2016 and 2021
population data, in order to verify its accuracy in comparison with the TTS. For the final analysis
however, only 2021 data was used.

2017-T6-13                                          !19                                   October 20, 2017
Transportation Engineering Technology                            TRAN TR692 Transportation Project 2

The growth formula is expressed mathematically as:

2021 Population = (2016 Population) * 1.065597

6.2 Ridership Data

Ridership was determined using both 2016 Census data and 2011 Transportation Tomorrow
Survey (TTS) data [14]. The TTS is an origin-destination survey that is completed every 5 years
by the University of Toronto’s Data Management Group, and maps traffic patterns within the
entire Greater Golden Horseshoe, the name given to the conurbation around the western end of
Lake Ontario, centred around Toronto, and including Hamilton. 2016 TTS data is not yet
available, and thus 2011 data was used for this analysis.

                                                      The TTS data for the City of Hamilton was
                                                      available by Municipal Ward, and included
                                                      factors such as daily trips per person,
                                                      percentage of trips taken using transit during
                                                      both the AM Peak (6-9 AM) and over a 24
                                                      hour period, and the percentage of the total
                                                      trips that were taken during the peak period.

                                                      In order to integrate this data with the
                                                      spatially-represented Census data, a set of
                                                      formulas were determined, which would allow
Figure 14: TTS Service Area [14]                      the total number of trips taken by transit in
                                                      each Dissemination Block to be estimated.
This method was chosen over simply analyzing trip data at the Ward level, as it was determined
that Wards were too large of a geographic area from which to extract any meaningful spatial
analysis.

Since mixing data from different years should be done cautiously, only percentages and factors
were extracted from the TTS for use in this analysis, as they are less prone to significant
variation as compared to ‘raw’ population or ridership data.

2017-T6-13                                      !20                                  October 20, 2017
Transportation Engineering Technology TRAN TR692 Transportation Project 2 The formula to determine daily ridership is mathematically expressed as: Daily Ridership = (2016 or 2021 Population) * (Daily Trips per Person) * (% of 24H Trips by Transit) While the formula to determine AM Peak Hour ridership is mathematically expressed as: Peak Ridership = [(2016 or 2021 Population) * (Daily Trips per Person) * (% of Peak Trips by Transit) * (% of 24H total)] / 3 Figure 15: TTS Breakdown for the City of Hamilton [14] In the City-wide table above, the daily trips per person is a factor of 2.4, the peak period transit usage is 8% of all trips, the 24 hour transit usage is 7%, and the percentage of trips made in the peak period is 21.0%. With 494,721 people within the service area based on the 2016 Census (the City of Hamilton has a fairly significant rural population that has no transit service), the Daily Ridership formula determined that 83,113 trips are taken by transit per day. This is comparable to the 77,455 that the TTS says are taken. The Peak Period formula determined that 6,649 trips are taken by transit in the AM peak hour, while the TTS says 6,176 trips are taken. While it is not realistic for these numbers to line up perfectly, the difference is within the margin of error using different data sources, and accounting for population growth within that 5 year period. 2017-T6-13 !21 October 20, 2017
Transportation Engineering Technology                          TRAN TR692 Transportation Project 2

6.3 Spatial Analysis

After the population and ridership data had been determined, spatial analysis was performed
using ArcGIS. In addition to the 2016 Census data (to which the ridership statistics were added),
the locations of the bus stops, Hubs, and Zones were added to the map.

A 300 metre buffer was then placed around each bus stop. This represents the distance at
which the average person would choose to use the SAV service instead of walk to the closest
bus stop to board the fixed-route service. 300m was chosen as this value because it represents
about a 4 minute walking time for the average person, which is comparable to the estimated
response time of the SAV system. While some demographics, such as young people, may
choose to walk from further away than 300m, other demographics, such as the elderly, may
choose to request an SAV even if they are within this 300m buffer. Since detailed demographic
data was not available at the required level of geographic specificity, 300m was chosen to
represent the maximum distance the average person would be willing to walk before requesting
an SAV instead.

Once these buffers were determined, the ridership data was clipped based on these buffers.
The remnants of the ridership data therefore represented the amount of people who would only
be using the fixed-route bus service, as the clip only counted the people within the 300m
buffers. To determine the ridership of the SAV system, the number of riders within the buffers
was subtracted from the total number of riders. This calculation was done on the SAV Zone
level, in order to determine the number of transit riders in each Zone using each mode.

6.4 Ridership Analysis

From the sequence outlined in Section 6.3, the relevant data was exported from ArcGIS to
Excel, where further analysis was performed. Data such as peak and 24-hour ridership for the
fixed-route system and the SAV system, the SAV system operating costs, the SAV system
capital costs, and the assignment of SAVs to Hubs were determined. The results of this analysis
can be found in Section 7.0.

The analysis concluded that 115 SAVs were required during the peak hour, and thus that
number was used as the basis for further analysis. It was concluded that, unlike traditional fixed-

2017-T6-13                                      !22                               October 20, 2017
Transportation Engineering Technology                          TRAN TR692 Transportation Project 2

route services, that the SAV system would have no central ‘return to’ depot, and instead would
use the Hubs as their layover location when not in service. As such, a total of 115 stalls were
required at the 57 Hubs throughout the system.

In order to determine how many stalls each Hub should have, the number of vehicles that were
determined as required for each Zone were assigned to a Hub (or Hubs) within that Zone. For
example, the East Mountain area has 3 Zones, and a total of 6 SAVs (Albion Falls - 2, Binbrook
- 1, Elfrida – 3) were determined to be required for this area. The Albion Falls SAVs were
allocated to the Upper Red Hill (1) and Heritage Green (1) Hubs, the Binbrook SAVs were
allocated to the Elfrida Hub (1), and the Elfrida SAVs were allocated to the Heritage Green (1)
and Mud (2) Hubs.

The end result of this assignment is that each SAV will have a ‘Home Hub’ within its assigned
Zone, where it will layover during downtime, which will most likely be between 2 AM and 5 AM,
when the fixed-route service is not operating. However, there are two Hubs at which there will
be no assigned SAV (Airport and Waterdown Centre), as there were more Hubs than demand
for SAVs in those Zones. These Hubs have been equipped with a single stall and charger, and
may become a ‘Home Hub’ for an SAV if demand for the service increases to the point where an
additional SAV is warranted.

There are also instances where the number of SAVs required for a Zone is less than or greater
than the total number of SAVs at Hubs in that Zone. This is due to a Hub being located on the
border between two areas, where the Hub effectively serves both areas.

In order to balance out the number of SAVs at Hubs within an area, the ‘Home Hub’ of an SAV
may be a Hub that is classified as being in a different area, even though it still serves the Zone
that it is assigned to serve. An example of this is at Glancaster Loop, where the SAV that is
included in the Ancaster total is in fact assigned to the West Mountain area, since the
Glancaster Loop Hub sits on the border between those two areas.

2017-T6-13                                      !23                                October 20, 2017
Transportation Engineering Technology                                  TRAN TR692 Transportation Project 2

6.5 Pricing and Quantities

The following table shows the pricing and quantities that were used to determine the end capital
and operating costs of the system. All costs have been converted into Canadian Dollars.

              Item                           Amount/Cost                                Source

Capacity of an SAV (EZ10)         8 (Listed as 6 seated, 6 standing)    EasyMile [8]

Cycle Time of an SAV              20 minutes (Except Binbrook = 30)     Estimate

Operating Cost of an SAV (EZ10)   $135,000/year (Listed as €90,000)     National Center for Transit Research [15]

Charging Station Cost             $315,000 each (Listed as €210,000) National Center for Transit Research [15]

Hub Site Works - Base Cost        $15,000 for servicing and civil       Industry estimate
                                  works

Hub Site Works - Per Stall        $15,000 per SAV stall                 Industry estimate

The per-vehicle capacity was determined to be 8 based off of the HSR’s loading standards. The
standard states that during peak periods that the target ridership on a bus should be 125% of
seated capacity. Given the low capacity of the EZ10, and that they were designed to have 6
people stand in them in addition to 6 seated, 8 passengers per vehicle was determined to be a
reasonable amount.

The cycle time for an SAV was determined to be 20 minutes. This includes an average trip time
of 8 minutes to the Hub, a 4 minute dwell time at the Hub, and 8 minutes to drop-off passengers
after departing the Hub. The exception to this in Binbrook, which is set at 30 minutes as it
requires a longer travel time between the community and the Hub.

For each Hub site, three cost items determined the total capital cost of implementation for that
site: the cost of the charging stations, the cost of the servicing and civil works, and a per-stall
cost to pour concrete and perform the necessary hardscaping and landscaping. The number of
stalls was determined as per the methodology in Section 6.4. It was assumed that $15,000
would be required to perform the base civil and servicing works at each site. Beyond that,
$15,000 would be required for each stall added to the Hub. These are estimates, and are based
on industry standards for construction. Naturally, cost will vary from site to site, as each will
have different requirements and different logistical challenges. The prices quoted above merely
represent what the ‘typical’ site would cost.

2017-T6-13                                           !24                                      October 20, 2017
Transportation Engineering Technology TRAN TR692 Transportation Project 2 6.6 Data Limitations There are several limitations in the data analysis that should be noted. The first is that the transit usage percentages are based off of 2011 data, and do not estimate future trends in ridership brought about by transit growth, particularly in unserved or underserved areas. This leads to areas like Waterdown and Binbrook potentially showing SAV ridership numbers that may be lower than what they will actually be once service is implemented. The second limitation is that this analysis was purely a mode share and trip origin exercise. The additional analysis required to perform an origin-destination exercise was beyond the scope of this report. The third limitation is that a ‘flat’ 300m buffer was assumed as the boundary between using fixed-route transit and using SAVs. As was detailed in Section 6.3, this number was chosen to represent the average between younger people, who are more likely to walk further, and senior citizens, who are more likely to walk less far in order to access fixed-route transit. To refine this estimate further, demographic data would be required, which was not available in spatial form for the purpose of this report. Also, the industry standard used to determine maximum typical walking distance to local transit is 400m. In addition to the reasons mentioned above, 300m was chosen since it is an ‘as the crow flies’ distance, which based on most street patterns usually results in about a 400m walking trip on the ground. The final limitation is not so much a data limitation, but a technological one. Many of the vehicle metrics (cost, operating speed, operating hours, etc) are based on technology that is still in its infancy. In the coming years, the technology surrounding SAVs will no doubt improve significantly. When that happens, the metrics, and therefore the assumptions that underpin much of the analysis in this report, will need to be reconsidered. 2017-T6-13 !25 October 20, 2017
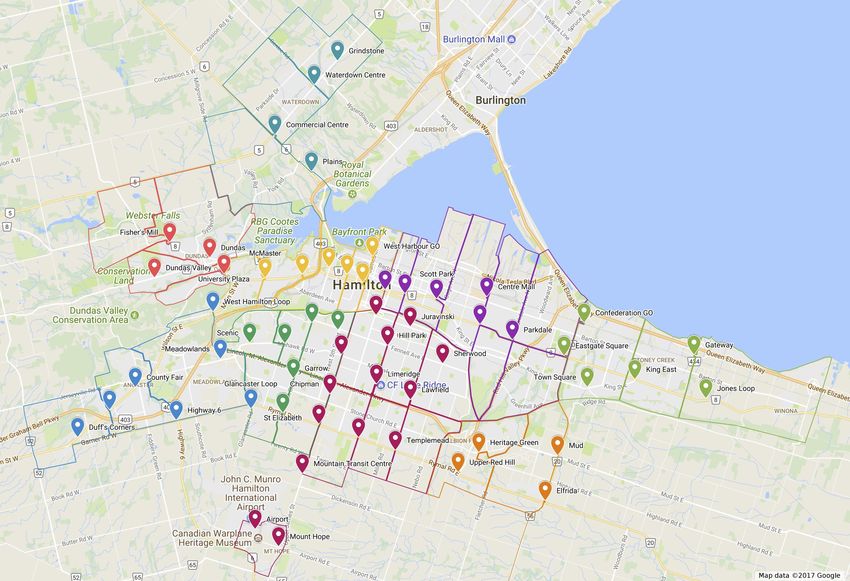
Transportation Engineering Technology                           TRAN TR692 Transportation Project 2

7.0 Analysis Conclusions

A summary of the conclusions drawn from the analysis performed in Section 6.0 are described
below. Immediately below is a key map showing the area names and their location within the
City of Hamilton. The summaries are broken down based off of these areas, as they represent
either former municipalities, or are geographically distinct areas of the city. Within each area are
multiple Zones that form the basis of the SAV network.

Figure 16: Map showing the city broken into the areas used for analysis, produced in Google MyMaps

2017-T6-13                                       !26                                October 20, 2017
Transportation Engineering Technology                                  TRAN TR692 Transportation Project 2

7.1 Ridership

Based on the analysis performed in Section 6.0, the SAV system accounts for nearly one third
of the total system ridership: 31.1%, during the peak period, and 30.9% over a 24-hour period.
The full data set is available in Appendix A.

                                         Peak            24H
                    Peak                 Fixed-         Fixed-       Total
                     SAV      24H SAV    Route          Route        Peak     Total 24H    Peak     24H
   Area Name        Rdshp      Rdshp     Rdshp          Rdshp        Rdshp     Rdshp      SAV %    SAV %

City-Wide             2,216     27,986     4,903            62,677    7,119     90,663     31.1%    30.9%

West Lower City         351      5,248       859            12,602    1,210     17,850     29.0%    29.4%

East Lower City         608      7,928     1,735            23,144    2,343     31,072     25.9%    25.5%

West Mountain           325      3,700       311             3,524      636      7,224     51.1%    51.2%

Central Mountain        409      4,848     1,583            18,515    1,992     23,363     20.5%    20.8%

East Mountain           110      1,129          51            482       161      1,611     68.3%    70.1%

Stoney Creek            179      2,267       222             2,614      401      4,881     44.6%    46.4%

Ancaster                128      1,284          66            659       194      1,943     66.0%    66.1%

Dundas                   85      1,281          71           1,070      156      2,351     54.5%    54.5%

Waterdown                21       299             5            68        26        367     80.8%    81.5%

As one can see, the two Lower City areas dominate the ridership projections, which is
expected given the higher densities prevalent in those areas. A combination of through-routes
and local routes were removed in the Lower City in the model described in Section 3.2.1. Some
of these routes, like the 2 Cannon and 5 Delaware, were removed due to proximity to the LRT
corridor, while others like the 6 Aberdeen and 7 Locke were removed due to low ridership. The
result is pockets of higher density residential that are now served by SAVs, though many of
them are within 1km of the LRT line.

2017-T6-13                                            !27                                  October 20, 2017
You can also read