Developments in the Dutch Postal Market - WIK Consult
←
→
Page content transcription
If your browser does not render page correctly, please read the page content below
WIK-Consult Final Report
Study for the Ministry of Economic Affairs, Agriculture and Innovation,
Directorate-General for Energy, Telecom and Markets
The Netherlands
Developments in the Dutch
Postal Market
Authors:
Antonia Niederprüm
Alex Kalevi Dieke
Petra Junk
Stefano Lucidi
Ralf Schäfer
Rolf Schwab
WIK-Consult GmbH
Rhöndorfer Str. 68
53604 Bad Honnef
Germany
Bad Honnef, 30 August 2011Developments in the Dutch Postal Market I
Contents
List of figures III
List of tables V
List of abbreviations VI
Executive summary i
1 Introduction 1
1.1 Background and objectives of the study 1
1.2 Market segmentation 2
1.3 Methodology 5
2 Overall market assessment 7
2.1 Influence factors of the postal market and scenario building 7
2.2 Forecast model, assumptions, and scenarios 11
2.2.1 Key assumptions 11
2.2.2 Three scenarios for the future role of mail 14
2.3 Volume development 17
2.4 Universal service volume 21
2.5 Competition and viability of postal companies 26
2.6 Price developments in the Dutch postal market 29
2.7 Position of mail carriers 32
2.8 Governmental influence 33
3 Developments per market segment 35
3.1 Social mail 35
3.2 Office mail 38
3.3 Transaction mail 41
3.4 Advertising mail 45
3.5 Periodicals 49
3.6 International inbound mail services 51
3.7 International outbound mail services 53
3.8 Parcels sent by individuals 54
3.9 B2C parcels 55
3.10 B2B parcels 57II Developments in the Dutch Postal Market
3.11 International parcel services 58
Annex Description of the forecast model 59
1 Introduction 59
2 Basic data for the starting year 2010 60
3 Modelling parameters 62
3.1 Share priority mail 62
3.2 Incumbent’s market shares 62
3.3 Share universal services 63
3.4 Price-based effects 63
3.5 Substitution-based effects 65
3.6 Macroeconomic-based effects 66
4 Calculation of volumes 69Developments in the Dutch Postal Market III
List of figures
Figure ES-1 Trend forecast: total domestic mail volume 2010-2020 i
Figure ES-2 Structure of domestic mail in 2010, 2015 and 2020 (“base case”) iii
Figure 1 Influence factors of the postal market 7
Figure 2 Fixed (wired) broadband penetration per 100 inhabitants, for leading
OECD countries, December 2010 8
Figure 3 Use of internet services in % of population (2010) 9
Figure 4 Influence factors: Parameters in the forecast model 11
Figure 5 Scenario “paper matters”: Assumptions on substitution rates and price
developments per mail segment 15
Figure 6 Scenario “base case”: Assumptions on substitution rates and price
developments per mail segment 16
Figure 7 Scenario “digital world”: Assumptions on substitution rates and price
developments per mail segment 16
Figure 8 Structure of domestic mail in 2010, 2015 and 2020 (“base case”) 17
Figure 9 Trend forecast: total domestic mail volume 2010-2020 18
Figure 10 Volume trends for domestic mail per segment 2010-2020, scenarios 19
Figure 11 Trend forecast total international mail volume 2010-2020 20
Figure 12 Trend forecast: total universal service mail volume 2010-2020 23
Figure 13 Domestic mail volume: universal service share in 2010 24
Figure 14 Trend forecast: domestic universal service mail volume 2010-2020 24
Figure 15 Estimated market shares per segment by volume (2010) 26
Figure 16 Expected development of market shares per segment by volume
(2010/2015/2020) 27
Figure 17 Price trends for domestic mail per segment 2010-2020, scenarios 31
Figure 18 Use of eGovernment services in The Netherlands (2010) 34
Figure 19 Trend forecast: social mail 2010-2020 35
Figure 20 Average number of letters and greeting cards sent by individuals
per month (2003 and 2010) 36
Figure 21 Trend forecast: office mail 2010-2020 38
Figure 22 Volume shares per payment channel used by SME’s 39
Figure 23 Trend forecast: transaction mail 2010-2020 41IV Developments in the Dutch Postal Market
Figure 24 Individuals’ use of the Internet for interaction with public authorities (2010) 43
Figure 25 Trend forecast: advertising mail 2010-2020 45
Figure 26 Use of addressed and unaddressed direct mail depending on
enterprise size 47
Figure 27 Trend forecast: periodicals 2010-2020 49
Figure 28 Trend forecast: international inbound mail 2010-2020 51
Figure 29 Trend forecast: international outbound mail 2010-2020 53
Figure 30 Market size and structure of X2C parcel segment 56
Figure 31 Market size and structure of 2B parcel segment 57Developments in the Dutch Postal Market V
List of tables
Table ES-1 Volume trends for domestic mail segments by 2015 and 2020,
all scenarios ii
Table 1 Segmentation of the Dutch mail market 4
Table 2 Development of competition and prices 30
Table 3 Segmentation of the Dutch mail market 59
Table 4 Share of sub-segments in the segment domestic mail 60
Table 5 Share of level 2 sub-segments in the level 1 sub-segment letters 60
Table 6 Share of priority mail and non-priority mail in the relevant segments 60
Table 7 Market share of the Dutch incumbent in the sub-segment letters (2010) 61
Table 8 Assumptions on shares of priority mail 62
Table 9 Assumptions for incumbent’s market shares 63
Table 10 Assumptions on shares of universal service mail 63
Table 11 Assumptions on price developments (per scenario) 64
Table 12 Assumptions on price elasticities 65
Table 13 Assumptions on substitution rates (per scenario) 66
Table 14 Assumptions on the population growth rate 67
Table 15 Assumptions on the elasticity related to population growth 67
Table 16 Assumptions on GDP growth rate 67
Table 17 Assumptions on the elasticity related to GDP growth 68VI Developments in the Dutch Postal Market List of abbreviations B2B Business to business B2C Business to consumer (individuals) bn billion C2C Consumer to consumer CAGR Compound annual growth rate CLA Collective labour agreement CPB Centraal Planbureau DDMA Dutch Dialogue Marketing Association e.g. for example g Gram h Hour i. a. inter alia (among other things) IPC International Post Corporation kg Kilogram m million NMa Nederlandse Mededingingsautoriteit NUV Nederlands Uitgevers Verbond (Dutch Publisher Association) OPTA Onafhankelijke Post en Telecommunicatie Autoriteit OVO Overeenkomst van opdracht SME Small and medium-sized enterprises SOHO Small office, home office VGP Vereniging Grootgebruikers Postdiensten UPU Universal Postal Union US Universal service
Developments in the Dutch Postal Market i
Executive summary
The Ministry of Economic Affairs, Agriculture and Innovation commissioned WIK to
prepare a study on future developments in the Dutch postal market. This study was
prepared between May and August 2011.
Based on extensive desk research and interviews with postal operators, mailers and
associations, WIK expects that domestic and international mail volumes will continue to
decline.
Figure ES-1 Trend forecast: total domestic mail volume 2010-2020
5,000 Volume decline
2010-2020
4,500
4,000
3,500 -26%
3,000 -36%
2,500 -47%
2,000
1,500
1,000
Paper matters
500 Base case
Digital world
0
2010 2015 2020
Source: Estimation WIK-Consult
The figure below presents our estimate for the future development of domestic mail
volume in the Netherlands, for three scenarios called “paper matters”, “base case” and
“digital world”.
From 2010 onwards, we expect that domestic mail volume will decline between 3.0 and
6.2 per cent per year, i.e. domestic mail volume will decline between 15 to 26 per cent
until 2015, and between 26 and 47 per cent until 2020.
However, volume developments differ between mail segments (see table below)
Transaction mail, including regular invoices, statements and notifications to
consumers and businesses, will decline most substantially of all segments, driven
by digitalisation and the active promotion of digital channels.ii Developments in the Dutch Postal Market
The development of social and office mail (daily correspondence from businesses
and institutions) is more influenced by continuous changes in communication
behaviour. Volume losses in these segments are expected to be lower than for
transaction mail.
Addressed advertising mail will maintain its position in the marketing mix of
advertisers. Volumes will decline slightly, less than total letter volume.
Periodicals are also challenged by digitalisation but increasing variety of titles and
the traditionally close relationship of Dutch people to paper-based magazines limits
this process.
Table ES-1 Volume trends for domestic mail segments by 2015 and 2020, all
scenarios
Total volume change in % Total volume change in %
2010-2015 2010-2020
Scenario Letters Advertising Periodicals Letters Advertising Periodicals
mail mail
Paper matters -21% -6% -9% -33% -15% -19%
Base case -27% -11% -13% -45% -22% -25%
Digital world -34% -16% -17% -55% -36% -37%
Source: Estimation WIK-Consult
The negative mail trend also affects the volume of universal services (defined by postal
legislation as single piece domestic mail and all international mail). In the three different
scenarios, universal service volume will drop by 20 to 28 per cent until 2015, and by 32
to 49 per cent of today’s volume until 2020. Overall, the share of universal service
volume in total letter volume will decline because of the continuous migration of from
universal service products to non-universal products, particularly in the office mail
segment.
Recent data reported by OPTA for 2010 and by PostNL the first three quarters of 2011
(after completion of our forecasts) suggests that the Dutch mail volume is currently
developing more in line with the “digital world” scenario than with the base case. In
November 2011, the “digital world” scenario therefore appears as the most likely
scenario.1
1 This paragraph was added to the report in November 2011.Developments in the Dutch Postal Market iii
Figure ES-2 Structure of domestic mail in 2010, 2015 and 2020 (“base case”)
2010 2015 2020
Periodicals Periodicals Periodicals
13% 15% 16%
Letters
Advertising mail Letters 50%
Letters 53%
29% Advertising mail
58% Advertising mail
32%
35%
Source: Estimation PostNL (2010), Estimation WIK-Consult (2015 and 2020)
For the foreseeable future, we expect that businesses and individuals will continue
mailing addressed advertising mail, periodicals and letters even though this report
cannot forecast a possible bottom line for mail volume. Even after 2020, there will be
individuals who are either not able to switch to digital communication or who still prefer
paper communication, at least for some types of communication. For example, we
expect that Christmas and greeting cards, and addressed advertising mail will not be
substantially replaced by digital solutions soon. The composition of mail is clearly
changing: As overall volumes decline, letters are becoming a less important part of mail,
and advertising and periodicals are getting relatively more important (see figure above).
In contrast to the negative volume trend in mail, the Dutch parcel market, particularly
the B2C segment (business parcels sent to consumers), is dynamically growing with
exceptionally high growth rates. The key players in the Dutch mail market, PostNL and
Sandd, are both trying to capitalize on this opportunity: PostNL is intensifying its
domestic and cross-border parcel activities while Sandd plans to enter the parcel
market next year.
Two years after full market opening the acquisition of Selekt Mail by Sandd has led to a
quasi-duopoly in the Dutch mail market. WIK expects that this duopoly will be stable as
long as both companies are successful in further improving productive efficiency,
limiting future cost increases, and extending their business activities into growing areas.
We expect that prices in the Dutch postal mail market will increase in most segments.
Price developments in the postal market are influenced by a number of factors, most
important of which are price elasticity, competition and substitution. Price elasticity gives
an indication of the expected market volume change with a price change for different
market segments, irrespective of competitive pressure or effects of, for example,
digitalisation. Competition has a disciplining effect on the pricing policy of postaliv Developments in the Dutch Postal Market
operators. Digitalisation also has such a disciplining effect since it leads to a decline in
total volumes and subsequently more competitive pressure over the remaining volumes.
However, because of the lower total market volume, digitalisation also puts pressure on
postal companies to increase prices to compensate higher cost per post item. The price
increases we expect will partly be driven by the foreseen collective labour agreement
between PostNL’s competitors in the mail market and the unions, and the resulting
wage increases. Price increases will vary between segments, depending on current
price levels and intensity of competition in each market segment:
Price increases will be limited and, at most, reflect future cost increases in the most
competitive mail segments: advertising mail and periodicals.
Prices in segments with little competitive pressure will rise more substantially. This
particularly affects priority mail services, and thus domestic universal services. Much
of these price increases will result from a decline in priority volumes, and the higher
average cost at lower volume (the extra cost for next-day delivery will have to be
funded by fewer priority letters, and average cost for priority letters increase).
We expect prices will not increase much, and may in fact decline in those segments
where more competition is expected for the future. These segments are non-priority
products for office mail and transaction mail.Developments in the Dutch Postal Market 1
1 Introduction
1.1 Background and objectives of the study
Postal markets worldwide face declining mail volumes, while parcel markets, particularly
the delivery of parcels to consumers, are growing. The Netherlands is one of the
European countries that appears to be most affected by declining mail volumes. PostNL
(formerly TNT Post) claims in its 2010 annual report that “the ongoing substitution of
physical mail by electronic forms of communication and competition in the first full year
of a liberalised market led to a letter volume decline in the Netherlands of 9.0%”2.
The Ministry of Economic Affairs, Agriculture and Innovation commissioned WIK to
prepare a study on future developments in the Dutch postal market. More specifically,
the Ministry requested answers to the following research questions:
What factors will influence the development of the postal market in the years to
come and in what ways?
What will be the volume of the postal market and its various market segments in
2015 and 2020?
What portion of this volume falls under Universal Service and how great is the
demand for Universal Service?
What does this mean for the viability of postal companies and competition?
How will prices develop in the postal market?
What does it mean for the position of mail carriers?
In what ways does the government have an influence on postal market
developments?
The main purpose of the study is to provide data and background information on the
developments in the Dutch postal market to the Ministry and Parliament to support
upcoming reviews of Dutch postal legislation.
The report is structured in two major parts. In chapter 2, we provide the overall market
assessment. In this chapter each of the research questions listed above will be
addressed, based, where possible, on a quantitative assessment, and on a qualitative
assessment. In chapter 3, we first present the forecast results for each segment and,
second, assess and explain the developments of each mail segment in more detail.
2 TNT, Annual Report 2010, p. 6.2 Developments in the Dutch Postal Market
1.2 Market segmentation
Any market segmentation depends on the purpose of the analysis. In many studies3 the
segmentation departs from operational (i.e. supply-side) product features. The primary
objective of this study is to forecast future developments of mail volumes, and our
segmentation serves this purpose. In this study we combine the operational view with a
more demand-oriented view in order to clearly separate differences; first, in relevant
influence factors that affect volume development; and second, in competition intensities.
Additionally, restrictions on data availability were taken into account.
We distinguish between the Dutch mail and the Dutch parcel market. The mail market
consists of domestic and international mail. Domestic mail is split into letters,
advertising mail and periodicals. Letters play the most important role in the Dutch mail
market in terms of volume and revenues and are further broken down into social mail,
office mail and transaction mail:
Social mail consists of single-piece letters sent between individuals, mainly
greeting and Christmas cards, and from individuals to businesses (including
public authorities). These letters are stamped single-piece items, thus universal
service letters, and usually delivered the next working day by PostNL (priority
respectively 24-hour delivery service).
Office mail consists of single-piece letters sent between businesses (including
public authorities) and from businesses to individuals for daily communication
purposes. Office mail is sent by all groups of business mailers: small, medium-
sized and large businesses and public authorities. It is usually unsorted and
heterogeneous in format and weight. Only part of office mail is sent as universal
service mail (i.e. as “losse post” as offered by PostNL for stamped and franked
mail), particularly by small and medium-sized enterprises.4 Business customers
have the opportunity to use a special bulk mail product of PostNL called
“Postage paid mixed”.5 Additionally, mailers may consolidate their office mail
within the company and benefit from PostNL’s special tariffs (e.g. volume
discounts). Office mail is usually delivered the next working day (priority mail or
24-hour delivery service). Recently, the PostNL’s major competitor Sandd has
introduced a non-priority delivery service for unsorted office mail.6
Transaction mail is industrially produced bulk mail sent by a relatively small
number of business customers and thus not part of the universal service. Large
mailers are for example banks and insurance companies (bank statements and
3 E.g. EIM (2005), RBB Economics (2007), OPTA (2010).
4 Intomart GfK (2011), Onderzoek naar de betekenis, behoeften en belang van post en de
postdienstverlening, Table 3.4, p. 21. On average, surveyed SME’s sent around 70% of their letters
stamped or franked (with the NetSet contract), i.e. as universal service mail, per month.
5 See PostNL, Tariffs January 2011, Business products and services, p. 26.
6 Interview Sandd.Developments in the Dutch Postal Market 3
notifications), telecommunication companies and utilities (invoices) and public
authorities. They have the choice between next day delivery services (24-hour
delivery service offered by PostNL) and non-priority services with longer delivery
times (48-hour and 72-hour delivery service of PostNL, two-day per week
delivery service of Sandd) and benefit from special rates for postal delivery. In
this study transaction mail is further segmented into priority and non-priority mail
because of emerging competition in the non-priority mail segment.
Addressed advertising mail is, similar to transaction mail, also industrially
produced bulk mail. However, contents are different. While transaction mail, like
bank statements and invoices, is part of the contractual relationship between
businesses and their customers, advertising mail is part of the marketing mix of
businesses. Advertising mail supports companies’ efforts to retain existing
customers and to acquire new customers. Sponsored magazines (e.g. BMW
magazine) that are mainly published for strengthening specific labels and
trademarks are also part of advertising mail. By definition, advertising mail is not
within the scope of universal service. Key players in this segment are PostNL
and its subsidiary Netwerk VSP, Sandd and, until recently, Selekt Mail (acquired
by Sandd this spring).
Periodicals consist of subscribed magazines (weeklies, two-weeklies, monthlies)
and club magazines (e.g. published by the Royal Dutch Touring club ANWB). In
the Netherlands subscribed magazines are mainly delivered by postal operators
(i.e. PostNL and Sandd). Periodicals are usually sent in bulk and not part of the
universal service mail.
International mail is split into international inbound and outbound mail. International
inbound mail (letters, advertising mail and periodicals) are sent from abroad to
destinations in the Netherlands. International outbound mail is sent from the
Netherlands to destinations abroad. Due to data limitations and the relatively low
volume share of international mail we refrain from further disaggregating these
segments. All international mail collected and delivered by PostNL is part of the
universal service, independent whether sent as single-piece or in bulk.4 Developments in the Dutch Postal Market
Table 1 Segmentation of the Dutch mail market
Level 0 Level 1 Level 2 Level 3
Social mail
Priority mail
Office mail
Letters Non-priority mail
Domestic mail Priority mail
Transaction mail
Non-priority mail
Advertising mail
Periodicals
Inbound
International mail
Outbound
Source: WIK Consult.
In this study we have developed a quantitative forecast model that solely refers to the
Dutch mail market segments. In this model the future volumes for each sub-segment of
domestic mail, i.e. social mail, office mail, transaction mail, advertising mail and
periodicals, and for international inbound and outbound mail are estimated taken a
bundle of influence factors into account (see section 2.1 for more detail).
Based on more qualitative assessments we will discuss trends in the market for
standard parcels (or deferred parcels, i.e. without accelerated delivery that is usually
offered at higher prices). Special focus will be laid on four segments:
Packages and parcels sent between individuals and from individuals to businesses
(often “return to sender” parcels in relation with distance selling activities). Parcels
sent between individuals are usually universal service parcels.
Packages and parcels sent from businesses to individuals, usually distance selling
parcels (goods ordered by phone, post or via internet, so-called e-commerce).
These are parcels sent in bulk and are usually outside the scope of universal
service.
Packages and parcels sent between businesses (mostly outside the scope of
universal service).
International parcels that include international inbound and outbound parcels
Other segments of the wider market for parcels and express services comprise express
delivery and courier services that are outside the scope of this study. Various routing
times, many of which are considered express services, are abundant particularly in the
B2B segment. Note that in the highly competitive market for parcels and express
services, it is increasingly difficult to separate traditional parcel services from express
services. The trend seems to be that express services on the one hand and traditionalDevelopments in the Dutch Postal Market 5
parcel services (provided by the incumbent PostNL) on the other hand are merging into
one market. This is reflected by two separate developments. First, established express
operators (such as TNT express, FedEx or DHL) are now offering a diverse bundle of
services, including “deferred” services that are often similar to traditional parcel
services. Second, the quality of PostNL’s traditional parcel service has increased over
the last decades to such a standard that parcel services today have become more
similar to what was considered an express service previously. TNT Express states that
there are “blurring boundaries between the various segments of the transportation
industry”7 and the company plans to expand “to a larger addressable market, which
includes the parcel market not normally classified as express (standard parcels),
business-to-consumers (B2C) and intercontinental shipments”8.
1.3 Methodology
The methodology of the study includes the following elements:
Extensive desk research (Dutch and international studies)
Interviews with postal operators and postal customers
Forecast model for the quantitative assessment of volume developments in the mail
segments
Extensive desk research
The study team has collected specific data through extensive desk research, including:
Reports on the Dutch mail markets (e.g. commissioned resp. published by the
Ministry of Economic Affairs, OPTA, TNT, unions (ABVAKABO FNV, BVPP, CNV
Publieke zaak, CNV Bedrijvenbond and FNV Bondgenoten), associations and
independent consulting companies)
Information on the Dutch markets for advertising and periodicals (as published by
associations, e.g. NUV or DDMA)
Annual reports and publications of Dutch regulatory authorities (Ministry of
Economic Affairs, OPTA)
Annual reports, presentations and other publications by Dutch postal operators
European and international studies on market developments and electronic
substitution (e.g. studies commissioned by the European Commission, studies on
communication trends published by IPC and Pitney Bowes, and studies on
international mail by UPU)
Statistical data (Statistics Netherlands, Centraal Planbureau, Eurostat)
7 TNT Express, Annual Report 2010, p. 12.
8 TNT Express, Annual Report 2010, p. 21.6 Developments in the Dutch Postal Market
Interviews with postal operators, postal customers and associations
The project team has undertaken substantial efforts for primary research activities with
stakeholders. Interviews have been conducted with Dutch regulator OPTA and the
postal operators PostNL and Sandd. Additionally, we cooperated with associations
representing large mailers (VGP), marketers (DDMA), publishers (NUV) and the
distance selling industry (Thuiswinkel). We spoke to customers from the financial
industry, telecommunications and the public sector, representing in sum around one
fifth of the Dutch mail market (~1 billion mail items), to get a deeper understanding of
the demand for Dutch postal services. We gratefully acknowledge the collaborative
assistance received in the preparation of this report from the Ministry, OPTA, PostNL
and Sandd, the associations and from the mailers we talked to.
Forecast model for volume developments in the mail segments
The quantitative forecast is based on an Excel-based spreadsheet model. The model
comprises the segments of the Dutch mail market which are introduced in section 1.2.
As output it provides the mail volumes per mail segment in the years 2015 and 2020,
respectively.
The model is based on a partial approach which incorporates the direct effects of the
main influencing factors. The relevant influence factors have been identified taking into
account the findings of our market research. These factors are mainly price effects,
substitution effects and macro-economic effects. In order to limit the model complexity
neither interdependencies between the factors (i.e. indirect effects) nor second-round
effects are considered. The total volume effect results from the sum of each of the direct
effects. We have included in the model the following input parameters:
the share of priority mail and non-priority mail for office mail and transaction
mail;
PostNL’s market shares for each mail segment;
the share of mail considered as universal service according to Dutch postal
legislation (in relation to estimated PostNL’s mail volume);
price factors (expected price changes and price elasticities);
substitution rates; and
macroeconomic-based effects.
The parameterization of the input variables is based on WIK assumptions which we
derived from the research part of this project (extensive desk research and interviews
with customers, associations and postal operators) and from our long standing market
expertise. Furthermore, model inputs were discussed with the operators PostNL and
Sandd. More details on the model can be found in the annex.Developments in the Dutch Postal Market 7
2 Overall market assessment
2.1 Influence factors of the postal market and scenario building
Postal markets are affected by a number of factors as presented in Figure 1. However,
the intensity with which the markets are affected varies between each factor and
depends which segment of the postal market is considered.
Figure 1 Influence factors of the postal market
Cost saving and
Digitalisation efficiency measures of
mailers
Postal market
Competition and postal Economic and
prices population growth
Digitalisation
In the postal world, digitalisation describes the process from paper-based to electronic
or digital communication. Postal operators consider this process as the major threat for
the future of the mail business.9 For letters, this means that, among others, invoices,
notifications or statements are sent by e-mail or can be collected from a company’s
website. In the case of advertising and periodicals, digitalisation means that with
emerging online media an additional channel has been created to get into contact with a
company’s customers (e.g. by blogs or social networks), to place advertisements or to
publish news and information. This new channel competes with more traditional ways of
advertising and with the paper-based way of publishing newspapers and magazines. In
this respect postal services are affected more indirectly: Advertisers decide how to
distribute their budget to competing advertising media. If these budgets do not grow (as
happened in the last years) and the number of advertising options increases, then the
piece of the cake for each of the competing options becomes smaller. In the case of
publications the impact is even more indirect. Postal operators have only limited
influence on the development of subscriptions of paper-based dailies and magazines. If
readers decide to switch to online dailies and magazines, subscriptions will decline
which in turn implies less volume to deliver for postal operators.
9 See i.a. IPC (2011), Role of Mail 2020 and current annual reports of TNT, Deutsche Post DHL, Itella,
Posten Norden (now PostNord).8 Developments in the Dutch Postal Market
The basic condition for a successful process of digitalisation is the existence of a
powerful digital infrastructure. This precondition is perfectly fulfilled in the Netherlands;
the country is leading in fixed broadband penetration with 38.1 fixed broadband
subscriptions per 100 inhabitants (see Figure 2) and reaches the same penetration rate
for mobile broadband subscriptions.
Figure 2 Fixed (wired) broadband penetration per 100 inhabitants, for
leading OECD countries, December 2010
40 Netherlands
Switzerland
35
Denmark
30
Norway
25 Korea
Iceland
20
Sweden
15
10
5
0
Source : OECD
Source: OECD Broadband statistics [oecd.org/sti/ict/broadband]
Within the European Union, and even worldwide, the Netherlands is a leader with
regard to internet and broadband connection as recently acknowledged by the Dutch
Ministry of Economic Affairs, Agriculture and Innovation:
“The Netherlands is one of the global leaders when it comes to broadband
coverage, thanks to competition in and between various networks. Access to high-
speed broadband in the Netherlands is already close to the European targets for
2020: 98% of Dutch households already have access to broadband with a speed
of 30 Mbps, and more than 90% have connections with speeds of at least 100
Mbps. Given the national availability of satellite (currently up to 4 Mbps), there is
100% coverage for functional Internet access.”10
As the infrastructure has successfully been established at this point in time, it depends
on the communication and the buying behaviour of Dutch people whether the existence
10 Ministerie van Economische Zaken, Landbouw en Innovatie (2011), Digital agenda.nl, p. 14.Developments in the Dutch Postal Market 9
of a high-capacity digital infrastructure had and will have an impact on the postal
market.
Figure 3 Use of internet services in % of population (2010)
90%
80%
70%
60%
50%
40%
30%
20%
10%
0%
Reading online Internet banking Using the Internet for Using the Internet for Ordering goods or
newspapers/magazines interaction with public interactions with public services for private use
authorities authorities: Sending filled
forms
DK FI NL NO SE EU-27 average
Source: Based on Eurostat, Benchmarking Digital Europe: 2011-2015 indicators (Percentage of individuals
aged 16 to 74)
The degree of “digital acceptance”11 is reflected in the intensity with which Dutch people
use online services, such as reading online newspapers magazines, internet banking,
eGovernment services or ordering goods and services through the internet. Particularly
with regard to the last activity, Dutch people ranks second EU wide.12 Figure 3 shows
that already in 2010 the digital acceptance of the Dutch population in terms of use of
internet services was substantially higher than the EU average. The intensity of using
online services by Dutch people is comparable to the Scandinavian countries that are in
our view the most advanced European countries in terms of “digital acceptance”.
Overall, we estimate that due to the relatively high degree of digital acceptance in the
Dutch population, the current and future influence of digitalisation on the Dutch postal
market is more significant than in many other European countries.
11 This expression is used in IPC (2011), Role of Mail 2020, and means the degree that people and
businesses make use of internet and online services.
12 European Commission (2010), Europe’s Digital Competitiveness Report, ICT Country Profiles, The
Netherlands, p. 175.10 Developments in the Dutch Postal Market Cost saving and efficiency measures Digitalisation is not the only factor that results in declining mail volumes. The financial crisis 2008/2009 has revealed that bulk mailers and advertisers look for more (cost) efficient ways to distribute their messages. The potential of such measures is limited for social and office mail compared to transaction and advertising mail. The potential for cost saving is particularly relevant for transaction mail: The relationship between production and delivery cost of one transaction item is around 1 : 5.13 In the case of transaction mail, measures like reducing the mailing frequency of invoices and statements (e.g. from monthly to quarterly) can substantially reduce letter volume. Advertisers have improved efficiency of addressed direct mailings by better analysing existing customer data and creating more customer-targeted advertisements.14 This is reflected in a general trend of declining direct mail items per advertising campaign. However, whether this development results in overall declining mail volumes depends on how the total number of advertising campaigns develops. Other measures to save costs do not result in declining mail volume but change the mail volume structure. Instead of using the relatively expensive 24-hour delivery service, bulk mailers increasingly switch to 48-hour delivery service or even 72-hour / next week delivery services. The economic crisis 2008/2009 has accelerated this development as not only observed by PostNL15, but also by foreign postal operators that offer priority and non-priority delivery services.16 Additionally, they may switch from the incumbent PostNL to cheaper competitors like Sandd. However, while mail volumes remain roughly stable in these cases, market revenues (and possibly margins) decline. Postal prices and competition Postal prices combined with service quality and service innovations (also in terms of customer orientation) are the key measures of postal operators to influence demand for postal services. Competition within the postal market promotes the development of new services and alignment of prices to costs. The developments in competition are addressed in section 2.5 of this chapter, while current and estimated future price developments in the Dutch postal market are summarized in section 2.6. 13 Customer interviews. In future this relationship may slightly change because of the introduction of colour printing. 14 See IPC (2011), Role of Mail 2020, p.29-30. 15 See TNT Post, Annual Report 2010, p. 38: “The continued underlying decline in addressed postal item volumes in 2010 was primarily due to a decline in single items and reduced demand for bulk mail as a result of cost saving programmes initiated by some of Mail’s key customers and due to the continued substitution by electronic media. The economy product delivered through TNT Post and the budget mail service delivered through Netwerk VSP retained volumes in the market, resulting overall in a limited loss of volumes to competition.” 16 See for example Posten Norden, Annual Report 2010, p.5 (results for Denmark and Sweden) and Itella, Annual report 2010, p. 12: While first class letters have substantially declined, second class letters remained fairly stable or even increase.
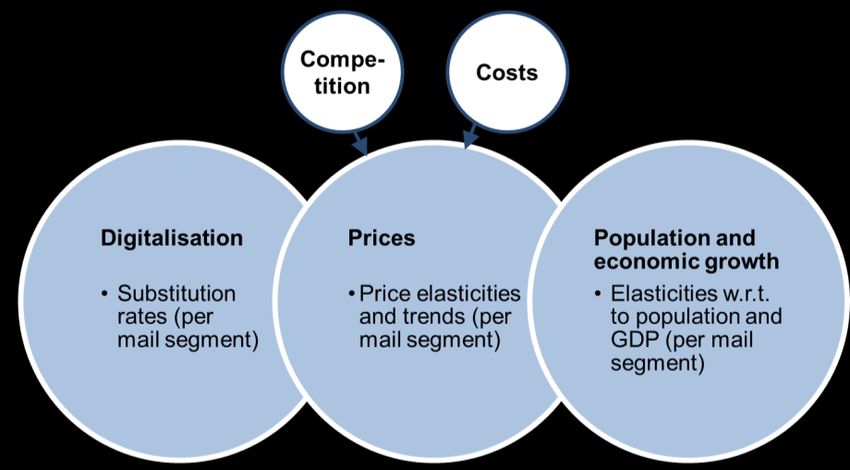
Developments in the Dutch Postal Market               11

Macro-economic factors

Economic, population or household growth17 and the general development of prices
(inflation rates) are the most important macro-economic factors affecting developments
in the postal market. The economic and demographic developments generally influence
the demand for postal services; an increasing number of households, for example,
results in more invoices (e.g. for energy, water and so on). The inflation rate influences
cost and price developments in the postal sector. Additionally, the development of
consumer prices (measured with the consumer price index) is an important benchmark
in Dutch price regulation for the universal service.

2.2   Forecast model, assumptions, and scenarios

2.2.1 Key assumptions

In order to quantitatively estimate the future volume developments in the Dutch mail
market we have developed an Excel spreadsheet model that takes into account each of
the discussed influence factors. Figure 4 shows the indicators our model uses to
translate the influence factors into estimates of mail volume.

Figure 4              Influence factors: Parameters in the forecast model

The total change in volume per mail segment is the sum of effects resulting from
digitalisation, price changes and macro-economic influences.

17 See for example IPC (2011), Role of Mail 2020.
12 Developments in the Dutch Postal Market
The following paragraphs describe key assumptions of our model. These assumptions
are identical for all scenarios.
Digitalisation is reflected in the substitution rates our model assumes. It covers the
change in mail volume due to digitalisation of communication, advertising and
publishing activities. The substitution rate describes the percentage change in
volume per year for each mail segment (i.e. social, office and transaction mail,
advertising and periodicals as well as international inbound and outbound mail).
Generally, we assume that substitution rates for the letter segments (social mail,
office and transaction mail) are higher than for advertising and periodicals.
Substitution rates for advertising and international mail are lowest. Particularly for
advertising mail, interview partners expect that the sharp decline in transaction mail
will be accompanied by increasing advertising mail volumes in order to remain in
contact with customers (customer retention). Based on interviews and desk
research we further assume that substitution is by far highest in the transaction mail
segment and that in this segment the peak in volume declines will be reached
before 2015 resulting in declining rates after 2015. Our detailed assumptions about
future substitution, for three different scenarios, are stated in subsection 2.2.2
below.
In our model, the price effect is a combination of price elasticity and the assumed
change in postal prices.
o A price elasticity describes the quantitative relationship between a price
change and a volume change: A price elasticity of -1 means that a 1 per cent
increase in prices results in 1 per cent decline in volumes. E.g. -0.5 implies
that the volume decline would be 0.5 per cent (after a 1 per cent price
increase). A price elasticity measures the expected market volume change
that results from a price change for different market segments, In reality,
price elasticity depends on many things, such as competitive pressure or
possible substitute product, or (in the postal case:) digitalisation. In our
model, however, price elasticity does not include the effect of e-substitution,
for technical reasons. E-substitution is included in the model as a separate
factor, the substitution effect.18 Empirical studies found out that in mail
markets price elasticities are usually between -1 and 0.19 In empirical
research the level of the own price elasticity always depends on how many
additional influence factors are taken into account. In the forecast model, we
assume per mail segment price elasticities between -1 and 0 that are
18 Note that e-substitution happens even without any changes in price. While price increases may
accelerate e-substitution, volumes can get lost to digital media even if prices stay constant, or
decrease.
19 See for example Alan Robinson (2007), A Review of Price Elasticity Models for Postal Products,
Background Paper No. 2007-01 prepared as part of the Pitney Bowes research project “The Future of
Mail”.Developments in the Dutch Postal Market 13
constant over time.20 The absolute levels per segment are derived from
empirical studies about price elasticities in the postal market and vary
between the segments: We assume the lowest price elasticities for social
and office mail (-0.2 resp. -0.25), while for transaction mail we assume a
slightly higher level in absolute terms (-0.3) because – as we learnt in
interviews – bulk mailers reduced and will continue to reduce mail volumes
by other measures than digital substitution, e.g. by reducing the mailing
frequency of regular statements.21 The price elasticity is highest for
advertising mail and periodicals (-0.5). The reason for this is that besides
using digital forms of advertising instead of direct mail, advertisers may also
switch to unaddressed advertising that is substantially cheaper in delivery, or
alternative media (e.g. TV). Publishers may promote other sales channels for
distributing their magazines.
o Assumed price changes refer to average price levels per segment and not to
prices for single products. Expected price changes depend on the
competitive situation within the postal market and the substitution rate.
Competition limits price increases and may even promote price declines. For
this reason, we allow for different price development paths for each mail
segment including priority and non-priority services for office and transaction
mail. While priority mail services are mainly provided by PostNL, the non-
priority mail services are somewhat more competitive. Price changes and
substitution rates in practice are positively correlated: the more prices
increase the higher are the substitution rates. Postal operators are aware
that too drastic price increases promote substitution. For this reason
digitalisation has a disciplining effect on postal operators’ pricing strategies
since it leads to lower total volumes and higher competitive pressure on the
remaining volumes. However, substitution does not merely occur because of
price developments, since even if prices remain stable substitution still exists
(as has happened the last years). With a smaller total volume, average costs
per mail item will increase, putting upward pressure on prices. Therefore, the
more volumes decline due to digitalisation, the higher the expected price
increases (resp. the lower expected price declines). For this reason, we
expect that high substitution rates resulting in substantial volume declines
will result in higher price increases than low substitution rates.
Macro-economic effects, e.g. volume changes due to population and economic
growth, are included by elasticities that translate macro-economic economic growth
into mail volume growth rates. In the model, we assume that economic growth (i.e.
20 In order to limit complexity of the model, we assume price elasticities that are constant over time and
independent from the rate of price change. In reality, price elasticities depend on various factors,
including the amount of a price change. For example, a price elasticity may be higher the higher the
rate of price change (‘increasing elasticity to scale’).
21 For more information see section 0.14 Developments in the Dutch Postal Market
GDP growth) does not have an impact on volume development of letters and
periodicals. During the last decade volume development and GDP growth appear to
be increasingly unrelated – with the exception of advertising mail.22 For this
segment we assume an elasticity of 0.2. With regard to population growth, we
assume the elasticity to be 1 for all mail segments except for international outbound
mail.23
Finally, we assume that the current regulatory framework, particularly the definition
of the universal service and the universal service obligation of PostNL will not be
changed during the forecast period.
2.2.2 Three scenarios for the future role of mail
Future mail volume development will depend on more general future trends in the
communication and the mailing behaviour of Dutch citizens and businesses. In our
model, this behaviour is expressed in the substitution rates we assume (for each
segment).
While postal operators in the Netherlands have suffered from substantial volume losses
in 2009 and 2010, the precise share that substitution has contributed to these losses is
uncertain. Likewise, it is uncertain ‘how much more is to come’. Will substitution
continue at current (high) levels? Will it disappear? Will this trend speed up? Based on
our interviews, we are convinced that substitution will not ‘go away’, and volumes will
continue to decrease, although it is very difficult to foresee by how much. However, it is
likely that the migration of other products for communication will reach a peak at some
point, and that substitution rates will decrease after that point. At present, it is not clear
whether the peak substitution rate has already been reached in 2010 or will be reached
by 2015, or even later.
In response to these uncertainties, we use three forecast scenarios that differ in the
substitution rates we assume for each segment, and in related future price
developments. These scenarios are named
“Paper matters”
“Base case”, and
“Digital world”.
Based on research and interviews, we consider all three scenarios as relevant
possibilities. Recent data reported by OPTA for 2010 and by PostNL the first three
22 See The Boston Consulting Group (2010), Projecting U.S. Mail Volumes to 2020, p. 10. In this study a
volume effects are expected for U.S. standard mail (advertising mail) due to economic growth. In
contrast, GDP growth does not affect U.S. first class mail (letters).
23 See IPC (2011), Role of mail 2020.Developments in the Dutch Postal Market 15
quarters of 2011 (after completion of our forecasts), suggests that the Dutch mail
volume is currently developing more in line with the “digital world” scenario than with the
base case. In November 2011, the “digital world” scenario therefore appears as the
most likely scenario. We recommend our results for the three scenarios should be
understood as a range of possible future volumes while in 2011 the market is
developing most in line with the “digital world” scenario.24
Figure 5 Scenario “paper matters”: Assumptions on substitution rates and
price developments per mail segment
10% 160
9% 150
8% 140
7%
130
Substitution rate
6%
Price index
120
5%
110
4%
100
3%
90
2%
80
1%
70
0% Priority Non-priority Priority Non-priority
Social mail Office mail Transaction Advertising Periodicals Int. inbound Int. outbound Social mail Office mail Transaction mail Advertising Periodicals International International
mail mail mail inbound outbound
2010 2015 2020 2010 2015 2020
Source: WIK estimations
Note: In the spreadsheet model the parameter values between 2010 and 2015 (i.e. for 2011, 2012, 2013
and 2014) as well as between 2015 and 2020 are calculated by linear interpolation.
In the scenario “paper matters” the switch from paper-based to electronic media will be
less rapid than was witnessed in recent years. Particularly, we assume that the peak
substitution rate has already been reached in the segments for social, office and
transaction mail. Volumes in these segments will continue to decline until 2020, but at
lower rates. Prices increase only slightly as the relatively high volumes prevent drastic
increases in average cost. For advertising, periodicals and international mail we
assume constant, low substitution rates.
24 This paragraph was altered in November 2011, after completion of the report in August 2011.16 Developments in the Dutch Postal Market
Figure 6 Scenario “base case”: Assumptions on substitution rates and price
developments per mail segment
10% 160
9% 150
8% 140
7%
130
Substitution rate
6%
Price index
120
5%
110
4%
100
3%
90
2%
80
1%
70
0% Priority Non-priority Priority Non-priority
Social mail Office mail Transaction Advertising Periodicals Int. inbound Int. outbound Social mail Office mail Transaction mail Advertising Periodicals International International
mail mail mail inbound outbound
2010 2015 2020 2010 2015 2020
Source: WIK estimations
Note: In the spreadsheet model the parameter values between 2010 and 2015 (i.e. for 2011, 2012, 2013
and 2014) as well as between 2015 and 2020 are calculated by linear interpolation.
In the “base case” scenario is based on research and various interviews we had carried
out in May and June 2011. In this scenario, we expect that substitution rates have
already peaked for social mail and will be increasing until 2015 for transaction mail.
Figure 7 Scenario “digital world”: Assumptions on substitution rates and
price developments per mail segment
10% 160
9% 150
8% 140
7%
130
Substitution rate
6%
Price index
120
5%
110
4%
100
3%
90
2%
80
1%
70
0% Priority Non-priority Priority Non-priority
Social mail Office mail Transaction Advertising Periodicals Int. inbound Int. outbound Social mail Office mail Transaction mail Advertising Periodicals International International
mail mail mail inbound outbound
2010 2015 2020 2010 2015 2020
Source: WIK estimations
Note: In the spreadsheet model the parameter values between 2010 and 2015 (i.e. for 2011, 2012, 2013
and 2014) as well as between 2015 and 2020 are calculated by linear interpolation.
In this last scenario, “digital world”, communication behaviour changes most rapidly. In
this scenario, new products and applications for digital communication are rapidly
becoming popular, thus fostering electronic substitution of letters, advertising, and
publications. This is reflected in relatively high substitution rates for all years. For
transaction mail the peak in the substitution rate will be reached by 2015, while social
and office mail would continue to decline at current (high) rates. Advertising mail andDevelopments in the Dutch Postal Market 17
periodicals, we assume, would be strongly affected by the increasing penetration of
mobile devices (e.g. smart phones and tablet PCs). The decline in mail volumes
substantially increases average costs and results in higher price increases compared to
the “base case”.
2.3 Volume development
Domestic mail volume
Figure 8 Structure of domestic mail in 2010, 2015 and 2020 (“base case”)
2010 2015 2020
Periodicals Periodicals Periodicals
13% 15% 16%
Letters
Advertising mail Letters 50%
Letters 53%
29% Advertising mail
58% Advertising mail
32%
35%
Source: Estimation PostNL (2010), Estimation WIK-Consult (2015 and 2020)
In 2010 about 4.7bn mail items were collected and delivered within the Netherlands.25
This compares to estimated 0.13bn mail items inbound international mail and 0.25bn
mail items outbound international mail. Letters account for 58 per cent of domestic mail,
while advertising and periodicals reach 42 per cent. We estimate that more than half of
letters were transaction mail. Office mail comprised around one-third; the rest (less than
15%) remained for social mail.
25 PostNL estimation.18 Developments in the Dutch Postal Market
Figure 9 Trend forecast: total domestic mail volume 2010-2020
5,000 Volume decline
2010-2020
4,500
4,000
3,500 -26%
3,000 -36%
2,500 -47%
2,000
1,500
1,000
Paper matters
500 Base case
Digital world
0
2010 2015 2020
Domestic Total volume change in % Average change rate per year
mail (CAGR, %)
Scenario 2010-2020 2010-2015 2015-2020 2010-2020 2010-2015 2015-2020
Paper matters -26% -15% -13% -3.0% -3.2% -2.8%
Base case -36% -21% -19% -4.3% -4.5% -4.1%
Digital world -47% -26% -28% -6.2% -5.9% -6.4%
Source: Estimation WIK-Consult
In each of the scenarios, we expect that the total domestic volume will decline. This
development basically results from the overall dominance of the substitution effect.
However, the pace of volume decline substantially varies between the scenarios. In the
base case domestic mail will decline by around one fifth until 2015 and more than one
third until 2020. Between 15 and 26 per cent until 2015 and between 26 and nearly half
of today’s volume until 2020 will vanish in the scenarios “paper matters” and “digital
world” respectively.Developments in the Dutch Postal Market 19
Figure 10 Volume trends for domestic mail per segment 2010-2020,
scenarios
5,000
BASE CASE Letters
4,500
Advertising mail
4,000 Periodicals
3,500
Volume decline
2010-2020
3,000
2,500
-45%
2,000
1,500
1,000 -22%
500
-25%
0
2010 2015 2020
5,000 5,000
Letters Letters
PAPER MATTERS DIGITAL WORLD
4,500 Advertising mail 4,500 Advertising mail
4,000 Periodicals 4,000 Periodicals
3,500 Volume decline 3,500
2010-2020
3,000 3,000 Volume decline
2010-2020
-33%
2,500 2,500
2,000 2,000
-55%
1,500 1,500
-15%
1,000 1,000
-36%
500 500
-19% -37%
0 0
2010 2015 2020 2010 2015 2020
Total volume change in % Total volume change in %
2010-2015 2010-2020
Scenario Letters Advertising Periodicals Letters Advertising Periodicals
mail mail
Paper matters -21% -6% -9% -33% -15% -19%
Base case -27% -11% -13% -45% -22% -25%
Digital world -34% -16% -17% -55% -36% -37%
Source: Estimation WIK-Consult
Overall, all mail segments face declining volumes, however, at different paces (see
Figure 10). Letter volumes will decrease the most, while the decline in advertising mail
and periodicals is substantially lower. This result in an increasing share of advertising
mail and periodicals in total domestic mail: in the scenarios “base case” and “digital
world” from today’s 42 per cent to about half of total domestic mail volume in 2020.26
The development of the letter volume is particularly driven by the drastic decline in
transaction mail. The share of transaction mail in total domestic mail sinks in our
estimation from today’s estimated one third to less than one quarter in 2020 in all
26 In the scenario “paper matters” the share increases to 48 per cent.20 Developments in the Dutch Postal Market
scenarios. The decline in social and office mail is less drastic, but still higher than
advertising mail and periodicals. In the long run (after 2020) we expect that addressed
advertising mail, periodicals and letters will continue to exist. The share of letters will
continue to decline mainly due to further substitution of office and particularly
transaction mail. However, after 2020 there will still be individuals who are either not
able to switch to digital communication or who still prefer paper communication.
Particularly, we do not expect that Christmas and greeting cards, which account for
roughly half of today’s social mail, will be fully replaced by digital solutions.
International mail
Figure 11 Trend forecast total international mail volume 2010-2020
700 Volume decline
2010-2020
600
-14%
500
-23%
-34%
400
300
200
100 Paper matters
Base case
Digital world
0
2010 2015 2020
International Total volume change in % Average change rate per year
mail (CAGR, %)
Scenario 2010-2020 2010-2015 2015-2020 2010-2020 2010-2015 2015-2020
Paper matters -14% -7% -7% -1.5% -1.5% -1.4%
Base case -23% -12% -13% -2.6% -2.5% -2.8%
Digital world -34% -16% -21% -4.0% -3.4% -4.7%
Source: WIK-Consult estimation
For international mail we expect less significant declines in each scenario. International
mail consists of mail items sent from the Netherlands abroad, or sent to the Netherlands
from other countries. We expect that declines in international mail volume will be
(somewhat) less significant than for domestic mail for three reasons: First, there will be
a positive marginal impact on international mail volumes in the future becauseYou can also read