Market and Trade Profile: Netherlands - Netherlands - February 2020 - VisitBritain

Page created by Ralph Powers
 
CONTINUE READING
Market and Trade Profile: Netherlands - Netherlands - February 2020 - VisitBritain
Market and Trade Profile Netherlands

Market and
Trade Profile: Netherlands

Netherlands – February 2020
Market and Trade Profile: Netherlands - Netherlands - February 2020 - VisitBritain
Market and Trade Profile Netherlands

Overview
•   ‘Chapter 1: Inbound market statistics’ provides insights on key statistics about
    Dutch travellers, where they are going, and who they are. It also takes a look at
    Britain as a destination and its competitive set.
•   ‘Chapter 2: Experiences and perceptions’ features details about what visitors
    from the Netherlands are likely to do in the UK, how they felt during their visit to
    the UK, and whether they would recommend a stay there to their acquaintances.
    Perceptions of Britain held by the Dutch in general are also highlighted.
•   ‘Chapter 3: Understanding the market’ takes a close look at consumer trends
    in the Netherlands, and the booking, planning and further travel behaviour of this
    source market. Some details on how to best reach Dutch consumers are laid out.
•   ‘Chapter 4: Access and travel trade’ shows how the Dutch travel to the UK,
    how to best cater for their needs and wants during their stay and gives insights
    into the travel trade in the Netherlands.
•   Further ways of working with VisitBritain and other useful research resources are
    pointed out in the appendix.

                                                                                                      2
Market and Trade Profile: Netherlands - Netherlands - February 2020 - VisitBritain
Market and Trade Profile Netherlands

Contents (1/2)
Executive summary (page 5)

Chapter 1: Market statistics
 1.1 Key statistics (page 10)
 Tourism context, UK inbound overview, key figures on journey purpose, seasonality, duration of stay,
 accommodation trends, travel companions, repeat visits, and visit types
 1.2 Getting around Britain (page 18)
 Where visitors stayed in the UK, places they visited, and internal modes of transport
 1.3 Visitor demographics (page 23)
 Demographic profile of Dutch visitors (age, gender)
 1.4 The UK and its competitors (page 27)
 How visits to the UK compare to main competitor destinations, and long-term trend and forecasts

Chapter 2: Experiences and perceptions
 2.1 Inbound activities (page 30)
 What activities Dutch visitors undertook in the UK
 2.2 Welcome and recommending Britain (page 37)
 How welcome departing visitors felt in Britain, and how likely they were to recommend a visit
 2.3 Perceptions of the UK (page 38)
 How people in this source market see the UK, and how it compares to other destinations

                                                                                                                        3
Market and Trade Profile: Netherlands - Netherlands - February 2020 - VisitBritain
Market and Trade Profile Netherlands

Contents (2/2)
Chapter 3: Understanding the Market
3.1 Structural drivers (page 45)
Key demographic, social, economic indicators and exchange rates influencing the outbound travel market
3.2 Consumer trends (page 49)
General and travel-related trends in this source market
3.3 Booking and planning (page 53)
How Dutch travellers plan and book their trips to the UK, and their holidays in general
3.4 Reaching the consumer (page 58)
An overview of the media landscape in this source market, and main sources of influences for holiday planning

Chapter 4: Access and Travel Trade
4.1 Access (page 64)
How visits to the UK were made, and an overview of the air connections between this source market and the UK
4.2 Travel trade (page 68)
What the travel trade in market looks like and useful tips to work with travel agents and other main players
4.3 Caring for the consumer (page 74)
Tips to understand Dutch travellers and best cater to their needs

Appendix:
Working with VisitBritain (page 76)
Useful resources (page 79)
Definitions, sources and information on this report (page 81)

                                                                                                                        4
Market and Trade Profile: Netherlands - Netherlands - February 2020 - VisitBritain
Market and Trade Profile Netherlands

Executive summary

                                                           5
Market and Trade Profile: Netherlands - Netherlands - February 2020 - VisitBritain
Market and Trade Profile Netherlands

1: Inbound market statistics

Chapter summary
• The Dutch outbound market is forecasted to account for
  almost 49 million trips abroad with at least one overnight stay
                                                                                                                     2018:
  by 2028. The UK was the seventh most popular destination
  globally for such trips in 2018.
                                                                                                                     £716m
• The Dutch rank globally in 15th place for international                                                           spend in
  tourism expenditure with more than US$21.1bn.
• The Netherlands was the 6th largest inbound source market for                                                       UK
  the UK for volume and 8th most valuable for spend in 2018.
• France was the most considered alternative destination by
  Dutch visitors, whilst more than a third did not consider an
  alternative destination to Britain.
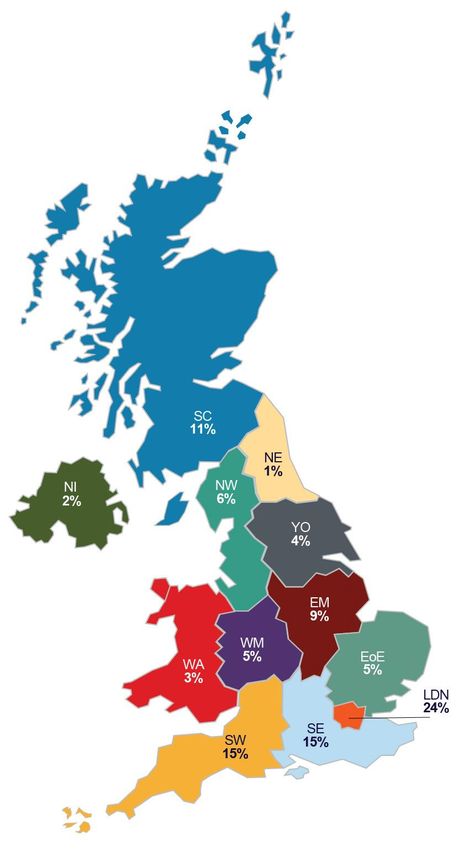
• The Dutch source market has excellent regional spread.
  London is the leading destination for a trip to Britain,
  accounting for 24% of visitor nights, but South West, South
  East and Scotland are also popular (2018).
Source: International Passenger Survey by ONS, Oxford Economics (overnight trips), UNWTO, VisitBritain/IPSOS 2016

                                                                                                                                                           6
Market and Trade Profile Netherlands

2: Experiences and perceptions

Chapter summary
• Dining in restaurants, shopping and going to the
  pub are the top three most popular activities                                              The Dutch
  undertaken during Dutch visits in the UK overall.                                     rank the UK in top 5
• Sightseeing is the second-most popular activity
  for Dutch holiday visitors with almost seven                                         out of 50 countries for
  in ten such visits featuring this activity. Half                                       culture in general,
  of Dutch holidaymakers visit castles or
  historic houses, and museums and arts
                                                                                       contemporary culture,
  galleries as well as religious buildings are                                          sports, cultural and
  also popular.                                                                          built heritage, and
• Almost two in five Dutch visitors on holiday
  in the UK like to socialise with locals.                                                  vibrant cities
• Many Dutch holidays feature time outdoors with
  almost half visiting parks or gardens and a third
  enjoying walking in the countryside.
• 96% of Dutch visitors are ‘Very’/‘Extremely’ likely
  to recommend Britain for a holiday/short break.
Source: International Passenger Survey by ONS, Ipsos-Anholt Nation Brands Index 2019

                                                                                                                                     7
Market and Trade Profile Netherlands

3: Understanding the market

Chapter summary                                                                                 Cultural
                                                                                              attractions,
• The most influential source for destination choice for Dutch visitors                    vibrant cities and
  is information from search engines, closely followed by websites of                         countryside
  accommodation providers/hotels and their friends, family and                              Most important draws
                                                                                              for Dutch leisure
  colleagues. There is a high affinity for online sources in the market.                    visitors for choosing
• 32% of Dutch holiday visitors tend to start thinking about their trip to                          Britain
  Britain early, often more than half a year in advance.
• More than half of holiday bookings of a trip to Britain were made
  within two months of arrival.
• In general, the gap between early and late bookers in the Dutch
  market is widening recently with many now booking within few weeks
  of their departure. This trend is not only true for Dutch short-haul travel
  within Europe but also applies to long-haul travel.
• 84% of the Dutch population went on at least one holiday in 2018.
  Dutch travellers have a high frequency of holidays with an average
  of about 3 holidays per person per year.
Source: VisitBritain/IPSOS 2016, CVO 2017, NBTC-NIPO 2019, Travelpro, Booking.com

                                                                                                                           8
Market and Trade Profile Netherlands

4: Access and travel trade

Chapter summary
• Access to Britain is easy. 59% of Dutch visits were made by
  plane, followed by 29% by ferry and 13% via the Channel Tunnel
                                                                                        59%
                                                                                of visits to the UK from
  (previously accessed from the neighbouring countries France and              the Neth. came by plane,
  Belgium; a direct Eurostar service from Amsterdam was launched
  in 2018).                                                                              29%
• The excellent regional spread of Dutch visits is supported by good                 by ferry in 2018
  connectivity to a range of regional airports in the UK.
• The pace of growth in annual aircraft seat capacity from the
  Netherlands to the UK has slowed to more modest levels recently,
  following strong growth in recovery from the financial crisis years
  up to 2017.
• Many Dutch operators who feature Britain as a destination offer
  touring holidays, short breaks or city trips.
• Dutch tour operators work both with DMCs and ground handlers
  but also contract packages directly.
Source: International Passenger Survey, Apex 2019 non-stop flights only

                                                                                                                 9
Market and Trade Profile Netherlands

Chapter 1:
Inbound market
statistics

                                                        10
Market and Trade Profile Netherlands

Chapter 1.1: Key statistics

Key insights
The Netherlands was the UK’s 6th largest source market in
terms of visits and 8th most valuable for visitor spending in
                                                                   The UK was 7th
2018, having moved up one rank for value on 2017.                    most popular
The UK welcomed almost 2m visits from the Netherlands in            destination for
2018, with these visitors spending a total of £716m.               Dutch outbound
Half of Dutch visitor spending came from holiday trips and a         travel (2018)
quarter from business visits in 2018.
London is the leading destination for a trip to the UK but South
East, South West and Scotland are also popular (based on
average nights 2018). Dutch visits to Scotland and the South
West set a volume record in 2018.
76% of holiday visits from the Netherlands to the UK in 2015
were made by repeat visitors (excl. UK nationals).
Most Dutch visits were organised independently rather than
bought as part of a package or all-inclusive holiday.

Source: International Passenger Survey by ONS, Oxford Economics

                                                                                                          11
Market and Trade Profile Netherlands

1.1 Key statistics: global context and 10 year trend
Global context                                                      Inbound travel to the UK overview
  Measure                                       2018                     Measure          Visits      Nights             Spend
                                                                                          (000s)      (000s)             (£m)

                                                                         10 year trend    +7.5%       +0.8%              +2.3%
  International tourism
                                               21.2                      2008             1,818      8,483               700
  expenditure (US$bn)
                                                                         2009             1,715      7,256               599
  Global rank for international                                          2010             1,758      7,870               717
                                15
  tourism expenditure                                                    2011             1,789      8,413               624
                                                                         2012             1,735      7,594               627
  Number of outbound                                                     2013             1,891      8,630               709
                                               33.5
  overnight visits (m)
                                                                         2014             1,972      8,292               701
                                                                         2015             1,897      8,370               676
  Most visited destination                     France
                                                                         2016             2,062      8,972               714
                                                                         2017             2,136      9,450               747
                                                                         2018             1,954      8,547               716
                                                                         Share of UK total
                                                                                           5.2%       3.2%               3.1%
                                                                         in 2018
Source: International Passenger Survey by ONS, UNWTO, Oxford Economics

                                                                                                                                          12
Market and Trade Profile Netherlands

1.1 Key statistics – volume and value
Inbound volume and value                                                                      Nights per visit, spend
  Measure                     2018          Change             Rank out of                     Averages by           Nights      Spend       Spend
                                            vs. 2017           UK top                          journey purpose       per         per         per
                                                               markets                         in 2018               visit       night       visit

  Visits (000s)               1,954         -9%                6                              Holiday               5           £86        £444

                                                                                              Business              2           £163       £319
  Nights (000s)               8,547         -10%               10
                                                                                              Visiting Friends/
                                                                                                                    5           £54        £281
                                                                                              Relatives
  Spend (£m)                  716           -4%                8
                                                                                              Miscellaneous         2           £147       £313
  The UK welcomed 1.4m Dutch visits in Jan-Sep
  2019 (down 5% on Jan-Sep 2018). This included a
                                                                                              All visits            4           £84        £366
  weak first half of 2019, but growth in the third
  quarter. Dutch visitors spent a total of £551m in
  the first nine months of 2019 (up 3% on the first
  nine months in 2018).*
Source: International Passenger Survey by ONS, *provisional data for January-September 2019

                                                                                                                                                         13
Market and Trade Profile Netherlands

1.1 Key statistics: journey purpose
Journey purpose 2018                                                  Journey purpose trend (visits 000s)
                                                                     1,000
   41% 40%                                                             800                                              810
                   29%                      31%                        600
                           22% 25%                                                                                     571
                                                                       400                                             489
                                                            4% 5%      200                                             78
                                                  0.3% 1%                                                              6
                                                                         0

                                                                              2008

                                                                              2013
                                                                              2005
                                                                              2006
                                                                              2007

                                                                              2009
                                                                              2010
                                                                              2011
                                                                              2012

                                                                              2014
                                                                              2015
                                                                              2016
                                                                              2017
                                                                              2018
    Holiday Business                    VFR        Study     Misc.

                                  Neth.              All markets             Holiday   Business      VFR       Study       Misc.

    41% of all visits to the UK from the Netherlands were            Half of Dutch visitor spending comes courtesy of holiday
    made for holiday purposes, followed by 29% of                    visits, followed by a quarter from business visits and 19%
    business visits and 25% of visits made to visit friends          from visits to friends and/or family residing in the UK.
    and/or relatives in 2018.                                        Dutch business visits peaked in 2014 and nearly matched
    Holiday visits from the Netherlands to the UK and                this record in 2016. Since then, their volume has declined
    visits to friends and/or family in the UK set records            (in 2018 almost 90,000 visits short of the 2014 record).
    for volume in 2017 and whilst they could not be                  Looking at growth over the past decade (comparing 2018
    matched in 2018, the value of visitor spending for               and 2008), holiday visitor spend grew strongly by 64%
    these two journey purposes outperformed previous                 and VFR visitor spend grew by 41%. Visitor spending of
    years in 2018 with £360m and £138m respectively.                 the Dutch who came for business, study or miscella-
Source: International Passenger Survey by ONS
                                                                     neous purposes has declined in the same timeframe.

                                                                                                                                   14
Market and Trade Profile Netherlands

 1.1 Key statistics: seasonality
  Seasonality 2018
                        28% 27%                 27% 28%            26% 24%           In 2018, 28% of visits from the Netherlands to the UK
   20% 21%                                                                           were made in the second quarter, closely followed by
                                                                                     27% in the third quarter (Jul-Sep, traditional high
                                                                                     season), as well as 26% in the last quarter. The first
                                                                                     quarter saw a fifth of Dutch visits made at this time of
                                                                                     year.
                                                                                     The volume of Dutch visits made to the UK in the first,
     Jan-Mar              Apr-Jun               Jul-Sep            Oct-Dec           second and third quarters peaked in 2017. These high
                                   Neth.                  All markets                levels of volume could not be matched in 2018. Whilst
                                                                                     the aforementioned periods all saw a decline in 2018, the
                                                                                     last quarter saw growth (+6%) in the same year.
 Seasonality trend (visits 000s)
800
600                                                                                                                                   541
                                                                                                                                      525
400                                                                                                                                   507
                                                                                                                                      381
200
    0
           2005        2006        2007         2008     2009       2010     2011   2012    2013   2014    2015    2016    2017    2018
Source: International Passenger Survey by ONS          Jan - Mar       Apr - Jun     Jul - Sep     Oct - Dec

                                                                                                                                                  15
Market and Trade Profile Netherlands

  1.1 Key statistics: length of stay and accommodation
  Accommodation stayed in, 2018                                                          Duration of stay trend (visits 000s)
  (nights, %share)  0%                                                                   1,500
                                   2% 0%
                                 3%
                                                                                         1,000                                                         950
                              6%
                                                                                           500                                                         587
                        7%                                                                                                                             191
                                                          38%                                 0                                                        151
                    8%                                                                                                                                  75

                    10%
                                                                                                  Nil nights        1-3 nights          4-7 nights
                                                                                                  8-14 nights       15+ nights
                                     27%                                                 Short trips of 1-3 nights and 4-7 nights are the most
                                                                                         popular duration of stay amongst Dutch visitors. Over the
Hotel/guest house                                 Free guest with relatives or friends   past decade trips of 4-7 nights have shown the strongest
                                                                                         growth, up 34% in this timeframe, and producing record
Rented house/flat                                 Hostel/university/school
                                                                                         volume and value in 2018, whilst stays of 15 nights and
Camping/caravan                                   Bed & Breakfast                        more have declined by 18% between 2008 and 2018.
Own home                                          Other                                  Two forms of accommodation dominate the picture with
Paying guest family or friends house              Holiday village/Centre
                                                                                         about three in five Dutch visitor nights spent either
                                                                                         staying at a hotel/guest house or as a free guest with
  Source: International Passenger Survey by ONS
                                                                                         family or friends. Rented houses/flats, hostels/university/
                                                                                         school accommodation, camping/caravan and B&Bs are
                                                                                         also popular.                                                       16
Market and Trade Profile Netherlands

1.1 Key statistics: repeat visits and package tours
Proportion of overnight holiday visitors                                                               Proportion of visits that are bought as part
who have been to the UK before*                                                                        of a package or all-inclusive tour in 2018**

                                                 80%                                                                                                        23%
                     76%
      67%                                                                                                                        19%
                                   62%                                        63%
                                                                58%
                                                                                                                                           13%
                                                                                                                                                                       11%
                                                                                                                                                                             8%
                                                                                                                 7% 6%                                            6%
                                                                                                                                                 3% 3%

                                                                                                                Business Holiday                   VFR         Misc.       All
                                                                                                                                                                        journey
                                                                                                                       Netherlands               All markets           purposes

 76% of holiday visits from the Netherlands to the UK (excl. UK nationals) in 2015 were made by repeat visitors. These
 repeat visitors came on average between three and four times (a high average visit frequency compared to other
 markets) and spent on average £1,647 in the UK over the past ten years.
 95% of those coming to the UK for business visits (excl. expats) had been to the UK before, followed by those coming
 to visit friends or relatives who live in the UK (92%).
Sources: International Passenger Survey by ONS. *2015, excluding UK nationals; **See definition of a package holiday in appendix (p.83)

                                                                                                                                                                                  17
Market and Trade Profile Netherlands

 1.2 Getting around Britain                                                  Nights
                                                                         (% share, 2018)
Average annual visits to the UK (2018)
 Region                                 Nights stayed   Visits   Spend
                                        (000)           (000)    (£m)
 Total                                  8,547           1,954    715

    Scotland (SC)                       945             172      86

    Wales (WA)                          260             56       17

    Northern Ireland (NI)               145             28       13

    London (LDN)                        2,072           695      260

    North East (NE)                     87              28       9

    North West (NW)                     502             125      45

    Yorkshire (YO)                      360             95       30

    West Midlands (WM)                  414             100      31

    East Midlands (EM)                  754             56       26

    East of England (EoE)               435             120      29

    South West (SW)                     1,286           191      69

    South East (SE)                     1,259           316      81

    Nil nights (Nil)                    N/A             191      14
Source: International Passenger Survey by ONS

                                                                                                                     18
Market and Trade Profile Netherlands

1.2 Getting around Britain: regional spread and top towns and cities
Top towns and cities visited                                                             London is the leading destination for a trip to the UK,
                                                                                         accounting for 24% of visitor nights, but South West,
  Town                         Visits (000s, 2016-2018 average)                          South East and Scotland are also popular based on the
                                                                                         average nights spent in the UK (2018).
  London                       776
                                                                                         Dutch visits stand out as a market which has excellent
  Edinburgh                    65                                                        regional spread showing that visitors are prone to venture
                                                                                         beyond London when they travel in the UK.
  Manchester                   57
                                                                                         Dutch holiday visits have an above-average propensity to
  Birmingham                   43                                                        feature rural and coastal areas of the UK.
  Oxford                       36                                                        Dutch visitors have a below-average propensity to use
                                                                                         public transport in the UK. Almost one in ten Dutch visits
Regional spread (2018, % nights)                                                         involve travellers bringing their own vehicle or hiring a car
                                                                                         while in the UK.
                                                       60%                               Dutch visits to Scotland posted a volume record in 2018
                                                               46%                       with 172,000 visits, and total visitor spend of £86m. They
                                             42%
                                                                                         also set a new volume record for visits to the South West
                                     24%                                                 with 191,000 visits which contributed visitor spend of
 11% 9%                                                                                  £69m in this part of the UK.
                    3% 2%                                                 2% 1%          11% of visits from the Netherlands were bought as part of
                                                                                         a package or an all-inclusive tour, above the all market
  Scotland            Wales            London           Rest Of Northern
                                                                                         average of 8%. Most Dutch visits to the UK were
                                                        England Ireland
                                                                                         organised independently in 2018.
                              Neth.                     All markets
Source: International Passenger Survey by ONS, VisitBritain/IPSOS 2016, base: visitors

                                                                                                                                                         19
Market and Trade Profile Netherlands

1.2 Getting around Britain visits to coast, countryside and villages
Propensity to visit coast, countryside and villages

                                                                               11%
                                VFR: Went to the coast or beaches
                                                                                 13%

                                                                                          17%
                              VFR: Went to countryside or villages
                                                                                           17%

                                                                                          18%
                           Holiday: Went to the coast or beaches
                                                                                    14%

                                                                                             20%
                         Holiday: Went to countryside or villages
                                                                                           18%

                                                                             10%
       All journey purposes: Went to the coast or beaches
                                                                             10%

                                                                                   13%
     All journey purposes: Went to countryside or villages
                                                                                    13%

Source: International Passenger Survey by ONS 2016   Netherlands     All markets

                                                                                                                            20
Market and Trade Profile Netherlands

1.2 Getting around Britain: use of internal modes of transport
Propensity to use internal modes of transport

                                                                            Ferry/boat               2%
                                                                                                    1%
                          Car/vehicle you/group brought to the UK                                      4%
                                                                                                    1%
                                                 Hired self-drive car/vehicle                          5%
                                                                                                        5%
                             Private coach/minibus (for group only)                                   3%
                                                                                                     2%
                                 Public bus/coach (outside town/city)                                3%
                                                                                                        5%
                                                                                     Uber                6%
                                                                                                           9%
                                                                                       Taxi                                22%
                                                                                                                              27%
                                                     Train (outside town/city)                                          17%
                                                                                                                            23%
           Bus, Tube, Tram or Metro Train (within town/city)                                                                                            41%
                                                                                                                                                                 48%
                                                                     Domestic flight               0%
                                                                                                    1%

                                                                                  Netherlands                         All markets
Source: International Passenger Survey by ONS 2018; most lorry drivers were not asked this question, and as a consequence, are not taken into account in the results for
‘car/vehicle you/group brought to the UK’

                                                                                                                                                                               21
Market and Trade Profile Netherlands

1.2 Getting around Britain: purchase of transport
Transport services purchased before or
during trip (%)
                                                                                                 Dutch visitors have a below average
                                                                                                 propensity to use public transport in the UK
           52%                                                                                   in general, but when they do they tend to
                                                                                                 use it more in cities while here.
        43%
                                                                                                 More than two in five Dutch visitors buy their
                                   36%                                                           tickets for transport within London, such as
                       31%                 29%
                                                                                 28%
                                                                                                 Tube or rail travel tickets, during their stay,
  26%            27% 26%                                      27%
                                                 24%       25%                                   rather than before. This pattern applies to all
                                         21%        20%                                          options outlined in the graph including train
                                                                        15%
14%
              12%               14%                                                              travel, airport transfers and coach travel,
                                             10%                 10%                      9%     with the exception of car hire and domestic
                                                                       7% 10%
                                                                                      3%         flights in the UK.
  Pre   During   Pre   During    Pre   During    Pre    During   Pre   During   Pre    During
                                                                                                 One in ten Dutch visitors pre-book car hire
  Transport      Train travel   Airport transfer Coach travel     Car hire      Flights within   and flights they plan to take within the UK.
within London                                                                       the UK

                        Netherlands                    All markets

International Passenger Survey by ONS, VisitBritain/IPSOS 2016, base: visitors

                                                                                                                                                         22
Market and Trade Profile Netherlands

1.3 Visitor demographics

Visitor characteristics
Business visitors from the Netherlands are four
times as likely to be men than women.
More than three in four Dutch holiday visitors are                                         76%
                                                                                            of Dutch
making a repeat visit to the UK.
                                                                                         holiday visitors
Most of visits from the Netherlands to the UK                                           have been to the
were made by Dutch nationals (87%), while 20%                                             UK before*
of those visiting friends/relatives were Britons.
Almost a quarter of Dutch visits were made by
those in the age group of 35-44, closely followed
by about one in five by those aged 45-54 and a
similar proportion by those aged 25-34 in 2018.
More than a third of Dutch visits are made by
travellers on their own and 29% travel with their
partner/spouse. The Dutch have a slightly higher
propensity to travel with adult friends or with
business colleagues than the average visitor.
Source: International Passenger Survey by ONS, *2015, excluding British nationals

                                                                                                                           23
Market and Trade Profile Netherlands

1.3 Visitor demographics: gender and age groups
   Gender ratio of visits (2018)                                                     Age group trend (visits in 000s)
                                                                                    2018   37 213      379          452            415             269    156 21
    All markets                   41%                        57%
                                                                                    2017   72 254       435           473              511          267 123 1
                                                                                    2016   103 222      425           450              493          236 131
   Netherlands                  37%                         62%
                                                                                    2015    91 174     387            442              413          270 119

                                      Female               Male                     2014   109 179     364          430            479              279 132
                                                                                    2013    90 183     349           457               460          251 101
    Gender ratio of visits from the                                                 2012    47 171     370            459               398          184 96 3
    Netherlands by journey purpose (2018)                                           2011    119 170     316          421               396          242 121 1
                                                                                    2010    88 162     325           416               419          237 107 1
          Misc.                         72%                           25%           2009    119 179     312             428             370          223 85
                                                                                    2008   116 180      359             457             389          234 84
           VFR                   50%                           50%                  2007    128 195     340             488              403             204 66
                                                                                    2006    156 165         374           432            374         215 74
      Holiday                      57%                           42%
                                                                                    2005    93 172      390                485               359         174 47
    Business                              80%                           19%         2004    85 153       404               385           331         198 64

                                                                                           0%         20%         40%            60%          80%           100%
                                       Male             Female
Source: International Passenger Survey by ONS, %-share of ‘don’t know’ for gender      0 -15             16-24                25-34                 35-44
ratio not displayed – these visits are also excluded from the age group trend
                                                                                       45-54             55-64                65+                   Not Known
                                                                                                                                                                  24
Market and Trade Profile Netherlands

1.3 Visitor demographics: travel companions
   Who have Dutch visitors to the UK travelled with?
                   43%

        35%

                                   29% 28%

                                                                                                                                                                  14% 13%
                                                             13%                                  12%
                                                                        9%             10%
                                                                                                                   8%
                                                                                                                             5%              5%        4%

       Travelling on Spouse/partner Adult friend(s)                                    Adult family              Business                Part of a tour Child(ren) - any
           own                                                                         member(s)                colleague(s)                group
                                                                                         Netherlands
Source: International Passenger Survey by ONS, 2017, Who accompanied you on your visit to the UK, excluding UK residents you may have visited during your trip?

                                                                                                                                                                            25
Market and Trade Profile Netherlands

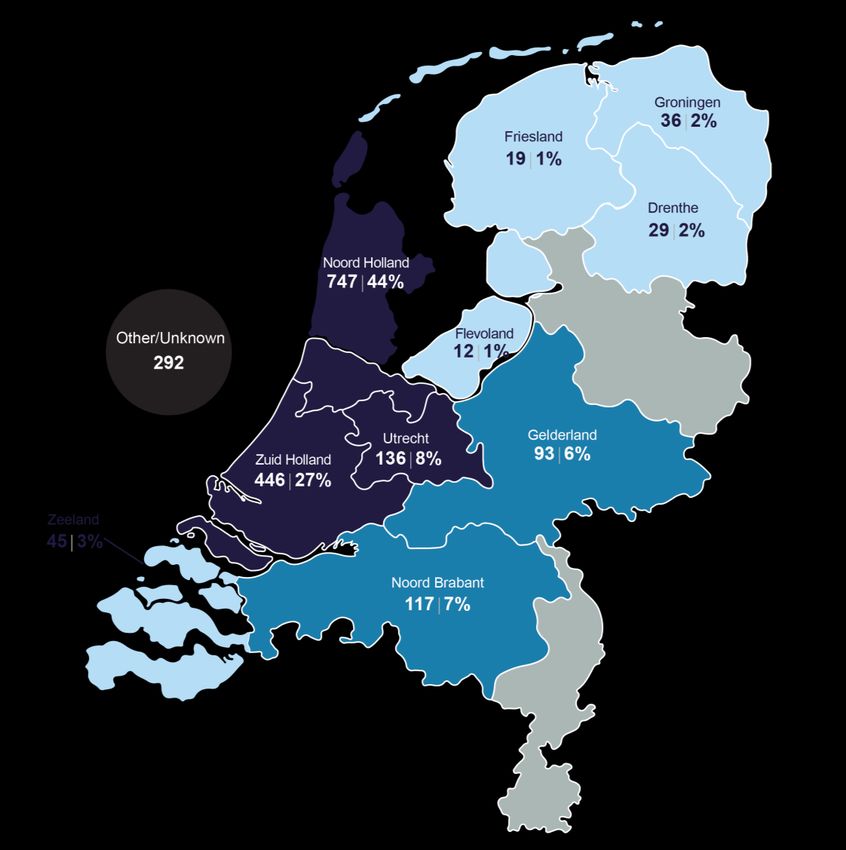
1.3 Visitor demographics: origin
Visits to the UK (000) in 2014
    The largest proportion of Dutch visitors who
    came to the UK reside in Noord Holland and
    Zuid Holland followed by Utrecht.
    The area known as the Randstad, which
    includes cities like Amsterdam, Rotterdam,
    The Hague and Utrecht, is the most densely
    populated area in the Netherlands.

    Visits in 000s | % share of visits

             High
             Medium
             Low

Source: International Passenger Survey by ONS, CIA World Factbook 2019

                                                                                                                26
Market and Trade Profile Netherlands

1.4 The UK and its competitors
Market size, share and growth potential
The UK was the 7th most visited destination by
Dutch travellers on overnight trips in 2018, behind
France, Germany, Spain, Italy, Belgium and
Austria.
Forecasts suggest there is the potential for 14%                                         The UK
growth in the number of visits to the UK over the
next decade (2018 to 2028).                                                             ranks 7th
For holiday visits, Germany, France and Spain                                            for Dutch outbound
                                                                                        destinations by volume
receive the highest number of Dutch
holidaymakers; Britain ranks in 7th place.
The volume of Dutch holidays abroad increased
in 2017, up 10% on the previous year. The
number of domestic holidays increased remained
stable at 17.6 million in 2017. Almost three
quarters of domestic holidays were short holidays
of two to seven days. Gelderland and Limburg
were the most visited provinces for a holiday in
the Netherlands.
Source: CVO 2017 and 2019, Oxford Economics forecasts with VisitBritain adaptations

                                                                                                                             27
Market and Trade Profile Netherlands

 1.4 The UK and its competitors
  The UK’s market share of Dutch visits                                                                     Historic and potential visits to the UK (000s)
  among competitor set

                                                                                                             2,500
                                                                          25%                                                                                                    2,232
             France                                                     22%
                                                                                          32%
                                                                 20%                                         2,000
         Germany                                                    22%
                                                                18%
                                                                  20%
               Spain                                            18%                                          1,500
                                                 13%
                                               10%
                  Italy                        10%
                                               10%                                                           1,000
                                             8%
           Belgium                            9%
                                              9%
                                              9%                                                                500
             Austria                          9%
                                             8%
                                            7%
United Kingdom                               8%                                                                      0
                                             8%
                                1%
             Ireland            1%
                                1%
                                 2028              2018             2008

 Source: Oxford Economics for competitor set based on overnight visits,
 ‘Historic and potential visits‘ displays total visits based on International Passenger Survey historic data and Oxford Economics forecasts with VisitBritain adaptations

                                                                                                                                                                                         28
Market and Trade Profile Netherlands

Chapter 2:
Experiences and
perceptions

                                                         29
Market and Trade Profile Netherlands

2.1 Inbound activities
                                                                                  Top 10 activities for Dutch visitors during
                                                                                  their visit to the UK
Shopping is the number one activity, which
features in many Dutch visits.                                                     1. Dining in restaurants
Built heritage sites, and especially                                               2. Going shopping
museums, are important attractions for
many visitors from the Netherlands.                                                3. Going to the pub
About half of holiday visits involve time in a
park or garden, and walking in the                                                 4. Sightseeing famous monuments/ buildings
countryside and the coast are popular with
many Dutch holiday or VFR* visitors.                                               5. Socialising with locals
Most Dutch visitors like to dine in a
restaurant and many visit a pub and                                                6. Visiting parks or gardens
socialise with locals while in the UK.
                                                                                   7. Visiting castles or historic houses
More than 40,000 Dutch visits per annum
feature time watching football.                                                    8. Walking in the countryside
Visitors from the Netherlands have a
slightly below-average propensity to visit                                         9. Visiting museums and art galleries
the performing arts while here.
96% of Dutch visitors are either ‘Very’ or                                         10.Visiting religious buildings
‘Extremely’ likely to recommend the UK for                                        For more information on activities, please consult:
a holiday or short-break.                                                         visitbritain.org/activities-undertaken-britain
Source: International Passenger Survey by ONS, rankings based on 2007-2017 data
*VFR stands for visiting friends and/or relatives

                                                                                                                                            30
Market and Trade Profile Netherlands

2.1 Inbound activities
Propensity to visit museums and art                                  Propensity to visit built heritage sites
galleries

                                                                                                            15%
                                                                    VFR: visited religious buildings
                                                      18%                                                    18%
VFR: visited museums and art
           galleries                                                   VFR: visited castles/historic          22%
                                                       23%                       houses                       23%
                                                                          Holiday: visited religious             33%
                                                                                 buildings                        35%
                                                            43%
Holiday: visited museums and
                                                                    Holiday: visited castles/historic                  50%
         art galleries
                                                             48%                houses                                 48%
                                                                      All journey purposes: visited         17%
                                                                            religious buildings              20%
                                                       22%
  All journey purposes: visited                                       All journey purposes: visited            25%
   museums and art galleries                                             castles/historic houses
                                                        28%                                                     28%

                                 Netherlands          All markets                        Netherlands    All markets

Source: International Passenger Survey by ONS, 2016

                                                                                                                                 31
Market and Trade Profile Netherlands

  2.1 Inbound activities
   Propensity to attend the performing arts                                                              Number who went to watch sport live
                                                                                                         during trip (000s)
  Holiday: attended a live music                                              9%
                event                                                          10%
                                                                                                                 41
 All journey purposes: attended                                        6%
         a live music event                                             7%
 All journey purposes: attended                              2%
              a festival                                      3%
  All journey purposes: went to                                     5%
the theatre/musical/opera/ballet                                             9%

         VFR: attended a festival                               4%
                                                               3%
         VFR: went to the                                           5%
   theatre/musical/opera/ballet                                            8%

    Holiday: attended a festival                               3%
                                                                4%                                                                                                                  3
                                                                                                                                         2                      1
       Holiday: went to the                                                    9%
   theatre/musical/opera/ballet                                                            14%
                             Netherlands                    All markets                                        Football               Golf            Cricket                  Horse racing

  Source: International Passenger Survey by ONS, 2016 (performing arts) and 2013 (watch sport live). NB data for watching individual sports is based on a small sample size.

                                                                                                                                                                                              32
Market and Trade Profile Netherlands

2.1 Inbound activities
Propensity to go for a walk                                                                           Propensity to visit a park or garden,
                                                                                                      or a national park

   Holiday: Walking along the coast                                   16%                                        Holiday: Visiting a National                            16%
                                                                    11%
                                                                                                                            Park                                        11%
                               Holiday: Cycling                   4%
                                                                 2%                                       All journey purposes: Visiting a                            8%
Holiday: Walking in the countryside                                               33%                              National Park                                      7%
                                                                                26%
        VFR: Walking along the coast                               10%                                                                                                       27%
                                                                    11%                                    VFR: Visiting parks or gardens
                                                                                                                                                                              32%
                                    VFR: Cycling                 3%
                                                                 2%                                                  Holiday: Visiting parks or                                 48%
    VFR: Walking in the countryside                                                38%                                       gardens                                            50%
                                                                                 28%
        All journey purposes: Walking…                             10%                                            Business: Visiting parks or                        4%
                                                                   8%
                                                                                                                          gardens                                     7%
         All journey purposes: Cycling                           3%
                                                                 1%                                           All journey purposes: Visiting                                 26%
    All journey purposes: Walking in…                                        23%                                     parks or gardens                                         32%
                                                                            20%

                                   Netherlands                 All markets                                                            Netherlands              All markets
Source: International Passenger Survey by ONS, 2016 (visiting parks and gardens and a national park), 2010 (walking along the coast) and 2007 (walking in the countryside)

                                                                                                                                                                                      33
Market and Trade Profile Netherlands

     2.1 Inbound activities
     Propensity to go to a pub, and to                                                                       Propensity to go to restaurants, or bars
     socialise with locals                                                                                   and night clubs

      VFR: socialising with the locals                                            50%                                                                     15%
                                                                                 45%                               VFR: went to bars or night clubs
                                                                                                                                                          14%
                             VFR: went to pub                                      54%                                                                             61%
                                                                                                                         VFR: dining in restaurants
                                                                                  49%                                                                              62%
                                                                             38%                              Holiday: went to bars or night clubs        12%
  Holiday: socialising with the locals                                                                                                                    15%
                                                                            32%
                                                                                    57%                               Holiday: dining in restaurants                   80%
                        Holiday: went to pub                                                                                                                          70%
                                                                                  48%
                                                                      17%                                  Business: went to bars or night clubs         6%
 Business: socialising with the locals                                                                                                                   6%
                                                                      15%
                                                                          27%                                       Business: dining in restaurants              51%
                     Business: went to pub                                                                                                                       49%
                                                                         24%
All journey purposes: socialising with                                                                      All journey purposes: went to bars or         12%
                                                                            34%
              the locals                                                    32%                                            night clubs                    12%
                                                                                                                    All journey purposes: dining in                64%
   All journey purposes: went to pub                                             47%
                                                                                                                              restaurants                          61%
                                                                                42%

                                           Netherlands                  All markets                                                   Netherlands       All markets
     Source: International Passenger Survey by ONS, 2008 (dining in restaurants) and 2017 (all other activities)

                                                                                                                                                                             34
Market and Trade Profile Netherlands

  2.1 Inbound activities
   Propensity to go shopping                                                                         Propensity to purchase selected items
                                                                                                                     None of these                              42%
                                                                                                                                                              38%
All journey purposes: went                                            49%                                                                      14%
                                                                                                         Other holiday souvenir (not…           16%
         shopping
                                                                        54%                     Items for your home e.g. furnishing    4%
                                                                                                                                       3%
                                                                                                 Electrical or electronic items e.g.… 2%
                                                                                                                                      3%
                                                                           59%                                                          5%
       VFR: went shopping                                                                        CDs, DVDs, computer games etc          5%
                                                                            61%                                                                   29%
                                                                                                                      Food or drink             24%
                                                                                                  Games, toys or gifts for children      8%
                                                                               67%                                                       9%
   Holiday: went shopping                                                                                       Books or stationery         14%
                                                                                                                                           13%
                                                                                69%                                                      9%
                                                                                               Cosmetics or toiletries e.g. perfume        12%
                                                                                                                  Bags, purses etc      5%
                                                    15%                                                                                  9%
 Business: went shopping                                                                       Personal accessories e.g. jewellery      6%
                                                                                                                                          10%
                                                       21%
                                                                                                                  Clothes or shoes                 32%
                                                                                                                                                       41%

                 Netherlands                  All markets                                                            Netherlands        All markets
  Source: International Passenger Survey by ONS, 2017 (shopping) and 2013 (purchase of selected items)

                                                                                                                                                                35
Market and Trade Profile Netherlands

2.1 Inbound activities
Propensity to participate in an English                                                                 Propensity to visit a literary, music, TV
language course during a visit to the UK                                                                or film location
                              3%

                                                                                                                                                                              6%
                                                                   2%                                 Holiday: visited literary, music, TV,
                  2%                                                                                            or film locations
                                                                                2%                                                                                                 9%

                                           1%
     1%                                                1%

                                                                                                                                                                         4%
                                                                                                          All journey purposes: visited
                                                                                                     literary, music, TV, or film locations
                                                                                                                                                                          5%
                                  % of all visits
          Belgium                       France                        Italy
          Netherlands                   Germany                       Switzerland
          All markets                                                                                                           Netherlands                All markets

Source: International Passenger Survey by ONS, 2017 (literary, music, TV or film location), 2018. Did you go on any English language courses during this visit?
Displayed as % of all visits to the UK from each country that included participation in an English language course.

                                                                                                                                                                                    36
Market and Trade Profile Netherlands

2.2 Welcome and recommending Britain
Feeling of ‘welcome’ in Britain                                               Likelihood to recommend Britain

80% 82%
                                                                               78% 82%

                 17% 15%                                                                   18%
                                                                                                 15%
                                     2% 2%             0% 0%       0% 0%                               3% 2%      1% 0%       0% 0%
 Very            Welcome              Neither         Unwelcome     Very       Extremely    Likely      Neutral   Unlikely Not likely
Welcome                                                           Unwelcome      likely                                     at all

                    Netherlands                   All market average              Netherlands          All market average

Source: International Passenger Survey by ONS, 2017

                                                                                                                                        37
Market and Trade Profile Netherlands

2.3 Perceptions of the UK

The Dutch rate the UK highly for culture in general, contemporary
culture, sports, vibrant cities and cultural and built heritage, but less
for welcome and scenic natural beauty; the UK was rated 16th and                                                Biggest draws for Dutch
                                                                                                                    holiday visitors:
26th out of fifty nations respectively on these two attributes in 2019.
                                                                                                                   Cultural
Music, films, museums and sports are the cultural products/ services
most strongly associated with the UK among the Dutch.                                                            attractions,
A trip to the UK would be expected to be ‘Relaxing’, ‘educational’ and
                                                                                                              vibrant cities and
‘fascinating’ by the Dutch.                                                                                      countryside
Australia, USA and Italy are the destinations that the Dutch consider
the ‘best place’ for delivering the things they most want from a
holiday destination.
Activities that appeal to potential visitors from the Netherlands
include spotting wildlife in the Scottish Highlands, enjoying a
traditional afternoon tea, taking a canal boat tour in England, riding
the scenic ‘Hogwarts Express’ (Harry Potter train) in the Highlands,
walking along Hadrian’s Wall in Northern England, staying the night
in a fairy-tale castle, driving through the countryside of England, and
sharing stories over a pint with locals in a cosy rural pub.
Source: Anholt-Ipsos Nation Brands Index 2013, 2018 and 2019, Arkenford 2013, VisitBritain/IPSOS 2016

                                                                                                                                               38
Market and Trade Profile Netherlands

2.3 Perceptions of the UK
UK’s ranking (out of 50 nations)
  Measure                                                                            Dutch              All
                                                                                     respondents        respondents
 Overall Nation Brand                                                                11                4
 Culture (overall)                                                                   3                 5
 The country has a rich cultural heritage                                            5                 7
 The country is an interesting and exciting place for contemporary culture such as
                                                                                     4                 3
 music, films, art and literature
 The country excels at sports                                                        4                 5
 People (overall)                                                                    12                7
 If I visited the country, the people would make me feel welcome                     16                16
 Tourism (overall)                                                                   7                 4
 Would like to visit the country if money was no object                              13                6
 The country is rich in natural beauty                                               26                26
 The country is rich in historic buildings and monuments                             5                 5
 The country has a vibrant city life and urban attractions                           5                 4

Source: Anholt-Ipsos Nation Brands Index 2019

                                                                                                                       39
Market and Trade Profile Netherlands

 2.3 Perceptions of the UK
  Cultural associations with the UK                                   Adjectives describing a potential trip to
                                                                      the UK

         Museums                                             43%      Educational                                 31%
                                                               47%                                                   35%
               Music                                            49%   Fascinating                                30%
                                                             43%                                                   32%
                Films                                         45%        Exciting            12%
                                                           39%                                                   31%
                                                            42%         Relaxing                                    35%
              Sports                                      37%                                        21%
                                                  23%                   Romantic                  17%
Modern Design                                         31%                                         17%
                                                       33%                  None                       23%
       Pop videos                                   27%                                          16%
                                              18%                        Spiritual      6%
               Opera                              25%                                     9%
                                               19%                      Stressful     5%
         Sculpture                               23%                                     8%
                                               20%                        Boring        6%
                None                        15%                                         6%
                                 3%                                        Risky     2%
 Street Carnival                                                                       5%
                                            14%
                                                                      Depressing       5%
              Circus                 8%                                                5%
                                      11%
                                    Neth.*        All markets                           Neth.*     All markets

Source: Anholt-Ipsos Nation Brands Index 2019

                                                                                                                              40
Market and Trade Profile Netherlands

2.3 Perceptions of the UK
  Holiday wants and % saying destination is best place for…
   Importance                                                                             GB     FR      IT    AU      US     GE
       5.80          Have fun and laughter                                                12%   10%    19%    27%     28%    10%
       5.50          Offers good value for money                                          18%   19%    25%    28%     27%    20%
       5.48          Do something the children would really enjoy                         16%   23%    22%    18%     21%    21%
       5.41          Enjoy peace & quiet                                                   8%   27%    20%    34%     10%    16%
       5.37          Do what I want when I want spontaneously                              7%    9%    17%    35%     26%    16%
       5.30          Enjoy local specialities (food and drink)                            13%   40%    53%    19%     18%    17%
       5.29          Have dedicated time with my other half                               19%   32%    37%    33%     29%    17%
       5.28          Get some sun                                                          0%   23%    40%    51%     17%     1%
       5.26          Chill/ slow down to a different pace of life                          6%   24%    22%    22%      8%    10%
       5.26          Explore the place                                                    14%   13%    30%    35%     27%     6%
       5.26          Enjoy the beauty of the landscape                                    18%   30%    29%    49%     25%    21%
       5.23          Enjoy high quality food and drink (gourmet food)                     19%   46%    54%    19%     11%    19%
       5.22          The people are friendly and welcoming                                18%   13%    22%    37%     24%    21%
       5.19          Soak up the atmosphere                                               29%   14%    15%    34%     26%     4%
       5.14          It offers unique holiday experiences                                 18%   19%    23%    55%     50%    15%
       5.11          See world famous sites and places                                    27%   27%    38%    30%     52%    21%
       5.09          Experience things that are new to me                                  6%    3%     9%    59%     39%     8%
       5.01          Broaden my mind/ Stimulate my thinking                               18%   20%    26%    34%     21%    12%
       4.98          Be physically healthier                                              12%   22%    20%    25%     11%    19%
       4.88          Provides a wide range of holiday experiences                         20%   27%    31%    39%     42%    20%
       4.86          Experience activities/places with a wow factor                       18%    9%    16%    62%     61%    11%
       4.85          Visit a place with a lot of history/historic sites                   34%   34%    49%    10%     20%    30%
       4.66          A good place to visit at any time of year                            15%   20%    20%    36%     36%    17%
       4.65          Feel special or spoilt                                               17%   21%    34%    20%     26%    21%
       4.65          Feel connected to nature                                             24%   29%    19%    54%     22%    15%
       4.47          Revisit places of nostalgic importance to me                         19%   19%     9%    18%     21%    26%
       4.46          Good shopping                                                        28%   16%    30%    13%     49%    15%
       4.43          Easy to get around by public transport                               29%   20%    16%    17%     25%    29%
       4.42          Get off the beaten track                                             20%    8%    13%    32%     19%    17%
       4.31          Meet the locals                                                      23%   22%    41%    40%     38%    23%
       4.18          Experience adrenalin filled adventures                               11%   16%     8%    51%     51%    13%
       4.13          Go somewhere that provided lots of laid on entertainment/nightlife   35%   17%    20%    31%     52%    26%
       4.10          To participate in an active pastime or sport                         24%   28%    14%    44%     28%    32%
       4.06          Party                                                                27%   13%    35%    21%     48%    28%
       3.95          Do something environmentally sustainable/ green                      24%   25%    12%    48%     22%    15%
       3.86          Fashionable destination                                              19%   44%    39%    35%     42%    18%
       3.78          Visit places important to my family's history                        14%    4%    14%    28%     23%    26%
       3.67          Meet and have fun with other tourists                                 9%   24%    26%    31%     15%    22%
Source:3.56
        VisitBritain/Arkenford  2013 event
                     Watch a sporting                                                     31%   15%    20%    17%     25%    29%
       3.31         Do something useful like volunteering to help on a project            15%   16%    51%    36%     32%    23%
                                                                                                                                        41
Market and Trade Profile Netherlands

2.3 Perceptions of the UK
Motivations for choosing Britain as a holiday destination
                                                                                                                                                                                        47%
                                          Cultural attractions                                                                                                               42%
                                                                                                                                              24%
                                Wide variety of places to visit                                                                                 25%
                                                                                                                                        22%
                              Wanted to go somewhere new                                                                                  23%
                                                                                                                                                                    37%
                                                 Vibrant cities                                                                         22%
                                                                                                                                                              34%
                                  Countryside/natural beauty                                                                            22%
                                                                                                                        16%
                                          Easy to get around                                                                            22%
                                                                                                                13%
                                 Somewhere English-spoken                                                                               22%
                                                                                                                                                25%
                                  Visiting friends or relatives                                                                         22%
                                                                                                                                        22%
                               Ease of getting to the country                                                                         21%
                                                                                                                                          23%
                                 A culture different from own                                                                   19%
                                                                                                                13%
                                        A mix of old and new                                                                    19%
                                                                                                                13%
                                       Contemporary culture                                                                   18%
                                                                                                                        16%
                                      Try local food and drink                                                                18%
                                                                                                                                                    26%
                                                  A good deal                                                                 18%
                                                                                         7%
                                             Security / safety                                                            17%
                                                                                                                                              24%
                          Accommodation (variety & quality)                                                             16%
                                                                                                          11%
                                   Easy to get plan/organise                                                            16%
                                                                                                                      15%
                                               Meeting locals                                                   13%
                                                                          4%
                              Wide range of holiday activities                                                  13%
                                                                                    6%
                                        The climate / weather                                               12%
                                                                                                                          17%
                            Cost of staying in the destination                                              12%
                                                                                                          11%
                                              Watching sport                                            10%
                                                                                    6%
                                       Visit a film/TV location                                    9%
                                                                               5%                                                                         Neth.           All markets
                                    Easy to visit with children                               8%

Source: VisitBritain/IPSOS 2016, adjusted data, base: visitors (Market scores have been adjusted so that the
sum of all motivations for each market is equivalent to the global total, to enable meaningful comparisons)

                                                                                                                                                                                                 42
Market and Trade Profile Netherlands

2.3 Perceptions of the UK
Sought-after Britain activities
                                                                                                                                                                                            74%
                                             Spot wildlife in the Scottish Highlands                                                           42%
                                                                                                                                                                                 66%
                                                   Enjoy a traditional afternoon tea                                                                        50%
                                                                                                                                                                                65%
                        Take a canal boat tour through the waterways of England                                                                                   53%
                                                                                                                                                                     56%
      Ride the scenic ‘Hogwarts Express' (Harry Potter train) through the Scottish…                                                                    47%
                                                                                                                                                                   54%
                                   Walk along Hadrian's wall in Northern England                                                         38%
                                                                                                                                                                   54%
                                                 Stay the night in a fairy-tale castle                                                                 47%
                                                                                                                                                             51%
                                         Drive through the countryside of England                                                                               53%
                                                                                                                                                            50%
                           Share stories over a pint with locals in a cosy rural pub                                                    38%
                                                                                                                                                           48%
                               A food tour of one of London's best foodie markets                                                                                52%
                                                                                                                                                     45%
                                           Watch a musical in London's West End                                               32%
                                                                                                                                              41%
                Hunt for The Loch Ness Monster with a boat cruise on Loch Ness                                                32%
                                                                                                                                           40%
         Explore Britain's history using a historic cities app to uncover the stories                                                   38%
                       Visit Windsor Castle where Harry and Meghan got married                                                          38%
                                                                                                                                           40%
                                                                                                                                        38%
                          Explore the Beatles Story in their home city of Liverpool                                              32%
                                                                                                                                       37%
                            Take a street art tour in one of Britain's modern cities                                                         40%
                                                                                                                                  34%
                                                           Visit Madame Tussauds                                                               42%
                                                                                                                                32%
                                            Shop for vintage fashion and antiques                                            30%
                                                                                                                               31%
                           Climb one of Britain's highest mountains for epic views                                           31%
                                                   Relax in Bath spa's rooftop pool                                           31%
                                                                                                                                       36%
                                                           Do a cycle tour in Britain                                      30%
                                                                                                                        27%
                                                                                                                                                   Netherlands             All 15 markets

Source: Anholt Nation Brands Index, powered by Ipsos 2018; Rankings based on market-level scores that have been adjusted so that the sum of all activities for each market is equivalent to the all-market
total, to enable meaningful comparisons, including across markets. Top 20 activities shown; for full list please see report at visitbritain.org/understanding-international-visitors

                                                                                                                                                                                                         43
Market and Trade Profile Netherlands

Chapter 3:
Understanding
the market

                                                       44
Market and Trade Profile Netherlands

3.1 Structural drivers

Demographics & society
Population of about 17 million.
Like the UK, the Netherlands is a parliamentary constitutional monarchy.
There are 4 regions (North, East, South and West Netherlands) which are
                                                                                     17m
                                                                                      Dutch
divided into 12 provinces: Drenthe, Flevoland, Fryslan, Gelderland,                 population
Groningen, Limburg, Noord-Brabant, Noord-Holland, Overijssel, Utrecht,
Zeeland, Zuid-Holland.
An area called Randstad which comprises cities like Amsterdam,
Rotterdam, the Hague and Utrecht is the area the most densely populated
in the Netherlands.
91% of the population live in cities.
The official language is Dutch; Frisian is the official language in the
Fryslan province. English is taught as the first foreign language in school
and linguistic proficiency among Dutch visitors tends to be high.
Dutch full time employees receive an average of 25 days annual leave.

Source: Oxford Economics, CIA World Factbook 2019, World Bank

                                                                                                             45
Market and Trade Profile Netherlands

3.1 Structural drivers: general market overview
General market conditions
   The Netherlands were the UK’s sixth largest source             For now the forecast is held stable for 2019 and real
   market in terms of visits and eighth most valuable in          GDP is expected to grow modestly by 1.3% in 2020.
   terms of visitor spending in 2018.                             The labour market is expected to remain robust
   The Dutch economy slightly outperforms the Eurozone            highlighting resilience. Inflation is ahead of levels in other
   economy as shown below; however, recent data                   Eurozone markets, albeit improving.
   highlighting problems in some industrial sectors illustrates
   strengthening headwinds which are likely to see the pace
   of growth slow.

Key demographic and economic data                                    Economic indicators (%)
  Measure (2019 data)             Neth.        Eurozone              Indicator               2018     2019     2020     2021

 Population (m)                   17.3         338.9
                                                                     Real GDP growth         2.5      1.7      1.3      1.2
 GDP per capita PPP (US$)         54,053       44,005
 Annual average GDP growth                                           Real consumer
                                  1.4          1.4                                           2.3      1.4      1.4      1.4
 over past decade (%)                                                spending growth
 Annual average GDP growth
                                  1.7          1.2                   Unemployment rate 4.8            4.3      4.5      4.7
 in 2019 (%)
Source: Oxford Economics

                                                                                                                               46
Market and Trade Profile Netherlands

3.1 Structural drivers: demographic and social indicators
Population dynamics
                                                                                                     The Netherlands has a population of more than 17 million
                                                                                                     with a median age of 43 years. The Dutch population is
  Measure                                                         2019
                                                                                                     ageing. In terms of median age, the Netherlands ranks
                                                                  estimate
                                                                                                     globally in 26th place.
                                                                                                     Most Dutch people are well-educated and enjoy a good
  Total population (m)                                            17.3
                                                                                                     standard of living; with real GDP per capita in purchasing
                                                                                                     power parity terms well above the Eurozone average.
  Median age (2018 est.)                                          43 years old
                                                                                                     91% of Dutch people live in cities (World Bank est.).
  Overall growth rate (2019-2023)                                 1.9%                               English is taught as the first foreign language in school
                                                                                                     and linguistic proficiency among Dutch visitors tends to
                                                                                                     be high.
                                                                                                     According to the Capgemini World Wealth Report 2019
 Indicator                           2010         2020          2030         2040                    there were 259,000 High Net Worth Individuals (HNWI)*
                                                                                                     resident in the Netherlands in 2018, up 2% on 2017. It is
                                                                                                     Europe’s sixth largest and globally the 11th largest HNWI
 Median age                                                                                          population.
                                    40.8          43.3         44.7          46.3
 in years)

Source: Oxford Economics, CIA World Factbook 2019, Statista 2019, World Bank, Capgemini World Wealth Report 2019 *definition in appendix

                                                                                                                                                                          47
Market and Trade Profile Netherlands

 3.1 Structural drivers: exchange rate trends
 Exchange rate trends (cost of GBP in EUR)

1.70

1.60

1.50

1.40

1.30

1.20                                                                                                                                       1.18

1.10

1.00
    2001     2002      2003   2004   2005   2006   2007   2008   2009   2010   2011   2012   2013    2014   2015   2016   2017   2018   2019

 Please find the most up-to-date exchange rate trend based on monthly averages at visitbritain.org/visitor-economy-facts.
 Source. Bank of England

                                                                                                                                                  48
Market and Trade Profile Netherlands

3.2 Consumer trends

84% of the Dutch population took at least one holiday in
2019. The amount of holidays abroad in 2018 accounted
for 22.2 million.
Dutch people spent a total of €21bn on holidays in 2019 –
an increase of 3% on 2018.
                                                                      84%
The age group 45-64 years spent most on holidays with         of the Dutch population
an average of €1,687 per year.                                 went on at least one
Although many Dutch people go on holiday several times            holiday in 2019.
a year, two thirds would prefer to go on holiday more
often if, time and money were available. The Dutch see
holidays as a top spending priority.
At the same time, the popularity of domestic holidays is
increasing in the Dutch market, facilitated, among other
factors, by the growth of volume of short stays, the ageing
population with seniors having an above-average
propensity to holiday in the Netherlands, and an
increasing consciousness of the impact of flying.
The Dutch market is seeing holidays by train becoming
increasingly popular (+27% in the latest year).
Sources: NBTC-NIPO 2019, Trends & Tourism 2020

                                                                                                       49
Market and Trade Profile Netherlands

3.2 Consumer trends: overall travel trends
Travel trends                                                   an average of €1,687 per year.
The Dutch holiday market continues to grow. The                 Looking specifically at holidays, Germany and France
proportion taking holidays increased again: 84% of the          held their position as number one and number two as the
Dutch population went on at least one holiday in 2019.          most popular destinations for Dutch holidaymakers.
In 2017, the Dutch took a total of 36.7 million holiday trips   France and Spain experienced growth for Dutch holidays
(up 3% on 2016). The volume of holidays abroad grew             (up 7% and 9% respectively). Great Britain’s market
strongly to 19.1 million (up 7%), while domestic holidays       share remained stable year-on-year (5%), ahead of
remained stable with 17.6 million. The average length of        Turkey, Greece and Portugal. Overall, the volume of
stay of a Dutch holiday was 10 nights.                          Dutch holidays in the Mediterranean and intercontinental
                                                                holidays also saw strong growth (up 11% and 18%
The market share of Dutch holidays with a destination
                                                                respectively).
abroad is also growing: 52.1% of Dutch travelled abroad
on holidays in 2017 (up from 50.5% in the previous year)        Online bookings are increasingly popular: more than eight
and 47.9% stayed within the Netherlands (down from              out of ten holidays abroad are currently booked online.
49.5% before).                                                  Laptops are used by about half to book their holiday and
                                                                mobile phone and tablet are also increasingly used
The highest volume of people going on holidays is among
                                                                devices to book a holiday.
the age group of 65+, followed by Dutch aged 45-54 and
55-64.                                                          2017 saw good growth of bookings made via online travel
                                                                agents (OTAs). Dutch bookings via social travel sites like
Dutch total holiday spend amounted to €17.4bn in 2017,
                                                                Airbnb and Wimdu experienced particularly strong growth
of which €14.3bn were spent on holidays outside of the
                                                                (up 22% in 2017). At the same time, bookings via
Netherlands.
                                                                independent / personal travel counsellors also showed
The age group 45-64 years spent most on holidays with           growth of 9%.
Source: NBTC-NIPO based on CVO 2019 and 2017.

                                                                                                                             50
Market and Trade Profile Netherlands

3.2 Consumer trends: overall travel trends
Motivation and attitudes to holidays                                                   active than at home. 60% of respondents are actively
Although many Dutch people go on holiday several times                                 busy during the holidays, while 45% say that they do this
a year, two thirds would prefer to go on holiday more                                  in daily life. Walking is by far the most favourite sporting
often if time and money were available. The Dutch see                                  activity during a holiday. 80% of the respondents put on
holidays as the top spending priority when they have the                               walking shoes on vacation, followed by swimming (47%),
money for it.                                                                          cycling (38%) and fitness (16%). But running, yoga and
                                                                                       tennis are also popular activities during the holidays.
The Dutch tend to be very price-conscious holiday-
                                                                                       Parents with children aged 0-15 years find it important to
makers who look for good value for money. The variety of
                                                                                       recharge, and, for many Dutch people, being healthy and
activities on offer in the destination as well as a sun
                                                                                       active during the holidays is the way to recharge.
destination also feature among the most important criteria
for choosing the destination for the main holiday.                                     There is a very open and active discussion in the Dutch
                                                                                       market around flying and its environmental impact among
Wi-Fi is an important criterion for accommodation booking
                                                                                       the government and other stakeholders as more than a
(82%) and children tend to have a strong influence too.
                                                                                       third of flights departing from Schipol are short-haul.
The Dutch, generally speaking, are interested in making                                Air traffic policy has thus been adapted and public aware-
contact with locals, learning about their culture and                                  ness is high. This could be one of the reasons which has
customs and in tasting local food and drink.                                           facilitated a strong increase in rail travel for holidays and
Britain as well as neighbouring destinations like Belgium and                          an increase in the volume of domestic travel. The Dutch
Germany are mainly visited for short holidays while Spain,                             rail company NS International has seen its sales increase
Italy, Austria, France and Denmark are typical destinations                            by 13% (on 2017) which is attributed to the new service
for longer holidays.                                                                   between London and Rotterdam / Amsterdam but also
On vacation, people take or have more time for being                                   increased environmental consciousness.
Source: NBTC-NIPO based on CVO 2019 and 2017, Travelpro & TUI,Trends & Tourism 2020,
Volkskrant, NS International and RTL news 2019

                                                                                                                                                       51
Market and Trade Profile Netherlands

3.2 Consumer trends: reasons for holidays
Main reasons for going                                                                            Reasons to return to the same destination
on holiday (%)                                                                                    for a holiday (%)
                   Sun/beach                           39%                                                                                                                 53%
                                                       39%                                                       The natural features
                                                                                                                                                                         45%
Visiting family/ friends /                          28%
        relatives                                     38%                                  The quality of the accommodation                                         32%
                                                                                                                                                                    32%
                         Nature                          50%
                                                     31%                                    Cultural and historical attractions                                    31%
                                                    26%                                                                                                            31%
                      City trips
                                                    27%                                                                                                        20%
                                                                                                       The general level of prices
                                                       39%                                                                                                      24%
                        Culture
                                                    26%                                                                                                      15%
   Wellness/Spa/health                    3%                                                          How tourists are welcomed
                                                                                                                                                              21%
        treatment                           13%
                                                                                              The activities/services available                                19%
 Sport-related activities                    16%                                                                                                               20%
                                            12%
                                           9%                                                    Accessible facilities for people                        5%
            Specific events                                                                           with special needs                                 6%
                                           9%

                               Netherlands               EU28                                                                                Netherlands                  EU28

 Amongst the main reasons for going on a holiday for Dutch Asked for reasons which would make them come back, the
 travellers are: nature, culture, sun/beach, visiting      majority of the Dutch tend to value natural features. The
 family/friends/relatives and city trips.                  quality of the accommodation as well as cultural and historical
                                                           attributes are key for about one in three of Dutch respondents.
Source: Flash Eurobarometer 432 by EC 2016: What were your main reasons for going on holiday in 2015? Firstly? And then? and Which of the following would make you go back to the same
place for a holiday? Firstly? And then?

                                                                                                                                                                                         52
Market and Trade Profile Netherlands

3.3 Booking and planning

Many Dutch holiday visitors tend to start thinking about their
trip early with about one in three doing this as early as half a
year or more in advance.
29% of bookings were made in the three to six month
                                                                          68%
window before the arrival to Britain; however, more than half      of Dutch visitors started
of Dutch bookings happened within two months before the            thinking about their trip
trip.                                                                 3 or more months
Most bookings to Britain were made online; however, when            before their arrival in
travel and accommodation are booked together, about one                     Britain
in ten visitors made the booking face-to-face.
Almost half of Dutch visitors book tickets/passes for
attraction during their visit to the UK. They have a low
propensity to pre-book such services.
In general, the gap between early and late bookers in the
Dutch market is widening recently with many now booking
within few weeks of their departure. This trend is not only
true for short-haul travel within Europe but also applies to
long-haul travel.

Source: VisitBritain/IPSOS 2016, Travelpro, Booking.com

                                                                                                           53
Market and Trade Profile Netherlands

3.3 Booking and planning: booking channels and ticket sales
How trips to Britain were booked: travel only                                   How trips to Britain were booked: accommodation only
 Booking method                         Neth.                     All markets    Booking method            Neth.             All markets
 Online                                 93%                       85%            Online                    72%               70%
 Face-to-face                           2%                        10%            Face-to-face              6%                7%
 By phone                               3%                        4%             By phone                  0%                3%
 Don’t know                             2%                        1%             Did not book/stayed       20%               17%
                                                                                 with friends/relatives
                                                                                 Don’t know                2%                2%
Dutch visitors have become increasingly
comfortable with booking their trips to Britain
                                                                                How trips to Britain were booked: travel and
online, especially when they booked travel (i.e.
transport to Britain).                                                          accommodation (holiday)
                                                                                Booking method            Neth.             All markets
One in ten bookings were made face to face
                                                                                Online                    80%               64%
when they booked a holiday arrangement (i.e.
travel and accommodation combined). This                                        Face-to-face              10%               27%
compares to the global average of 27%.
                                                                                By phone                  6%                8%
                                                                                Don’t know                4%                1%

Source: VisitBritain/IPSOS 2016, base: visitors (online survey)

                                                                                                                                                 54
Market and Trade Profile Netherlands

3.3 Booking and planning: booking channels and ticket sales

           Propensity to make a purchase before or during trip
                                                                                                                                    45%
                                                                                                                                          41%
                     30%                                                         28%                   28%                    31%
                                       23%              24%                                 22%                   19%
            15%               14%               13%                    11% 8%                                           11%
                                                                  4%                              8%         7%
                                                                                       5%

                 Pre             During              Pre          During       Pre     During      Pre       During      Pre        During
             Theatre / Musical /                    Sporting event          Guided sightseeing Guided sightseeing Tickets / passes for
              Concert tickets                          tickets                tours in London      tours outside of   other tourist
                                                                                                       London          attractions
                                                                           Netherlands     All markets

  Prior to trip: The proportion of purchases of the above items before the trip was below the all market average across all
  categories amongst Dutch respondents. 15% book theatre/musical/concert tickets prior to the trip, which was the highest
  proportion of any pre-booked item for the Dutch, but well below the all-market average of 30%.

  During the trip: 14% of Dutch visitors purchased tickets to theatre/musical/concerts; nearly half bought tickets/passes for
  miscellaneous tourist attractions.

Source: VisitBritain/IPSOS 2016, base: visitors (online survey)

                                                                                                                                                    55
Market and Trade Profile Netherlands

      3.3 Booking and planning: lead-times (1/2)
  Decision lead-time for visiting Britain
  Starting to think about trip                                          Deciding on the destination

     Lead time                                    Neth.   All markets    Lead time                   Neth.           All markets
     6+ months                                    32%     45%            6+ months                  18%             32%
                                                                         3-6 months                 42%             38%
     3-6 months                                   36%     31%
                                                                         1-2 months                 22%             19%
     1-2 months                                   18%     13%
     Less than 1 month                            9%      5%             Less than 1 month          11%             7%

     Don’t know                                   6%      3%             Don’t know                 8%              3%

  Looking at options/prices                                             Booking the trip
     Lead time                                    Neth.   All markets    Lead time                   Neth.           All markets
     6+ months                                    9%      21%            6+ months                  7%              14%
     3-6 months                                   38%     37%            3-6 months                 29%             32%
     1-2 months                                   30%     27%            1-2 months                 29%             28%

     Less than 1 month                            16%     12%            Less than 1 month          27%             21%

     Don’t know                                   8%      4%             Don’t know                 9%              5%
Source: VisitBritain/IPSOS 2016, base: visitors

                                                                                                                                    56
Market and Trade Profile Netherlands

3.3 Booking and planning: lead-times (2/2)

Decision lead-time for visiting Britain: commentary                      (see tables on previous slide)

About one in three Dutch visitors tend to start thinking early about their trip to Britain, i.e. half a year or more in advance of
their journey; 36% did this three to six months in advance. The Dutch tend to spend quite some time planning and
researching their trip with online sources playing a major role.
60% made their decision to travel to Britain at least three months prior to the actual journey (18% of these six months or
earlier).
Almost two in five Dutch visitors looked at options and prices between three and six months ahead of the trip and 29% also
made the booking in the same time frame. Almost one in three were more spontaneous and looked at options between one
and two months before the trip and 16% within one month. 27% booked their trip to Britain in the month leading up to the
departure. This shows a slightly higher tendency of Dutch visitors to make their booking closer to the departure than the all
market average.
Most of the Dutch visitors who booked travel and accommodation separately booked it directly with the service provider (82%
and 56% respectively). 47% of those who booked accommodation combined used a travel agent/tour operator or travel
comparison website.

Source: VisitBritain/IPSOS 2016, base: visitors

                                                                                                                                57
Market and Trade Profile Netherlands

3.4 Reaching the consumer

The most influential source for destination choice for Dutch
visitors to Britain is information from search engines, closely
followed by websites of accommodation providers/hotels and
their friends, family and colleagues.
Looking at prices of holidays/flights on price comparison                                              Information
websites, websites providing traveller reviews of destinations                                         from search
and travel agent and tour operator websites are also important
for many Dutch in their destination choice. This highlights a high                                       enginges
affinity to online sources in comparison to the all-market                                             #1 Influence for the
average.                                                                                               destination choice
Looking at influences on destination choice by the Dutch overall,                                       of Dutch visitors
photos seen on social media come out as most important and                                                  to Britain
recent studies suggest that many people now take holiday tips
on Facebook, Instagram and blogs more seriously than
suggestions from friends and family. Search engines remain the
key source for additional information and price comparisons.
The Dutch spend on average 8.5 hours per day on media. On-
demand viewing has again risen sharply, as well as smartphone
use. A third of reading time now takes place on screen, two
thirds via paper sources.
Sources: VisitBritain/IPSOS 2016, Media: Tijd 2018, Emerce 2019, AD, Expedia and VakantieDiscounter

                                                                                                                                             58
You can also read