Sustainability, Store Equity, and Satisfaction: The Moderating Effect of Gender in Retailing - MDPI
←
→
Page content transcription
If your browser does not render page correctly, please read the page content below
sustainability

Article
Sustainability, Store Equity, and Satisfaction: The Moderating
Effect of Gender in Retailing
Antonio Marín-García, Irene Gil-Saura                       , María Eugenia Ruiz-Molina * and Gloria Berenguer-Contrí

                                            Departamento de Comercialización e Investigación de Mercados, Facultat d’Economia, Universitat de València,
                                            46010 Valencia, Spain; antonio.marin@uv.es (A.M.-G.); irene.gil@uv.es (I.G.-S.); gloria.berenguer@uv.es (G.B.-C.)
                                            * Correspondence: M.Eugenia.Ruiz@uv.es

                                            Abstract: Currently, sustainability emerges as a key element on which the development of competitive
                                            advantages for businesses is based. In the dynamic and turbulent environment in which retail
                                            companies operate, sustainable practices are posited as an opportunity for their progress and survival.
                                            Through this article, it is intended to advance the nature and dimensions of this construct and
                                            examine its influence on store equity and consumer satisfaction. Furthermore, this work analyses
                                            the moderating effect of gender on these variables and the mediating nature of brand equity in
                                            the development of consumer satisfaction. All this is developed through a quantitative study
                                            carried out on a sample of 510 consumers of different food retail commercial formats (hypermarkets,
                                            supermarkets, and discount stores) in Spain. The technique used for data analysis is partial least
                                            squares (PLS) regression. The results show the importance of sustainability and brand equity in
                                            the development of consumer satisfaction in the retail sector, with the intensity of its effects being a
                                            gender issue. On the other hand, brand equity is positioned as a key element thanks to its mediating
                                            effect between sustainability and satisfaction. All of this points to the need to move towards more
                                            sustainable business models.


                                            Keywords: sustainability; store equity; satisfaction; gender; retail
Citation: Marín-García, A.;
Gil-Saura, I.; Ruiz-Molina, M.E.;
Berenguer-Contrí, G. Sustainability,
Store Equity, and Satisfaction: The
                                            1. Introduction
Moderating Effect of Gender in
Retailing. Sustainability 2021, 13, 1010.         Given the importance of the social function and the employment generated by the
https://doi.org/10.3390/su13021010          retail trade, it is a strategic sector for the Spanish economy. Data provided by the Research
                                            Service of the Department of Economics of the Spanish Confederation of Business Organi-
Received: 20 November 2020                  sations (CEOE) in 2019 underline the major relevance of the retail sector in Spain, where
Accepted: 16 January 2021                   more than 750,000 retail companies are located, representing 13% of the national economy.
Published: 19 January 2021                  They account for 17% of the country’s total employment, positioning retail as the largest
                                            sector to generate employment.
Publisher’s Note: MDPI stays neutral              In addition, its determining role is even greater today due to the immense changes
with regard to jurisdictional claims in     that are taking place in the global economy and that are directly reflected in the retail sector,
published maps and institutional affil-     where digitisation and globalisation play a prominent role. These two factors, together
iations.                                    with the evolution in consumer habits, energetically drive the profound transformation
                                            process in the Spanish commercial sector, which has also taken an unexpected turn due to
                                            the COVID-19 crisis. All these elements lead the retail sector to the inescapable need to
                                            reinvent itself if it wants to continue competing efficiently in this unsettled and turbulent
Copyright: © 2021 by the authors.           environment [1].
Licensee MDPI, Basel, Switzerland.                To achieve competitive advantages and increase the allure of organisations, sustain-
This article is an open access article      ability is postulated as a key element to consider [2–6]. Furthermore, the development
distributed under the terms and             of sustainable practices by companies, within the social, economic, and environmental
conditions of the Creative Commons          spheres, are important factors in attracting consumers to businesses [7–9]. Currently, the
Attribution (CC BY) license (https://
                                            increasing awareness on the part of consumers in regard to sustainability directly influ-
creativecommons.org/licenses/by/
                                            ences the business actions taken by organisations. Consequently, the way companies act
4.0/).

Sustainability 2021, 13, 1010. https://doi.org/10.3390/su13021010                                          https://www.mdpi.com/journal/sustainability
Sustainability 2021, 13, 1010 2 of 20
can have positive or negative effects on the perceptions that consumers generate towards
these establishments [10,11]. In this sense, some studies go further and attempt to link
the development of consumer satisfaction to the implementation of sustainable actions in
companies. However, in the retail context and considering the consumer’s perspective,
there is little empirical evidence that contrasts this relationship [12].
Furthermore, the marketing literature that examines the concept of sustainability
highlights its importance in the development of brand equity [13–15]. Market research
has provided evidence that the brand and related information influence customer evalua-
tions [16,17], suggesting that consumers add value to products through their brand. In this
sense, the brand is considered as a differentiating element of the companies with respect
to their competitors [18]. Despite the fact that brand equity is a construct traditionally
associated with a product or service, its conception has recently led to new approaches,
and new conceptualisations of the construct, such as store equity, have emerged [19–21].
However, empirical research on the relationships of sustainability with brand eq-
uity is in an incipient stage of development, which is accentuated in the retail context by
bringing the concept of brand equity to the store environment. In this sense, the impor-
tance of the study of brand equity and satisfaction as key elements in the performance of
organisations [10,11,13] point out the direction that research on sustainability should be
approached [5,6,14,22,23]. Thus, the analysis of the perception that consumers may have
about sustainable practices in retail establishments and their impact on store equity and
customer satisfaction is postulated as one of the main pillars of this study.
Furthermore, consumer markets are not homogeneous. This idea is in the essence of
modern marketing that emphasises the need to observe consumers based on variables that
make it possible to differentiate behaviours. From this point of view, gender differences
have been a recurring topic of interest in recent years. Efforts to understand gender-
moderated differences can be traced back to the last century, although it is from the
year 2000 that interest in its study is revitalised in areas such as commitment and loyalty [24],
differences in purchasing styles and processes [25,26], perceived value [27], and/or the
online environment [28], by way of example of some of the most discussed topics. In
this way, the question of how gender can affect the retail sector is presented as a research
opportunity by outlining a reality yet to be explored.
In light of the above, the main objective of this work is to approach the concept of
sustainability, identify its nature and scope, and examine its effect on store equity and
consumer satisfaction. Additionally, it is intended to observe the mediating nature, between
sustainability and satisfaction, of the store’s brand equity, identifying its role in the chain
of effects—all this through the prism of defining the moderating effect, or not, of gender
in these relationships. In order to achieve the proposed goal, after the introduction, we
will examine the main constructs on which this study is based: sustainability, store equity,
and consumer satisfaction. Subsequently, the relationships between the variables will
be formulated in the form of a hypothesis, and the theoretical model that is postulated
will be shown. Next, the methodology of this research and the results derived from data
analysis using the partial least squares (PLS)-SEM technique will be presented. Finally, the
conclusions derived from the work, as well as their theoretical and managerial implications,
will be presented, together with reflections on the limitations and future lines of research.
2. Theoretical Framework
2.1. Sustainability
Sustainability is one of the concepts that has aroused the greatest interest among
researchers and academics in the field of marketing in recent years. In this sense, there are
many positive effects attributed to it, especially for companies, due to its ability to generate
sustainable competitive advantages, thanks to its contribution to changes in consumer
perceptions [3–6].
The Brundtland Commission conceptualised sustainability in 1987 as “the devel-
opment that meets the needs of the present without compromising the ability of futureSustainability 2021, 13, 1010 3 of 20
generations to meet their own needs” [29] (p.40); however, there are still discrepancies
today when defining the nature of this variable. In this sense, its dimensional character has
been one of the most relevant themes, extensively covered by academic literature. One of
the most referenced proposals when addressing the dimensionality of sustainability has
been formulated by Elkington [7], who proposes the theoretical model called “Triple Bottom
Line” (TBL) in which one of its fundamental pillars is that the success of entrepreneurial
businesses will depend on the capacity of organisations to include environmental, social,
and economic value in their models. These three dimensions have been explained and
defined by the Global Reporting Initiative [30] for use by companies when developing their
sustainability reports and implemented both theoretically and empirically in numerous
studies. Firstly, the environmental dimension has been explained as the actions taken
by companies to create products and services without causing harm to the environment.
Secondly, the social dimension is associated with the ability of companies to manage their
businesses whilst improving quality of life and reinforcing the relationships that organisa-
tions have with the various stakeholders within their environment. Finally, the economic
dimension is essential, as it is considered a key requirement for the survival of companies.
Despite the fact that the interest of academics on sustainability in retailing is relatively
recent, it is a factor with great potential nowadays due to its versatility and multidisciplinar-
ity due to the different areas of knowledge from which it can be approached (environmental
sciences, business, and social sciences). There are different interpretations of sustainability
and a wide variety of areas of knowledge in research in the retailing industry. In addition,
the research approaches and methods used to analyse sustainability in retailing are varied
(for example, theoretical vs. empirical approach, qualitative vs. quantitative methods,
descriptive vs. causal analyses), as well as the retail sectors considered by the researchers
(e.g., fashion, food, electronics).
Ruiz-Leal et al. [3] identify as preferential study areas of sustainability the analysis of
the conditions that must be met for sustainable practices to generate satisfactory results, the
selection of organic and ecological products, or the study of sustainable establishments. In
addition, another relevant element for retail companies is the image they want to convey to
their customers and how they can ensure that their consumers have a better perception of
their establishments. In this sense, Ruiz Leal et al. [3] argue that suitable communications
of sustainable practices will lead to an improvement in the perception that consumers
develop about the sustainable practices implemented by retail stores.
In short, and following the TBL theory formulated by Elkington [7], we postulate in
this work that sustainability in retail commercial distribution is built through actions that
involve economic sustainability, environmental sustainability, and social sustainability.
2.2. Store Equity
The organisational changes that occurred in the 1980s, as a consequence of the merger,
acquisition, and consolidation of companies and brands, have led to increased interest in
the study of brand equity [31,32]. In this context, the first brand-oriented research was
dominated by the idea that the intangible characteristics associated with brands became a
source of tangible wealth, offering a favourable outlook on the development of competitive
advantages and earning of future profits. [31].
The literature review allows us to identify three perspectives through which the
study of the concept of brand equity has been focused: (a) financial perspective [33];
(b) consumer perspective [18,19,31]; and (c) overall perspective [34–36]. The first of the
perspectives, the financial one, understands brand equity as an element closely linked to
the additional economic benefits obtained by marketing products under a certain brand.
The consumer perspective explains brand equity as a construct capable of generating
competitive advantages provided that this developed value is perceived by consumers.
Finally, the overall perspective defines brand equity as an element in which the company,
consumers, distributors, and financial markets are the main stakeholders involved and
affected by brand value.Sustainability 2021, 13, 1010 4 of 20
In the context of the retail commercial distribution sector, the brand equity concep-
tualisation proposal developed by Arnett et al. [19] has been widely accepted among
researchers in the field [37]. The model proposed by these authors, following the pattern
initially developed by Aaker [31], relies on awareness, image, loyalty, and perceived qual-
ity, as basic elements on which to build brand equity, and it starts from the premise that
the information obtained in regard to this brand equity can be a source of competitive
advantages for the retailer, adopting a formative approach in its conceptualisation and
operationalisation. Later, Pappu and Quester [38] analyse the dimensionality of store equity
considering the same variables as Aaker [31], finding support to the multidimensional
nature of this construct. Awareness, image, perceived quality, and loyalty towards the
brand under which the commercial establishment competes are precisely the variables
related to store equity which, from the consumer’s perspective, have been most frequently
referenced in the marketing literature [18,19,21,31,37–39].
Brand awareness is considered the first step towards the creation of brand equity due
to its close relationship with the strength of the brand in the memory of consumers [31,35].
Brand image has been defined in a general way as “the sum of beliefs, attitudes, stereotypes,
ideas, relevant behaviours or impressions that a person holds with respect to an object, person or
organisation” [40] (p. 218), and it is the resulting effect caused by the set of associations
that are related to the brand [40]. Depending on whether these associations are positive or
negative, the image of the brand will be reinforced, positively or negatively [41]. Perceived
quality is also considered as a relevant variable of brand equity, which originates from the
overall evaluation that a consumer makes of a service or product once they have tried it
and compared it with other products or services [31]. Finally, loyalty is a variable to which
particular attention has been paid, as it is considered key in the growth and sustainability
of companies due to its ability to retain customers that are loyal not only to the company
but also to its brand [36], as represented by its logo. Furthermore, loyalty is a construct
that has generated controversy over the years, and there are studies that consider it as an
antecedent [5], a dimension [31], or a consequence of brand equity [42–44].
Finally, despite the fact that the study of brand equity has been approached from a
global perspective, in which some of the dimensions of this construct were considered as
antecedents or consequents, the present study follows the brand equity formation proposal
formulated by Arnett et al. [19] and Aaker [31] from the consumer perspective; in this
study, this variable will be considered as multidimensional, and it is formed from its four
basic components: awareness of the store, store image, perceived quality of the store, and
loyalty towards the store.
2.3. Satisfaction
Consumer satisfaction, from a marketing perspective, has been considered the key to
the success of exchanges, since it is the starting point for customer loyalty. This concept
has been a protagonist in the consumer behaviour literature for decades. Although interest
in his research has increased since the end of the 1970s, at which time some authors
were starting to experience a growing concern for understanding the phenomenon, its
antecedents, and its consequences [45], it is the early contribution of Howard and Sheth [46],
which marks the origin of this research tradition. Thus, one of the first approximations of
the nature, formation, and consequences of satisfaction is due to Howard and Sheth [46],
who affirm that satisfaction is the degree of agreement between the current consequences of
the purchase and the consumption of the brand, and what is expected of this by the buyer
at the time of purchase. Therefore, the consumer will be satisfied if the real consequences
are equal to or greater than the expected consequences. In this way, the authors recognise
satisfaction as a cognitive response, where the rationality of the individual prevails over
the affective aspects.
However, numerous authors have attempted to explain satisfaction from an emotional
point of view e.g., [47,48], as it is considered as the individual’s affective response towardsSustainability 2021, 13, 1010 5 of 20
a certain act of purchase or consumption of a product or service contextualised within a
specific time period.
In any circumstance, where there has been a general consensus, it has been to under-
stand consumer satisfaction from the perspective of results and therefore as a response
to an evaluation process as a summary concept. Specifically, Oliver [49] explains it by
considering the variety of forms and cognitive interpretations of affect; Westbrook [50]
refers to it as a global evaluative judgment, while Fornell [51] associates it with an overall
evaluation, and Day [52] associates it with an evaluative response.
3. Hypotheses Development
3.1. Sustainability and Store Equity
The literature analysed has shown little interest to date in examining the relationships
between the variables traditionally linked to brand equity and sustainability. However,
given the growing role that the development of sustainable practices in the retail environ-
ment is acquiring, its potential effect on consumer behaviour and attitudes and on their
perception of the brand cannot be ignored.
However, before examining the possible consequences derived from the sustainability–
store equity relationship, it is important to clarify how these key constructs are formed.
Regarding sustainability, the literature highlights its complexity, both from a conceptual
and empirical perspective, so that proposing sustainability as a multidimensional construct
is consistent with the accumulated knowledge up to date, and consequently, we expect this
variable to be formed by economic sustainability, social sustainability, and environmental
sustainability, following the line of work started by Elkington [7]. Similarly, regarding store
equity, there are numerous studies that address both its theoretical delimitation and its
measurement from a multidimensional approach, considering for this purpose the four
key factors on which it is commonly based, namely, awareness, image, perceived quality,
and loyalty [19,31,38]. Consequently, we propose the first two hypotheses of this research
as follows:
Hypotheses (H1). Economic sustainability, social sustainability, and environmental sustainability
contribute positively and significantly to sustainability.
Hypotheses (H2). Store awareness, store image, perceived store quality, and store loyalty con-
tribute positively and significantly to store equity.
In the retail context, some sustainable practices carried out by commercial estab-
lishments with the aim of improving consumers’ perception of brand equity have been
identified [53]. These sustainable practices include, among others: (a) distinction of green
and ecological products through changes in their packaging, text content, etc.; (b) promo-
tion of sustainable commercial actions through retailers’ commitment to ethical practices,
fair trade, support for Non-Governmental Organizations (NGOs), etc.; (c) use of keywords
and/or ecological symbols with the aim of making consumers aware of the impact that
products can have on the environment and society; (d) specific training for employees
on organic products so that they can correctly transmit the information to consumers; (e)
competitive pricing of organic products so that they are accessible to all consumers; (f)
availability and visibility of the products so that consumers can access them with greater
guarantees; (g) certification of environmental claims by prestigious institutions and or-
ganisations; (h) ecological appeal of the store in creating a greener environment; and (i)
participation of agents and stakeholders to increase awareness among all groups that have
entered into a relationship with retail companies. The main groups of practices developed
in the retail trade correspond to the distinction of green products, the promotion of sus-
tainable business practices, and the availability and visibility of green products [53]. All
these actions are aimed at improving the perception that the consumer has towards the
commercial establishment and, consequently, it seems plausible to suppose that they have
an impact on attitudes and beliefs regarding awareness, image, perceived quality, and
loyalty to the store.Sustainability 2021, 13, 1010 6 of 20
In addition, it should be noted that the relationship between sustainability and the
variables related to brand equity, on many occasions, is reinforced by the power of inno-
vative decisions implemented by organisations, creating a triple connection between the
concepts. In the context of retail trade, Gonzalez-Lafaysse and Lapassouse-Madrid [15]
show how the supermarket format in France that makes use of innovative actions linked to
sustainable development improves the brand image of its establishments and increases
consumer loyalty and purchase intention. Thus, the third of our hypotheses is supported
by these reasonings, and therefore, we formulate the following:
Hypotheses (H3). Customer perceptions of the retailer’s sustainability have a positive effect on
store equity.
3.2. Store Equity and Satisfaction
In the study of store equity, the literature shows a limited number of contributions
with evidence that looks at the links between brand equity and consumer satisfaction.
In a study carried out in the cultural and creative sector in Taiwan, Huang et al. [23]
empirically contrast how the increase in overall brand equity contributes to increased
consumer satisfaction. Satisfaction is one of the three dimensions that, together with brand
equity and brand recall, has significant and positive effects on the consumer’s repeat
purchase behaviour. Furthermore, the study carried out by Lassar et al. [54] suggests that
brand equity leads to increased customer satisfaction. In the process of generating these
positive perceptions, the feelings that nurture the experience and the beliefs about these
brands are fundamental and are strongly linked to consumer satisfaction. Along the same
lines, Yoo and Park [55] point out that the evaluation that consumers make of the retailers
where they purchase the products they consume is based on their experiences with these
products. When the value provided by the product they have purchased in the store is
higher for customers, their level of satisfaction with the store will also be higher.
In the retail sector, Gil-Saura et al. [37] obtain positive results from the effect of overall
brand equity on consumer satisfaction. In this way, they conclude that brand equity
acquires special importance, as it is a driver of customer satisfaction towards the retailer.
Thus, the fourth of our hypotheses is supported by these arguments, and therefore,
we formulate the following:
Hypotheses (H4). Customer perceptions of the retailer’s store equity have a positive effect on
consumer satisfaction towards the store.
3.3. Sustainability and Satisfaction
Despite the growing interest in the study of sustainability, there is still little evidence in
the commercial distribution sector to examine the relationship between sustainability and
customer satisfaction. The literature investigating these links has found more evidence in
other fields of study in the service sector. Iniesta-Bonillo et al. [56] explore the relationships
between the sustainability perceived by visitors in regard to a tourist destination and their
perceived value and satisfaction with the trip. The authors structure sustainability as a
multidimensional construct based on economic sustainability, social sustainability, and
environmental sustainability. The results support the positive and significant relationship
between sustainability and satisfaction. Based on these findings, Iniesta-Bonillo et al. [54]
argue that sustainability is a key factor in the development of more competitive and market-
oriented tourist destinations, due to its ability to build tourist satisfaction. In the same line
of research, Cottrell and Vaske [57] confirm that the dimensions of sustainability (economic,
social, and environmental) exert a positive and significant effect on tourist satisfaction.
In the field of retail, Marín-García et al. [6] analyse the effect of sustainability on
consumer satisfaction, indirectly, through the image and awareness of the store. The
authors show sustainability based on the three dimensions postulated by Elkington [7]
in his theoretical model of the TBL. In their study, the authors establish the importantSustainability 2021, 13, 1010 7 of 20
role of sustainability in the retail sector from the consumer’s perspective, and its effect on
satisfaction.
For sectors different from retailing, empirical evidence allows inferring the influence
that sustainable practices exert on customer satisfaction [58–60]. In this sense, in the tourism
sector, some studies have addressed this relationship and have reported how initiatives
related to environmental sustainability, such as actions aimed at reducing the negative
impact of the daily activities of companies on the environment, have generated an increase
in tourist satisfaction [58,61,62]. Tourists welcome these initiatives, as they consider that
these actions generate a benefit to society as a whole.
As a consequence of all the above, we postulate the fifth hypothesis of this research:
Hypotheses (H5). Customer perceptions of the retailer’s sustainability have a positive effect on
consumer satisfaction towards the store.
3.4. Moderating Effects of Gender
Regarding studies that have addressed the differences between men and women in
relation to the effect of sustainable practices implemented by businesses, no conclusive
results have been obtained. While some researchers establish that gender does have a mod-
erating effect on the perception that customers have of sustainable practices implemented
by stores [63,64], others have not found significant evidence to justify this effect [65,66].
Regarding the moderating nature of gender in relation to brand equity, some research
shows that this sociodemographic factor moderates the impact of some of the variables
directly related to brand equity in retail trade [63]. In this sense, gender plays an important
role in consumers’ retail buying behaviour, and its effect is more intense in the segment of
women than in men. These conclusions are also shared by Borges et al. [67], whose results
show significant differences between women and men. In this regard, the authors note
that retailers need to carefully consider how store design affects evaluations among male
versus female consumers.
Finally, in relation to satisfaction, some studies suggest that this variable is moderated
by gender [68,69], influencing consumer behaviour. Atulkar and Kesari [70] have found
evidence of the moderating effect of gender on consumer satisfaction in the retail sector.
Based on the evidence obtained, they conclude that female consumers are more social, and
their buying behaviour, compared to male consumers, is based mainly on the search for
pleasure. In other words, consumer satisfaction would be related to a more hedonistic
factor.
Considering all the above, we postulate the following hypothesis:
Hypotheses (H6). In the retail sector, in comparison to male consumers, female consumers show
stronger links between (H6a) customer perceptions of the retailer’s sustainability and store equity,
(H6b) customer perceptions of the retailer’s store equity and satisfaction, and (H6c) customer
perceptions of the retailer’s sustainability have a positive effect and consumer satisfaction towards
the store.
3.5. Mediating Effect of Store Equity
To our knowledge, the role of brand equity in the sustainability–satisfaction relation-
ship remains practically unexplored. However, this link could be explained in light of the
Theory of Reasoned Action proposed by Ajzen and Fishbein [71]. The authors examine
how the grouping of attitudinal and behavioural factors could clarify the behaviours of
human beings. Through their theoretical model, they indicate that the benefit perceived
by a person or group of people in regard to a stimulus can determine the assessments or
judgments made by individuals in a given situation. Furthermore, depending on how this
benefit is considered to be, it is possible that people’s expectations vary.
Following the model proposed by Ajzen and Fishbein [71], the last hypothesis of this
research is proposed. In this sense, sustainability is considered as a variable of a cognitive
nature and satisfaction is considered as a variable with a more affective nature, and thus, itSustainability 2021, 13, 1010 8 of 20
is intended to examine whether the perception and/or acceptance of sustainable practices
implemented by retail companies generate changes in consumer satisfaction in the presence
or absence of store equity brand.
Moreover, following the stakeholder theory [72], Corporate Social Responsibility (CSR)
initiatives may lead to an improved brand image for customers, employees, and other
stakeholders, indicating that such activities may ultimately improve customer satisfaction.
Notwithstanding, Carroll et al. [73] argue that firms should understand that the outcomes of
CSR depend largely on mediating variables, and therefore, the influence of CSR initiatives
on customer satisfaction may be indirect. In this sense, previous research has concluded
that brand image mediates the relationship between CSR and customer satisfaction in the
hotel industry [74,75]. Bearing in mind that brand image is a dimension of store equity [19]
and the similarities between CSR and Corporate Sustainability [76], we extrapolate the
evidence observed in the hotel industry to posit the mediating role of store equity in the
relationship between retailer’s sustainability and customer satisfaction. Therefore, we
postulate the following:
Hypotheses (H7). The effect of sustainability on consumer satisfaction is positively mediated by
store equity.
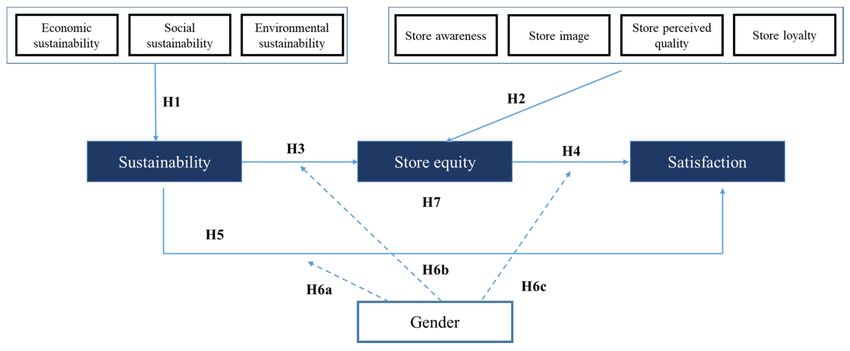
Figure 1 shows the research model that gathers together the relationships raised in the
previous hypotheses.
Figure 1. Proposed research model.
4. Methodology
To achieve the objective proposed in this research, an empirical study of a quantitative
nature was carried out (Table 1). Specifically, a structured ad hoc questionnaire was
used. The fieldwork was carried out during the months of April and May 2017 in the
city of Valencia. Potential interviewees were approached at the entrances to three types
of retail formats: hypermarkets, supermarkets, and discount stores. Grocery store chains
were selected according to their assortment and their positioning as well as their wide
presence in the Spanish market. The sample of consumers was obtained following a
non-probabilistic quota sampling procedure in terms of gender and age. A filter question
was asked to potential interviewees to assure that they patronise that store and, therefore,
they are familiar with that retailer’s offerings. Furthermore, the measurement scales
used (see the Appendix A) in this study have been tested and validated in previous
works carried out in similar contexts [5,6]. To measure sustainability, we used the scale
proposed by Lavorata [13]. On the other hand, the scale used to measure store equity was
adapted from the one proposed by Yoo et al. [77]. Finally, the Bloemer and Odekerken-Sustainability 2021, 13, 1010 9 of 20
Schröder one-dimensional scale [78] was the basis for measuring consumer satisfaction in
the establishment.
Table 1. Technical information.
Universe Spanish individuals over 18 years old.
Scope Valencia, Spain
Method Questionnaire survey
Sample size 510 valid surveys
Fieldwork period April and May 2017
Statistical analyses PLS–SEM, multi-group analysis
Statistical software SmartPLS 3.0
Sustainability [13]
Measurement scales Store equity [77]
Satisfaction [78]
A total of 510 valid questionnaires were obtained (170, hypermarkets; 170, supermar-
kets; 170, discount stores). In order to enable comparative analyses with balanced samples,
the same number of questionnaires was collected for each retail format. The distribution of
the sample is presented in Table 2. More than half (59.6%) correspond to women, while
40.4% are men. Regarding the age range, it is noteworthy that almost 70% of the sample
groups are consumers between 36 and 65 years old. Regarding the level of education,
almost half of the sample (46.7%) claim to have higher education qualifications. Finally,
67.7% of those surveyed claim to be working.
Table 2. Sample distribution: sociodemographic variables.
Total
N %
GENDER
Male 206 40.4
Female 304 59.6
AGE
18–25 years old 36 7.1
26–35 years old 88 17.3
36–45 years old 133 26.1
46–55 years old 113 22.2
56–65 years old 108 21.2
Over 65 years old 32 6.3
EDUCATION
No schooling 40 7.8
Primary education 84 16.5
Secondary education 148 29.0
University studies 238 46.7
OCCUPATION
Employee 282 55.3
Employer/Self-employed 63 12.4
Pensioner 58 11.4
Unemployed 40 7.8
Housewife 37 7.3
Student 30 5.8
TOTAL 510Sustainability 2021, 13, 1010 10 of 20
The analysis of the results of this study was carried out through the partial least
squares (PLS) technique. This type of technique can be used for both confirmatory and
exploratory studies [79,80]. Furthermore, this type of analysis makes it possible to contrast
theoretical assumptions with empirical data, as is the intention of this study. Specifically, in
this research, the analysis of the results was carried out in two stages.
This technique has been used extensively in recent years by researchers in the context
of marketing [81]. Cassel et al. [82] point out that PLS-SEM is a technique characterised by
its robustness mainly in three situations: skewed distributions in the manifest variables;
multi-collinearity both between latent constructs and between indicators; and inaccurate
specification of the structural model. Furthermore, Fornell and Bookstein [83] explain that
PLS allows avoiding two important problems: firstly, inadmissible or improper solutions
such as negative estimates of the variance of the indicators and standardised loadings
greater than 1 and, secondly, the indeterminacy of factors thanks to the fact that the PLS
technique explicitly defines the latent variables, making it easier to obtain the scores of
the factors or latent variables. Moreover, it has been used successfully in studies carried
out in the context of retailing [5,6]. The PLS-SEM analysis is a non-parametric statistical
procedure, for which the data do not need to be normally distributed [80]. Although it is
not possible to apply significance parameters as in the case of regressions to check if the
loadings are significant, through the PLS-SEM analysis, we can test the significance of the
factor loadings and paths using the non-parametric bootstrap procedure [84]. Firstly, the
measurement instrument was validated. Subsequently, the estimation of the structural
model defined in this study was carried out.
5. Results
With the aim of examining the validity and reliability of the measurement instrument
used in this research, we calculated a path weighting scheme from a PLS algorithm with a
parameter of 300 maximum interactions, all of this using the PLS-SEM technique. Through
this procedure, we obtained for each of the study factors the necessary information on
the factor loadings, Cronbach’s alpha coefficients, composite reliability index (CRI), and
average variance extracted (AVE). All these data are collected in Table 3. In order to achieve
high levels of reliability and validity of the measurement instrument, we eliminated those
items with loadings lower than 0.7 [85,86]. Specifically, the items related to store image
IM3, IM4, and IM5 were eliminated from the causal model (see Appendix A).
The data from Table 3 show satisfactory results for Cronbach’s α, exceeding 0.7, and
oscillating between 0.8 and 0.9, which are recommended values according to the criteria of
Nunnally and Bernstein [87]. On the other hand, the results obtained from the composite
reliability far exceed the minimum required, 0.7 [88], so they can be considered very
satisfactory. Regarding the average variance extracted, all the constructs of the structural
model obtain values greater than 0.5, which implies that each factor explains at least 50% of
the variance of the assigned indicators [88]. All this allows us to confirm the reliability and
validity of the measurement instrument. In addition, Table 4 examines the discriminant
validity using the criterion proposed by Fornell and Larcker [89]. The results obtained
show that the square root of the average variance extracted (AVE) is higher than the
estimated correlation between the factors, which appears below the diagonal of the matrix,
corroborating the discriminant validity.Sustainability 2021, 13, 1010 11 of 20
Table 3. Measurement instrument of the structural model: reliability and convergent validity.
Factor Item Loading t Cronbach α CR AVE
SN1 0.771 *** 21.591
Economic SN2 0.897 *** 82.525
Sustainability 0.871 0.912 0.723
SN3 0.861 *** 54.886
SN4 0.867 *** 59.174
SN5 0.728 *** 25.341
SN6 0.879 *** 86.015
Social
SN7 0.808 *** 31.610 0.883 0.914 0.682
Sustainability
SN8 0.830 *** 36.171
SN9 0.876** 71.747
SN10 0.816 *** 31.981
Environmental
SN11 0.866 *** 43.858 0.817 0.888 0.726
Sustainability
SN12 0.873 *** 61.246
AW1 0.790 *** 38.012
AW2 0.833 *** 46.591
Store awareness 0.850 0.898 0.689
AW3 0.874 *** 53.693
AW4 0.821 *** 41.447
IM1 0.753 *** 35.210
IM2 0.809 *** 48.638
Store image IM6 0.825 *** 49.507 0.865 0.902 0.649
IM7 0.813 *** 43.317
IM8 0.825 *** 57.276
PQ1 0.923 *** 59.097
Store perceived PQ2 0.907 *** 125.881
0.894 0.926 0.759
quality PQ3 0.919 *** 94.340
PQ4 0.881 *** 23.057
LO1 0.923 *** 119.471
LO2 0.907 *** 94.535
Store loyalty 0.929 0.949 0.823
LO3 0.919 *** 119.901
LO4 0.881 *** 65.797
SF1 0.875 *** 74.764
SF2 0.938 *** 165.731
Satisfaction SF3 0.923 *** 107.895 0.946 0.958 0.822
SF4 0.929 *** 137.456
SF5 0.867 *** 78.728
Statistically significant at *** p < 0.01; ns = non-statistically significant.
Table 4. Measurement instrument: discriminant validity (Fornell–Larcker criterion).
Quality Image Loyalty Awareness Satisfaction Eco. Sust. Env. Sus. Soc. Sust.
Quality 0.871
Image 0.640 0.806
Loyalty 0.709 0.488 0.907
Awareness 0.512 0.594 0.362 0.830
Satisfaction 0.587 0.576 0.488 0.647 0.907
Eco. Sust. 0.557 0.360 0.478 0.392 0.451 0.850
Env. Sust. 0.479 0.374 0.442 0.256 0.384 0.510 0.852
Soc. Sust. 0.446 0.361 0.463 0.301 0.569 0.563 0.620 0.826
Notes: Diagonal values in bold are square roots of AVE and values below the diagonal are correlations between variables.
When considering both sustainability and store equity as second-order constructs,
formed by formative items, we analyse their weights. Following the criteria of Diaman-
topoulos and Winklhofer [90], it is possible to confirm the absence of collinearity, since the
variance inflation factor (VIF) for the dimensions of the second-order constructs is less than
the critical level of 5 (Table 5).Sustainability 2021, 13, 1010 12 of 20
Table 5. Parameter estimates of the formative second-order constructs.
2nd Order Factor 1st Order Factor Weight VIF Hypothesis
Economic sustainability 0.414 *** 1.868
Sustainability Social sustainability 0.424 *** 1.836 H1
Environmental
0.348 *** 1.946
sustainability
Store awareness 0.407 *** 1.680
Store image 0.144 *** 2.083
Store equity H2
Store perceived quality 0.379 *** 2.986
Store loyalty 0.294 *** 2.142
Statistically significant at *** p < 0.01.
In addition, the results for the weights of the first-order constructs on their corre-
sponding second-order constructs displayed in Table 5 allow us to support the first two
hypotheses of this research. In relation to the first hypothesis, which posits the positive
contribution of the economic, social, and environmental dimensions of sustainability to
the second-order construct of sustainability, it is observed that the influence of the three
dimensions on the second-order construct is significant and similar, being greater the effect
of social sustainability than the contribution of the other two dimensions on sustainability.
Regarding the second hypothesis that states the positive impact of the dimensions of store
equity (awareness, image, perceived quality, and loyalty), on the second-order construct,
it is observed that store awareness and perceived store quality have a stronger effect on
brand equity than store loyalty and store image.
Once the measurement instrument used for the evaluation of each of the constructs
included in the proposed theoretical model has been evaluated, and its reliability and
validity confirmed through the results obtained, the structural model is estimated. In this
sense, for the analysis of the proposed structural model, we used the SmartPLS software
once again with complete bootstrapping with 5000 subsamples [91] to evaluate the causal
relationships that make up the model hypotheses and their significance, in addition to
obtaining the results of the values of the R2 explained variance. Furthermore, through the
blindfolding technique, we obtain the results provided by the predictive relevance criterion
of the Q2 test. Table 6 shows the results of the estimation of the structural model in this
research.
Table 6. Causal relationships estimation.
Relationship Hypothesis Standardised Parameter t
H3 Sustainability → Store equity Supported 0.208 *** 4.915
H4 Store equity → Satisfaction Supported 0.600 *** 21.772
H5 Sustainability → Satisfaction Supported 0.589 *** 15.332
Store equity: R2 = 0.537, Q2 = 0.225; Satisfaction: R2 = 0.360, Q2 =0.409. * Statistically significant at *** p < 0.01; ns = statistically
non-significant.
The results obtained from the PLS-SEM analysis allow us to accept all the relation-
ships proposed by the causal model. Regarding the third of the proposed relationships, we
can affirm the positive and significant effect of sustainability on store equity (β3 = 0.208,
p < 0.001). Likewise, this work’s fourth hypothesis confirms the effect of store equity on
consumer satisfaction, obtaining a positive and significant result (β4 = 0.600, p < 0.001). Fi-
nally, we can also confirm the significant and positive effect of sustainability on satisfaction
(β5 = 0.589, p < 0.001).
On the other hand, to respond to the set of hypotheses that make up H6 in this re-
search, a multi-group analysis was carried out using the PLS-MGA method. The results
shown in Table 7 indicate the existence of significant and positive differences for H6b. That
is, we can confirm that the relationship between store equity and consumer satisfaction is
moderated by gender. Moreover, the chain “sustainability → store equity → satisfaction”Sustainability 2021, 13, 1010 13 of 20
is only observed for female consumers, whereas for men, there is no statistically significant
influence of sustainability on store equity, in support of the higher importance of intangible
and/or hedonic aspects in consumer perceptions for women in comparison to men. Addi-
tional evidence of these differences in perceptions between male and female consumers is
provided by the comparisons of the mean values for each item of the questionnaire (see the
Appendix A), which reveal the existence of significant differences in the scores of several
items measuring social sustainability, store awareness, image, perceived quality, and store
loyalty, being in all cases higher for female consumers in comparison to male customers.
All these results are consistent with those studies that suggest that in retail trade, when
making decisions, it is relevant to consider gender given the differences between men and
women in perception and purchase intention [67–69].
Table 7. Results of the multigroup analysis.
Female Male
Hypothesis Relationship N = 304 N = 206 p-Value
Standardised Standardised
t t
Parameter Parameter
H6a Sustainability → Store equity 0.661 *** 21.298 0.563 ns 11.595 0.072
H6b Store equity → Satisfaction 0.717 *** 16.549 0.528 *** 6.848 0.018 *
H6c Sustainability → Satisfaction 0.152 *** 3.554 0.166 *** 2.165 0.868
Statistically significant at * p < 0.1, *** p < 0.01; ns = statistically non-significant.
Finally, the analysis of the role of brand equity as a mediating variable between
sustainability and customer satisfaction was carried out using the Preacher and Hayes
bootstrapping method [92]. Table 8 shows that the direct and indirect effect between sus-
tainability and satisfaction is significant. In this sense, it is possible to accept hypothesis H7,
since brand equity is a mediator of the sustainability–satisfaction relationship. Furthermore,
we can confirm through the VAF result, which determines the size of the indirect effect
in relation to the total effect [93], that brand equity has a partial mediating effect on the
relationship (0.615).
Table 8. Summary of mediating effect test.
Relation Total Effect Direct Effect Indirect Effect VAF
Sustainability →
0.561 *** 0.208 *** 0.353 *** 0.615
Satisfaction
Statistically significant at *** p < 0.01; ns = non-statistically significant.
6. Discussion and Conclusions
The results achieved in this research reveal important findings that allow us to present
certain theoretical implications. Firstly, the evidence obtained allows us to conclude that in
retail, sustainability is a multidimensional construct that can be treated as second-order.
Specifically, sustainability in retail is aligned with the basic principles of the TBL model,
which is composed of the three basic dimensions of economic, environmental, and social
sustainability [7]. In this sense, it is relevant to note that in retailing, the weights of the
dimensions of sustainability on this construct are similar, being the contribution of social
sustainability to the formation of sustainability slightly higher than the ones of the other
two dimensions.
Secondly, the results of this study reflect the importance of sustainability as a funda-
mental pillar in retail trade strategy [3–6], given its positive impact on store equity and on
customer satisfaction towards the establishment [5,55]. In this sense, these findings allow
us to advance in the knowledge of these variables and invite us to look beyond customer
satisfaction to observe their links with other variables such as trust and/or Electronic Word
of Mouth (eWOM) [88].Sustainability 2021, 13, 1010 14 of 20
Thirdly, our results show that store equity has a multidimensional nature and that
this nature is well represented in terms of awareness, image, perceived quality, and loyalty,
supporting the line of work of Arnett et al. [19]. The results obtained in this research
show that awareness and perceived quality are the factors that most contribute to the
construction of the store equity in retailing. In contrast, store image and loyalty emerge
as secondary elements in the construction of store equity. All in all, the four dimensions
of store brand equity are key in building the store equity second-order construct that, in
turn, influences positively on consumer satisfaction towards the retail store. Thus, brand
equity is positioned as a key element in fostering customer satisfaction [23]. Given its
nature as a partial mediator, store equity is a decisive variable in business strategy, since it
provides substantive information on how sustainable practices affect customer satisfaction.
Perceptions regarding the sustainable initiatives implemented by the retailer generate direct
and mediated effects, through the store’s equity, on customer satisfaction. Consequently,
an important contribution has been made by providing information about how and why
the effect of such perceptions on customer satisfaction occurs: to the extent that it is the
inclusion of brand equity in the equation that intensifies its explanatory power.
Finally, our conclusion regarding the moderating role of gender revealed in this work is
of particular interest, since it highlights the need to retain variables of a sociodemographic
nature when analysing consumer behaviour in the retail sector [71]. Results indicate
that the intensity of the observed relationships is affected by gender and that there are
notable differences between men and women, especially when considering the contribution
of sustainability to the store equity and store equity to the satisfaction experienced by
women, given its greater influence. The findings provide evidence on the interaction
between gender and the chain of effects “sustainability→ store equity → satisfaction”. One
possible explanation is the fact that women are more pleasure-oriented when shopping,
whereas men are more task-oriented, which consequently influences shopping behaviour
outcomes [94], as far as the differences in gender are mainly observed in how store equity
is built, and more specially, in consumer perceptions on store quality. All this confirms
the key influence of gender on shopping behavior; and our findings are aligned with the
results of other studies evidencing that men and women perceive the shopping activity
differently [95], observing these differences not only with hedonic products but also with
utilitarian purchases such as groceries. Therefore, to generate satisfaction towards the
retailer, it is not only important to consider the factors related to store equity, but also to pay
special attention to other variables influencing this variable, given the observed differences
between male and female consumers.
All in all, the findings of this study allow us to conclude that there is a need to im-
plement sustainable practices in the food retail trade, since their influence on customer
satisfaction has been proven, regardless of gender. However, the role of store equity is
even more important in the case of women compared to men, and it plays a more active
role in the achievement of said satisfaction. In particular, it would be beneficial for store
managers to actively promote and include ecological and fair trade products as part of
their range, engage the company in humanitarian actions, encourage the use of public
transport by employees, promote reduced energy consumption, recycling or elimination of
plastic packaging for some products and/or its replacement with biodegradable materials.
Currently, there are movements such as “Fridays for Future” that aim to raise awareness in
society of the importance of taking action to prevent climate change and global warming.
Movements such as this support responsible consumption by consumers, as well as the
development of sustainable productive activities by companies, causing the least possible
damage to society and the environment. In addition, as a consequence of the coronavirus
disease (COVID-19) crisis, many commercial establishments will be forced to make deci-
sions, probably innovative and sustainable, to adapt their businesses to this new reality.
In this way, it seems clear that, operating in the dimensions of environmental, social, and
economic sustainability, customers will be more satisfied with the retail establishment.Sustainability 2021, 13, 1010 15 of 20
In addition, as far as sustainability is concerned, a key element to improve the per-
ception that consumers have of retail establishments is communication. Thus, companies
should use the tools that allow them to reach their target audience (social media, brochures,
etc.), so that the message they want to convey is correctly received. In this sense, if the
preferred channel to communicate with their audience is social media, it is important to
know what profile of person interacts with each type of social media, and to adapt the
message to the audience and the used social media. In this sense, it is important that the
image that the company conveys to its target does not show inconsistencies. Thus, for
instance, if the retail establishment wishes to convey an image linked to sustainability, the
green colour and graphical elements associated with this concept should appear in all its
communications.
It also seems evident that to achieve consumer satisfaction, sustainable practices
implemented by organisations must be accompanied by actions linked to the creation of
brand equity. In this sense, enhancing the consumer’s shopping experience through the
development of attractive in-store promotions, new loyalty programs, improvements in
the store environment, or better training for employees, could be some of the measures
to be implemented in retail establishments. All of this, whilst collaborating more closely
with the consumer when developing actions such as those above mentioned, will help to
increase customer satisfaction.
Finally, it is necessary to indicate that the results obtained give rise to opportunities
for future lines of research. In relation to the variables that could explain the effect of
sustainable practices on consumer satisfaction, trust, eWOM, or commitment to the retailer
could be factors to consider when attempting understanding of the mechanisms through
which sustainability generates links between customers and retailers. Similarly, other
moderating variables could be analysed, such as the customer age, education, occupation,
or behavioural variables (purchase frequency) that can help explain how the effects of
sustainability intensify in the development of satisfaction. In addition, the study of the
differences in the perceptions that consumers from other regions have towards the sustain-
able practices of retail businesses and if these differences may be influenced by aspects
such as culture, lifestyle, or commercial structure, could also manifest as a future line of
research. On the other hand, the analysis of possible differences in consumer perceptions
of the commercial formats in this study would be another possible future route that helps
to explain the nature of sustainability in retail. Additionally, this analysis could also be
extended to examine the differences between the brands in this research or the study of
sectors other than food.
Author Contributions: Conceptualisation, A.M.-G., M.E.R.-M., I.G.-S. and G.B.-C.; Methodology,
A.M.-G., M.E.R.-M., and I.G.-S.; Validation, A.M.-G., M.E.R.-M., and I.G.-S.; Formal Analysis, A.M.-
G., M.E.R.-M., and I.G.-S.; Investigation, A.M.-G., M.E.R.-M., and I.G.-S.; Data Curation, A.M.-G.;
Writing—Original Draft Preparation, A.M.-G., M.E.R.-M., I.G.-S., and G.B.-C.; Writing—Review and
Editing, A.M.-G., M.E.R.-M., and I.G.-S.; Visualisation, A.M.-G., M.E.R.-M., and I.G.-S.; Supervision,
M.E.R.-M., and I.G.-S.; Project Administration, I.G.-S. and G.B.-C. All authors have read and agreed
to the published version of the manuscript.
Funding: This research received no external funding.
Institutional Review Board Statement: Not applicable.
Informed Consent Statement: Informed consent was obtained from all subjects involved in the study.
Data Availability Statement: The data presented in this study are available on request from the
corresponding author.
Acknowledgments: This paper was developed within the Research Project ECO2016-76553-R of the
Spanish Ministry of Economy, Industry and Competitiveness (National Research Agency).
Conflicts of Interest: The authors declare no conflict of interest.You can also read