Inhaled H2 or CO2 Do Not Augment the Neuroprotective Effect of Therapeutic Hypothermia in a Severe Neonatal Hypoxic-Ischemic Encephalopathy Piglet ...
←
→
Page content transcription
If your browser does not render page correctly, please read the page content below
International Journal of
            Molecular Sciences

Article
Inhaled H2 or CO2 Do Not Augment the
Neuroprotective Effect of Therapeutic Hypothermia
in a Severe Neonatal Hypoxic-Ischemic
Encephalopathy Piglet Model
Viktória Kovács * , Gábor Remzső, Valéria Tóth-Szűki , Viktória Varga, János Németh
and Ferenc Domoki
 Department of Physiology, University of Szeged Faculty of Medicine, H-6720 Szeged, Hungary;
 remzso.gabor@med.u-szeged.hu (G.R.); toth-szuki.valeria@med.u-szeged.hu (V.T.-S.);
 varga.viktoria.eva.22@gmail.com (V.V.); acetilkolin07@hotmail.com (J.N.);
 domoki.ferenc@med.u-szeged.hu (F.D.)
 * Correspondence: kovacs.viktoria.1@med.u-szeged.hu

 Received: 23 July 2020; Accepted: 14 September 2020; Published: 16 September 2020

 Abstract: Hypoxic-ischemic encephalopathy (HIE) is still a major cause of neonatal death and
 disability as therapeutic hypothermia (TH) alone cannot afford sufficient neuroprotection. The present
 study investigated whether ventilation with molecular hydrogen (2.1% H2 ) or graded restoration of
 normocapnia with CO2 for 4 h after asphyxia would augment the neuroprotective effect of TH in a
 subacute (48 h) HIE piglet model. Piglets were randomized to untreated naïve, control-normothermia,
 asphyxia-normothermia (20-min 4%O2 –20%CO2 ventilation; Tcore = 38.5 ◦ C), asphyxia-hypothermia
 (A-HT, Tcore = 33.5 ◦ C, 2–36 h post-asphyxia), A-HT + H2 , or A-HT + CO2 treatment groups.
 Asphyxia elicited severe hypoxia (pO2 = 19 ± 5 mmHg) and mixed acidosis (pH = 6.79 ± 0.10).
 HIE development was confirmed by altered cerebral electrical activity and neuropathology. TH was
 significantly neuroprotective in the caudate nucleus but demonstrated virtually no such effect in
 the hippocampus. The mRNA levels of apoptosis-inducing factor and caspase-3 showed a ~10-fold
 increase in the A-HT group compared to naïve animals in the hippocampus but not in the caudate
 nucleus coinciding with the region-specific neuroprotective effect of TH. H2 or CO2 did not augment
 TH-induced neuroprotection in any brain areas; rather, CO2 even abolished the neuroprotective effect
 of TH in the caudate nucleus. In conclusion, the present findings do not support the use of these
 medical gases to supplement TH in HIE management.

 Keywords: hypoxic-ischemic encephalopathy; perinatal asphyxia; therapeutic hypothermia; piglet
 model; hydrogen ventilation; brain-derived neurotrophic factor

1. Introduction
     Hypoxic-ischemic encephalopathy (HIE) is defined as acute/subacute brain injury elicited by
asphyxia in the perinatal period [1,2]. The hallmarks of perinatal asphyxia include severe systemic
hypoxia, hypercapnia, acidosis, and/or reduced cerebral blood flow. HIE is diagnosed based on the
clinical presentation of encephalopathy and laboratory findings of recent asphyxia often showing
multi-organ involvement in hypoxic-ischemic injury [3,4]. HIE is a major cause of neonatal death and
long-term disability worldwide and the medical costs of HIE management can be expressed in billions
of dollars in developed countries alone [5,6]. Therefore, neuroprotective therapies reducing brain
injury and also preventing multi-organ failure are urgently needed, even though mild whole-body
hypothermia treatment (therapeutic hypothermia; TH) has been successfully implemented into the

Int. J. Mol. Sci. 2020, 21, 6801; doi:10.3390/ijms21186801                           www.mdpi.com/journal/ijms
Int. J. Mol. Sci. 2020, 21, 6801                                                                     2 of 22

clinical practice and was shown to improve long-term outcome measures [1]. However, TH alone is
clearly insufficient for the successful treatment of all HIE patients; on average, seven infants affected
with severe HIE must be treated with TH to reduce by one the number of deaths or major disabilities [7].
Therefore, further preclinical research is warranted to identify additional treatment options that
can complement the neuroprotection afforded by TH. The term newborn pig provides a suitable
large-animal experimental model for translational HIE research as its gyrencephalic brain structure,
brain developmental stage at birth, cerebral metabolic rates of glucose and oxygen are all comparable
to term human babies [8–10]. Notably, TH was also shown to be effective in a piglet HIE model, lending
support to the model’s translational value [11,12]. Among the many putative neuroprotective therapies,
our research group focuses on inhaled neuroprotective gases as they offer a simple, straightforward
administration route that is feasible even under clinical conditions, as acute management of severely
asphyxiated babies often must include intratracheal intubation and mechanical ventilation. In the
present study, we assessed two previously reported neuroprotective gases: H2 and CO2 .
      Ohsawa et al. reported in their seminal paper that inhaled H2 was neuroprotective in an adult rat
stroke model [13], and it was also found to be effective in a rat HIE model as well [14]. Our research group
was the first to show H2 -induced neuro-vascular protection in a piglet acute HIE model [15], and then
we characterized the beneficial effects of H2 . We showed preserved neuro-vascular reactivity [16],
reduced neuronal injury in most brain regions studied, improved recovery of EEG [17], reduced
oxidative deoxyribonucleic acid (DNA) damage, limited microglial activation, and abolishment of
asphyxia-induced increases in neuronal cyclooxygenase-2 (COX-2) immunopositive neurons [18].
However, an additive neuroprotective effect of H2 and TH has not yet been demonstrated. Indeed,
a recent study investigated this in a piglet model [19]; however, there were no differences between
the TH and the TH + H2 treated animals in the neurological/neuropathological scores. A potential
cause for this finding was that all animals undergoing TH or TH + H2 fully recovered by the end of the
observation period, excluding the possibility to detect such differences in treatment efficacy [19].
      Hypercapnia is a cardinal feature of asphyxia; however, postasphyxial CO2 levels also play
an important role in determining HIE outcome: hypocapnia was found to be an independent risk
factor for severe neurodevelopmental disability and death [20]. Furthermore, inhalation of CO2
immediately after experimental asphyxia, leading to a so-called graded restoration of normocapnia,
was shown to exert beneficial effects like reduction of seizure burden [21] and preservation of cerebral
oxygenation [22].
      Brain-derived neurotrophic factor (BDNF) is a member of the neurotrophic factor family that
is highly expressed in the developing brain and plays an important role in regulating neural
proliferation, differentiation, and survival [23,24]. Upregulation of BDNF has been implied to
exert a neuroprotective effect in the hippocampus of newborn piglets following hypoxic stress [25].
Furthermore, BDNF upregulation was shown to be involved in TH-induced neuroprotection following
cardiac arrest in the adult rat brain [26], and it was also observed in newborn piglets exposed to TH after
hypoxic/ischemic stress [27]. BDNF has anti-apoptotic effects by blocking both caspase-independent
and dependent pathways acting on caspase-3 and apoptosis-inducing factor (AIF), respectively.
Although these genes were assessed in hypoxic or hypoxic-ischemic piglet models [25,27], the effect of
asphyxia on the gene expression patterns has not yet been explored.
      Therefore, the major objective of the present study was to assess whether there was an additive
neuroprotective effect of H2 or CO2 when combined with TH compared to TH alone. To enhance
the translational value of our study, we modified our previously published piglet HIE model [17]
by eliciting asphyxia with lower FiO2 (4% instead of 6% O2 ) to represent more severe HIE patients
that would especially benefit from combined therapies and provided the current state-of-the-art
HIE management including TH. We also wished to start exploring the molecular mechanisms of
neuronal injury at the gene expression level; therefore, we studied expression changes in BDNF,
caspase-3, and AIF. We demonstrate that H2 or CO2 could not enhance the neuroprotective effect of
TH in any brain areas assessed with either neuropathology or electrophysiology. We also made novel
Int. J. Mol. Sci. 2020, 21, 6801 3 of 22
observations on how TH modifies gene expression after asphyxia in our model that may contribute to
the neuroprotection.
2. Results
Int. J. Mol. Sci. 2019, 20, x FOR PEER REVIEW 3 of 22
To address the major study objectives, five groups of anesthetized, instrumented animals were
used, and control
2. Results brain samples were obtained from naïve (untreated control) animals as well
(Figure 1). Mortality of the
To address theapplied
major studyasphyxia/HIE protocol
objectives, five groups was 12%
of anesthetized, (4/33): three
instrumented piglets
animals expired during
were used,
asphyxia before they brain
and control could havewere
samples been assigned
obtained to any
from naïve treatment
(untreated control)group,
animals and only
as well one
(Figure 1). piglet in the
Mortality of the applied asphyxia/HIE protocol was 12% (4/33): three piglets expired during asphyxia
asphyxia-hypothermia group was lost at 32 h of survival. Data from these animals were not included
before they could have been assigned to any treatment group, and only one piglet in the asphyxia-
in the study. hypothermia group was lost at 32 h of survival. Data from these animals were not included in the study.
Figure 1. Overview of the experimental
Figure 1. Overview of the experimental protocol. Untreated
protocol. Untreated animals
animals served
served as as naïve
naïve controls for controls for
neuropathology neuropathology
and gene andexpression
gene expressionstudies;
studies; piglets in thein
piglets control-normothermia group (C-NT) were
the control-normothermia group (C-NT)
anesthetized, ventilated, and monitored but not subjected to asphyxia. Animals of the
were anesthetized, ventilated, and monitored but not subjected to asphyxia.
asphyxia-normothermia group (A-NT) were exposed to 20 min asphyxia induced by ventilation with Animals of the
asphyxia-normothermia
4% O2–20% CO2 gas group
mixture.(A-NT)
Animalswere exposed to 20 min
in the asphyxia-hypothermia asphyxia
group induced
(A-HT) were cooled downby ventilation
with 4% O2 –20%to 33.5 °C,
CO starting 2 h after reventilation, and were gradually rewarmed from 36 h to normothermia
2 gas mixture. Animals in the asphyxia-hypothermia group (A-HT) were
by 0.5 °C/h in◦ 10 h. H2-treatment was initiated at the onset of reventilation after asphyxia (21%O2–
cooled down2.1% to H 33.5 C, starting 2 h after reventilation, and were gradually rewarmed from 36 h
2, 4 h) and was combined with hypothermia (A-HT + H2 group). In a similar fashion, CO2-
to normothermia by was ◦ C/h in 10 h. H -treatment was initiated at the onset of reventilation after
0.5 initiated
treatment at the onset 2 of reventilation after asphyxia and was combined with
asphyxia (21%O hypothermia
2 –2.1% (A-HT
H 2 , 4+ h) was combined with hypothermia (A-HT + H2 group). In a similar
2 group). In order to achieve graded restoration of normocapnia, the animals
COand
were ventilated first with 21% O2–10% CO2 for 2 h and then with 21% O2–5% CO2 for 2 h before
fashion, CO2switching
-treatment was initiated at the onset of reventilation after asphyxia and was combined
back to air. Arterial blood samples were collected and visual evoked potential (VEP)
with hypothermia (A-HT
measurements were+performed
CO2 group). In order
at the marked to achieve graded restoration of normocapnia,
time points.
the animals were ventilated first with 21% O2 –10% CO2 for 2 h and then with 21% O2 –5% CO2 for 2 h
2.1. Physiological Parameters during Asphyxia and HIE Development
before switching back to air. Arterial blood samples were collected and visual evoked potential (VEP)
measurements At were
the beginning
performed of theat experiments,
the marked piglets
timeinpoints.
all groups had similar physiological values [28]
of core temperature (38.5 ± 0.2 °C), mean arterial blood pressure (MABP; 57 ± 10 mmHg), and heart
rate (HR;
2.1. Physiological 140 ± 20 bpm),
Parameters respectively
during Asphyxia (Figure
and2A–C).
HIE Immediately after the onset of asphyxia, MABP
Development
and HR were first markedly raised (at peak, they were 73 ± 12 mmHg and 206 ± 22 bpm, respectively)
but then continuously
At the beginning decreased by the
of the experiments, end of the
piglets asphyxia
in all (at the
groups hadnadir, they were
similar 38 ± 17 mmHgvalues [28] of
physiological
and 138 ± 33 bpm, respectively). Reventilation resulted in quick restoration of MABP and HR; then,
core temperature (38.5 ± 0.2 ◦ C), mean arterial blood pressure (MABP; 57 ± 10 mmHg), and heart rate
MABP values were kept in the physiological range and the values did not differ significantly among
(HR; 140 ± 20thebpm), respectively
experimental (Figure the
groups throughout 2A–C). Immediately
48 h observation period after
(Figurethe
2B).onset of onset
After the asphyxia,
of the MABP and
HR were firstTHmarkedly
treatment, core
raisedtemperatures
(at peak, differed
they between
were 73 the±normothermic
12 mmHg and andhypothermic
206 ± 22 bpm,animalsrespectively)
(Figure 2A); also, a clear reduction in HR developed in the hypothermic groups of animals compared
but then continuously decreased by the end of the asphyxia (at the nadir, they were 38 ± 17 mmHg
to the normothermic ones (Figure 2C).
and 138 ± 33 bpm, respectively). Reventilation resulted in quick restoration of MABP and HR; then,
MABP values were kept in the physiological range and the values did not differ significantly among
the experimental groups throughout the 48 h observation period (Figure 2B). After the onset of the TH
treatment, core temperatures differed between the normothermic and hypothermic animals (Figure 2A);
also, a clear reduction in HR developed in the hypothermic groups of animals compared to the
normothermic ones (Figure 2C).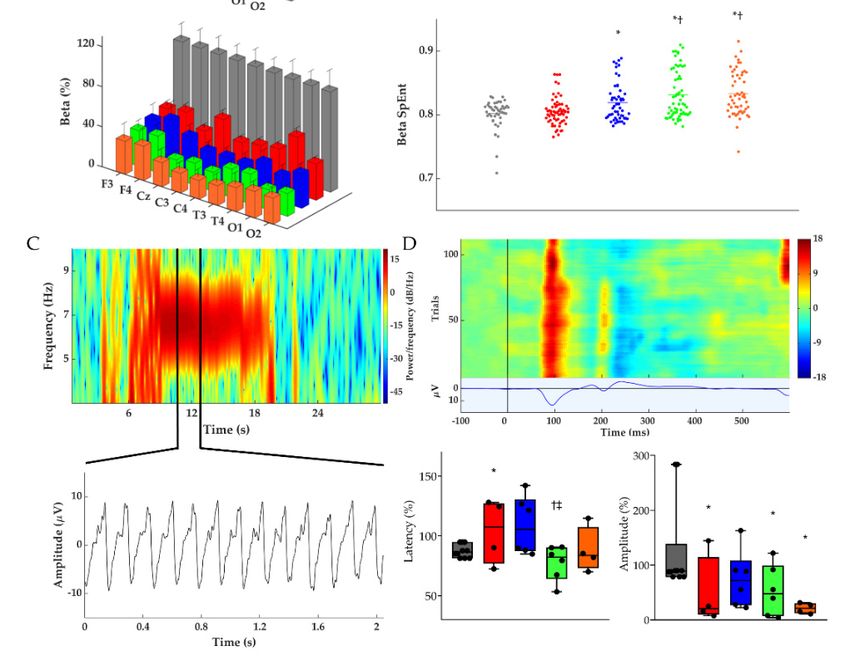
Int. J. Mol. Sci. 2020, 21, 6801 4 of 22
Int. J. Mol. Sci. 2019, 20, x FOR PEER REVIEW 4 of 22
Figure 2.2. Core temperature (A), mean arterial blood pressure (MABP) (B), and heart rate (C) data in
the time controls
controls and
and in the asphyxia groups
groups during
during baseline
baseline (B),
(B), in
in the
the last minute
minute of 20 min asphyxia
(ASPH),
(ASPH), and andthe 48 48
the h survival period.
h survival The core
period. Thetemperature and the heart
core temperature and rate
the values werevalues
heart rate significantly
were
higher in the normothermic groups (control-normothermia C-NT and
significantly higher in the normothermic groups (control-normothermia C-NT and asphyxia-normothermia A-NT)
compared to the hypothermic
asphyxia-normothermia A-NT)ones (asphyxia-hypothermia
compared to the hypothermicA-HT, A-HT + H2 , and A-HTA-HT,
ones (asphyxia-hypothermia + COA-2 );
however,
HT + H2, and there were+ no
A-HT COsignificant
2); however,differences
there wereinnoMABP. Datadifferences
significant are shown in mean ±Data
asMABP. SEM. < 0.05
arep shown
*asnormothermia
mean ± SEM. vs. p < hypothermia groups.vs. hypothermia groups.
0.05 * normothermia
The monitored blood
The monitored bloodchemistry
chemistryparameters
parameterssuch such as as arterial
arterial blood
blood pH,pH,bloodblood
gases,gases, glucose,
glucose, and
and lactate levels were similar and within the normal range in
lactate levels were similar and within the normal range in all groups at baseline (Figure 3A–F).all groups at baseline (Figure 3A–F).
However,
However, blood blood analysis
analysis at at the
the end
end of of asphyxia
asphyxia revealed
revealed severe
severe combined
combined metabolic
metabolic and and respiratory
respiratory
acidosis with corresponding hypercapnia and lactacidemia (Figure
acidosis with corresponding hypercapnia and lactacidemia (Figure 3A,B,E), as well as hypoxemia 3A,B,E), as well as hypoxemia
(Figure
(Figure 3C)
3C) andand negative
negative base base excess
excess (Figure
(Figure 3F), that were
3F), that were similar
similar in in all
all groups
groups exposed
exposed to to asphyxia.
asphyxia.
After asphyxia,
After Int.
asphyxia, blood
blood gases quickly returned
returned to to baseline
baseline levels
levels and and then
then they
they were
were not not statistically
J. Mol. Sci. 2019, 20, xgases quickly
FOR PEER REVIEW statistically
5 of 23
different
different from the corresponding values of the control-normothermia group, with the notable exception
from the corresponding values of the control-normothermia group, with the notable exception
of
of the asphyxia-hypothermia+CO
elevated along with large drops
the asphyxia-hypothermia+CO 2 group. In In
in base
2 group. thisthis
excess group,
(F),
group, thethe
indicating continued
the
continued metabolic ventilation
responsewith
ventilation with
10% 10%
to asphyxia. or 5% orCO5%2
CO was reflected
was2 reflectedAfterin theingradual
asphyxia, the gradual
arterial restoration
pH and pCO2 of
restoration pHofreflected
values pH pCO
and andthepCO
effect ofat10-5%
1 and CO42 ventilation
h, respectively (Figure 3A,B).
in the graded
2 at 12 and 4 h, respectively (Figure 3A,B). The
The elevated reduction
blood of normocapnia
lactate levels group
also gradually CO2); otherwise,
(A-HT + returned to reventilation
baseline levels; restored
they weremost of significantly
still the
elevated blood lactate levels also gradually returned to baseline levels; they were still significantly
elevated parameters by 4 h, and they were not significantly different from baseline levels afterwards.
elevated at at 11 h
h after
after asphyxia
Experimental
asphyxia
groups:
in all
all groups
groups compared
in control-normothermia
compared(C-NT), to
to the
the control-normothermia
control-normothermia
asphyxia-normothermia
group,
group,
(A-NT),
but
but there
there
was no difference
was no difference among the
among the(A-HT), groups
groups at any
at any time point
time point afterwards (Figure 3E). The blood glucose
asphyxia-hypothermia A-HT supplemented withafterwards
H2 (A-HT + (Figure
H2) or CO 3E). The blood glucose
2 (A-HT + CO2),
levels
levels remained
remained slightly
slightly
respectively.
elevated
Bars elevated
and whiskers
at
at 11represent
h
h of
of reventilation
reventilation
mean ± SEM,but
but then returned
then* vs.
p < 0.05 returned to
to baseline
all groups; ‡baseline values
† vs. A- by
vs. C-NT;values by 44 hh of
of
reventilation (Figure
reventilation (Figure 3D).
NT; # vs. A-HT. 3D).
Figure 3. Blood chemistry data at baseline (B), in the last minute of 20 min asphyxia (ASPH), and the
Brain Interstitial H2 Concentration Measurements
subsequent observation
Figure 3. Blood chemistryperiod.
data atArterial
baselineblood gasthe
(B), in analysis revealed
last minute of 20that
minasphyxia
asphyxiaresulted
(ASPH),inand
severe
the
To(A),
acidosis show the efficacy
hypercapnia and
(B), the dynamics
hypoxemia (C). of the applied
Plasma glucose H2-inhalation
(D) and lactateprotocol
levels towere
(E) increase brain
markedly
subsequent observation period. Arterial blood gas analysis revealed that asphyxia resulted in severe
H2 levels, cerebrocortical H2 levels were determined in three additional normothermic, normoxic
acidosis (A), hypercapnia (B), hypoxemia (C). Plasma glucose (D) and lactate levels (E) were markedly
control animals, and they were found to increase quickly and reach steady-state levels in 10–15 min;
the average H2 concentration was 13.1 ± 3.4 µM (Figure 4).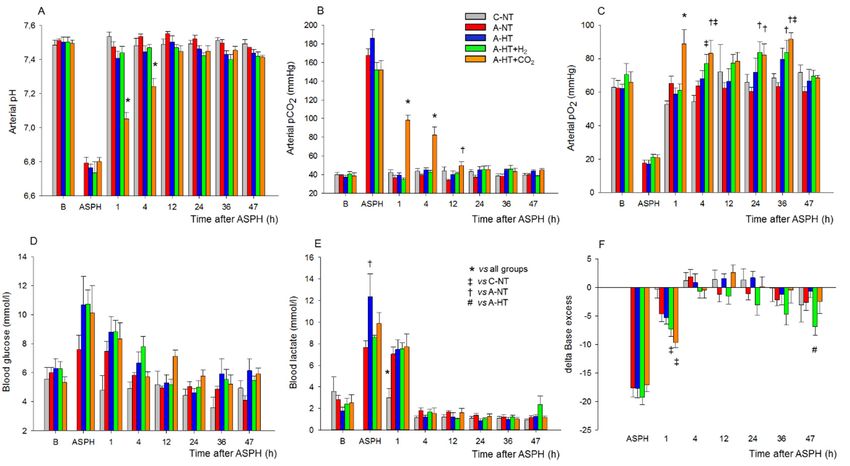
Int. J. Mol. Sci. 2020, 21, 6801 5 of 22
Int. J. Mol. Sci. 2019, 20, x FOR PEER REVIEW 5 of 22
elevated along with large drops in base excess (F), indicating the metabolic response to asphyxia.
elevated along with large drops in base excess (F), indicating the metabolic response to asphyxia.
After asphyxia, arterial pH and pCO2 values reflected the effect of 10-5% CO2 ventilation in the graded
After asphyxia, arterial pH and pCO2 values reflected the effect of 10–5% CO2 ventilation in the
reduction of normocapnia group (A-HT + CO2); otherwise, reventilation restored most of the
graded reduction of normocapnia group (A-HT + CO2 ); otherwise, reventilation restored most of the
parameters by 4 h, and they were not significantly different from baseline levels afterwards.
parameters by 4 h, and they were not significantly different from baseline levels afterwards. Experimental
Experimental groups: control-normothermia (C-NT), asphyxia-normothermia (A-NT),
groups: control-normothermia (C-NT), asphyxia-normothermia (A-NT), asphyxia-hypothermia (A-HT),
asphyxia-hypothermia (A-HT), A-HT supplemented with H2 (A-HT + H2) or CO2 (A-HT + CO2),
A-HT supplemented with H2 (A-HT + H2 ) or CO2 (A-HT + CO2 ), respectively. ‡Bars and whiskers
respectively. Bars and whiskers represent mean‡± SEM, p < †0.05 * vs. all# groups; vs. C-NT; † vs. A-
represent mean ± SEM, p < 0.05 * vs. all groups; vs. C-NT; vs. A-NT; vs. A-HT.
NT; # vs. A-HT.
Brain Interstitial H
H22 Concentration Measurements
To
To show
show the
the efficacy
efficacy and
and the
the dynamics
dynamics of
of the
the applied
applied H
H22-inhalation
-inhalation protocol to increase brain
H2 levels, cerebrocortical H2 levels were determined in threethree additional
additional normothermic,
normothermic, normoxic
normoxic
control animals, and they were found to increase quickly and reach steady-state levels in 10–15 min;
concentration was 13.1 ±±3.4
the average H22 concentration 3.4µM (Figure 4).
µM (Figure 4).
Figure
Figure 4. Cerebrocortical H
4. Cerebrocortical concentration changes
H22 concentration changes during
during 2.1%
2.1%H H22 ventilation.
ventilation. H gas was
H22 gas was ventilated
ventilated
to animals (n = 8 trials from n =
to the animals (n = 8 trials from n = 3 piglets) until steady state H2 levels were reached at 10–15 min
the 3 piglets) until steady state H 2 levels were reached at 10–15 min
after
after initiation
initiation of
of H ventilation (grey
H22 ventilation (grey lines—individual
lines—individual traces,
traces, bold
bold black
black line—mean).
line—mean).
2.2. Electroencephalography (EEG) Analysis
2.2. Electroencephalography (EEG) Analysis
At baseline conditions before asphyxia, similar continuous EEG activity (>25 µV amplitude) could
At baseline conditions before asphyxia, similar continuous EEG activity (>25 µV amplitude)
be observed in all groups. The control-normothermia group maintained continuous, high-amplitude
could be observed in all groups. The control-normothermia group maintained continuous,
EEG activity throughout the observation period (Figure 5A). The EEG became isoelectric within
high-amplitude EEG activity throughout the observation period (Figure 5A). The EEG became
1–2 min after the onset of asphyxia; then, the EEG activity regenerated progressively but showed large
isoelectric within 1–2 min after the onset of asphyxia; then, the EEG activity regenerated
inter-individual variability (Figure 5B,E). The total scores showed well the effect of asphyxia, but there
progressively but showed large inter-individual variability (Figure 5B,E). The total scores showed
were no significant differences among the treatment groups (Figure 5F).
well the effect of asphyxia, but there were no significant differences among the treatment groups
The restoration of EEG activity in the different groups was also quantitatively analyzed after
(Figure 5F).
rewarming toward the end of the 48 h observation period by determining power spectral density
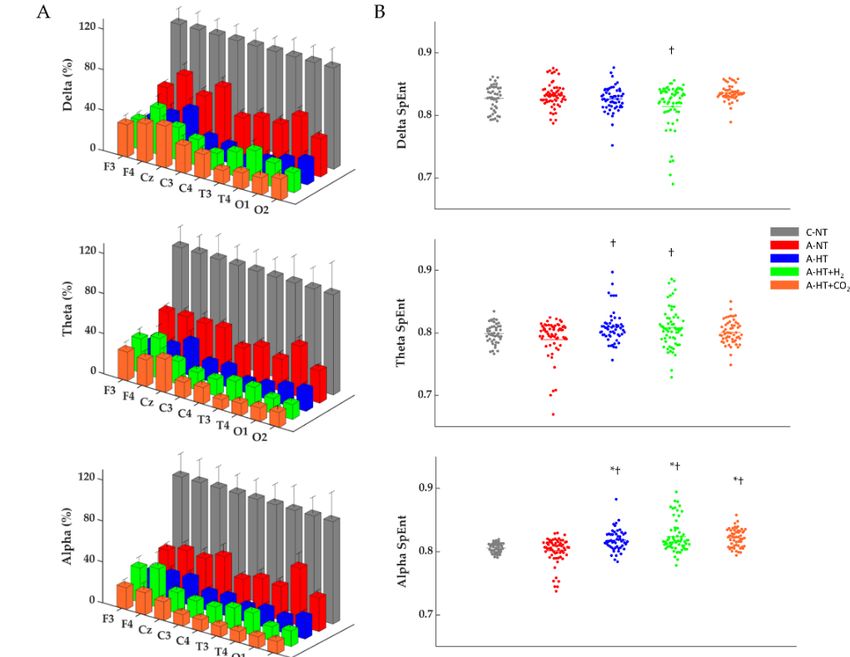
(PSD; Figure 6A, Table S2), spectral entropy (SpEnt; Figure 6B), and visual evoked potentials (VEP;
Figure 6D). The effect of asphyxia on PSD in all frequency ranges is conspicuous (Figure 6A). Although
the asphyxia-normothermia group shows higher PSDs, especially at lower (δ-θ) frequencies, than the
hypothermia-treated groups, this was found to be due to the higher incidence of generalized seizures,
abnormal waveforms, and spikes; for example, see Figure 6C—these seizures were virtually absent
in the hypothermia-treated groups. SpEnt revealed high temporal complexity in all frequency
bands that were due to the anesthesia alone in the control-normothermia group, while they were
affected by asphyxia-induced changes in the other four groups. Comparing these, SpEnt values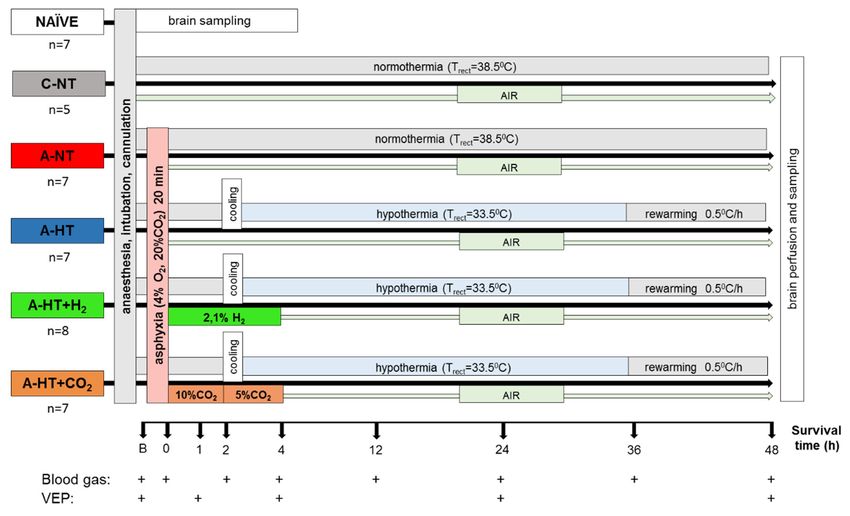
Int. J. Mol. Sci. 2020, 21, 6801                                                                                                6 of 22

were increased in the hypothermia-treated groups compared to the asphyxia-normothermia group,
especially at the higher frequency (α-β) ranges (Figure 6B). Furthermore, the lower temporal
complexity shown by SpEnt in the asphyxia-normothermia group is also confirmed by the
calculated lowest instantaneous spectral entropy (InstSpEnt) representing the whole EEG signal
determined for this group. InstSpEnt values were 0.684 ± 0.054, 0.734 ± 0.073 *, 0.699 ± 0.69,
and 0.723 ± 0.075 * for asphyxia-normothermia, asphyxia-hypothermia, asphyxia-hypothermia+H2 ,
and asphyxia-hypothermia+CO2 groups, respectively (* p < 0.05, significantly different from the
asphyxia-normothermia group). VEP waveforms were severely affected by asphyxia; the changes were
dominated by attenuation of the P100 component amplitude. Compared to the respective baseline
(pre-asphyxia) values, attenuation of the P100 component was significant in all groups exposed to
asphyxia      except
Int. J. Mol. Sci.       forxthe
                  2019, 20,  FORasphyxia-hypothermia
                                 PEER REVIEW         group (Figure 6D).                     6 of 22

      Figure 5. The EEG recordings were scored using a previously published [14] amplitude-based
      Figure 5. The EEG recordings were scored using a previously published [14] amplitude-based scoring
      scoring system (Table S1), where higher scores represent progressive deterioration of electrical
      system (Table
      activity.          S1), where
                  Experimental          higher control-normothermia
                                     groups:     scores represent progressive
                                                                            (C-NT),deterioration       of electrical activity.
                                                                                         asphyxia-normothermia          (A-NT),
      Experimental         groups:       control-normothermia          (C-NT),         asphyxia-normothermia
      asphyxia-hypothermia (A-HT), A-HT supplemented with H2 (A-HT + H2 ) or CO2 (A-HT +                                (A-NT),
                                                                                                                           CO2 ),
      asphyxia-hypothermia
      respectively.    (A–E): The  (A-HT),    A-HT
                                      black line      supplemented
                                                   shows   the medianwith      H2 whereas
                                                                          values    (A-HT + the H2) shaded
                                                                                                     or CO2 area
                                                                                                               (A-HT     + CO2),
                                                                                                                     represents
      respectively.
      the 25th-75th A–E:     The black
                       interquartile       line C-NT
                                       range.   showsanimals
                                                        the median
                                                                 werevalues    whereasby
                                                                        characterized       the shaded area
                                                                                              continuous    EEG represents    the
                                                                                                                   activity and
      25th-75th
      low         interquartile
           EEG scores      duringrange.     C-NTexperiment,
                                    the entire    animals were    characterized
                                                                whereas    asphyxia  byinduced
                                                                                         continuous    EEG activity
                                                                                                  isoelectric   EEG thatand was
                                                                                                                             low
      EEG    scores   during    the  entire   experiment,    whereas     asphyxia      induced   isoelectric   EEG
      followed by slow regeneration of electrical activity in all experimental groups in the observation period.       that was
      followed
      There   werebynoslow   regeneration
                         significant          of electrical
                                       differences  among activity     in all experimental
                                                             the treatment    groups at anygroups         in thehowever,
                                                                                                 time points;      observationthe
      period.   There    were   no   significant   differences   among     the  treatment      groups   at  any
      large intra-individual variability can be appreciated. (F): The sum of EEG scores during the observation    time    points;
      however,
      period      the experimental
               in the  large intra-individual
                                        groups. variability
                                                   The black can
                                                               line be  appreciated.
                                                                    represents           F: The sum
                                                                                   the median,     the of
                                                                                                       boxEEGthescores    during
                                                                                                                  interquartile
      the observation     period  in  the  experimental   groups.   The   black  line   represents  the
      range, the whiskers the 10th-90th percentiles, the bullets the raw values. The summated EEG scores median,    the  box  the
      interquartile   range,  the  whiskers    the 10th-90th   percentiles,  the  bullets   the raw
      were significantly higher in the A-NT, A-HT + H2 , and A-HT + CO2 asphyxia groups compared to  values.   The   summated
      EEGC-NT
      the   scores(* pwere  significantly
                        < 0.05)  group, buthigher    in the
                                               this was  not A-NT,   A-HT
                                                              the cause   in the    2, andgroup,
                                                                              + HA-HT        A-HT suggesting
                                                                                                    + CO2 asphyxia       groups
                                                                                                                  that the  best
      comparedwas
      outcome      to the  C-NT
                       found       (* p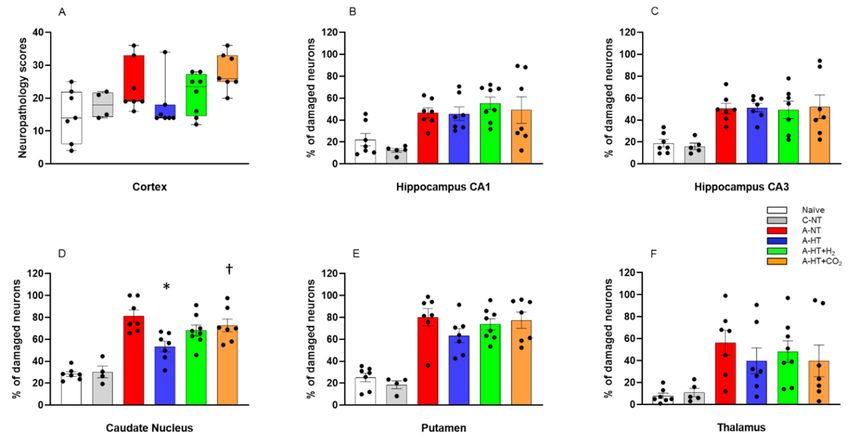
Int. J. Mol. Sci. 2020, 21, 6801                                                                                              7 of 22

  Int. J. Mol. Sci. 2019, 20, x FOR PEER REVIEW                                                                          7 of 22

        Figure6.6.(A)
      Figure       (A)Average
                       Average power
                                 power spectral
                                         spectral density
                                                   density(PSD)
                                                             (PSD)changes
                                                                     changesinin
                                                                               each
                                                                                  eachexperimental
                                                                                        experimental group   for for
                                                                                                         group   the the
                                                                                                                      fourfour
        mainfrequency
      main    frequency bands
                          bands atat the end
                                         end of
                                              of the
                                                 the 48
                                                      48 hhobservation
                                                            observationperiod.
                                                                           period.AllAll
                                                                                       PSDs
                                                                                         PSDswere
                                                                                                werenormalized
                                                                                                       normalized to their
                                                                                                                       to their
        respectivecontrol
      respective    control values
                             values for
                                     for each
                                         each lead.
                                               lead. Delta,
                                                      Delta,theta,
                                                              theta,alpha,
                                                                      alpha,and
                                                                              andbeta
                                                                                   betaPSDs
                                                                                         PSDsacross  thethe
                                                                                                across    different  leads
                                                                                                             different   leads
        showsignificant
      show     significant differences
                            differences between
                                         between each
                                                    each group.
                                                           group. (B)(B)Corresponding
                                                                          Corresponding   individual
                                                                                            individual spectral  entropy
                                                                                                           spectral   entropy
        (SpEnt)values
      (SpEnt)    values in
                        in each
                            eachgroup.
                                  group.(C)(C)
                                             Representative
                                                Representative spectrogram   of a generalized
                                                                   spectrogram                  seizureseizure
                                                                                   of a generalized      in a piglet
                                                                                                                  in from
                                                                                                                      a piglet
        the  asphyxia-normothermia       group   (~7  Hz)   which   could   be  detected   by  all
      from the asphyxia-normothermia group (~7 Hz) which could be detected by all 9 leads. Below   9  leads.  Below     the the
        spectrogram,   we  highlighted   a 2 s-long  spike-and-wave      seizure  waveform.   (D)  Representative
      spectrogram, we highlighted a 2 s-long spike-and-wave seizure waveform. (D) Representative heat                 heat
        map of the recorded VEP trials with their average VEP waveform below. The two box plots show the
      map   of the recorded VEP trials with their average VEP waveform below. The two box plots show the
        latency and peak amplitudes of the P100 components at the 48 h time point in each group, normalized
      latency and peak amplitudes of the P100 components at the 48 h time point in each group, normalized
        to the respective pre-asphyxia baseline values. The black line represents the median, the box the
      to the respective pre-asphyxia baseline values. The black line represents the median, the box the
        interquartile range, the whiskers the 10th–90th percentiles, the bullets the raw values. Experimental
      interquartile range, the whiskers the 10th–90th percentiles, the bullets the raw values. Experimental
        groups: control-normothermia (C-NT), asphyxia-normothermia (A-NT), asphyxia-hypothermia (A-
      groups: control-normothermia (C-NT), asphyxia-normothermia (A-NT), asphyxia-hypothermia (A-HT),
        HT), A-HT supplemented with H2 (A-HT + H2) or CO2 (A-HT + CO2), respectively. Data are mean ±
      A-HT supplemented         with H2 (A-HT + H2 ) or CO2 (A-HT + CO2 ), respectively. Data are mean ± SD;
        SD; * vs. C-NT,  † vs. A-NT, ‡ vs. A-HT, p < 0.05.
      * vs. C-NT, vs. A-NT, ‡ vs. A-HT, p < 0.05.
                    †
Int. J. Mol. Sci. 2020, 21, 6801 8 of 22
Int. J. Mol. Sci. 2019, 20, x FOR PEER REVIEW 8 of 22
Neuropathology
2.3. Neuropathology
Neuropathology assessment
assessment confirmed
confirmedsevere
severeHIE HIEdevelopment
developmentinducedinduced byby
asphyxia,
asphyxia, shown by
shown
increased
by neuronal
increased damage
neuronal compared
damage compared to naïve or control-normothermia
to naïve or control-normothermia animals, in virtually
animals, all studied
in virtually all
brain regions.
studied TH appeared
brain regions. to mitigate
TH appeared the neuronal
to mitigate damage damage
the neuronal in the neocortex, the caudate
in the neocortex, the nucleus,
caudate
the putamen,
nucleus, and the thalamus;
the putamen, and thehowever,
thalamus; statistically
however,significant neuroprotection
statistically was detected only
significant neuroprotection wasin
the caudate nucleus. In contrast, TH could not affect the severe neuronal damage in
detected only in the caudate nucleus. In contrast, TH could not affect the severe neuronal damage in the hippocampus.
Most
the importantly, the
hippocampus. additional
Most treatments
importantly, with H2 and
the additional CO2 didwith
treatments not Hprovide
2 and COany2 did
additional beneficial
not provide any
effects; in beneficial
additional contrast, in several
effects; regions, in
in contrast, such as the
several neocortex
regions, such or the neocortex
as the basal ganglia,
or thethey
basalappeared
ganglia,
to abolish
they the neuroprotective
appeared effect of TH. In
to abolish the neuroprotective fact,ofneuronal
effect damage
TH. In fact, in thedamage
neuronal caudateinnucleus was
the caudate
significantly
nucleus higher in the higher
was significantly asphyxia-hypothermia+CO 2 group compared
in the asphyxia-hypothermia+CO 2 group tocompared
the asphyxia-hypothermia
to the asphyxia-
group (Figuregroup
hypothermia 7). (Figure 7).
Figure 7.
Figure Neuronal injury
7. Neuronal injury evaluated
evaluated atat 48
48 hh after
after asphyxia
asphyxia inin the
the different
different cortical
cortical and
and subcortical
subcortical
regions. (A): In the neocortex, neuropathology scores suggested that asphyxia-induced neuronal
regions. A: In the neocortex, neuropathology scores suggested that asphyxia-induced neuronal injury injury
was mitigated by hypothermia; however, there were no statistically significant differences
was mitigated by hypothermia; however, there were no statistically significant differences among the among
the groups
groups (lines,
(lines, boxes,boxes, whiskers,
whiskers, and bullets
and bullets represent
represent the median,
the median, the interquartile
the interquartile range, therange, the
10th-90th
10th-90th percentiles, and raw data, respectively). (B–F): In the other assessed regions, cell
percentiles, and raw data, respectively). B–F: In the other assessed regions, cell counting revealed no counting
revealed no significant differences in the low percentage of damaged neurons between the naïve
significant differences in the low percentage of damaged neurons between the naïve and control-
and control-normothermia (C-NT) groups. Compared to the C-NT group, severe neuronal damage
normothermia (C-NT) groups. Compared to the C-NT group, severe neuronal damage was detected
was detected in virtually all areas in the groups that were subjected to asphyxia. Neuronal damage
in virtually all areas in the groups that were subjected to asphyxia. Neuronal damage was similar in
was similar in both the CA1 and the CA3 hippocampal subfields in all groups exposed to asphyxia,
both the CA1 and the CA3 hippocampal subfields in all groups exposed to asphyxia, despite
despite hypothermia treatment. However, in the asphyxia-hypothermia (A-HT) group, a significant
hypothermia treatment. However, in the asphyxia-hypothermia (A-HT) group, a significant decrease
decrease in percentage of damaged neurons in the caudate nucleus was observed compared to the
in percentage of damaged neurons in the caudate nucleus was observed compared to the
asphyxia-normothermia (A-NT) group, and there was a similar tendency in the putamen and the
asphyxia-normothermia (A-NT) group, and there was a similar tendency in the putamen and the
thalamus. Importantly, co-treatment with H2 or CO2 to achieve graded restoration of normocapnia
thalamus. Importantly, co-treatment with H2 or CO2 to achieve graded restoration of normocapnia did
did not augment the hypothermia-induced neuroprotection (A-HT + H and A-HT + CO groups,
not augment the hypothermia-induced neuroprotection (A-HT + H2 2and A-HT + CO22 groups,
respectively). Instead, a significant increase in neuronal damage was observed in the caudate nucleus in
respectively). Instead, a significant increase in neuronal damage was observed in the caudate nucleus
the A-HT + CO2 -treated group compared to the A-HT group. Data are mean ± SEM; bullets represent
in the A-HT + CO2-treated group compared to the A-HT group. Data are mean ± SEM; bullets
raw data, * vs. A-NT; † vs. A-HT, p < 0.05; statistical significance from naïve or C-NT groups is not
represent raw data, * vs. A-NT; † vs. A-HT, p < 0.05; statistical significance from naïve or C-NT groups
shown. Representative photomicrographs are shown in Supplementary Figures S1–S5.
is not shown. Representative photomicrographs are shown in Supplementary Figures S1–S5.
2.4. Gene Expression Studies
2.4. Gene Expression Studies
Based on the neuropathology data, we selected four brain regions—the frontal cortex, the occipital
Based
cortex, on the neuropathology
the hippocampus, data, nucleus—that
and the caudate we selected four brainfrom
differed regions—the
each otherfrontal
both incortex, the
the degree
occipital cortex, the hippocampus, and the caudate nucleus—that differed from each other
of neuronal injury after asphyxia and the efficacy of TH to exert neuroprotection. We determinedboth in
the degree of neuronal injury after asphyxia and the efficacy of TH to exert neuroprotection. We
determined changes in BDNF, AIF, and caspase-3 expression to assess the impact of asphyxia and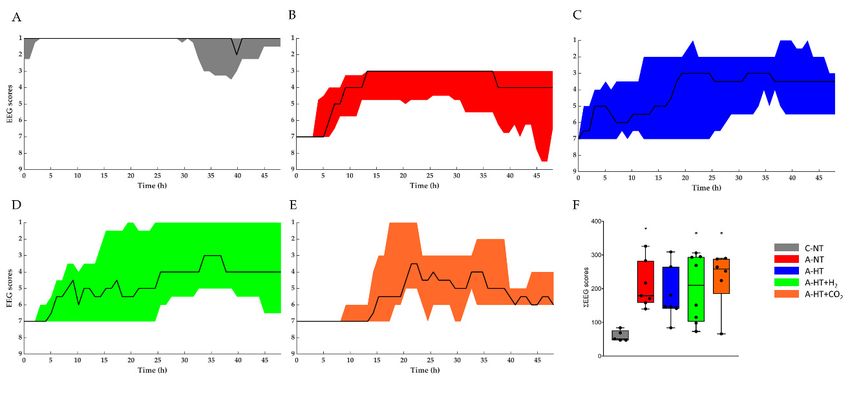
Int. J. Mol. Sci. 2020, 21, 6801 9 of 22
Int. J. Mol. Sci. 2019, 20, x FOR PEER REVIEW 9 of 22
changes in BDNF, AIF, and caspase-3 expression to assess the impact of asphyxia and TH (Figure 8).
There were 8).
TH (Figure noThere
significant
were nodifferences
significantindifferences
the mRNA in levels
the mRNAof any genes
levels in any
of any genesregion
in anybetween
region
the control-normothermia
between and asphyxia-normothermia
the control-normothermia and asphyxia-normothermia groups.groups.
Furthermore, as compared
Furthermore, with
as compared
the asphyxia-normothermia
with the asphyxia-normothermia group, mRNA
group, mRNA levels forfor
levels allall
three genes
three genesremained
remainedunchanged
unchanged in in the
frontal cortex in the asphyxia-hypothermia animals (Figure (Figure 8A).
8A). However,
However, in the
the other
other three
three regions,
regions,
BDNF andandAIFAIFmRNA
mRNA levels werewere
levels significantly increased
significantly in the asphyxia-hypothermia
increased group compared
in the asphyxia-hypothermia group
to the asphyxia-normothermia
compared animals (Figure
to the asphyxia-normothermia 8B–D).
animals Caspase-3
(Figure 8B–D).mRNA levels
Caspase-3 were levels
mRNA also induced by
were also
hypothermia
induced after asphyxia
by hypothermia in the
after occipital
asphyxia in cortex and thecortex
the occipital hippocampus (Figure 8B,C) but
and the hippocampus not in
(Figure the
8B,C)
caudate
but nucleus
not in (Figure
the caudate 8D). (Figure 8D).
nucleus
Figure 8.
Figure Geneexpression
8. Gene expressiondatadatafor
forBDNF,
BDNF,AIF,
AIF,and
and caspase-3
caspase-3 genes
genes in in
fourfour different
different brain
brain regions.
regions. A:
(A): In the frontal cortex, BDNF mRNA levels were significantly higher in the
In the frontal cortex, BDNF mRNA levels were significantly higher in the naïve (untreated) group,naïve (untreated) group,
but they
but theywerewerevery
verysimilar
similarininthethe control-normothermia
control-normothermia (C-NT),
(C-NT), asphyxia-normothermia
asphyxia-normothermia (A-NT),
(A-NT), and
and asphyxia-hypothermia (A-HT) groups. AIF and caspase-3 levels were also
asphyxia-hypothermia (A-HT) groups. AIF and caspase-3 levels were also very similar in all four very similar in all four
groups. B:
groups. (B):InInthe
theoccipital
occipitalcortex,
cortex,the
themRNA
mRNAlevels
levelsof ofall
allthree
three genes
genes were
were significantly
significantly elevated
elevated inin
the A-HT group compared to the A-NT group. (C): In the hippocampus,
the A-HT group compared to the A-NT group. C: In the hippocampus, an identical pattern of an identical pattern of gene
gene
expression was
expression was observed.
observed. (D):
D: InInthe
thecaudate
caudatenucleus,
nucleus,BDNF
BDNFand andAIFAIFbut
but not
not caspase-3
caspase-3 mRNA
mRNA levels
levels
were
were significantly
significantly increased
increased inin the
the A-HT group compared
A-HT group compared to the A-NT
to the A-NT group.
group. Lines,
Lines, boxes,
boxes, whiskers,
whiskers,
and bullets represent the median, the interquartile range, the 10th–90th percentiles,
and bullets represent the median, the interquartile range, the 10th–90th percentiles, and raw data, and raw data,
respectively. * vs. A-NT p < 0.05.
respectively. * vs. A-NT p < 0.05.
3. Discussion
3. Discussion
The major findings of the present study are the following: (1) we employed a severe HIE model in
which THmajor
The alonefindings of the
was unable present severe
to prevent study are the following:
neuronal injury; (2)(1)
wewe employedInstSpEnt
determined a severe HIE
andmodel
SpEnt
in which THtoalone
in addition was VEP
PSD and unable to prevent severe
to characterize neuronal injury;changes
electrophysiological (2) we determined InstSpEnt and
during HIE-development
SpEnt in addition
in our piglet model;to(3)PSD and VEP
we made novelto observations
characterize on electrophysiological
region-specific gene changes during
expression HIE-
changes
development in our piglet
induced by asphyxia or TH,model; (3)to
starting wedecipher
made novel observations
the underlying on region-specific
mechanisms gene expression
of the region-dependent
changes induced by asphyxia or TH, starting to decipher the underlying mechanisms
neuroprotective effect of TH, and (4) we found that neither molecular H2 nor graded restoration of the
of
region-dependent neuroprotective effect of TH, and (4) we found that neither molecular
normocapnia with CO2 could provide an additive neuroprotective effect to TH in this piglet HIE model. H 2 nor
graded restoration of normocapnia with CO2 could provide an additive neuroprotective effect to TH
in this piglet HIE model.Int. J. Mol. Sci. 2020, 21, 6801 10 of 22
In the present study, we employed a severe HIE piglet model to represent the group of HIE patients
in which TH alone is unlikely to prevent the development of adverse neurological consequences.
These affected infants would benefit the most from adjunct neuroprotective therapies complementing
the neuroprotective effect of TH. Two such promising adjunct medical gas therapies, namely H2
ventilation and graded restoration of normocapnia achieved with CO2 ventilation, have been tested
in the present study. Hypothermia was initiated 2 h after asphyxia, in agreement with previous
studies using hypothermia-induced neuroprotection in different HIE piglet models [29,30]. The 48 h
observation period allowed most of the asphyxia-induced neuronal damage to develop [30]; it also
enabled us to perform the recommended slow rewarming protocol (∆T/t = 0.5 ◦ C/h, 10 h) to prevent
adverse systemic effects of cooling. However, neuronal damage may continue beyond the observed
period, and the 34 h duration of therapeutic level TH employed in the present study may have been
still suboptimal to exert the maximal neuroprotective effect of TH. This is a clear limitation of our
study; indeed, neuroprotection afforded by 72 h local brain cooling was clearly superior to 48 h cooling
in prenatal sheep [31]. Furthermore, the 2 h delay in hypothermia treatment initiation used in the
present study may have also limited the neuroprotective effect of TH, although this would have likely
facilitated the detection of potential additive effects as these were initiated immediately after asphyxia
in the present study. These limitations should be considered when designing future studies to assess
new treatments combined with TH.
EEG recording was used to determine a host of parameters aimed to characterize the functional
consequences of asphyxia and to assess the efficacy of neuroprotective treatments in the present study.
PSDs are easy to compute and clearly reflect the current functional state of the cortex as well as showing
altered neuronal activity including seizures [32]. Studying entropy is more complicated due to the
chaoticity and non-linearity of the biological (e.g., EEG) signal. InstSpEnt and SpEnt are relatively
simple parameters that yield information on the instantaneous state of the whole signal and the normal
power distribution in the respective frequency domain, respectively. Determination of InstSpEnt and
SpEnt are commonly used approaches in electrophysiology [33,34] but not employed frequently in
neonatology. In our study, we could show that, in the asphyxia-normothermia group, the higher PSD
values were accompanied by lower InstSpEnt and SpEnt values, showing that low-entropy abnormal
rhythmic (seizure) activities contributed more to the EEG signal than in the asphyxia-hypothermia
groups. The higher InstSpEnt and SpEnt values measuring EEG signal complexity found in the
hypothermia-treated groups are in concert with the neuroprotective effect of TH, even though
hypothermia in this study was unable to restore PSDs after asphyxia. These findings help to establish
novel outcome measures for translational HIE research or even the development of an artificial
intelligence based toolbox for neonatal EEG monitoring. VEPs are also good predictors of neurological
functional alterations in newborns [35,36]. Asphyxia resulted in abnormal VEP waveforms altering
both signal latency and amplitude in all groups, similar to observations in animal models [37] or human
neonates [38]. We observed significant amplitude decreases in all experimental groups; the smallest
reduction was observed in the asphyxia-hypothermia group. All electrophysiology parameters (PSDs,
InstSpEnt, SpEnt, VEP) indicated that the combination of hypothermia with either molecular H2 or
graded restoration of normocapnia was not superior to hypothermia alone.
Neuropathology essentially confirmed our electrophysiology findings in the present study:
asphyxia induced pronounced neuronal injury, especially in the hippocampus, the caudate nucleus,
and the putamen, while neuronal damage was more modest in the neocortex. TH significantly
reduced injury only in the caudate nucleus, in which region neuronal injury was most pronounced.
Thus, in theory, our HIE model was sufficient to show whether the applied adjunct neuroprotective
therapies could in fact facilitate hypothermia-induced neuroprotection to reach statistical significance.
However, neither molecular H2 nor graded restoration of normocapnia with CO2 was able to facilitate
neuroprotection; instead, in the caudate nucleus, the combination of TH with graded restoration of
normocapnia significantly abolished hypothermia-induced neuroprotection. Similar tendencies were
present in virtually every assessed region for both treatments. Our study has a clear limitation whichInt. J. Mol. Sci. 2020, 21, 6801 11 of 22
we must declare: the observed statistical power of the multiple comparisons (ranging between 0.11
and 0.84) were low in some regions to be sure to avoid type II errors. However, we believe that
this limitation may have only prevented us from not showing the adverse interaction of the adjunct
treatments with TH, but a marked additive neuroprotective effect of these was not overlooked in
any regions.
Molecular H2 has become an intensively studied cytoprotective/neuroprotective medical gas in
the last decade; for recent reviews of the widespread beneficial effects of H2 , please refer to [39–42].
Concerning HIE, many rodent studies using the Rice–Vannucci model of hypoxic-ischemic stress
established the neuroprotective effect of H2 [14,43–46]. Our research group was the first to show the
beneficial effect of H2 in a piglet HIE model, as H2 was found to preserve neurovascular function both
in the acute (at 1–2 h) and in the subacute (at 24 h) after asphyxia [15,16]. Furthermore, using more
severe asphyxia that was very similar to the one employed in the present study, H2 was shown to
significantly reduce neuronal injury, oxidative stress, and neuroinflammation assessed also at 24 h after
asphyxia [17,18]. In the present study, even more severe stress was employed (i.e., ventilation with 4%
instead of 6% O2 during asphyxia). This level of hypoxia during asphyxia was chosen as we found
that, if using 6% O2, hypothermia alone was so neuroprotective, this would have likely prevented
the assessment of combined hypothermia+H2 treatment (unpublished observations). This potential
limitation appears to have manifested in a recent study, in which both the hypothermia and the
hypothermia+H2 treated piglets after asphyxia made a very similar, essentially full recovery, excluding
the possibility for statistically valid comparisons between the efficacy of the treatments [19]. In the
present study, we used an identical H2 administration as in our previous studies; namely, H2 treatment
was applied in the first four hours of reventilation/reoxygenation. We now also showed for the first
time using H2 -selective microelectrodes that, in this experimental model, the applied H2 administration
protocol results quickly (in 10 min) in steady-state interstitial brain H2 levels of ~10–20 µM, and these
values are in accordance with blood H2 levels found in rats in which H2 -induced neuroprotection
against ischemic stress was demonstrated [13]. As we did not test cerebral H2 levels after asphyxia
or during TH, the changes in cerebral blood flow in either condition could affect the kinetics of H2
level changes; this is also a clear limitation of the findings. However, the applied H2 administration
route was shown to be appropriate for quick delivery of the putative neuroprotective gas in the
immediate/early reoxygenation period after asphyxia.
In contrast to H2 , the neuroprotective actions of CO2 in HIE are less established. It is clear
that, during hypoxic stress (8% O2 inhalation), low CO2 levels (hypocapnia) increase neuronal
damage in the Rice–Vannucci rat model compared to mild hypercapnia, corresponding to 6–9% CO2
inhalation [47]. However, in a subsequent study, a detrimental effect of more severe hypercapnia
(12–15% CO2 inhalation) has been demonstrated [48]. In our experiments, the concentration of inhaled
CO2 was 20% to achieve pCO2 values corresponding with those recorded in “natural” birth asphyxia
in piglets and humans [49–51]. This severe hypercapnia likely rather contributes to neuronal damage
during asphyxia in our model at least in part through the severe cerebral acidosis that exceeds the
systemic (blood) acidosis by more than 0.8 pH unit (6.79 vs. 5.94 for blood and brain extracellular
pH), respectively [52]. Hypocapnia has been shown to be detrimental to the brain not only during
hypoxic/ischemic stress but also in the resuscitation/reoxygenation period [20,53]. Hypocapnia may
signal impaired restoration of cellular metabolism, predicting unfavorable outcome of resuscitation
efforts [54]. Furthermore, hypocapnia can be a consequence of relative hyperventilation in response to
metabolic acidosis, and prevention of hypocapnia by inhalation of 5%CO2 may enhance the efficacy of
TH [55]. The question of whether increased CO2 levels (hypercapnia) maintained while establishing
normoxia after asphyxia would convey neuroprotection has been proposed by a set of rat studies
employing asphyxia very similar to the one employed in piglets in the present study [19,20,54]. In these
studies, the graded restoration of normocapnia has been shown to enhance endogenous protecting
mechanisms, preventing rapid restoration and overshoot of cerebral pH and improving oxygenation,
importantly also counteracting seizures, suggesting a profound neuroprotective effect.Int. J. Mol. Sci. 2020, 21, 6801 12 of 22
There is no clear explanation for the lack of efficacy of the combined treatment of either H2
or graded restoration of normocapnia with TH, as their precise mechanism of action is unknown.
As neither treatment was tested under normothermic conditions in this study, it is possible that they
could have exerted neutral or even detrimental effects in this experimental paradigm. Alternatively,
hypothermia, H2 or graded restoration of normocapnia may target the activation of similar or even the
same pro-survival mechanisms, and either one may activate these alone as efficiently as combined
with each other. For instance, TH, CO2 , and even H2 are known to reduce neuronal excitability and
metabolism, providing means for the occlusion of protective effects [55–58].
Asphyxia-induced changes in gene expression are well-known to affect neuronal viability.
However, data from large animal models are quite limited, and the results from these studies do not
necessarily confirm findings established in rodents. For example, phosphorylation of extracellular
signal-regulated kinases (ERK) and protein kinase B (Akt) were shown to be protective in the brains of
neonatal rodents, suggesting the activation of anti-apoptotic signaling pathways [26,59,60]. In contrast,
in our previous piglet study, we clearly demonstrated that baseline activation levels of ERK and Akt
are very high even under normoxic conditions in the perinatal period in newborn pigs, and these
phosphorylation levels—although they can be modified by selective inhibitors of ERK and Akt
kinases—remain unaffected after asphyxia [61]. Therefore, it is of great importance to re-study these
molecular pathways in large animal models, as these differences can explain the translation block that
often appears with neuroprotective mechanisms operating in small but not large animal brains.
BDNF, AIF, and caspase-3 mRNA levels were assessed in this study as these genes have been
previously shown to be involved in neuronal injury/survival associated with HIE and TH in piglet
models [25,27,62,63]. Postnatal stimulation of BDNF and its downstream elements with dietary
supplements has been shown to promote cognitive development in piglets [62]. Furthermore,
BDNF expression was upregulated by nicotine in the early phase (4 h) of HIE development triggered
with hypoxia in piglets, suggesting therapeutic potential for nicotine [25]. Olson et al. found that BDNF
mRNA was upregulated by the applied hypoxic/ischemic insult itself, and the response was unaltered
by the cooling temperatures (35, 33.5, or 30 ◦ C) employed in the study [27]. However, we observed that,
compared to control-normothermic animals, BDNF mRNA levels were essentially the same as in the
asphyxia-normothermia group. However, we did observe a significant increase in BDNF mRNA levels
in the asphyxia-hypothermia group in three regions: the occipital cortex, the hippocampus, and the
caudate nucleus. These findings suggest that hypoxia/ischemia and asphyxia may have different effects
on BDNF expression in the piglet brain, and BDNF overexpression may have a role in the mechanism
of hypothermia-induced neuroprotection. AIF and caspase-3 activation were involved in neuronal
apoptosis in the frontal cortex following global cerebral ischemia, and expression of these factors
was reduced by TH in minipigs [63]. Wang et al. reported that rewarming from hypothermia after
HI was associated with apoptosis in the motor and piriform cortex in a piglet model [64]. Rapidly
rewarmed piglets (4 ◦ C/h) had more caspase-3 cleavage in cerebral cortex than did piglets that remained
hypothermic or piglets that were rewarmed slowly (0.5 ◦ C/h). Using a caspase-3 inhibitor, apoptosis
was suppressed with rewarming. These results suggest that rewarming from hypothermia after HI
may promote apoptosis through pathways involving caspases [64]. However, rapid or slow rewarming
may have an indirect effect on the brain; a recent elegant study of prenatal lambs demonstrated that
slow or rapid rewarming has no effect on neuronal survival if the hypothermia treatment is restricted
to the brain, and there is no systemic hypothermia [65]. We found that TH after asphyxia upregulated
both AIF and caspase-3 mRNA levels in the hippocampus, but only AIF and not caspase-3 in the
caudate nucleus, coinciding with the selective neuroprotective effect of TH in the caudate nucleus.
Our results are preliminary as they are limited to mRNA levels; therefore, no speculation about protein
levels let alone activity should be assumed based on these findings alone.Int. J. Mol. Sci. 2020, 21, 6801 13 of 22
4. Materials and Methods
4.1. Animals
Ethical approval and permission to conduct the animal experiments were obtained in a
three-step process. First, the project (title: Study of neuroprotective strategies in a hypoxic-ischemic
encephalopathy newborn pig model) was first reviewed and approved by the Institutional Animal
Care and Use Committee of the University of Szeged (MÁB, project id nr.: I.74–7/2015, approved on
26 February 2015). Second, the project was forwarded to, reviewed, and approved by the Hungarian
National Scientific Ethical Committee on Animal Experimentation (ÁTET). Third, based on the approval
and recommendation by the ÁTET, the permit to obtain the animals was issued by the government
agency National Food Chain Safety and Animal Health Directorate of Csongrád County, Hungary
(permit nr: XIV./1414/2015, approved on 29 April 2015). The procedures were performed according to
the guidelines of the Scientific Committee of Animal Experimentation of the Hungarian Academy of
Sciences (updated Law and Regulations on Animal Protection: 40/2013. (II. 14.) Gov. of Hungary),
following the EU Directive 2010/63/EU on the protection of animals used for scientific purposes and
reported in compliance with the ARRIVE guidelines.
Newborn (You can also read