Little Shoal Bay Coastal Processes Issues and Options Assessment - John Gillon
←
→
Page content transcription
If your browser does not render page correctly, please read the page content below
Little Shoal Bay
Coastal Processes Issues and
Options Assessment

REPORT PREPARED FOR AUCKLAND COUNCIL   CONFIDENTIAL
Contact Details

                    Ryan Garner

                    WSP
                    Auckland
                    100 Beaumont St
                    Auckland 1010
                    New Zealand
                    +64 9 355 9500

                    PO Box 5848
                    Auckland 1141
                    ryan.garner@wsp.com

                    Document Details:
                    Date: 21/07/2020
                    Reference:3-AWD50.00
                    Status: Rev 3 DRAFT

                    Prepared by
                    Ana Serrano & Ryan Garner

                    Reviewed by
                    Matt Balkham

                    Approved for release by
                    Annise Raea

©WSP New Zealand Limited 2020                   i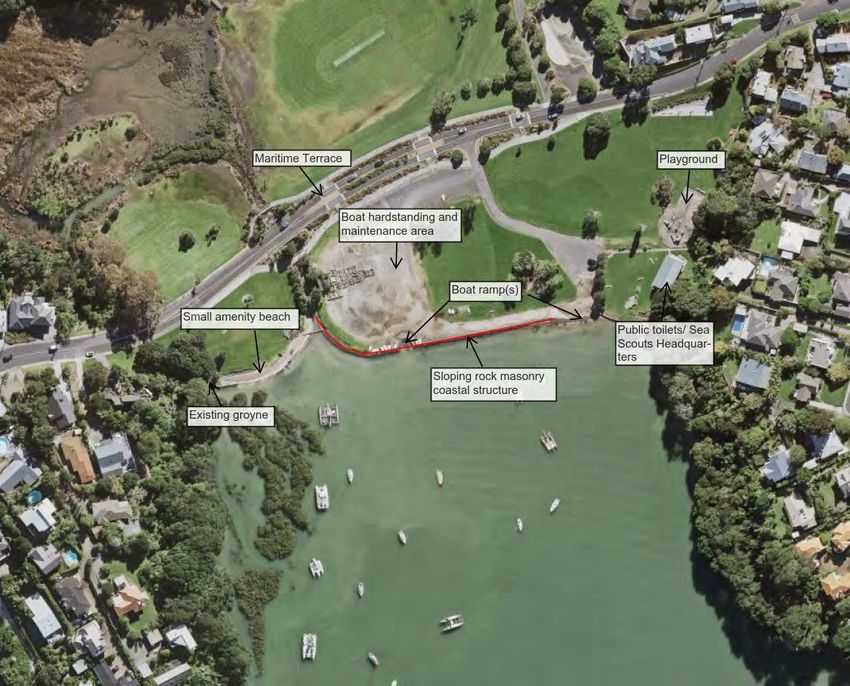
Little Shoal Bay - Coastal Processes Issues and Option Assessment

Document History and Status
     Revision           Date              Author              Reviewed by       Approved by       Status
 1                 29/01/2020        Ana Serano &         Matt Balkham        Annise Raea     DRAFT
                                     Ryan Garner
 2                 04/06/2020        Ryan Garner          Matt Balkham        Annise Raea     DRAFT
 3                 21/07/2020        Ryan Garner          Matt Balkham        Annise Raea     Final

Revision Details
     Revision                                                       Details
 2                Major restructure of report following Auckland Council comments. Also includes
                  new shoreline management options.
 3                Minor amendments following review comments from Auckland Council

Disclaimer and Limitations
This report (‘Report’) has been prepared by WSP exclusively for Auckland Council (‘Client’) in
relation to supporting the development of a long-term management measures for the Little Shoal
Bay area (‘Purpose’) and in accordance with the Auckland Council Coastal Term Contract
Statement of Works dated October 2019.

The findings in this Report are based on and are subject to the assumptions specified in the Report
and Project Contract (Statement of Works dated October 2019). WSP accepts no liability
whatsoever for any reliance on or use of this Report, in whole or in part, for any use or purpose
other than the Purpose or any use or reliance on the Report by any third party.

In preparing the Report, WSP has relied upon data, surveys, analyses, designs, plans and other
information (‘Client Data’) provided by or on behalf of the Client. Except as otherwise stated in the
Report, WSP has not verified the accuracy or completeness of the Client Data. To the extent that
the statements, opinions, facts, information, conclusions and/or recommendations in this Report
are based in whole or part on the Client Data, those conclusions are contingent upon the accuracy
and completeness of the Client Data. WSP will not be liable in relation to incorrect conclusions or
findings in the Report should any Client Data be incorrect or have been concealed, withheld,
misrepresented or otherwise not fully disclosed to WSP.

                                              ©WSP New Zealand Limited 2020                                1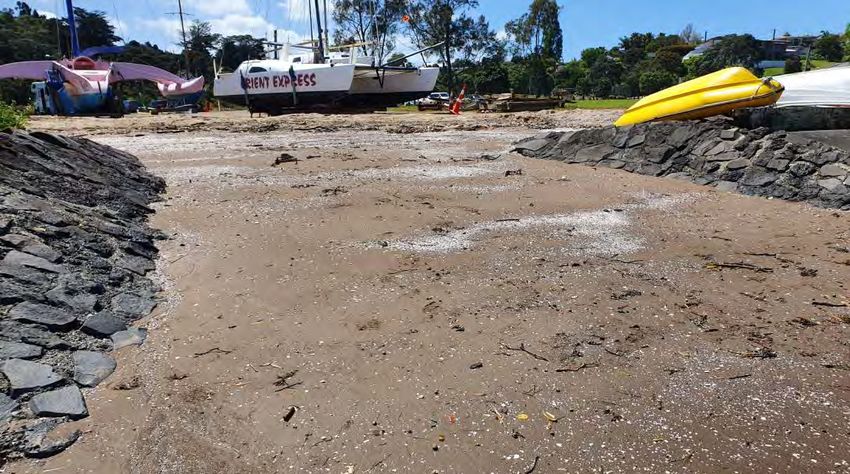
Little Shoal Bay - Coastal Processes Issues and Option Assessment

Contents
Executive Summary ....................................................................................................................................................................................................5

1           Introduction & Site Context ................................................................................................................................................................... 7
            1.1          Problem Definition ......................................................................................................................................................................... 7
            1.2          Geographic Location ..................................................................................................................................................................... 7
            1.3          Land Use ................................................................................................................................................................................................. 8
            1.4          Bathymetry and Topography ............................................................................................................................................... 9
            1.5          Geology and Beach Characteristics ................................................................................................................................ 11
            1.6          Historic context and development of the current shoreline .................................................................... 11

2           Coastal infrastructure condition assessment ....................................................................................................................... 13
            2.1          Coastal Infrastructure ................................................................................................................................................................. 13
            2.2          Seawalls.................................................................................................................................................................................................. 13
            2.3          Amenity Beach & Foreshore ................................................................................................................................................. 14
            2.4          Groyne ..................................................................................................................................................................................................... 15
            2.5          Boat Ramps / Foreshore Access ........................................................................................................................................16
            2.6          Mangrove ..............................................................................................................................................................................................18
            2.7          Stormwater Culvert ......................................................................................................................................................................18

3           Coastal Processes..........................................................................................................................................................................................19
            3.1          Water Levels ........................................................................................................................................................................................19
            3.2          Waves .......................................................................................................................................................................................................19
            3.3          Shoreline Morphology .............................................................................................................................................................. 24
            3.4          Coastal Hazards ..............................................................................................................................................................................25

4           Risk Management Options ................................................................................................................................................................ 28
            4.1          Option 1 - Do Nothing .............................................................................................................................................................. 28
            4.2          Option 2 - Maintain Existing Risk Management Approach .................................................................... 29
            4.3          Option 3 – Protect ........................................................................................................................................................................ 30
            4.4          Option 4 - Adapt ............................................................................................................................................................................ 33
            4.5          Initial Comparison of Options ............................................................................................................................................ 34

5           Summary & Recommendations .....................................................................................................................................................35

6           References ........................................................................................................................................................................................................ 36

                                                                                     ©WSP New Zealand Limited 2020                                                                                                                    2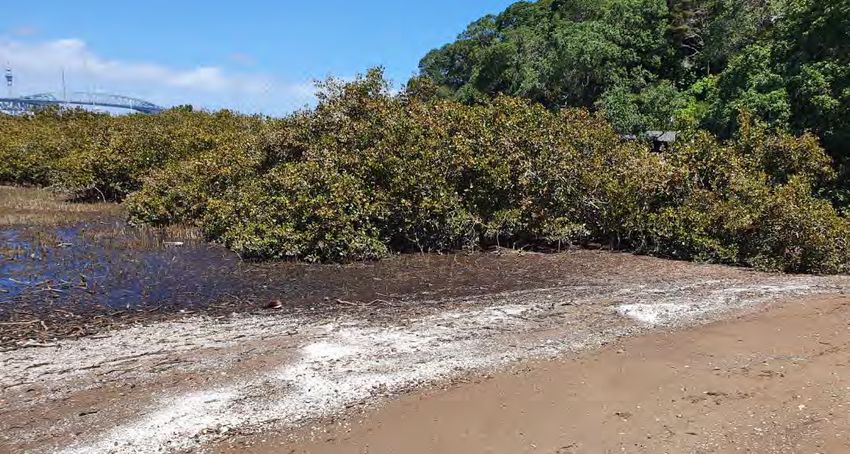
Little Shoal Bay - Coastal Processes Issues and Option Assessment

List of Figures
Figure 1. Little Shoal Bay location, Auckland, North Island of New Zealand (Base-maps from LINZ
Data). ....................................................................................................................................................................................................................................... 8
Figure 2 - Little Shoal Bay Embayment. Source Linz Data Service .................................................................................... 9
Figure 3. The images above both depict the Little Shoal Bay Bathymetric contours and for clarity
the image on the right has been marked-up to identify the shallower areas (assumed offshore
sand bars) and deeper area within the embayment (Source: Auckland Council GeoMaps) ................... 10
Figure 4. Photograph of Little Shoal Bay from Needles Eye Reserve at low tide. ................................................. 11
Figure 5 - Topography of Little Shoal Bay area .................................................................................................................................. 12
Figure 6. Aerial Photography of Little Shoal Bay taken in June 1947 (Retrieved from Morphum
Environmental Ltd (2018); Original source: Whites Aviation, Alexander Turnbull Library Collection). 13
Figure 7. Aerial Photography of Little Shoal Bay taken in March 1957 (Retrieved from Morphum
Environmental Ltd (2018); Original source: Whites Aviation, Alexander Turnbull Library Collection). 13
Figure 8. Little Shoal Bay hard coastal structures ............................................................................................................................ 14
Figure 9. Undermining of grouted rock seawall on the eastern boundary of Little Shoal Bay. ............... 15
Figure 10. Localised erosion on the eastern side of bay ............................................................................................................. 15
Figure 11. Eastern side of Little Shoal Bay showing accumulation of sediment and debris. .......................16
Figure 12. Small wave ripples on foreshore during low tide ...................................................................................................16
Figure 13. Construction of groyne structure to retain sediment on the eastern side, and the outlet
located on the west of Little Shoal Bay .................................................................................................................................................... 17
Figure 14. Groyne structure consisting of commercial sandbags with the aim of disrupting the
cross-shore sediment movement (Left: Photograph from WSP site visit on the 30th of October
2019; Right: Stuff.co.nz (July 31st 2019)........................................................................................................................................................18
Figure 15. Boat ramp .................................................................................................................................................................................................19
Figure 16. Debris and sediment accumulated on the top of the boat ramp ..........................................................19
Figure 17. Mangroves at the western side of Little Shoal Bay .............................................................................................. 20
Figure 18. Box Culverts in Little Shoal Bay, showing the left box culvert partially blocked by debris
and vegetation ............................................................................................................................................................................................................. 20
Figure 19.Wind rose diagram for the Waitemata Harbour entrance, annual wind speed [1 knot =
0.514 m/s] (Source: MetOcean Solutions Limited MSL SWAN model for the Hauraki Gulf). ...................... 23
Figure 20. SW fetch distance from Little Shoal Bay (Measured with Auckland Council's Geomaps
viewer: https://geomapspublic.aucklandcouncil.govt.nz/viewer/index.html) ......................................................... 23
Figure 21. 2018 - Little Shoal Bay aerial image (Source: LINZ Data Service) ..............................................................25
Figure 22. Coastal inundation for present day 5 and 20-year return period ........................................................... 27
Figure 23 - Box Culverts in Little Shoal Bay, showing a mean high springs scenario almost reaching
the orange line, which represents a water elevation prediction as best-case scenario of greenhouse
gas emission until 2120 (Source: Stuff – Little Shoal Bay: Rising sea level) ............................................................... 28
Figure 24. Timber and geotextile sand filled containers. (Photographs sourced from geograph.co.uk
and researchgate.net respectively. Last accessed 22nd November 2019). Note these structures may
not be appropriate for Little Shoal Bay .................................................................................................................................................. 30
Figure 25 - Potential locations of groynes along foreshore perpendicular to existing coastal
structures (Source: Auckland's Geomaps Interactive Viewer). .............................................................................................. 31
Figure 26- Initial concept for the design of an artificial beach or nourishment scheme ............................ 32
Figure 27 – Aerial imagery of Little Shoal Bay outling hydrodynamic and sediment cell movement.
(Source: Auckland's Geomaps Interactive Viewer). ....................................................................................................................... 34
Figure 28 - Coastal planting from Auckland Council ..................................................................................................................35

List of Tables
Table 1. Tidal level elevations converted to AVD-46 from LINZ Service Data Auckland Port. ....................19
Table 2. Present day extreme sea-level (excluding waves, w.r.t. AVD-46) in the Waitemata Harbour,
Little Shoal Bay, location 9 in original document (NIWA, 2013). .........................................................................................19
Table 3 Wave data statistics for Waitemata Harbour entrance. Data from MetOcean Solutions
Limited MSL SWAN model for the Hauraki Gulf. ............................................................................................................................. 21
Table 4. Extreme wind speeds from AS/NZS 1170.2.2011. .......................................................................................................... 21
Table 5. Wind data extreme values for Waitemata Harbour entrance. Data from MetOcean
Solutions Limited MSL SWAN model for the Hauraki Gulf. .................................................................................................... 21
Table 6. Calculated fetch-limited wind generated waves. ..................................................................................................... 23

                                                                                          ©WSP New Zealand Limited 2020                                                                                                                       3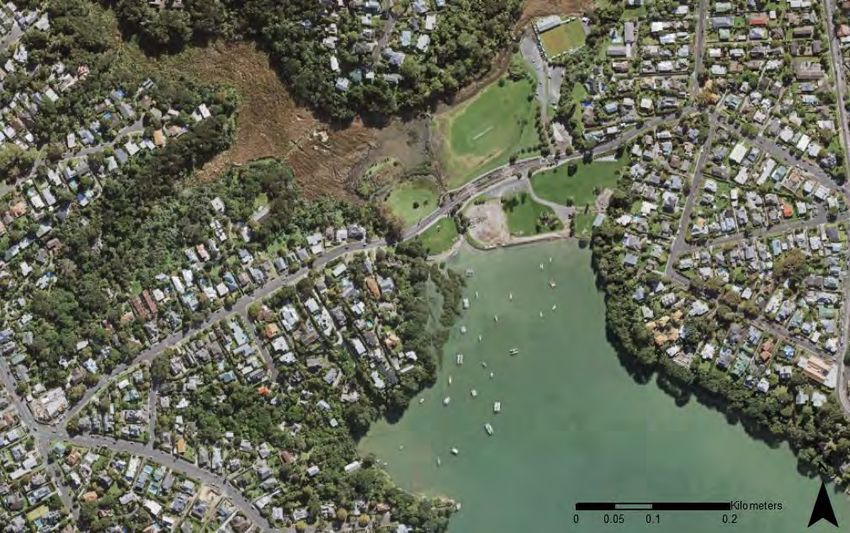
Little Shoal Bay - Coastal Processes Issues and Option Assessment

Table 7 - Qualitative comparison of options ....................................................................................................................................... 34

                                                                    ©WSP New Zealand Limited 2020                                                                                   4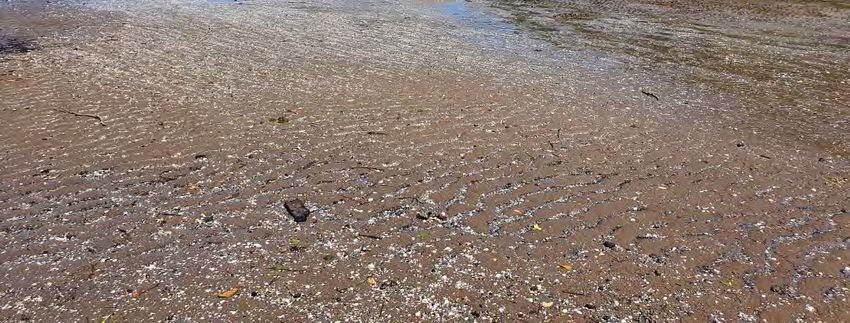
Little Shoal Bay Coastal Processes Issues and Options Assessment

Executive Summary
The Issues

Coastal inundation and erosion pose a risk to Little Shoal Bay. King tides and storm surges have
caused local flooding and the existing seawalls in the east of the bay are being undermined. Climate
change is expected to increase the frequency and severity of flood and erosion events.

Little Shoal Bay has a wide variety of uses including public open space, parks and reserves, car
parking and amenity/recreational use. The bay provides access to the foreshore for boat launching
and retrieval, public toilets, exercise and barbeque facilities for public use. There is a boat hardstand
and the headquarters of the local Sea Scouts. Many of these functions can be disrupted by
inundation and erosion.

About this Report

Auckland Council have commissioned this study to explore the nature of these risks, how they might
change and what could be done to manage them. The information gathered in this study will
support the development of a long-term shoreline management approach with the community.

This report focuses on coastal edge evolution, current and future coastal hazard risk and potential
coastal management responses. Additional work is likely to be required to fully explore landward
inundation options.

Condition of Existing Assets

A visual inspection of existing coastal structures was undertaken during a site visit as part of this
study. The seawall, stormwater culverts (external inspection only) and boat ramp appear in fair
condition. Key issues are undermining of the seawall on eastern side of the bay and insufficient crest
level to manage inundation risk.

Very little amenity beach is present at high tide. A temporary groyne structure has been constructed
at the western end of the beach and a small volume of sand has accumulated up-drift of this
structure.

Shoreline Management Options

The study provides initial consideration of a range of shoreline management options in section 4.
These include:

    •    Option 1 - Do nothing

    •    Option 2 - Maintain existing shoreline management approach

    •    Option 3a – Beach Nourishment & Groynes

    •    Option 3b – Improve seawall

    •    Option 3c – Planting to manage erosion risk

    •    Option 4 – Adaptation (of landuse within the bay)

Comparison of Options

A preliminary qualitative comparison of options is developed in this report and summarised below:

    •    Option 4 - Adapting land use such that it is compatible with the risk (would likely provide a
         resilient risk management approach but would require a change to the way Little Shoal
         Bay is used.

                                             ©WSP New Zealand Limited 2020                              5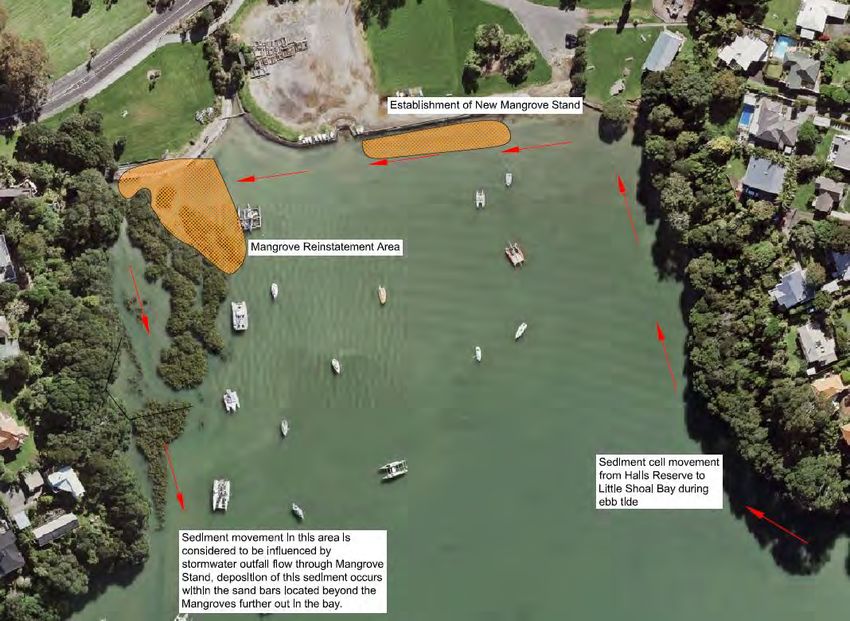
Little Shoal Bay Coastal Processes Issues and Options Assessment

     •   ‘Option 1 - Doing Nothing’ and ‘Option 2 - Maintain the current approach’ are likely to be
         the lowest cost options to implement (ignoring the cost of flood and erosion damages).
         These options are unlikely to provide an acceptable level of service into the future as the
         inundation risk changes due to climate change. They may provide a short-term solution
         until a long-term plan can be developed and implemented.

     •   ‘Option 3a – Nourishment’ and ‘Option 3c – Planting’ offer the best opportunity to add
         wider benefits (such as amenity and ecological enhancement).

     •   ‘Option 3b – Repair/rebuild seawall’ is likely to require significant capital cost and the
         design could be developed to suit the desired level of service.

Further analysis and agreement of priorities with council and stakeholders, including community
and Iwi will be required in order to select the preferred shoreline management approach.

The Ministry for the Environment (MFE) advocate for an adaptive approach to risk management
responding to the changing nature of the risk. It would be prudent to develop an adaptive risk
management approach that recognises the community aspiration for the bay and the budgetary
constraints of Auckland Council.

Recommendations

Little Shoal Bay is exposed to a range of coastal hazards. The existing seawalls on the eastern side of
the bay are subject to undermining and, though their stability has not yet been compromised, a
long-term plan for their removal, replacement or repair should be developed.

Flooding landward of Maritime Terrace is the focus of other studies. Inundation also affects the
amenity infrastructure seaward of Maritime Terrace. We advocate for a cohesive approach to flood
and erosion management that aligns with the community aspiration for, and the environmental
sensitivities of, the bay.

In order to develop a long-term shoreline management approach, we recommend the following:

1)   Engage with the community and Iwi to ascertain the aspiration for the future of Little Shoal Bay;

2)   Consider how the natural hazards may affect that aspiration;

3)   Develop, in more detail, the approaches for shoreline management and select a preferred
     shoreline management approach;

4)   Develop the details of the preferred approach;

5)   Secure funding & consent to implement this approach;

6)   Procure construction and construct any new measures; and

7)   Monitor the performance and condition of any new shoreline management infrastructure.

                                             ©WSP New Zealand Limited 2020                             6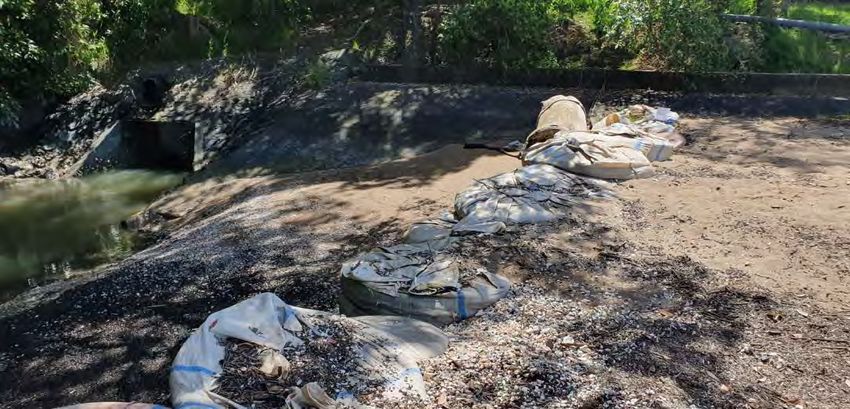
Little Shoal Bay Coastal Processes Issues and Options Assessment

1      Introduction & Site Context
1.1    Problem Definition
By the nature of its coastal location, Little Shoal Bay is exposed to a range of coastal hazards. These
pose a risk to the people that use this area commercially and recreationally and public infrastructure
adjacent to the bay.

The principal risks arise from inundation and erosion. Further risks include interference of drainage
of stormwater and environmental degradation. Climate change will increase the frequency and
severity of flooding and the likelihood of erosion causing damage to existing infrastructure.

A plan is needed to manage these risks now and into the future. This study provides an initial
assessment of the condition of existing assets, an overview of coastal processes in the bay and
provides initial consideration of shoreline management options. Flood risk is the subject for other
studies and this report focusses on options to address erosion risk and enhance amenity value.

1.2    Geographic Location
Little Shoal Bay is situated on the north shore of the Waitemata Harbour and west of State Highway
1, the northern motorway (Figure 1). Due to the proximity to the harbour, this area is exposed to coastal
inundation and erosion risk. The study area comprises the area of land seaward of Maritime Terrace.
This area of land is believed to be reclaimed using arisings from the construction of the Auckland
Harbour bridge crossing.

                                             ©WSP New Zealand Limited 2020                              7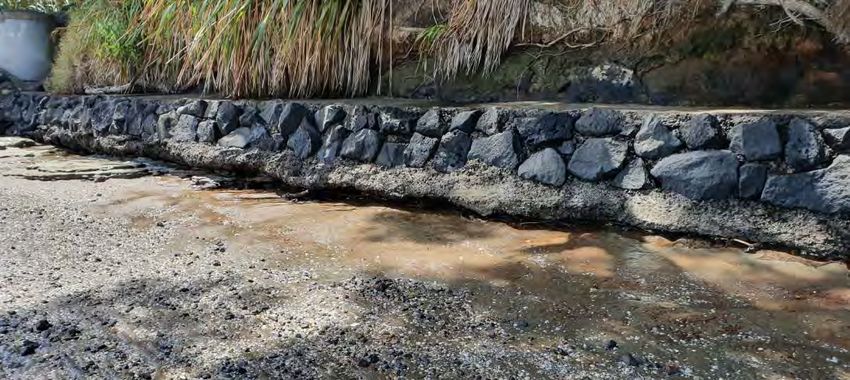
Little Shoal Bay Coastal Processes Issues and Options Assessment

                                                          Little Shoal
                                                               Bay

   Figure 1. Little Shoal Bay location, Auckland, North Island of New Zealand (Base-maps from LINZ
                                                       Data).

                                             ©WSP New Zealand Limited 2020                           8
Little Shoal Bay Coastal Processes Issues and Options Assessment
1.3 Land Use
The area of land seaward of Maritime Terrace (Figure 2) is largely open space with a variety of uses
including:
• Intertidal area including mangrove and a small low tide amenity beach;
• Boat ramp;
• Boat hardstanding & maintenance area;
• Car parking;
• Public open space including toilets, barbeque facilities, playground and exercise facilities;
and
• Birkenhead Sea Scouts building.
Centrally to the site and immediately landward of the sloping rock masonry coastal structure is an
area of hardstanding, covering an area of approximately 2900 m², currently being utilised by a
Council tenant to store public leisure boats. Adjoining the northern end of the boat storage area lies
further hardstanding in the form of a public car park for beach access (850 m²).
Adjacent to these areas of hardstanding to the east and to the west are areas of low-lying
maintained open grassed areas for recreational usage. Both rise sharply at the extremes of the site
to meet with residential properties perched on the hilltop overlooking the embayment.
Existing Council facilities and tenants occupy areas within the eastern edge of this grassed area of
the site. Facilities include public toilets, barbeque area, playground / outdoor exercise equipment
and the Birkenhead Sea Scouts headquarters.
Situated at the western end of the site and seaward of the coastal defences is a small accumulation
of sand which is visible at high-tide and is the result of natural longshore processes in the area. This
sand accumulation has buried the existing coastal structures for this area.
Figure 2 - Little Shoal Bay Embayment. Source Linz Data Service
©WSP New Zealand Limited 2020 9Little Shoal Bay Coastal Processes Issues and Options Assessment
To the north of the road is a large area of wetland and a recreational area consisting of tennis courts,
bowling green and an expanse of level playing fields utilised for recreational cricket (~13,500 m²).
1.4 Bathymetry and Topography
1.4.1 Bathymetry
Little Shoal Bay bathymetry is characterised by low-gradient tidal flats in the intertidal zone and the
subtidal zone (the area only infrequently exposed, during extreme low tides). This low gradient
intertidal area, with small perched upper beach area, extends approximately 1 km offshore until the
bathymetric slope drops to connect to the deeper main Waitemata Harbour channel.
Due to the low-energy conditions, Little Shoal Bay beach consists of relatively fine sediments. Since
tidal currents increase in strength for larger water depths, the finest sediments occur on the
mudflats and the upper intertidal zone, and the coarser sandy sediments occur in the lower
intertidal zone.
Little Shoal Bay embayment depths indicate that there is a slight elevation in bed level across the
embayment from Needles Eye Reserve to Halls Beach Reserve.
Halls Beach
Reserve
Needles Eye
Reserve
Offshore sand bar
Figure 3. The images above both depict the Little Shoal Bay Bathymetric contours and for clarity the image
on the right has been marked-up to identify the shallower areas (assumed offshore sand bars) and deeper
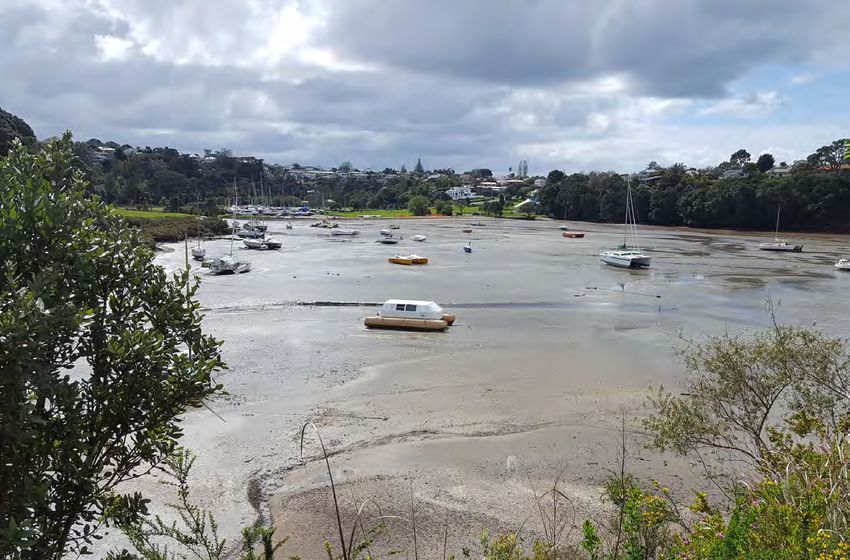
area within the embayment (Source: Auckland Council GeoMaps)
©WSP New Zealand Limited 2020 10Little Shoal Bay Coastal Processes Issues and Options Assessment
Figure 4. Photograph of Little Shoal Bay from Needles Eye Reserve at low
tide.
1.4.2 Topography
Contour data has been obtained from Auckland Councils Interactive GIS system Geomaps. The bay
is within the lower lying area of the embayment overlooked by steep vegetated cliff faces to both
the east, west and from the north.
Landward of the existing coastal defences the terrain is low lying and typically has an elevation of
1.5-2.0mAVD. This includes the boat yard hardstanding area, public facilities and barbeque
recreational areas. The terrain rises steeply from this low-lying area at both the eastern and western
extremes of the site from 2.0mAVD rising to 15.0mAVD at an approximate gradient 1v:1.5h. The
topography rises even more steeply 1v:0.5h to the east of the site.
The Birkenhead Sea Scout Club house located is slightly raised within land that rises from
approximately 2.75–4.5mAVD. The public playground situated to the north has an elevation of 3–
5mAVD.
Maritime Terrace follows the contours of the surrounding open grassed / wetlands to the north and
the hardstanding / public recreational facilities to the south (2.0 m AVD). The carriageway rises
steadily with the terrain in the east at a gradient of 1:15 and 1:7 to the west.
©WSP New Zealand Limited 2020 11Little Shoal Bay Coastal Processes Issues and Options Assessment
5m AVD
10m AVD
1m AVD
Figure 5 - Topography of Little Shoal Bay area
1.5 Geology and Beach Characteristics
The area surrounding Maritime Terrace comprises of made ground formed through land
reclamation during the construction of the Auckland Harbour bridge. This made ground is underlain
throughout the area by interbedded and graded Sandstone, Siltstone or Mudstone as part of the
Waitemata Group formed during the early Miocene epoch approximately 16 – 23 Ma (million years
ago). (GNS, 2017).
Situated north-east of the site approximately 1.5km lies a basaltic lava flow from a now extinct
volcano at Lake Pupuke. The lave flow stretches approximately 2km from source towards the site
and consists of basalt lava, scoria cones, volcanic breccia, ash, lapilli and lithic tuff. The basaltic lava
flow forms part of the Kerikeri Volcanic Group formed 2.6 Ma.
The foreshore deposits at the site consist of coarse to fine grained sediment with shell deposits, and
the bathymetry within the embayment is a low-gradient tidal flats in the intertidal / subtidal zones
and fluctuates by approximately 0.1 – 0.2m. Present further offshore are raised sand bars that are
approximately 0.5 – 0.7m higher than the surrounding tidal flats.
1.6 Historic Context and Development of the Current Shoreline
Little Shoal Bay is a highly modified coastline and the aerial photography below shows that the
study area was once an open tidal inlet (Figure 6, Figure 7 & Figure 21). The land seaward of Maritime
Terrace has been reclaimed and comprise of surplus material deposited from the Auckland Harbour
Bridge development and from historic industrial activity (Morphum Environmental Ltd, 2018).
©WSP New Zealand Limited 2020 12Little Shoal Bay Coastal Processes Issues and Options Assessment
June 1947
Figure 6. Aerial Photography of Little Shoal Bay taken in June 1947 (Retrieved from Morphum
Environmental Ltd (2018); Original source: Whites Aviation, Alexander Turnbull Library Collection).
March 1957
Figure 7. Aerial Photography of Little Shoal Bay taken in March 1957 (Retrieved from Morphum
Environmental Ltd (2018); Original source: Whites Aviation, Alexander Turnbull Library Collection).
Morphum Environmental Ltd (2018) describes the historical evolution of the area, with emphasis on
the changes to the local stormwater drainage system. The drainage system changed from a natural
drainage pattern to the construction of an open estuarine channel, followed by the placement of a
large 1350 mm concrete culvert pipe along the western border of Little Shoal Bay in 1969.
Further modifications to the drainage system at Little Shoal Bay included:
• Construction of a high flow bypass (box culvert) under Maritime Terrace to increase the
discharge capacity from within the Waitemata catchment (Figure 18) (Morphum
Environmental Ltd, 2018).
• Land reclamation to the seawall now lining the inner part of Little Shoal Bay.
• Roadway development through Little Shoal Bay and other connection pathways.
• On the southern side of Maritime Terrace, the construction of a boat hardstand area.
• Creation of several recreation/sports areas.
• Formation of a new wetland/estuarine complex behind the reclaimed areas which were
originally coastal embayment habitats.
©WSP New Zealand Limited 2020 13Little Shoal Bay Coastal Processes Issues and Options Assessment
2 Coastal Infrastructure Condition Assessment
2.1 Coastal Infrastructure
Little Shoal Bay benefits from a range of coastal infrastructure assets including:
• Seawalls (various forms of construction);
• Amenity beach / foreshore;
• Boat ramp;
• Groyne;
• Mangrove; and
• Stormwater culverts
The following notes and photos present an assessment of the condition of these asset as recorded
during a site visit on the 30th of October 2019.
2.2 Seawalls
The reclaimed land within the bay includes a seawalls of various construction techniques (including
mass & reinforced concrete walls, grouted rock walls).
Figure 8. Little Shoal Bay hard coastal structures
The seawalls are generally in fair to good condition with no obvious signs of displacement (cracking
slumping, rotation, displaced blocks, etc.).
Some areas of foreshore lowering/undermining were observed along the eastern side of the
embayment (Figure 9). It is likely that the erosion/undermining at the toe of the seawall is due to
wave action causing bed lowering.
©WSP New Zealand Limited 2020 14Little Shoal Bay Coastal Processes Issues and Options Assessment
Figure 9. Undermining of grouted rock seawall on the eastern boundary of Little Shoal Bay.
There are some areas of local erosion and outflanking (Figure 12) at the ends of the existing seawalls.
Figure 10. Localised erosion on the eastern side of bay
2.3 Amenity Beach & Foreshore
There is a small amenity beach accessible at low tide. Some material has also accumulated updrift
of the groyne (see Section 2.4). Some areas of the foreshore show small accumulations of debris at
the high tide line.
Limited sediment input from offshore has been identified by observing intertidal bar growth
(McNeil, 2001). The main sediment sources for Little Shoal Bay were identified to be cliff erosion,
shell material and fine material from freshwater outflow (McNeil, 2001).
We have not been able to obtain any long-term records to support analysis of changes in beach
sand volumes over time. Analysis of historic aerial photographs suggests that the position of the
high tide line has remained stable (influenced by the presence of the seawalls). By inspection of
the seawall, it appears that the eastern side of the bay has lost a quantity of material since the
construction of the seawall. A vertical lowering of the foreshore landward of the seawall is
estimated in the order of 200-500mm at the toe (Figure 9).
©WSP New Zealand Limited 2020 15Little Shoal Bay Coastal Processes Issues and Options Assessment
Figure 11. Eastern side of Little Shoal Bay showing accumulation of sediment and debris.
In the intertidal area, small wave ripple bedforms were observed (Figure 12). An absence of current
bedforms suggests that orbital wave velocities generally govern the movement of deposited bed
sediment rather than tidal currents. Tidal currents alone are only strong enough to transport very
fine material during flood tides, when current velocities are highest, with wave energy playing an
important role in sediment transport and resulting morphology. However, there is potential for fine
sediments re-suspended in the water column by high wind-wave action would be removed by an
ebb tide.
Figure 12. Small wave ripples on foreshore during low tide
2.4 Groyne
A groyne consisting of bulk bags each filled with approximately 1m³ of sand (Figure 14) has been
constructed adjacent to the concrete pipe and stormwater outfall. This structure has accumulated
a small quantity of sediment on the updrift side. The difference in bed level between the east and
west side (i.e. sediment deposition on the eastern side) of the structure indicates movement of
sediment from east to west (Figure 14).
By inspection of satellite imagery (obtained from Google Earth), the construction of the groyne
appears to have had only a very local impact on sediment movement. There is no evidence of erosion
leeward of the groyne.
©WSP New Zealand Limited 2020 16Little Shoal Bay Coastal Processes Issues and Options Assessment
We estimate the extent of the accumulation of sediment to be approximately at a length of 15m
seaward of the existing seawall and approximately 25m updrift along the shoreline. Assuming a
triangular plan form and a typical depth of between 0 and 1m the total volume of accumulated
sand could be in the region of 200m3. A site topographic survey is required to assess these volumes
more accurately.
The construction of a single groyne has had limited effectiveness in forming an amenity beach at
the scale of the wider bay. In order to develop such an amenity beach across a wider width of the
bay, it is likely that many groyne structures would be required. Further nourishment is likely to be
required to supplement the modest amounts of sediment supplied by natural processes. This is
discussed further in the shoreline management options section of this report.
Figure 13. Construction of groyne structure to retain sediment on the eastern side, and the outlet located on
the west of Little Shoal Bay
The bags appear to be in fair condition with minor displacement and no obvious splitting or spilling.
Such structures are typically temporary in nature with relatively short working lives. Deterioration
and failure of the bags should be anticipated and bags removed (or replaced) before they fail to
reduce the likelihood of release of plastic fibres into the environment.
©WSP New Zealand Limited 2020 17Little Shoal Bay Coastal Processes Issues and Options Assessment
Figure 14. Groyne structure consisting of commercial sandbags with the aim of disrupting the cross-shore
sediment movement (Left: Photograph from WSP site visit on the 30th of October 2019; Right: Stuff.co.nz
(July 31st 2019).
2.5 Boat Ramps / Foreshore Access
The foreshore can be accessed at two locations. The first is directly from the hardstand area and
the second is approximately 100m due east at the end of the concrete wall.
The vertical/inclined seawall along Little Shoal Bay includes boat ramps (Figure 15, Figure 16). Both
access points appear in fair to good condition with no obvious structural defects. Both access
points are covered in sand and debris.
©WSP New Zealand Limited 2020 18Little Shoal Bay Coastal Processes Issues and Options Assessment
Figure 15. Boat ramp
Figure 16. Debris and sediment accumulated on the top of the boat ramp
©WSP New Zealand Limited 2020 19Little Shoal Bay Coastal Processes Issues and Options Assessment
2.6 Mangrove
Mangroves are present on the western side of the embayment. Mangroves are known to trap
sediment and accelerate land-building processes in tide-dominated coastal environments
(Chaudhuri, et al., 2019). Figure 17 shows mangroves at the western edge of Little Shoal Bay which
appear to have locally increased foreshore level by trapping sediment.
Figure 17. Mangroves at the western side of Little Shoal Bay
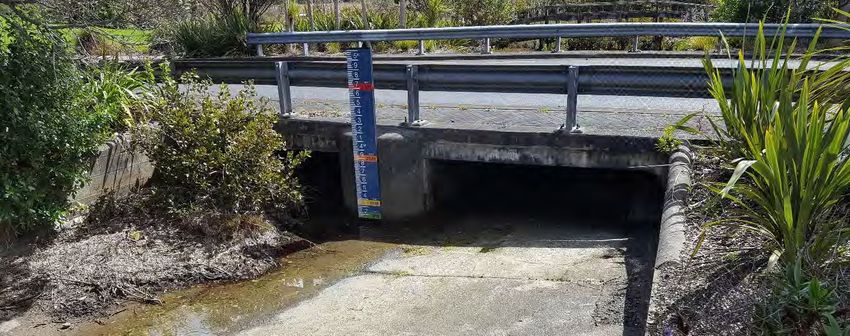
2.7 Stormwater Culvert
Twin box culverts discharge stormwater at the western end of the bay. No internal inspection has
been undertaken but the culverts appear to be in fair condition. One of the culverts is partially
blocked by debris and vegetation which would reduce the capacity to discharge stormwater.
Figure 18. Box Culverts in Little Shoal Bay, showing the left box culvert partially blocked by debris and
vegetation
©WSP New Zealand Limited 2020 20Little Shoal Bay Coastal Processes Issues and Options Assessment
3 Coastal Processes
3.1 Water Levels
3.1.1 Water Levels and Climate Change
Tide Levels for Auckland Port are provided by LINZ Service Data. By using the LINZ Data Service
standard port tidal levels1, the MSL offset to AVD-46 would be 0.16 m. Table 1 shows the tidal levels
for the Port of Auckland, converted from Chart Datum (CD) to Auckland Vertical Datum 1946 (AVD-
46).
Table 1. Tidal level elevations converted to AVD-46 from LINZ Service Data Auckland Port.
MHWS MHWN MLWN MLWS Spring Range Neap Range MSL HAT LAT
1.62 1.08 -0.74 -1.29 2.91 1.82 0.16 1.96 -1.69
Mean sea-level (MSL) offset to AVD-46 was recalculated for the Waitemata Harbour and Port of
Auckland (NIWA, 2013), giving a resulting MSL of 0.15 m AVD-46. The extreme sea-level for Little
Shoal Bay are shown in Table 2 for different Annual Recurrence Intervals (ARI).
Table 2. Present day extreme sea-level (excluding waves, w.r.t. AVD-46) in the Waitemata Harbour, Little
Shoal Bay, location 9 in original document (NIWA, 2013).
ARI (years): 2 5 10 20 50 100 200
Water level (m AVD-46) 2.10 2.18 2.23 2.29 2.36 2.41 2.46
The above extreme water levels were derived using hydrodynamic models, which were calibrated
against tide-gauge and wave buoy measurements to obtain both storm-tide and wave set-up
outputs along the coastline (NIWA, 2013).
3.2 Waves
The Waitemata Harbour entrance faces the waters of the Hauraki Gulf with the Coromandel
peninsula and islands situated eastwards of the Waitemata Harbour. These islands provide a natural
barrier of protection to the harbour waters from incoming eastern waves, making the study area a
naturally sheltered zone.
The Waitemata harbour is a tidal-dominated estuary. Tidal currents dominate wave energy and
control the morphodynamic behaviour (Bosboom & Stive, 2015). The Waitemata Harbour entrance
statistics2 are shown in
1
LINZ Data Service standard port tidal levels: https://www.linz.govt.nz/sea/tides/tide-predictions/standard-port-tidal-levels
(last accessed 30th of November, 2019)
2
To access MetOcean Solutions visit https://metoceanview.com/
©WSP New Zealand Limited 2020 21Little Shoal Bay Coastal Processes Issues and Options Assessment
Table 3, They indicate that the Waitemata Harbour entrance is a low wave energy area with most
counted waves being under 0.5 m.
Table 3 Wave data statistics for Waitemata Harbour entrance. Data from MetOcean Solutions Limited MSL
SWAN model for the Hauraki Gulf.
Highest Wave count
Model
monthly Wave Dominant
grid Wave Wave
average heights incoming
data heights heights
mean between wave
point between 0 between 1.0
wave 0.5 and 1.0 direction
location and 0.5 m and 1.5 m
height m
Waitemata
36.836S
Harbour 0.13 m 96.26% 3.70% 0.04% North
174.822E
entrance
The Waitemata Harbour is a tide-dominated but naturally sheltered area from wave action from the
wider Hauraki Gulf. Little Shoal Bay constitutes an embayment within the Waitemata Harbour, and
is therefore further protected from offshore waves. Wave energy is dissipated through processes of
refraction as they travel over different depths, diffraction around headlands, shoaling and friction.
3.2.1 Wave and Wind Climate
Even though offshore wave action is low, wind generated waves, or fetch limited waves, can impact
Little Shoal Bay. The fetch limited wave height at a location inside the harbour can be assessed for
a known directional wind speed and fetch length.
Directional wind speeds have been assumed for Little Shoal Bay in accordance with design code
AS/NZS 1170.2:2011. The 10 and 50-year ARI directional wind speeds are presented in Table 4.
Table 4. Extreme wind speeds from AS/NZS 1170.2.2011.
ARI Directional wind speed (m/s)
(years) N NE E SE S SW W NW
10 31 34 36 34 31 34 36 34
100 37 41 43 41 37 41 43 41
The values obtained for the Auckland region using the AS/NZS 1170.2.2011 are considered to be
conservative for Little Shoal Bay. The Hauraki Gulf hindcast model by MetOcean also provides wind
information, including extrapolated wind extremes. Extrapolate extremes using a Gumbel
distribution are shown below in Table 5, and the wind rose diagram showing an annual prevailing
SW direction is presented in Table 6.
Table 5. Wind data extreme values for Waitemata Harbour entrance. Data from MetOcean Solutions
Limited MSL SWAN model for the Hauraki Gulf.
ARI (years) Wind speed (m/s)
10 18.5
100 21.6
©WSP New Zealand Limited 2020 22Little Shoal Bay Coastal Processes Issues and Options Assessment
Figure 19.Wind rose diagram for the Waitemata Harbour entrance, annual wind speed [1
knot = 0.514 m/s] (Source: MetOcean Solutions Limited MSL SWAN model for the Hauraki
Gulf).
Figure 20. SW fetch distance from Little Shoal Bay (Measured with Auckland Council's
Geomaps viewer: https://geomapspublic.aucklandcouncil.govt.nz/viewer/index.html)
Several methods were used to calculate the wind generated waves, these include fetch and wind
speed forecasting curves from USACE (1984), BS (2000) and Groen & Dorrestein (1976). Given the
information provided in Table 4 and Table 6, a maximum fetch available was measured as shown in
Figure 20. It should be noted that the distance of the fetch, at high tide, is approximately 4.7 km from
the southwest with wave energy considered to be interrupted by the presence of the Meola Reef
©WSP New Zealand Limited 2020 23Little Shoal Bay Coastal Processes Issues and Options Assessment
located within the Waitemata Harbour, approximately 2 km northeast of Point Chevalier / Coyle
Park. The region will be subject to an increase in wave height during strong winds from a west-
southwest direction resulting in wave refraction across the site from Halls Beach Reserve.
The fetch-limited wind wave results are shown in Table 6 below.
Table 6. Calculated fetch-limited wind generated waves.
Groen & Dorrestein (1976)
ARI USACE (1984) BS (2000)
(years)
Wave height Period Wave height Period Wave height Period
SW wind speeds from AS/NZS 1170.2.2011
10 1.10 3.20 2.00 5.00 2.00 3.60
100 1.35 3.40 2.50 5.50 2.00 3.60
Wind speeds from MetOcean Solutions Limited MSL SWAN model for the Hauraki Gulf.
10 0.70 2.70 0.90 3.60 1.30 3.00
100 0.74 2.80 1.20 4.00 1.10 2.80
If considering the wind speeds from the MetOcean Solution hindcast model which are more
realistic for Little Shoal Bay, and not as generic as the extreme wind speeds calculated for the
Auckland region with the AS/NZS 1170.2.2011, the results are as follows:
• The USACE (1984) curves for 9 m depth was used assuming an average bed level of
approximately -6 m CD on LINZ Chart NZ 5322 with 3 m of water elevation along the
subtidal areas. This curve yielded an approximate fetch limited wave height around of 0.70
m and wave periods of less than 3.00 s for both annual recurrence intervals selected.
• By comparison the chart in BS (2000) gave approximate wave heights of 1.00 m and wave
period of approximately 4.00 s.
• The Groen & Dorrestein (1976) chart, with a 30 m/s wind speed limit of applicability, provided
the highest waves of 1.10 m and 1.30 m, with wave periods around 3.00 s.
Wells-Green (1975) studied currents, waves and sediment transport in the upper Waitemata Harbour:
the largest observed wave occurred during 10.3 m/s easterly wind and was of the order of 0.49 m
high with a period of 2.4 seconds. The Upper Waitemata Harbour eastern fetch length is greater
than Little Shoal Bay’s SW fetch length, indicating that an equivalent condition for Little Shoal Bay
would likely have generated smaller waves. Little Shoal Bay wave climate is therefore considered to
be calm throughout most of the year.
3.2.2 Vessel Generated Waves & Sediment Transportation
Another aspect to consider within the Waitemata Harbour is the vessel generated waves. A research
paper by Osborne & Boak (1999) measured waves, currents, suspended sediments and beach
morphological responses using fast-response sensors over 13 months at Torpedo Bay.
Torpedo Bay is located at the entrance of the Waitemata Harbour, and, therefore, it is more exposed
to ship induced waves than Little Shoal Bay: It is considered that the results found in Osborne &
Boak (1999) could be extrapolated to Little Shoal Bay with a degree of conservatism.
The main finding of this study (Osborne & Boak, 1999) are the following:
• Vessel generated waves reach maximum heights of 0.85 m, with an average significant wave
height of 0.3 m.
• The periods associated with the vessel generated waves oscillate between 2 and 6 seconds
on the foreshore.
©WSP New Zealand Limited 2020 24Little Shoal Bay Coastal Processes Issues and Options Assessment
• The vessel generated waves groups presented a nonlinear form, making them able of
entraining and suspending significant quantities of bottom sediment, which results in
nearshore increased turbidity.
• The vessel generated waves resulted to be a substantial amount of the total available energy
to transport sediment at Torpedo Bay. Vessel generated waves showed to contribute to
sediment transport as much as twice relative to wind-generated waves.
In spite of the short-term fluctuations in seabed elevation of up to ± 10 cm in response to large vessel
induced waves, and the induced sediment transport, the net effect of both wind and vessel
generated waves on sediment transport and foreshore response appeared to be insignificant
(Osborne & Boak, 1999).
Assuming that sediment composition is similar in both bays, the stated findings and conclusion may
be applicable for Little Shoal Bay in a smaller scale as the study area is less exposed to vessel
generated waves than Torpedo Bay.
3.3 Shoreline Morphology
Little Shoal Bay is subject to accretion of sediment from the harbour and the addition of sediment
from stormwater discharges that contribute to the filling of the Waitemata basin (ARC, 2008).
Activities such as dredging also act to significantly alter the basins natural sediment cycle.
Aerial imagery (Figure 21) shows that Little Shoal Bay has no high-tide beach. During high tides the
sea is in direct contact with the seawall and other hard-structures along the coastline.
Figure 21. 2018 - Little Shoal Bay aerial image (Source: LINZ Data Service)
A Masters Thesis entitled ‘Cliff erosion in the Waitemata Harbour and Hauraki Gulf’ (Brodnax, 1991)
identified 4 main types of erosion in the Waitemata Harbour: mechanical wave erosion (hydraulic
action, corrosion, attrition), bioerosion, sub-aerial erosion (mass movement) and erosion resulting
from weathering. Calculated erosion rates in the harbour varied from 0.05 m/year and 0.35 m/year,
©WSP New Zealand Limited 2020 25Little Shoal Bay Coastal Processes Issues and Options Assessment
with rates of the order of 0.125 m/year in the inner harbour (Brodnax, 1991). The sediment eroded is
likely to contribute as a positive input into the sediment budget of the Waitemata Harbour.
Past studies (Brodnax, 1991; ARC, 2008; Hume, 1983; Hume & McGlone, 1986; Hume, et al., 1992) and
the need for dredging of the Waitemata Harbour may be indicative of an underlying accretion
process within the harbour. A more precise study on sediment budget of the harbour may be able
to corroborate that assumption.
Little Shoal Bay is in an embayment within the harbour. The study area has been considered a
coastal cell to describe the following observations:
• It is possible that part of the sediment from the Upper Waitemata Harbour and other
discharge and/or erosion locations may be accumulating in the west side of the Northcote
headland, and subsequently transported to Little Shoal Bay flats.
• Aerial imagery indicates that sediment transport takes place around the headland between
Chelsea Bay and Little Shoal Bay with incoming tide: sediment transported from Chelsea Bay
to Little Shoal Bay. No other satellite images indicate transport from Little Shoal Bay to
Chelsea Bay, nonetheless it is believed that this is still possible during flood tides.
• Aerial imagery shows sediment transport around the Northcote headland both in west and
east direction, indicating sediment movement around the headline both in ebb and flood
tide.
Because of the sheltered nature of the embayment and the long Northcote headland, the
embayment may tend to trap sediment. Once the sediment is trapped in Little Shoal Bay, sediment
recirculation within the area is likely to occur.
3.4 Coastal Hazards
3.4.1 Erosion
Little Shoal Bay is a highly modified coastal environment where land reclamation and seawalls have
influenced the evolution of the coastline. Since the reclamation, erosion risk has been managed by
maintenance of the seawalls.
The construction of hard structures can lead to acceleration of foreshore lowering. This is a
consequence of reflection of wave energy that can induce sediment mobilisation and transport. This
can lead to removal of material seaward of the toe of the structure.
These seawalls have experienced localised undermining & erosion. Site observations along the
eastern boundary of the embayment indicate foreshore bed level lowering ( Figure 9, Figure 10). The
magnitude of the foreshore lowering is in the range of 200-500mm though no survey has been
undertaken at this stage. It is difficult to estimate the volume of material lost from the foreshore
without further information.
Analysis or aerial/satellite imagery is unlikely to provide evidence for the rates of erosion given the
small scale of the changes in Little Shoal Bay (vertical movements in the order of hundreds of mm)
and the presence of the seawalls (limiting any lateral movement). Longer trend analysis is also not
likely to be possible given the reclamation of land in the bay.
Aerial photography also shows the removal of mangroves that took place at the western side of Little
Shoal Bay. The removal of mangroves may also enable the remobilisation of sediment and change
the morphodynamics of the bay.
If the seawalls were to fail or be removed, it is likely that the slope landward of the walls would relax
to a more stable angle. The nature of the material, location of groundwater, wave action and
presence of vegetation would affect what angle the slope adjusted to. A 1v:5h slope would cause
landward movement of the coastline in the order of 5-10m (assuming a retained height of between
©WSP New Zealand Limited 2020 26Little Shoal Bay Coastal Processes Issues and Options Assessment
1 & 2m). Landward movement of the coastline could threaten some of the existing landuse (car park,
boat hardstand, public open space).
3.4.2 Inundation
The area seaward of Maritime Terrace has suffered from coastal inundation in recent years, especially
during king tide events (Figure ) (Morphum Environmental Ltd, 2018). These events directly inundate
low-lying areas adjacent to the coastline and reduce the ability to drain stormwater leading to
localised flooding landward of Maritime Terrace (the subject of other studies).
Auckland Council and Auckland Emergency Management have a Hazard Viewer that allows users
to visualise coastal inundation for different coastal inundation annual recurrence intervals (ARI)
(Figure 22).
Figure 22. Coastal inundation for present day 5 and 20-year return period
The area landward of Maritime Terrace is subject to regular inundation (with an annual exceedance
probability of at least 20%). Such flooding of the boat hardstand and car park poses a risk to users
of these areas and an environmental hazard should contaminants be released.
Flooding is likely to increase in frequency and severity as result of climate change. Current guidance
project 2120 mean sea level could be over 1m above those experienced today (MfE, 2017). Further
increased frequency and severity of storms could lead to greater overtopping volumes and increased
erosion rates.
©WSP New Zealand Limited 2020 27Little Shoal Bay Coastal Processes Issues and Options Assessment
Figure 23 - Box Culverts in Little Shoal Bay, showing a mean high springs scenario almost reaching the
orange line, which represents a water elevation prediction as best-case scenario of greenhouse gas
emission until 2120 (Source: Stuff – Little Shoal Bay: Rising sea level)
4 Shoreline Management Options
Little Shoal bay is a sheltered (low wave energy) environment and the likelihood of an erosion event
causing significant impact is low. The bay is low lying and has infrastructure in close proximity to the
coast. Inundation may also release contaminants (for example paint residue or residual fuel or oil
on the boat hardstand).
Consequences of erosion and inundation of land seaward of Maritime Terrace include:
• Temporary (during and immediately after the flood event) or permanent disruption to land
use (e.g. boat ramp unusable, boat hardstand flooded, park inundated, loss of reserve land)
• Damage to infrastructure (flooding of buildings, erosion affecting stability of structures,
damage to road or buried infrastructure)
• Environmental impact of inundation or erosion (damage to non-salt tolerant plant species,
release of contaminants from inundation or erosion, loss of trees due to
undermining/erosion)
A variety of shoreline management options could be implemented to reduce the likelihood or
impact of the erosion risk. The desired level of service for erosion and inundation risk management
is likely to depend on the consequence of the natural hazard on the land use. For example, periodic
loss of beach material or repairable damage to seawalls could be managed reactively (i.e. after such
an event). Sudden collapse of the seawall leading to significant damage to the boat ramp or advance
buildings might be less acceptable and may warrant further investment in risk management.
Below we develop a range of options to manage erosion risk. They are likely to provide differing
levels of service (i.e. different frequency and severity of erosion risk). The choice of preferred shoreline
management approach will require further consideration of the future land use and the appetite
for risk.
Options developed below include:
©WSP New Zealand Limited 2020 28You can also read