REDEFINING THE NON-CORE - PWC EUROPE'S DISTRESSED DEBT MARKET OVERVIEW
←
→
Page content transcription
If your browser does not render page correctly, please read the page content below

www.pwc.at

                     www.pwc.com

                     Redefining
                     the non-core

European Portfolio
Advisory Group
                     PwC Europe’s distressed
Edition
October 2017
                     debt market overview
Foreword

                 Bernhard Engel
                 Partner, Leader FS Deals
                 PwC Europe
                 bernhard.engel@pwc.com

Dear reader,

It is with great pleasure that we invite you to discover the 6th edition of our annual
report dedicated to the distressed debt market.

This year we’re covering new important markets from both Western Europe
(Germany, The Netherlands and Belgium) and the Central-Eastern part of the
continent (Poland, Russia, Ukraine).

Under the theme “Innovation as growth engine”, we’re highlighting the major forces
and trends driving the non-core space while also stepping into a country level
distressed debt deals environment and major market transactions.

With 2017 coming soon to an end, we look back to yet another active year in
distressed debt across the region, including continued deleveraging from banks on a
background of macroeconomic upturn combined with increasing investor appetite.

Marketwise, on the Western Europe side, Germany – although Europe’s largest
economy – has experienced a limited distressed debt deal flow, given its growth
momentum. The Netherlands have seen a relatively slow year following 2016’s
Propertize deal, while Belgium is steadily spawning its market wings. In CEE, last
year’s trend has consolidated, with South-East Europe continuing to lead the
transactions volume, while CIS (Russia, Ukraine) and Turkey remain largely
untapped markets that provide material opportunities and observe increasing
international investors’ interest.

Looking ahead, we expect the deal flow to continue given the regulatory changes
(IFRS 9, ECB’s NPL guideline) and availability of cheap funding, albeit deals will tend
to become more compact in size and diverse in their underlying assets, pushing
principals to look for more efficient sale processes with the help of technology.

I hope you’ll find this update informative and insightful in your assessment of the
region’s current and future potential. In the meantime, enjoy reading and we look
forward to discussing more in our next meeting.

With best regards,
Bernhard

PwC
                                                                                          2
Turkish distressed debt market review
Contents

                                        1.   Macroeconomic environment       4

                                        2.   European distressed debt markets 8
                                             overview

                                        3.   Deals landscape                 12

                                        4.   Established markets focus       16

                                        5.   Developed markets focus         21

                                        6.   Upcoming markets focus          29

                                        Annex                                32

PwC
                                                                                  3
Turkish distressed debt market review
01 Moderate economic growth, fuelled by a strong
labour market and signs of picking up inflation
Monetary policy still supportive, enabling future new
lending
Macroeconomic
environment
PwC
4
Macroeconomic environment
CEE and the Eurozone
Eurozone’s GDP follows a lingering moderate growth path supported by labour
market and private consumption, outweighing current political uncertainties
Continued CEE GDP growth, with 2017 momentum driven by CIS
Bank lending still low, but with positive outlook due to improved capital
position of banks’ balance sheets
The Eurozone's’ economy is on a continued track of On a long term basis, Eurozone’s growth is not expected to
moderate GDP growth despite the omnipresent outperform much further due to the aftermaths’ of last
political uncertainties surrounding US trade policies and decades financial crisis still reflecting on the banking
BREXIT consequences. However, the solid GDP figures are sector and governments high indebtedness.
mainly backed by strong private consumption which
With the CIS region leaving recessionary territory, overall
goes hand in hand with steadily growing employment
CEE is expected to outperform the Eurozone in terms
figures. The relatively low EUR exchange rate, as well as
of growth again.
trending up world trade bolster European GDP further.
Regional breakdown of GDP growth (%yoy, 2016-2022F) CEE breakdown of GDP growth (%yoy, 2016-2022F)
4.0% 4.0%
3.5% 3.5%
3.0% 3.0%
2.5% 2.5%
2.0% 2.0%
1.5% 1.5%
1.0% 1.0%
0.5% 0.5%
0.0% 0.0%
-0.5% -0.5%
2016 2017 2018 2019 2020 2021 2022 2016 2017 2018 2019 2020 2021 2022
Eurozone CEE CE CIS SEE
Europe focus countries include: 2016 % yoy GDP
Austria, Belgium, Germany, Netherlands
CE countries include:
Czech Republic, Estonia, Hungary,
Latvia, Lithuania, Poland, Slovakia,
Slovenia
SEE countries include:
Bosnia and Herzegovina, Bulgaria,
Croatia, Macedonia, Moldavia, Romania,
Serbia, Turkey
CIS countries include:
Belarus, Kazakhstan, Russia, Ukraine
For the purpose of our current analysis, CEE
countries include all the countries marked as
CE, SEE and CIS.
Source: IMF, PwC Analysis
PwC
5
Macroeconomic environment
Eurozone
Picking up of headline inflation rates
Strong labour market bolstered by job creation through strong domestic demand
Deleveraging of governments’ debt due to favourable macroeconomic conditions
Inflation rate (%, average consumer prices method, 2016-2017F)
The increase in Eurozone's’ headline inflation is mainly attributable to the reverting of energy prices from low
levels. Core inflation remains still below the ECBs 2% target, although labour market is tightening and wages pick
up only gradually. The outlook for inflation on services and non-energy goods is expected to stay at current levels.
2016 2017F
4%
3%
2%
1%
0%
BE AT MT EE LT FI DE NL LU LV GR IT SI ES IE SK CY
-1%
-2%
Unemployment rate (%, 2016-2017F)
The Eurozone is experiencing a period of continuing employment growth. Since yearly job creation is
outperforming labour force growth, unemployment rate is declining to its lowest level since 2008. However wages do
not increase to the same extent, among others hindered by an increase in temporary work contracts.
2016 2017F
25%
20%
15%
10%
5%
0%
GR ES CY IT SK LV FI BE IE SI LT EE LU AT NL MT DE
Gross government debt / GDP (%, 2016-2017F)
The indebtedness of Eurozone’s economies is about to decrease. The prevailing low interest rate
environment, reduced social transfers for unemployment and higher inflation, all have a positive impact on the
governments’ balance sheets.
200% 2016 2017F
150%
100%
50%
0%
GR IT CY BE ES AT SI IE DE FI NL MT SK LT LV LU EE
Source: IMF, European Commission, PwC Analysis, European Central Bank, PwC Analysis
PwC
6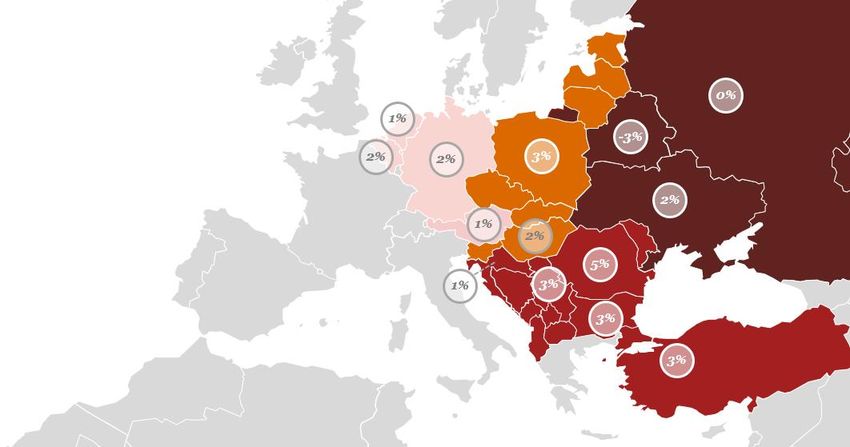
Macroeconomic environment
CEE
Rising inflation expected within CE & SEE regions, driven by monetary policy
Strong labour market supported by foreign demand from the Eurozone
Moderate to high indebtedness of CEE economy
Inflation rate (%, average consumer prices method, 2016-2017F)
CEE inflation shows a mixed picture across its sub-regions. An increase in inflation can be expected in most CE &
SEE economies, boosted by still ultra loose monetary policy and rising energy prices. CIS economies operate
on decreasing inflation rates.
2016 2017F
CE SEE CIS
20%
15%
10%
5%
0%
EE CZ LT HU LV SI SK PL TR MD RS FYRM BiH HR BG RO KZ UA BY RU
-5%
Unemployment rate (%, 2016-2017F)
Strong foreign demand, especially coming from the Eurozone also supports the CEE labour market. Still many
economies within SEE deal with exorbitant high unemployment rates impeding new retail lending by banks.
2016 2017F
CE SEE CIS
30%
25%
20%
15%
10%
5%
0%
SK LV SI LT EE PL HU CZ BiH FYRM RS HR TR BG RO MD UA RU KZ BY
Gross government debt / GDP (%, 2016-2017F)
CEE countries currently have moderate to high debt burdens. The indebtedness of CEE economies however should
profit from the favourable macroeconomic conditions.
CE SEE CIS
100% 2016 2017F
80%
60%
40%
20%
0%
SI HU PL SK LT CZ LV EE HR RS BiH RO FYRM MD TR BG UA BY KZ RU
Source: IMF, European Commission, European Central Bank, PwC Analysis
PwC
702
CIS region NPL stock continues to increase, flanked
by improved provisioning
SEE & CE countries continue their accelerated
deleveraging path, with large volumes already
disposed
Western Europe moderate NPL volume decrease to an
overall low ratio
European distressed debt
markets overview
PwC
8Distressed debt market overview
NPL stock and ratio
Western Europe countries show a moderate NPL stock decrease, on a
background of low ratios
Russia, Ukraine and Turkey remain drivers of NPL volume increase in
the CEE region
CE and SEE economies continue to deleveraging thus exhibiting
declining NPL volumes and ratios
NPL volume (EURb)
Decline in NPL volume for analysed Western
Europe countries
Germany, having the largest NPL stock, is deleveraging at
an accelerated pace, expected to continue in 2017. While
Belgium steadily reduces the NPL volume, the Netherlands
are expected to accelerate the deleveraging in 2017.
Contrary, CEE NPL volume continues its increase,
albeit slowing down
CEE NPL volume increased ca. 7% yoy in 2016, whereas
selected Western European economies exhibit the opposite
trend.
Countries driving volume growth in the CEE region
remain to be Russia (+30%yoy 2016), Turkey (+5%yoy
2016) and Ukraine (+2%yoy 2016) .
These increases outweigh the deleveraging tendencies in
other CEE economies, where already “mature” NPL
markets such as Romania (-29% yoy 2016), Croatia (-
20% yoy 2016) and Hungary (-31% yoy 2016) have
experienced a vibrant NPL sale activity in the past years
thus were able to reduce their NPL stock significantly.
NPL ratio continues to be trailing high with still
room for deleveraging
Although most of the surveyed markets have reduced their
NPL ratio through 2016, ca. half of them are still above the
10% mark, most of them from the SEE region with CIS General notes:
(Ukraine) leading the pack. 1) Others include BiH, FYRM, MD, EE, BY, RKS
2) Eoy 2016 data for BE & LT not available. 2016 Q3 figures reported.
Source: IMF, PwC Analysis 3) Eoy 2015 data for MD not available. 2015 Q2 figures reported.
NPL ratio (%, eoy 2016, Δpp yoy 2016)
Yoy change in NPL ratio
NPL ratio
35 %
2.4
30 %
25 %
20 % 2.0
15 %
-2.7 -1.4 6.0
-1.9 CEE
-3.9 1.1
10 % -4.3 -1.2 -4.0 average
-4.9 -0.9 -0.9 -0.4 -0.2 -0.3
-1.0 -0.3 0.1 -0.7 -0.2
5%
-0.1
0%
3)
UA MD HR BG BY BiH RO RU HU KZ FYRM SI LT CZ SK DE PL LV BE TR AT NL EE
Source: IMF, PwC Analysis * CEE average is equally weighted based on the following countries: BY, BiH, BG,
HR, CZ, EE, HU, KZ, LT, LV, MD, FYRM, PL, RO, RU, SI, SK, TR, UA
PwC
9Distressed debt market overview
Lending and NPL coverage
Lending continues to be subdued across the region
Further increase in NPL provisioning levels, especially in CIS
Overall decrease of NPL volume to regulatory capital ratio
Subdued lending growth On the other hand economies like BY and UA had to deal
Although the European banking sector is showing signs of with a reduction in loans to customers.
improved capital positions under accommodating From the surveyed markets, granted loans to customers
monetary policy, new lending in CEE remains subdued. decreased for Austria slightly (-2% yoy).
The increase in average loans to customers is driven However, Netherlands and Belgium are following their
mainly by Russia (+15% yoy). trend in gently inclining loans to customers volumes. Both
Many of the CE & SEE economies (e.g. SK, HU, EE, CZ) economies were able to reduce their already low NPL
were able to recognize a slight increase in new ratios even further.
lending. Combined with a larger reduction in NPL
volumes, these markets show continue deleveraging.
NPL volume yearly growth vs. Loans to Customers yearly growth (%, Δyoy 2016)
yoy Loans to Customers
yoy NPL Volume
15%
9% 9% 7% 5% 4% 3% 3% 2% 2% 0% 0%
-1% -2% -6% -7% -7%
RU SK HU EE KZ CZ BE RO BiH PL TR NL HR AT BY SI UA
Source: IMF, PwC Analysis
Increasing NPL coverage ratio
The NPL coverage ratio (i.e. loans provisioning to NPL future transactions. On the other hand, Belarus and
volume), reached 68% on average within the CEE Estonia, faced a further decrease in coverage ratios,
region. This marks a further increase compared to the from already significantly low levels.
previous years. CIS region economies like Russia, At the same time almost every economy shows a
Ukraine and Kazakhstan improved their coverage decrease in Net NPL to Regulatory Capital ratio.
ratios by more than 5%, signalling a potential for
NPL Coverage ratio vs Net NPL / Regulatory Capital (%, eoy 2016)
115%
102%
77% 74% 73% 72% 72% 71% 70% 70% 68% 66%
60% 59% 56%
50% 49%
45% 44% 39%
34%
30% 28%
18% 21% 17% 20% 16% 17% 20%
9% 11% 10% 9% 11%
4% 5%
-6%
FYRM TR BiH UA KZ HU SI PL HR RU MD AT SK RO BG CZ BE BY EE
NPL Coverage Ratio Net NPL / Regulatory Capital
Source: IMF, PwC Analysis
PwC
10Distressed debt market overview
Evolution of key NPL metrics
High NPL ratios, sizeable provisioning & material stock provide the right mix for
deleveraging via NPL disposals
With SEE & CE countries benefiting from past deals, Russia and Ukraine
walk the path towards ripening deal conditions
Deleveraging via disposals is expected to are clearly converging towards the CEE average, reflecting
continue and accelerate past transactions.
Markets exhibiting pressure to deleverage with NPL Markets like Russia and Ukraine show increased
ratios above average, and coverage ratios high enough provisioning levels as well as a ramping up NPL
to allow banks to sell without material negative P&L effect ratio. They are thus seen as interesting targets for future
offer the ideal landscape for sizeable NPL deals within an NPL deals, especially in terms of volume.
economy.
Active NPL markets like Romania, Bulgaria and
Croatia, are still exposed to NPL ratios above average, but
NPL ratio, coverage ratio and volume (%, EURb, eoy 2016)
NPL coverage ratio Bubble size represents NPL volume
100%
eoy 2015
eoy 2016
90%
80%
KZ BiH
HU UA
70% PLSI
PL BiH
HR
CEE RU HU
KZ SI MLD
2016*
UA
RU HR
60% SK
RO
RO
SK
50% CZ BG
BG
CZ
BE
BE
40%
30%
20%
10%
0%
0% 5% 10% 15% 20% 25% 30% 35% 40%
CEE NPL ratio
2016*
* CEE average is equally weighted based on the following countries: BY, BiH, BG, HR, CZ, EE, HU, KZ, LT, LV, MD, FYRM, PL, RO, RU, SI, SK, TR, UA
Source: IMF, National Bank of Serbia, PwC Analysis
PwC
1103 Vibrant deal space driven by a virtuous circle of
macro, industry and deal drivers
Non-core category is quickly expanding beyond NPL
NPL deals are slowly moving eastwards
Deals landscape
PwC
12Deals landscape: changing the “core” of non-core
Looking ahead – our top predictions
Bogdan Popa Resurgence of capital relief (i.e. risk
Senior Manager, transfer) deals. Securitization, synthetic sales,
PwC Europe portfolio insurance – we expect all this to be heard
Portfolio Advisory Group Leader more and more in the vocabulary of C-suite
Austria members, as they look for solutions to transferring
risk without (necessarily) loosing client
With the equilibrium on banks' relationship and potential for further growth.
Underlying asset diversifications. As NPL
balance sheets not yet reached, the stock steadily dries up and with little chance that
non-core market remains an (at least in the near future) new massive buckets
attractive investment. will form given the various regulatory measures in
place and banks’ recent experience, we expect
seller and buyers alike to turn their view to other,
Following a slower start, 2017 is set to close more benign asset classes labelled as non-core. Be
strong, with more than EUR 6b GBV of non- it, performing debt which doesn't fit current
core deals currently ongoing or announced strategy or entire units previously in charge of
across the CEE region. Having been kept busy managing real estate, leasing or loans, the non-
during the first half of the year by anticipating core space is about to get enlarged and more
the upcoming regulatory and accounting difficult to define as NPL only, with sellers and
changes, banks have placed a number of non- buyers looking to increase their balance sheets.
core deals in the market during the second
NPL deal volume moving East. Having
half of 2017. This intense environment is
Russia and Ukraine with sizeable stock,
expected to continue well beyond 2017, driven
improving provisioning and timid but increasing
by a number of macro, industry and deal
deal activity, we expect these markets to
specific factors.
potentially become (albeit slowly and pending
improving political stability) the darlings of the
On the Macro side, key drivers are the ongoing distressed debt industry, as deal and recovery
upturn in the economy across the continent, in the conditions improve. Additionally, Turkey
light of low inflation and cheap money. With equity remains one of the most interesting
having become almost as affordable as debt, there is a markets to follow, given its unique mix of
constant pressure on buyers’ side to invest sizeable NPL volume, relatively low complex asset
and deploy their capital. deal flow and already existing AMC infrastructure.
Technology to play an increasing role in
Looking at industry specific drivers, regulatory deal making. Automated data readiness tools,
changes hold the spotlight, with IFRS 9, EBA's NDD pricing engines and trading platforms will become
(new default definition) and ECB's NPL guideline part of every day deal business, replacing
making it expensive for banks to hold on to non- or repetitive or data intensive deal tasks, and helping
sub-performing exposures. Alternatively, upward on key deal issues such as data quality and price
pressure on equity return and cost reduction benchmarking.
expectations from shareholders, together with (still) Lastly, the need to “be earlier in the deal”
subdued lending also leave banks wanting to drive will intensify. With availability of “off the shelf
more value out of their hard worked client assets” coming to an end, buyers and seller will
relationships (or acquire readily available portfolios). need to come closer, to generate opportunities
and help optimize their positions, by planning
Lastly, on a deal level, the need for more their deals strategically as source of both, relief
efficient M&A processes is increasing, as and incipient of growth.
opportunity costs rise for buyers and sellers alike.
Additionally, with the largest NPL deals in the region
now completed or about to, buyers face more
compact deals, potentially yielding lower benefits
but still sizeable effort and time investments.
13
PwCCEE distressed debt transactions
Market perspective
Ca. EUR 20b distressed debt GBV brought to market during the past 5 years: South East
Europe countries account for more than half of the traded GBV.
With (most) large deals behind, the distressed debt market is now treading on an average GBV
deal volume of ca. EUR 150m, approx.. half from the 2014-2016 average deal size.
Most sell-side volume driven by Austrian banks, with Greek banks following closely.
Buy-side activity driven by regional (CEE based or focused) servicer-investors, working
together with established Western Europe funds. However, the latter find it more difficult to
compete as…
… distressed debt prices have continued to increase, especially across the SEE markets,
positive macro perspectives and relative scarcity of (large) deals, combined with appetite from
“new” Western Europe buyers and market entry of large European level servicers.
A few more bundle deals (platform & portfolio) expected: encouraged by recent successful
deals, more platform deals are currently being prepared, with debt and REO assets.
Increasing supply and appetite for (sub)performing assets: Poland and Romania leading
the way, as international and local banks look to reshape their portfolios.
“3rd wave” of new markets underway: both small (Albania, Bosnia & Herzegovina) and
(really) big (Russia and Ukraine), these markets are becoming more sought-after by (mostly
regional) investors looking to expand their operations and establish themselves in still untapped
territories.
More than EUR 20b GBV brought to market in the Romania and Croatia make-up ca. 60% of the GBV
past 5 years. Following three consecutive years of volume brought to market. Hungary and Slovenia
exponential increase, 2017 market volume is expected to coming in approx. equally in 3rd place. Activity growth
slightly fall behind 2016 levels. observed in Bulgaria and Serbia.
Distressed debt GBV brought to market yearly (EURb) Distressed debt GBV brought to market by country (%)
∆yoy B&H
+31% Bulgaria
3%
Russia 3%
∆ yoy 8,0 4%
+191%
Serbia
6%
6,1 6,0
SEE Romania
7% 42%
∆ yoy
+370%
Slovenia
8%
2,1
Hungary
0,4 9%
Croatia
2013 2014 2015 2016 2017F 19%
Source: PwC Analysis
PwC
14CEE distressed debt transactions
Countries overview
Poland and Romania as mature markets, with both experienced sellers, diversified buyers and servicing
available across all asset classes. Similar is also true for Croatia and Slovenia where few sizeable NPL disposals
are expected. However secondary sales are expected to grow, intensified by a consolidation trend among
local servicers, as well as potential single-ticket transactions.
Hungary, Serbia and Bulgaria have shown strong NPL activities over the past 18 months, with
potential in still untapped asset classes (e.g. retail in Serbia with pending regulatory changes) as well as available
stock. Strong investors interest driven by improved market confidence, established track record, fast growing
servicing platforms and the improving regulatory environment.
Russia and Ukraine still seen as sizeable future opportunities, with both large NPL stocks and ratios
putting pressure on sellers, coupled with a modest deals track record outside retail unsecured. Potential has also
been identified in smaller markets such as Albania or Bosnia & Herzegovina, where initial transactions are
being observed as well as recent concrete steps towards improvement regulatory environment.
Turkey is in a category of its own, with sizeable NPL volumes expected to further increase, but still modest
ratios, prompting sellers to a prudent approach. Locked-in servicing, is shared among local AMCs, mostly focused on
retail assets. However, secured assets together with AMCs investment, could provide plentiful growth opportunities,
pending further macro and political stability.
Country watch
Poland Baltics
Confirmed investor appetite & seller interest Confirmed investor appetite & seller
Ongoing transactions, especially in the retail interest
unsecured segment Favourable regulatory regime
Available servicing platforms Available servicing capabilities
Transactions track record in all asset
classes
Czech Republic & Slovakia Russia and Ukraine
Confirmed investor appetite & seller interest Known seller interest
Available servicing platforms Political uncertainty, but improving
Limited stock for portfolio disposals regulatory regime
Sizeable NPL stocks, initial transactions
observed
Hungary Limited servicing platforms availability
Known investor appetite & seller interest
Improved regulatory environment Romania
Growing number of servicing platforms Confirmed investor appetite & seller
Several transactions already on the market, interest
with disposal to continue and accelerate Favourable regulatory regime
Sizeable NPL stock
Available servicing platforms
Significant transactions track
record in all asset classes
Croatia & Slovenia
Strong transaction track record, with Serbia
declining available NPL stock Known investor appetite & seller interest
Available and growing servicing platforms Regulatory improvements ongoing
Transactions closed or ongoing in all Sufficient, but declining NPL stock
asset classes Limited servicing platforms availability
Bulgaria Turkey
Confirmed seller & increased buyer interest Confirmed seller interest, with buyers selectively looking
Favourable regulatory regime at opportunities
Sufficient NPL stock offering deal pipeline Sizeable NPL stock
Servicing platforms quickly developing Concentrated servicing market
Source: PwC Analysis
PwC
1504 Sizable NPL volume available; regulatory changes
expected to trigger increased disposal interest
Strong investors appetite based on strong market
trust and economic power of the country
Stable and experienced regulators & sellers
Established markets focus
PwC
16Austria
2016 NPL%: 2.7% (∆yoy - 0.7pp), vol. EUR 16.9b (∆yoy - 4.9b)
GDP Inflation rate Unemployment rate Debt-to-GDP
1.5% 1.4%
1.3% 1.3% 2.1% 2.0% 6.1% 84% 81%
1.8% 5.9% 5.9% 5.9% 78% 76%
1.0%
'16 '17 '18 '19 '16 '17 '18 '19 '16 '17 '18 '19 '16 '17 '18 '19
Top 5 banks record ca. EUR 21.6b NPL on their consolidated balance sheet; claims against CEESEE
account for vast majority of this exposure
Austrian Banks’ (incl. country’s bad bank HETA Asset Resolution) have strong transaction track record
with regards to its NPL exposure booked in the CEE region; activity with relation to Austrian
booked exposure still limited
Stable legal and regulatory environment
NPL volume & ratio largest banks (eoy 2016, EURm)
Consolidated group reports
Banks in Austrian hold about two-thirds of their
7.000 40% consolidated foreign claims against CEE / SEE.
6.000 35%
On account of the restructuring of UniCredit
Bank Austria the aggregate total assets of
30%
5.000
25%
4.000 Austrian banking subsidiaries in CE / SEE went
20%
3.000 down by almost 40% and their geographical risk
15%
2.000 profile changed notably.
10%
1.000 5% The largest NPL stock is recorded by Erste Group
0 0% and Raiffeisen Bank International, the countries‘
Erste Group RBI HETA Bank Austria Sberbank
market leaders in term of size.
NPL volume NPL ratio
Legal & regulatory environment
No banking license is required for the acquisition of performing and non-performing claims, however
banking secrecy is to be considered.
In general there is no (legal) difference in treatment of transfer of performing and non-performing claims.
However, in practice, the courts show the tendency to treat non-performing claims as less “in need of
protection” than performing.
The sale of non-performing loans is generally VAT exempt. The VAT exemption might not apply if a
whole portfolio of contracts is transferred (ECJ 22.10.2009, C-242/08, Swiss Re). Factoring would be
subject to an analysis on a case-by-case basis.
If a profit is generated from the disposal of loans, that profit would be taxable at the standard CIT.
At the same time, losses may be fully deductible from the CIT base of the seller. Condition is that the
parties involved (buyer and seller) are unrelated parties and that no transfer pricing issues arise in this
respect.
Servicing
Servicing is developed across all asset classes. Locally present names include Intrum Justitia, Hoist
Finance, Converta as well as other players.
Selected transactions 2016
Project name Seller Asset type GBV EURm Market year Status Buyer PwC role
Glan HETA NPL - Leasing 110 2016 Late stage n/a Sell-side advisor
unsecured
Source: IMF, Annual Reports 2015/2016, PwC Analysis
PwC
17Belgium
2016 NPL: 3.5% (∆yoy – 0.3 pp), vol. EUR 24.8b (∆yoy + 1.0b)
GDP Inflation rate Unemployment rate Debt-to-GDP
1.6% 1.5% 1.5%
1.2% 2.0% 106%
8.0% 104%
1.8% 7.8% 7.6% 103%
1.7% 1.7% 7.4% 102%
'16 '17 '18 '19 '16 '17 '18 '19 '16 '17 '18 '19 '16 '17 '18 '19
As of end 2016, top 3 largest banks in the country held ca. 50% of the NPL stock
Strong investors interest, but limited incentive to sell due to high quality of banks’ assets
and low NPL ratios
Stable legal and regulatory environment; no formalities or license are required for claims
assignment
NPL volume & ratio largest banks (eoy 2016, EURm)
6.000 5,0%
At eoy 2016, largest NPL stock was held by BNP
Paribas Fortis (ca. EUR 6.1b) and by KBC Bank
5.000
4,0%
(ca. EUR 4.3b).
4.000
3.000
3,0%
Highest NPL ratio level was registered by
2,0% Argenta (ca. 4%), followed by BNP and KBC
2.000
1,0%
(both at ca. 3%).
1.000
Stable NPL ratio (below ECB recommended
- 0,0%
BNP Paribas KBC Bank Belfius ING Belgium Argenta threshold) with increasing absolute value based
Fortis
NPL volume NPL ratio
on strong economic activity and increased
landing.
Legal & regulatory environment
No formalities or licenses are required for a valid assignment of receivables under the
Belgium law. Some types of receivables may be subject to specific formalities which might include
licensing requirements (e.g.: mortgage receivables, consumer credit receivables and receivables arising out
of public procurement contracts). In 2012 Belgian law was changed to facilitate the mobilization of
receivables in the financial sector, softening the formalities applicable to transferring credit receivables and
/ or related security interests.
Even though the current NPL environment seems favourable overall, some features in the framework could
represent potential challenges to NPL workout in Belgium.
Indicators such as NPLs and payment arrears of households tend to confirm the relatively
high quality of bank assets in Belgium while these have been on the rise since the financial crisis,
coinciding with the increases in the private debt ratio.
The transfer of NPL is in general VAT exempt. In case a loan portfolio relates to mortgages, stamp duties
could be due. Capital losses / gains (as calculated on the net tax value) on NPL transfers are in principle tax
deductible / taxable at the general corporate tax rate. Impairments on NPL can be tax deductible if certain
conditions are met (a.o. individualization, proof of loss).
Servicing
Locally present names include Stater, Cedar and Intrum Justitia.
Selected transactions 2016 - 2017
Project name Seller Asset type GBV EURm Market year Status Buyer PwC role
n/a AXA Bank Europe NV Branch 633 2017 Ongoing OTP Bank n/a
n/a Van Lanschot NPL, PL 220 2017 Closed CKV n/a
n/a ABN Amro Bank NV Ptf pensiun fund n/a 2017 Closed Record Bank n/a
n/a Optima NPL, PL 120 2016 Closed Delta Lloyd n/a
n/a Krefima NPL, PL 47 2016 Closed bpost Buy-side advisor
n/a Optima / Arcole NPL - Mortgages 28 2016 Closed CKV n/a
Source: IMF, Annual Reports 2015/2016, PwC Analysis
PwC
18Germany
2016 NPL%: 4.2% (∆yoy – 0.2 pp), vol. EUR 135.0b (∆yoy - 14.0b)
GDP Inflation rate Unemployment rate Debt-to-GDP
1.8% 1.6% 1.5% 1.4% 68%
2.0% 1.9% 4.2% 4.2% 65% 62%
1.7% 4.2% 4.2% 59%
0.4%
'16 '17 '18 '19 '16 '17 '18 '19 '16 '17 '18 '19 '16 '17 '18 '19
Top 5 banks account for ca. 20% of country's NPL stock; Strong decline in overall NPL volume
observed, driven among other by improved market and economic conditions
Strong investors interest and stock available, however still limited incentive to sell due to low
NPL ratios
Stable legal and regulatory environment as well as available servicing capabilities
NPL volume & ratio largest banks (eoy 2016, EURm)
12.000 5,00% At eoy 2016, largest NPL stock was held by
10.000
4,50%
4,00%
Deutsche Bank (ca. EUR 10.8b), followed by
3,50% Commerzbank (ca. EUR 6.9b) and DZ Bank
8.000 3,00%
Group (ca. EUR 5.0b).
2,50%
6.000 2,00% Highest NPL ratio level was registered by
4.000
1,50%
1,00%
HypoVereinsbank Group, member of Unicredit
0,50% Group, (ca. 4.7%), followed by DZ Bank (ca.
2.000
Deutsche Bank Commerzbank DZ Bank Group HypoVereinsbank KfW Group
0,00% 3%).
Group (incl. Group (incl. Group (member
Postbank) Eurohypo) of Unicredit) Improved market and economic conditions
NPL volume NPL ratio
were observed to increase the pace of
deleveraging for German banks.
Legal & regulatory environment
Normally no approval of Central Bank is required for transfer of receivable.
Debtor consent is required for transfer of performing loan receivables, while it is not needed for non-
performing exposures.
Loan servicers are not regulated directly by the German banking supervision (BaFin), but they
have to comply with the same standards as the outsourcing partner itself.
Debt collection companies may be excluded from any regulation depending on the specifics of their
services. Many debt collectors offer services that exceed debt collection, e.g. receivables management,
which is regulated.
Servicers, who provide financial services on a commercial basis (e.g. Factoring), need the
permission/license from the German banking supervisor (BaFin) as stated in § 32 Abs. 1 KWG (German
Banking Act).
The transfer of NPL is in general exempt from VAT.
Servicing
Servicing is developed across all asset classes. Locally present names include Intrum Justitia (who recently
merged with Lindorff), LOANCOS, EOS, GFKL and others.
Selected transactions 2017
Project name Country Seller Asset type GBV EURm Market year Status Buyer PwC role
n/a Germany Various DCAs NPL - Retail Up to 100 2017 Ongoing n/a Buy-side
Neptun Germany HSH Nordbank Corporate, RE, shipping 10.000 2017 Ongoing n/a Buy-side
Collection Germany Burda Group NPL - Retail 50 2017 Ongoing n/a Buy-side
Sky Germany n/a NPL - Retail 50 2017 Ongoing n/a Buy-side
Glan Austria/Germany HETA NPL - Leasing unsecured 110 2016 Late stage n/a Sell-side advisor
Air Germany HSH Nordbank CRE 200 2017 Signed Cerberus n/a
Deep Sea Germany Nord LB Shipping 1.500 2017 Closed KKR Buy-side
Source: IMF, Annual Reports 2015/2016, PwC Analysis
PwC
19Netherlands
2016 NPL%: 2.5% (∆yoy - 0.2 pp), vol. EUR 43.8b (∆yoy - 2.1b)
GDP Inflation rate Unemployment rate Debt-to-GDP
1.5% 5.9%
1.4% 5.4% 5.3% 5.2% 63%
2.1% 2.1% 0.9% 60% 58% 56%
1.8% 1.7%
0.1%
'16 '17 '18 '19 '16 '17 '18 '19 '16 '17 '18 '19 '16 '17 '18 '19
Major Dutch banks are observing organic NPL decline in 2017 on the back of economic
recovery and increased special servicing efforts.
Real estate secured portfolios account for most loan portfolio brought to market; key buyers are
observed to be foreign investor groups.
NPL specialty servicers appear to be seeking expansion into other asset classes as the third
party specialty servicing market tightens.
NPL volume & ratio largest banks (eoy 2016, EURm)
20.000 4,5%
At eoy 2016, Netherlands’ three largest banks
4,0% (ING, ABN AMRO, Rabobank) hold >95% of the
16.000 3,5% total NPL stock.
NPL volume shows positive correlation with the
3,0%
12.000
2,5%
2,0%
economic cycle, whilst there is a negative
correlation between the NPL rate and GDP
8.000
1,5%
4.000 1,0% growth.
0,5%
- 0,0%
Relatively low NPL ratios based on a strong
ABN ING Bank Rabobank SNS Bank NIBC Bank insolvency framework.
AMRO
NPL volume NPL ratio One sizeable NPL portfolio transaction observed
in 2017.
Legal & regulatory environment
In one of the past CRE transactions, the treatment of borrowers by the financial buyer led to several law
suits against the Vendor, however only one of the lawsuits resulted in a successful claim.
Cost and duration of settling insolvency cases is relatively low compared to Europe, whereas
recovery rates are among the highest.
Strict bankruptcy law provisions allow lenders to foreclose a mortgage loan even during bankruptcy
proceedings. Nevertheless, voluntary sales are observed to be more common resolution strategies.
Lenders can repossess without court order with the mortgage tails remaining enforceable, however
personal insolvencies are still rare, as there is a cultural adversity to excessive debt and to
bankruptcy.
Servicing
Specialty servicing is a relatively small part of the Dutch market in terms of volume, as the share of non-
performing loans is limited. The competitive set in specialty servicing is broad and consists mainly of
licensed bailiffs who offer loss mitigation services.
Dutch servicing market shows moderate levels of M&A activity, with two major deals made recently being
Lindorff / Intrum Justitia and Arrow / Vesting.
Potential growth in servicing market is mainly driven by higher stake alternative financing parties,
such as (foreign) private equity houses.
Known names with local capabilities include Capita, CMIS, Lindorff, Situs and Vesting Finance.
Selected transactions 2016 - 2017
Project name Seller Asset type GBV EURm Market year Status Buyer PwC role
Stack ABN AMRO CRE NPL 220 2017 Closed Attestor Capital Buy side M&A
Swan Propertize CRE PL/NPL 5.500 2016 Closed Lone star, JPM, Goldman Sachs Buy side M&A
Hieronymus FMS CRE PL/NPL 580 2016 Closed Goldman Sachs Buy side M&A
Orange Rabobank CRE NPL 350 2016 Aborted n.a Buy side DD
Source: IMF, Annual Reports 2015/2016, PwC Analysis
PwC
2005 Strong transactions activity across most assets classes
Buyer appetite driven by available stock, transaction track-
record and supporting regulators
Declining available stock
Developed markets focus
PwC
21Bulgaria
2016 NPL%: 13.2% (∆yoy – 1.4 pp), vol. EUR 5.0b (∆yoy – 0.4b)
GDP Inflation rate Unemployment rate Debt-to-GDP
7.7% 28%
3.4%
3.4% 3.6% 2.7%
2.9% 3.2% 2.5% 1.8% 1.9%
2.9% 7.1%
1.0% 6.9% 24% 24% 23%
6.7%
'16 '17 '18 '19 '16 '17 '18 '19
'16 '17 '18 '19 -1.3% '16 '17 '18 '19 '16 '17 '18 '19
As of end 2016, top 3 largest banks in the country held ca. 60% of the NPL stock
High continuation of market activity expected for 2017 / 2018, following successful 2016
activity; expected further increase in the volume of NPLs put up for sale driven among others by
mergers observed on the market
Improving legal & regulatory conditions, while NPL acquirers still need to be registered as
financial institutions
NPL volume & ratio largest banks (eoy 2016, EURm) At eoy 2016, largest NPL stock was held by
800 30%
UniCredit’s Bulbank and by First Investment
(ca. EUR 730m each).
25%
600 Highest NPL ratio level was registered by
20%
United Bulgarian Bank (ca. 26%), followed by
400 15%
Eurobank (ca. 19%).
200
10%
Observed accelerated deals market activity
5% stemmed from increased investor confidence
- 0%
as well as AQR conducted in H1 2016.
Unicredit First Investment United Eurobank DSK Bank Societe General
Bulbank (cons.) Bank (cons.) Bulgarian Bank (cons.) Expressbank The merger of United Bulgarian Bank with
(cons.) (cons.)
local subsidiary of KBC is expected to lead to
NPL volume NPL ratio
significant NPL volume being brought to the
Legal & regulatory environment market
NPL portfolio acquirers are required to register with the National Bank as a financial institution and may
have to fulfil certain capital and business requirements.
There has been a proposition to introduce a 10-year statute of limitations for unsecured loans
to physical persons. The proposition was rejected by the National Assembly in October 2017.
Amendments to the Registered Pledges Act to introduce further protective measures for
creditors, eliminate certain inconsistencies, and make the register electronic. The changes regarding the
functioning of the Central Register of Special Pledges shall enter into force in September 2018.
Changes in the Commercial Act regarding insolvency proceedings are currently in effect, including the
introduction of a new procedure for among other, early stabilisation of companies as a way of
avoiding insolvency.
NPL transfers are generally not subject to VAT or stamp duty. Corporate income tax may apply.
Servicing
International and regional servicers show increasing appetite for the market, with set-up of secured (both
private individuals and corporates) assets servicing capabilities are currently developing.
Locally present names include APS, AVS, B2Holding, Credit Express, Kredit Inkaso, EOS, Frontex, etc.
Selected transactions 2016 - 2017
Project name Seller Asset type GBV EURm Market year Status Buyer PwC role
Metro Eurobank NPL - Corporate 65 2017 Late stage n/a n/a
Taurus 2 Bulgaria UniCredit NPL - Mixed 80 2017 Late stage n/a n/a
n/a BNP Paribas NPL - Retail 46 2016 Closed Kredit Inkaso n/a
Taurus Bulgaria UniCredit NPL - Corporate, CRE 100 2016 Closed B2Holding Sell-side advisor
n/a Eurobank NPL - Retail unsecured 143 2016 Closed EOS n/a
n/a National Bank of Consumer 70 2016 Closed n/a n/a
Source: IMF, Annual Reports 2015/2016, PwC Analysis, National Bank of Bulgaria
PwC
22Croatia
2016 NPL%: 13.6% (∆yoy - 2.7pp), vol. EUR 4.7b (∆yoy – 1.1b)
GDP Inflation rate Unemployment rate Debt-to-GDP
2.9% 2.9% 1.4%
1.1% 1.1% 84% 83%
2.6% 82%
2.5% 15.0% 13.9% 80%
13.5% 13.2%
'16 '17 '18 '19
'16 '17 '18 '19 -1.1% '16 '17 '18 '19 '16 '17 '18 '19
Local subsidiaries of UniCredit, Erste and Intesa held ca. 80% of the system’s NPL stock
at eoy 2016, with Raiffeisen Bank registering highest NPL ratio
High investor appetite and bank activity during the past 2 years, where all major banks
have performed, or are currently in significant NPL deleveraging / disposal processes.
The extraordinary administration of Agrokor Group and the potential spilover effects to Agrokor
reliant suppliers may bring additional NPL volumes to the market. However, no snowball
effect to the overall economy is expected by the Croatian National Bank (CNB)
NPL volume & ratio largest banks (eoy 2016, EURm) Zagrebacka Banka (UniCredit), held ca. EUR
20%
1.8b of NPL stock at eoy 2016 (following closing
2.000
18% of Taurus 1 transaction in 2017, significant drop
1.600
16% expected), followed by Erste and PBZ (Intesa)
with ca. EUR 0.7b each.
14%
1.200 12%
10%
NPL ratio-wise, highest level was registered by
8%
800
6%
the Raiffeisen Bank (18%), followed by
400 4% Hrvatska Postanska Banka as well as
2%
Zagrebacka banka.
- 0%
Zagrebacka
banka (cons.)
Erste & Stmk
Bank (cons.)
Privredna
banka (cons.)
Raiffeisenbank
(cons.)
Hrvatska
poštanska
Addiko Bank
(cons.) CNB is expecting an increase of provisions for
NPL volume
banka (cons.)
NPL ratio
Croatian banks’ unsecured exposures to
Agrokor Group companies and its selected
Legal & regulatory environment suppliers.
Currently no special licensing is required for NPL portfolio acquisitions; there are however ongoing
discussion regarding potential introduction of a servicing license concept.
National Bank non-prohibition confirmation of SPAs is required for signing.
In April 2017, the Act on the Extraordinary Administration Procedure in Companies of
Systemic Importance for the Republic of Croatia was introduced. Agrokor was the first company
which submitted the request for extraordinary administration, upon which the law is colloquially called
“Lex Agrokor”.
Further significant legal & regulatory changes are expected to arise from implementation of IFRS 9
and Basel IV.
Bank NPL write-offs become tax exempt only after “sufficient collection measures” have been taken.
Servicing
Servicing is developed across all asset classes, as a result of a strong transaction track record.
Selected transactions 2016 - 2017
Project name Seller Asset type GBV EURm Market year Status Buyer PwC role
n/a Intesa NPL - CRE 200 2017 Expected n/a n/a
Solaris HETA Platform & NPL portfolio 700 2017 Expected n/a Sell-side advisor
Taurus 2 Croatia UniCredit NPL - Mixed 260 2017 Ongoing n/a n/a
n/a Raiffeisen NPL - Corporate 45 2017 Ongoing n/a n/a
n/a Raiffeisen NPL - Single ticket 85 2017 Ongoing n/a n/a
Atlantis HETA Single ticket 30 2016 Ongoing n/a Sell-side advisor
n/a Raiffeisen NPL - Corporate 100 2017 Signed DDM n/a
Faust HETA Single ticket 100 2016 Signed Gasfin SA Sell-side advisor
Pathfinder HETA CRE 400 2016 Closed Deutsche Bank / EOS Buy-side advisor
Sunrise HPB NPL - Mixed, CRE 320 2016 Closed APS / B2Holding n/a
Taurus Croatia UniCredit NPL - Mixed 770 2016 Closed APS / Attestor Sell-side advisor
Saphire HETA Single ticket 135 2016 Closed KNG Sell-side advisor
Apollo HETA Single ticket 25 2016 Closed B2Holding Sell-side advisor
Skipper HETA NPL - CRE 160 2016 Closed Supernova n/a
PwC
23
Source: IMF, Annual Reports 2015/2016, PwC Analysis, National Bank of CroatiaHungary
2016 NPL%: 7.4% (∆yoy - 4.3 pp), vol. EUR 3.5b (∆yoy - 1.6b)
GDP Inflation rate Unemployment rate Debt-to-GDP
3.3% 3.0% 4.9%
2.5% 4.4% 4.3% 4.3% 74% 73%
2.9% 3.0% 2.6% 72% 71%
2.0%
0.4%
'16 '17 '18 '19 '16 '17 '18 '19 '16 '17 '18 '19 '16 '17 '18 '19
Intesa, KBC, Erste and Raiffeisen local subsidiaries held the most significant NPL stock
at eoy 2016, registering also some of the highest NPL ratio level in the local banking system
Following the lift of the private individuals enforcement moratorium, the NPL disposals market
picked up considerably during 2016 (EUR 0.8b NPL disposal in 2016), with further
intense activity anticipated for 2017 driven by hgh investor appetite and outstanding volume
(Secured) servicing at mature stage, with most large international and regional players looking
to establish or consolidate their local position
NPL volume & ratio largest banks (eoy 2016, EURm) Following deal activity and regulatory support
800 25% the Hungarian total NPL stock showed a
significant decline over the past years, with EUR
600
20%
1.6b less yoy 2016. The deleveraging activity is
15% expected to continue at a similar pace.
400
10%
CIB (Intesa Group) recorded NPL volume of ca.
EUR 600m (on a 21% NPL ratio), followed by
200
5% Raiffeisen Bank and Erste with ca. EUR 420m
- 0%
and EUR 350m, respectively.
MARK (the local state-owned “bad bank”) was
CIB Raiffeisen Bank Erste Bank K&H UniCredit Bank OTP Hungary
Hungary Hungary Hungary (uncons.)
NPL volume NPL ratio sold to APS in April 2017.
Legal & regulatory environment
A locally financ institution license is needed to acquire NPLs.
As most foreign currency denominated mortgages have been converted to local currency, the foreclosure
moratorium does not apply anymore, making them more attractive to potential investors.
Minimum enforcement price for residential R/Es was introduced (70% of the market value until March
2017, 100% in the first year and 90% in respect of any subsequent enforcement attempt from March 2017).
The Hungarian VAT act does not stipulate conclusively whether NPL transactions are VAT exempt or not.
As of 1 January 2017, the National Bank passed a general decision prescribing the creation of a systematic
risk buffer to credit institutions operating in Hungary and to groups involving a credit institution.
Servicing
Servicing is at a mature stage with local service providers and a growing number of regional players mainly
focused on retail unsecured, but eager to grow in secured asset classes.
Known names with local capabilities include APS, AVS, Arthur Bergmann, Credit Express, DDM, EOS,
Indotek, Intrum Justitia etc., with other large regional names currently in advance stages of setting up local
offices (e.g. B2Holding).
Selected transactions 2016 - 2017
Project name Seller Asset type GBV EURm Market year Status Buyer PwC role
n/a MKB Bank NPL - Retail 200 2017 Expected n/a n/a
Taurus 2 Hungary UniCredit NPL - Retail 50 2017 Ongoing n/a n/a
Rosie Raiffeisen NPL - Retail 300 2017 Ongoing n/a n/a
Taurus Hungary UniCredit NPL - Retail 130 2016 Closed APS Sell-side advisor
Ulysses Erste NPL - Retail mortgage 350 2016 Closed Intrum Justitia Buy-side support
Rita Raiffeisen NPL - Corporate, mixed 300 2016 Closed n/a n/a
n/a Axa Residential n/a 2016 Closed OTP n/a
Source: IMF, Annual Reports 2015/2016, Hungarian National Bank, Hungarian Central Statistical Office, PwC Analysis
PwC
24Poland
2016 NPL%: 4.1% (∆yoy - 0.3pp), vol. EUR 11.4b (∆yoy - 0.6b)
GDP Inflation rate Unemployment rate Debt-to-GDP
3.8% 3.3% 2.3% 2.5%
2.6% 3.0% 1.9% 6.2% 54% 54%
4.8% 4.0% 3.9% 54% 54%
-0.6%
'16 '17 '18 '19
'16 '17 '18 '19 '16 '17 '18 '19 '16 '17 '18 '19
Poland recorded the highest NPL level in the CEE region – EUR 11b. Market dominated by top
banks PKO Bank Polski, Bank Pekao, Raiffeisen Polska, Bank Zachodni WBK and mBank accounting
for majority of country’s NPL stock.
Highly active retail NPL market, with limited activity observed in the secured Corporate & SME
segment
NPL volume & ratio largest banks (eoy 2016, EURm)
2.800 10% PKO Bank Polski, largest bank in the country, held
2.400
9% the largest NPL stock as of end 2016 amounting to
2.000
8%
ca. EUR 2.8b, followed by Bank Pekao, (ca. EUR
7%
6%
1.8b) and Bank Zachodni WBK (ca. EUR 1.6b).
1.600
5% The highest NPL ratio among selected banks was
1.200
4%
recorded by Bank Pekao, reporting a ratio of 9.2%,
3%
followed by Raiffeisen Bank with a ratio of ca. 8.0%.
800
2%
400
1% Remaining top banks exhibited a ratio of 6.0% on
-
PKO Bank Polski Bank Pekao Bank Zachodni mBank Raiffeisen Bank
0% average.
WBK
Recent transactions, amounting to EUR 3.7b since
NPL volume NPL ratio 2015, show increasing activity and interest in the
polish NPL market.
Legal & regulatory environment
No notification (or permits) of the National Bank or other national authorities is required
for assignment of NPLs. However the sale of highly contentious FX mortgage loans held in Polish
banks to external buyer is potentially to be discussed with Polish Financial Supervision Authority.
Retail loans are subject to a double legal framework - Consumer Credit Act with some protection
of the borrower and Banking Act; in addition sale of mortgage loans are subject to the upcoming law
transposing Mortgage Credit Directive (e.g. mechanism of forbearance).
No license is required for the acquisition of NPLs, while servicing the NPL loans requires
permission by Polish FSA in some cases.
There is a waiver of bank secrecy on NPL sales.
VAT treatment of the transfer of NPLs is a complex issue in Poland and subject to different
interpretations of tax authorities and administrative courts. It should be analysed on a case-by-case basis.
Servicing
Main servicers on the polish market include Kruk, Best, EOS Group, CreditExpress, B2Holding, APS
Holding, GetBack, Kredyt Inkaso as well as PRA Group.
Selected transactions 2015 - 2017
Project name Seller Asset type GBV EURm Market year Status Buyer PwC role
n/a n/a PL - Retail Mortgage >2000 2018 Expected n/a Financial advisor
n/a n/a NPL - Retail >250 2018 Expected n/a n/a
n/a n/a NPL - Retail >250 2017 Expected n/a n/a
n/a n/a PL - Retail Mortgage 100 2017 Ongoing n/a Lead sell-side
n/a n/a NPL - Retail >200 2017 Ongoing n/a n/a
n/a Idea Leasing PL - Leasing (securitisation) 350 2017 Ongoing n/a n/a
n/a Getin Noble Bank PL - Auto-loans (securitisation) 166 2017 Closed n/a n/a
n/a Santander PL - Retail (securitisation) 290 2016 Closed n/a n/a
Source: IMF, Annual Reports 2015/2016, National Bank of Poland, PwC Analysis
PwC
25Romania
2016 NPL%: 9.6% (∆yoy - 3.9pp), vol. EUR 5.6b (∆yoy - 2.3b)
GDP Inflation rate Unemployment rate Debt-to-GDP
3.2% 2.9%
1.3% 42% 43%
4.8% 6.0% 5.8% 39% 41%
4.2% 3.4% 3.3% 5.4% 5.2%
'16 '17 '18 '19
-1.6%
'16 '17 '18 '19 '16 '17 '18 '19 '16 '17 '18 '19
Out of the ca. 37 credit institutions on the market, the top 3 local franchises by NPL
volume (Erste, SocGen and UniCredit) held ca. 40% of the total NPL stock at eoy 2016
Most active NPL market in the region, with transactions topping EUR 3b GBV in the last 18
months; servicing developed across all asset categories, with active competition among players
Active and supportive regulatory environment
NPL volume & ratio largest banks (eoy 2016, EURm)
BCR (Erste Group) recorded an NPL stock of
1.000 14%
ca. EUR 0.9b at eoy 2016 (significant drop
900 compared to eoy 2015) closely followed by
12%
800 BRD, the local SocGen subsidiary.
700 10%
600
8%
Overall NPL ratio at 9.6% beginning of the
500 year, with highest NPL ratio stemmed from
6%
400
the UniCredit bank, at ca. 13.0%.
300 4%
200
2%
Ongoing M&A activity over the last 18months
100
(latest being Bancpost).
- 0%
BCR Group BRD Group UniCredit
Group
Banca
Transilvania
Raiffeisen Bank
Group
CEC
Most large local players went through NPL
Group
disposal processes, with further sales
NPL volume NPL ratio
expected.
Legal & regulatory environment
No license is required for the acquisition of receivables with the exception of certain mortgage loans.
However, starting January 2017 the debt collectors need to be registered at the National Authority for
Consumer Protection and implicitly follow a given code of conduct.
Due to the high number of transactions, legal documentation and proceedings are largely
standardised, providing a rather transparent and reliable environment for investors.
In 2014 a new insolvency law came into effect assisting creditors in enhancing their recovery rates.
In 2016 Law no. 77/2016 on discharge of mortgage backed debts through transfer of title over immovable
property applicable to the retail sector has been implemented (“deed in lieu” legislation).
Starting 2018, tax deductibility of losses from sale of receivables will be limited to 30% (from current
100%), with potential impact on the economic viability of such disposals for sellers. NPL transfers are
generally not subject to VAT or stamp duty, but corporate income taxes may apply.
Servicing
Well-established servicing market, with several players having large-scale servicing capabilities for all
asset classes.
Locally known present names include subsidiaries of all major regional players such as APS, B2Holding,
EOS, Getback, Kredyt Inkaso, Kruk and others.
Selected transactions 2016 - 2017
Project name Seller Asset type GBV EURm Market year Status Buyer PwC role
Castrum - Retail Banca Transilvania NPL - Retail unsecured 110 2017 Late stage EOS n/a
Fain Raiffeisen NPL - Mixed 260 2017 Ongoing n/a Sell-side advisor
Mars Alpha Bank NPL - n/a 400 2017 Ongoing n/a Sell-side advisor
Blue Lake Erste NPL - Retail mortgage 410 2016 Closed B2Holding / EOS Sell-side advisor
n/a Piraeus NPL - Mixed 200 2016 Closed Kruk n/a
n/a CEC Bank NPL - Mixed 70 2016 Closed Kruk n/a
Iris Societe Generali NPL - Corporate secured 280 2016 Closed Kruk n/a
ROSE Top Factoring Platform & NPL portfolio n/a 2016 Closed Intrum Justitia Sell-side advisor
n/a Bancpost (Eurobank) Consumer 597 2016 Closed Kruk / IFC n/a
Source: IMF, Annual Reports 2015/2016, National Bank of Romania, PwC Analysis
PwC
26Serbia
2016 NPL%: 17.2% (∆yoy + 3.9pp), vol. EUR 2.8b (∆yoy - 0.7b)
GDP Inflation rate Unemployment rate Debt-to-GDP
3.5% 3.5% 2.6% 3.0% 3.0% 74%
2.8% 3.0% 73%
15.9% 16.0% 15.6% 70%
1.1% 15.3% 67%
'16 '17 '18 '19 '16 '17 '18 '19 '16 '17 '18 '19 '16 '17 '18 '19
NPL stock dispersed across the system, with top banks by volume making up ca. 40% at eoy 2016
Positive regulatory perspective – National Bank has commenced with the implementation of
introduced “Action plan for the Implementation of the NPL Resolution Strategy”.
Strong disposal wave observed over the past 18 months, triggered by growing investor
appetite and increasing NPL ratios.
NPL volume & ratio largest banks (eoy 2016, EURm)
Komercijalna Banka and Banka Intesa recorded
400 25%
largest NPL stock totalling ca. EUR 300m,
followed by Societe Generale (ca. EUR 260m)
300
15%
and UniCredit (ca. EUR 200m).
200
A number of M&A activities observed in the
market, expected (e.g. Allpha Bank) to lead to
5%
consolidation of the banking sector in the
100
country.
- (5%)
Relatively high NPL ratios and full
Komercijalna
banka (uncons.)
Banka Intesa Societe General
(uncons.)
Unicredit Raiffeisen implementation of Basel II standards expected
NPL volume NPL charts
to further incentivise banks to dispose of NPL
portfolios.
Legal & regulatory environment
A banking licence is (still) required for the acquisition of retail loan portfolios.
National Bank approval of the transaction is not required, however, the notarization of the transfer may be
needed if a claim is secured by a mortgage.
Law on the Real Estate Appraisers, regulating profession of real estate appraisers came into force in
January 2017. Additionally, the National Bank has published an official interpretation of the application of
banking secrecy rules with the aim to facilitate comprehensive due diligence for NPL sales.
The new Law on Consensual Financial Restructuring is applied from February 2016, intending to
improve legal framework for voluntary debt restructuring.
NPL buyer (still) cannot unconditionally takeover an ongoing dispute without the consent from
the counterparty.
NPL transfers are generally VAT exempt, providing that not only the risks and rewards of a receivable are
transferred, but also the actual title to the receivable.
Servicing
Fast development of servicing capabilities across all asset classes on a wave of conducted disposals
Known names with local capabilities include APS, AVS, B2Holding, Credit Express, EOS, etc.
Selected transactions 2016 - 2017
Project name Seller Asset type GBV EURm Market year Status Buyer PwC role
Pineta NLB NPL- Corporate, SME tbc 2017 Expected n/a Sell-side advisor
n/a Sberbank NPL - Corporate 45 2017 Ongoing n/a n/a
Onyx HETA NPL & Platform, Mixed 350 2016 Signed APS / Apollo / Balbec Sell-side advisor
n/a Intesa NPL - Corporate 150 2016 Closed Apartners n/a
Victor Piraeus NPL - Mixed 45 2016 Closed B2Holding Sell-side advisor
n/a Raiffeisen NPL - Single ticket 50 2016 Closed n/a n/a
Grey Erste NPL - Corporate 21 2015 Closed APS n/a
n/a Intesa NPL - CRE 35 2015 Closed n/a n/a
Source: IMF, Annual Reports 2015/2016, National Bank of Serbia, PwC Analysis
PwC
27You can also read