Waste Disposal Sites as All-You-Can Eat Buffets for Carrion Crows (Corvus corone) - MDPI
←
→
Page content transcription
If your browser does not render page correctly, please read the page content below
animals
Article
Waste Disposal Sites as All-You-Can Eat Buffets for
Carrion Crows (Corvus corone)
Doris Preininger 1 , Bjoern Schoas 2 , Diether Kramer 3 and Markus Boeckle 4,5, *
 1    Vienna Zoo, 1130 Vienna, Austria; d.preininger@zoovienna.at
 2    Department of Landscape, Spatial and Infrastructure Sciences, University of Natural Resources and Life
      Sciences, 1190 Vienna, Austria; bjoern.schoas@gmail.com
 3    Steiermärkische Krankenanstaltengesellschaft m. b. H., 8010 Graz, Austria; diether.kramer@gmx.net
 4    Department of Cognitive Biology, University of Vienna, 1090 Vienna, Austria
 5    Department of Psychology, University of Cambridge, CB2 3EB Cambridge, UK
 *    Correspondence: markus.boeckle@gmail.com

 Received: 14 March 2019; Accepted: 28 April 2019; Published: 4 May 2019

 Simple Summary: Several bird species like common ravens, carrion crows, hooded crows, and rooks
 are held responsible for damage to agricultural land and crops. Especially in urbanized areas, they
 are increasing in abundance and are considered nuisance animals. We estimated the population size
 of carrion crows over the course of one year in relation to waste and non-waste sites in the federal
 state Vorarlberg, Austria. The current study showed that several human-related food resources
 influence the abundance of crows. More crows were observed in survey areas of biogas production
 and green-waste sites compared to reference sites 3 km distant from waste sites. Continuous hunting
 activities over the past two decades have not reduced population size. We suggest that the sustainable
 long-term stabilization and reduction of generalist corvid species populations can only be achieved if
 anthropogenic food resources are limited.

 Abstract: In cities and densely populated areas, several corvid species are considered nuisance
 animals. In Austria, particularly carrion (Corvus corone) and hooded crows (C. cornix) are regarded
 as pests by the general public that frequently cause damage to crops, feed on human waste, and
 thus spread trash. We conducted a detailed one-year field survey to estimate the abundance of
 carrion crows in relation to potential anthropogenic food sources and reference sites in the Austrian
 Rhine valley. Our results demonstrated that the number and proximity of waste management
 facilities, animal feeding areas, and agricultural areas, and the productive capacity of agricultural
 areas, predominantly influenced habitat choice and abundance of carrion crows. In the current study,
 the probability of observing more than two carrion crows at a survey site decreased with increasing
 human population density. Moreover, the abundance of crows increased despite a continuous
 increase in crow hunting kills registered during the past 25 years. Our study suggests a regionally
 comprehensive waste management plan could serve as a promising strategy to manage nuisance
 birds. A reduction in anthropogenic food supply through improved waste management practices is
 required for long-term, sustainable management to limit the abundance of crow populations in and
 close to urban environments.

 Keywords: abundance; anthropogenic food; Corvus corone; crow; corvid; ecology; waste management

1. Introduction
     Several bird species adapted to human settlement have increased their abundance in urbanized
areas throughout the world. Many crows and ravens (corvids) are opportunistic foragers, generalists

Animals 2019, 9, 215; doi:10.3390/ani9050215                                      www.mdpi.com/journal/animals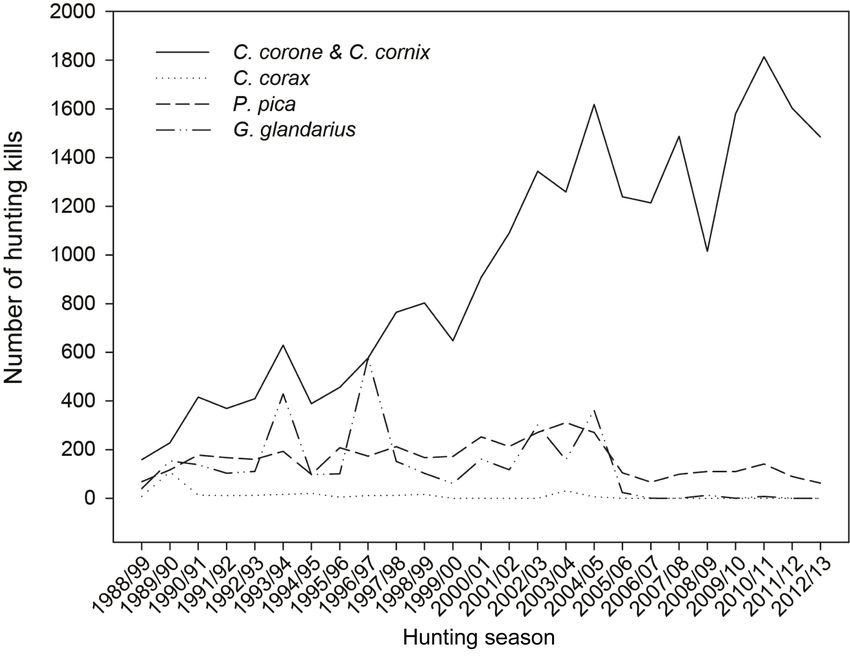
Animals 2019, 9, 215                                                                                 2 of 15

that successfully colonize urban habitats and congregate near human-related food sources. Corvids
benefit from the anthropogenic impact on the environment caused by urban development, and their
populations have increased in cities, suburbs, and agricultural areas worldwide [1–5]. Detailed studies
on American crows demonstrate that crow populations increase in areas with more anthropogenic
resources, reduce home range size, increase reproduction, and use less space for breeding in urban
areas [2,3,6,7]. Several corvid species are considered nuisances or pest animals, and are the focus of
agricultural, conservation, and legal control programs [8–11]. In particular, common ravens (Corvus
corax), carrion crows (C. corone), hooded crows (C. cornix), and rooks (C. frugilegus) are held responsible
for damage to agricultural property and crops, as they break open silage bales [12–14] and feed on
newly planted seeds in fields [12,15–17]. Members of the genus Corvus also successfully use waste
disposal sites as a reliable food source. An increased abundance of crows is often related to the
supplementary food supply [6,18–20]. Limiting the amount of, and accessibility to, available waste has
been suggested as an effective long-term method to reduce the population of common ravens [21].
Similar suggestions to reduce inadvertently provided food via garbage incineration and dumpster
covering have been proposed by the U.S. Fish and Wildlife Service [21,22]. However, regulations and
improvements of garbage and waste-disposal management can only take effect when implemented
over large geographical areas [21,23,24].
      In Austria, waste-disposal management underwent substantial changes due to both the
modifications of waste separation and residual waste treatment according to regulations of the
European Union and a federal law passed in 2004. The legally regulated threshold required the
mechanic, biological, and/or thermal treatment of residual waste instead of the mere disposal of waste.
Such treatment is not available in the Austrian federal state of Vorarlberg. Hence, the three main waste
disposal sites, which used to deposit garbage without treatment, could no longer be used as such.
Waste management in Vorarlberg now depends on the capacity of neighboring provinces or companies
in bordering Switzerland. Today, waste is collected and sorted at transfer stations in Vorarlberg and
successively relocated for processing. At the current transfer stations, less waste is generally available
for crows than in former disposal sites (Markus Boeckle, pers. obs.). However, it remains questionable
whether there is a decreased amount of waste available to corvids as a result of this change in waste
handling. Additionally, so-called green-waste areas were developed in every community in Vorarlberg
to mitigate the deposition of green waste in the countryside. Likewise, biogas production sites in
Vorarlberg, which are anaerobic digester facilities that treat farm waste, currently deposit agricultural
waste for a short period without covering the to-be-treated waste. All of the above-mentioned waste
management areas provide human-related food sources to crows and other corvid species, and thereby
might contribute to the increased occurrence and abundance of crows in the vicinity of waste facilities.
      In addition to changes in waste management regulations, hunting could potentially negatively
impact the abundance of corvid species in general and crows in particular in Vorarlberg. In Austria,
hunting is used as a control method to limit the population size of corvids. Since 2009, the European
parliament has prohibited the hunting of passerine bird species to conserve wild birds. However,
the 1979 adopted and 2009 amended European directive on the conservation of wild birds [16] grants
exemptions for carrion crows (C. corone), rooks (C. frugilegus), western jackdaws (C. monedula), Eurasian
jays (Garrulus glandarius), and Eurasian magpies (Pica pica) for several member states, including
Austria. In Austria, the game law is regulated by province (Länder) authority, and therefore different
regulations apply in different federal provinces. For example, the hunting regulations in the province
Burgenland stipulate year-round protection, while in Styria, the hunting of 13,300 hooded crows and
3700 carrion crows per year is allowed, and in Vorarlberg corvid species, among others, are excluded
from the conservation of wild living bird species [25]. Several studies, however, report a lack of
scientific evidence for a reduction of corvid populations as a result of hunting [26–28]. In several
cities, populations of carrion crows, hooded crows, and rooks might have increased due to the hunting
pressure they experience in the countryside [1,28,29].
Animals 2019, 9, 215                                                                                 3 of 15

      Crow breeding pairs, which mainly eat insects that provide sufficient protein for growing
juveniles [29], defend food sources and territories against other intruding birds. A reliable availability
of subsidized food can increase the breeding performance, including the survival rate of juveniles [1,2].
The size of non-breeder flocks, formed in several corvid species by juveniles and adults alike [30–33],
might increase with food availability in early life stage periods. Additionally, non-breeders often
inform each other about the location of food sources using food calls [1,14,34–36], and thus a large
number of individuals can be recruited to food sources [14,34,37–39]. The similar attraction of large
numbers of non-breeding individuals gathering at roosts and around substantial but ephemeral food
sources is reported for carrion crows [13,15]. It appears likely that subsidized anthropogenic food
sources, e.g., waste disposal sites, contribute to an increasing abundance of crows.
      The aim of this study was to investigate the effects of anthropogenic food sources on the abundance
of carrion crows. Surveys were conducted to examine the spatial relationship between crow abundance
and the location of biogas, green-waste sites, and transfer stations, as well as agricultural areas, animal
feeding areas, rivers, and the Lake Constance in the Vorarlberger Rhine Valley (federal state Vorarlberg,
Austria). Crow abundance and occurrence were recorded with regard to seasonal and daily temporal
differences. To evaluate the relationship and effectiveness of recent regulations potentially influencing
the population growth of crows, we compared hunting kills and population size reported for corvid
species from the past 20 years. We discuss the results of the occurrence and abundance of crows in
relation to their ecology and social behavior and in light of current waste-management.

2. Materials and Methods

2.1. Ethics Statement
     The study was approved by the regional environmental office of Vorarlberg. The survey was
performed without physical contact with the study animals and did not access privately owned or
protected land. The protocol for data collection adhered to the Animal Behavior Society guidelines,
and no permit was necessary for the described field observations.

2.2. Study Species and Site
      Carrion crows have a mean body length of 44–51 cm and wingspan of 84–100 cm; the body mass
of females and males ranges from 430 to 650 g [40]. They exhibit a completely black plumage and are
closely related to the partly gray hooded crow [41]. The hooded crow is considered a ‘semispecies’
of the carrion crow, as gene flow occurs, but a reduced fitness of hybrids has been reported [42].
In Middle and Southern Europe, C. corone breeds predominantly in cultivated, agricultural landscape,
along forest edges, in parks, and in marsh areas [17,41]. In the breeding period from March to July,
two to seven eggs are laid, and the hatching period lasts up to 22 days [41]. Juveniles are raised by
breeding pairs until the summer, and afterwards they are expelled from the natal territory and form
non-breeder flocks [41]. Crows are adaptable and opportunistic species, especially regarding their
food resources [41]. During winter, crows mostly feed on vegetables, whereas in the summer their diet
consists of insects, snails, earthworms, small mammals, bird eggs and fledglings, as well as garbage
from waste disposal sites [41,43].
      The study area is the Austrian Rhine Valley (Rheintal), located in the western part of Austria near
the border with Switzerland, 400–500 m above sea level (Figure 1). The area comprises the districts and
cities of Feldkirch (34,012 inhabitants), Dornbirn (49,620 inhabitants), and Bregenz (29,826 inhabitants),
with an overall estimated population of 395,012 people recorded in December 2018. The valley itself
is divided into the upper and the lower part (Oberes Rheintal Unteres Rheintal). The lower part is
situated next to the coast of Lake Constance; it comprises about 180,000 inhabitants and hosts about
half of the whole federal state of Vorarlberg. Although Vorarlberg is the second smallest state of Austria
and has the smallest population of all federal states, it has the second highest population density in the
country with 150 inhabitants/km2 . Most inhabitants live in small towns, which form a long continuous
Animals 2019, 8, x FOR PEER REVIEW 4 of 15
Animals 2019, 9, 215 4 of 15
population density in the country with 150 inhabitants/km2. Most inhabitants live in small towns,
which form a long continuous settlement structure including 29 single municipalities. Landscapes
settlement
between the structure including
conurbations 29 single
are often municipalities.
protected areas underLandscapes
agricultural between
use. Mainthe conurbations
forms are
of agriculture
often protected areas under agricultural use. Main forms of agriculture are meadow
are meadow orchards, pastures for animal husbandry and milk production, croplands for grain (e.g.,: orchards, pastures
for animal
Triticum husbandry
aestivum and
subsp. milk and
spelta) production,
rapeseedcroplands for grain
(Brassica napus), and(e.g.,:
wood Triticum aestivum
and forestry subsp. spelta)
industries. Lake
and rapeseed (Brassica napus), and wood and forestry industries. Lake Constance (47 ◦ 350 N, 9◦ 280 E)
Constance (47°35′ N, 9°28′ E) is the third largest lake in Europe, covering 571.5 km2, and is
is the third largest
approximately 395lake in Europe,
m above covering
sea level. The571.5 km2 , andcoastline
28 km-long is approximately
of Lake 395 m abovebelongs
Constance sea level.
to
The 28 km-long coastline of Lake Constance belongs to Vorarlberg, while
Vorarlberg, while the remaining coastline runs though Switzerland and Germany. One major the remaining coastline
runs though
highway runsSwitzerland
through theand Germany.
valley Onethree
connecting major highway
major cities runs
of thethrough
area andthethevalley connecting
coastline of Lake
three majorwith
Constance citiesthe
of the area and
Arlberg, the coastline
a mountain rangeof between
Lake Constance withand
Vorarlberg the Arlberg, a mountain
Tyrol. The range
Rhine Valley is
between Vorarlberg and Tyrol. The Rhine Valley is the warmest area of Vorarlberg
the warmest area of Vorarlberg with a yearly mean temperature between 8 and 9 °C and a yearly with a yearly mean
temperature between
rainfall of about and 9 ◦ C and a yearly rainfall of about 1100 mm.
1100 8mm.
Figure 1. Map of spatial factors that may influence the abundance of Corvus corone and C. cornix
Figure 1. Map of spatial factors that may influence the abundance of Corvus corone and C. cornix
Geographic data included in the full model for the study area are presented including survey areas,
Geographic data included in the full model for the study area are presented including survey areas,
waste disposal sites, animal feeding areas, protected areas, agricultural areas, forest areas, and rivers.
waste disposal sites, animal feeding areas, protected areas, agricultural areas, forest areas, and rivers.
Maps were provided by http://vogis.cnv.at (© Land Vorarlberg).
Maps were provided by http://vogis.cnv.at (© Land Vorarlberg).
2.3. Data Collection and Analysis
2.3. Data Collection and Analysis
We surveyed the population size of carrion crows for one week and repeated this survey five
timesWe surveyed
within the population
one year. We surveyed size
42of carrionwaste
selected crowsandfornon-waste
one week and
sitesrepeated
in week 30 this survey
(July) andfive
40
times within
(October) 2013one
andyear. We surveyed
in weeks 42 selected
5 (January), 19 (May),waste
and 33and non-waste
(August) 2014,sites in weekseasonal
to analyze 30 (July)patterns
and 40
(October)
of 2013 Survey
abundance. and in weeks 5 (January),
areas of waste sites 19included
(May), and 33 (August)
biogas 2014,
production to analyze
sites with (nseasonal patterns
= 10) or without
(n = 5) agriculture, green-waste sites (n = 14), wastewater treatment plants (n = 3), and transfer without
of abundance. Survey areas of waste sites included biogas production sites with (n = 10) or stations
(n =
(n = 5)
5).agriculture,
As points ofgreen-waste
reference insites (n = 14),related
non-waste wastewater treatment
sites, we selectedplants (n = 3),
reference and
sites at transfer stations
least 3 km from
known waste survey sites in the Rhine Valley. We visited the sites twice a week along a fixed route, from
(n = 5). As points of reference in non-waste related sites, we selected reference sites at least 3 km withAnimals 2019, 9, 215 5 of 15
the starting point switched between successive survey occasions. All event sampling was performed
for a period of five minutes at the survey sites. At every survey point within those five minutes, we
recorded every individual of Corvus corone and C. cornix seen with the unaided eye within a distance of
300 m. Additionally, we recorded every individual seen within 1 km while we were driving from one
site to the next in order to identify areas of high crow abundance other than the focal study sites.
We included information on distance to number of waste deposit sites (all existing deposit sites
within the study area) and animal feeding areas (locations with supplementary food supplies from
hunters for wild animals, e.g., deer (Cervus elaphus, Capreolus capreolus), pheasants (Phasianus colchicus))
as possible predictor variables in the analysis, as they are potential feeding areas for crows. Further
predictor variables were distance to rivers, agricultural areas, protected (conservation-based) areas,
and Lake Constance. These distances were included, as they potentially can influence habitat use by
crows; distance to Lake Constance is highly related to altitude in the valley. The habitat structure that
is close to Lake Constance shows more open areas in agricultural and protected wild life areas, while
the habitat progressively changes with increasing distance from the lake to smaller structured and
more mountainous habitats. Furthermore, especially in summer, higher temperatures could occur and
thus provide potentially better roosting sites. Additionally, we used the capacity value of farmland as
a predictor in the models, which was used as a proxy for the productive capacity of an agricultural
area—hence the crop yield and/or agricultural output (for the rest of the article abbreviated under
the term “capacity value”), which might directly relate to feeding opportunities. Capacity values are
evaluated according to economic factors under consideration of environmental influences on a scale
of 1–100. All spatial and geographical data used in this study are available from the land surveying
office of Vorarlberg VoGis [44]. For calculating geographical and spatial attributes of the survey points,
we used the software “R” (R Core Team) [45] and the packages “sp” (version 1.0-16) [46,47]), “rgdal“,
(version 0.9-1) [48], “rgeos“ (version 0.3-8) [18], and “geosphere“ (version 1.3-11) [49]. For calculating
spatial auto-correlation, we used the package “spdep” (version 1.1-2) [50]. We calculated Moran’s I
as a measure of spatial autocorrelation [51] using the package “ape” (version 5.3) [52]. All available
shapefiles were converted to the geodetic reference system WGS 84 to build a uniform and standardized
analysis basis. The measured data that were assigned to spatial and geographic characteristics and/or
distances to geographic elements (e.g., waste related sites, coast of Lake Constance) were calculated.
As maximum distance to the next location we estimated 2.5 km, as this will provide distances for all
analyzed and calculated variables. The full model included the predictor variables: capacity value,
number of waste sites and animal feeding sites within 2.5 km, distance to animal feeding areas and to
Lake Constance, daytime (transformed in decimal minutes) and season (winter, spring, summer, and
fall), as well as the variable accounting for spatial auto-correlation. We excluded any predictor with a
variance inflation factor above 4 in the full model. We specifically excluded human population density,
as it showed a high inverse relationship with agricultural usage as measured by capacity value as well
as distance to nearest agricultural area as it showed a high relationship with capacity value. In all
models, we specified Poisson distribution for the error structure and excluded all interactions between
predictor variables. We computed all models using the “R” package “MuMIn” (version 1.15.6) [53] as
well as “lme4” (version 1.1-21) [54]. Variance inflation factor was calculated using the package “car”
(version 3.0-2) [55]. We selected the best model based on Akaike’s Information Criterion corrected
for low sample size (AICc) as the model with the lowest AICc value [56]. We calculated all possible
models and ranked them according to delta AICc. We selected the models for which AICc delta was
below 6, and calculated model-averaged parameter estimates, ranking them based on how frequently
they occured in the previously selected models with delta AICc below 6 [56]. We used Bonferroni
correction for multiple comparisons in all models except in the previously described averaged model.
To test the hypothesis that abundance (number of individuals) of crows is increased in areas of
biogas, green-waste sites, and transfer stations, we compared 866 GPS logged observations using a
Generalized Linear Model (GLM) in Model 1. The number of individuals observed was entered as aAnimals 2019, 9, 215 6 of 15
dependent variable, with the data on the survey points as predictor variables and the identity number
of the survey points as random factor to account for repeated measurements.
In Model 2, a Generalized Linear Mixed Model (GLMM) was performed to analyze if the
abundance of crows showed differences based on differences between survey point, daytime, or season
at the 42 survey points. The number of individuals observed was entered as dependent variables, with
survey point, daytime, and season as predictor variables and the identity number of the survey points
as random factor to account for repeated measurements.
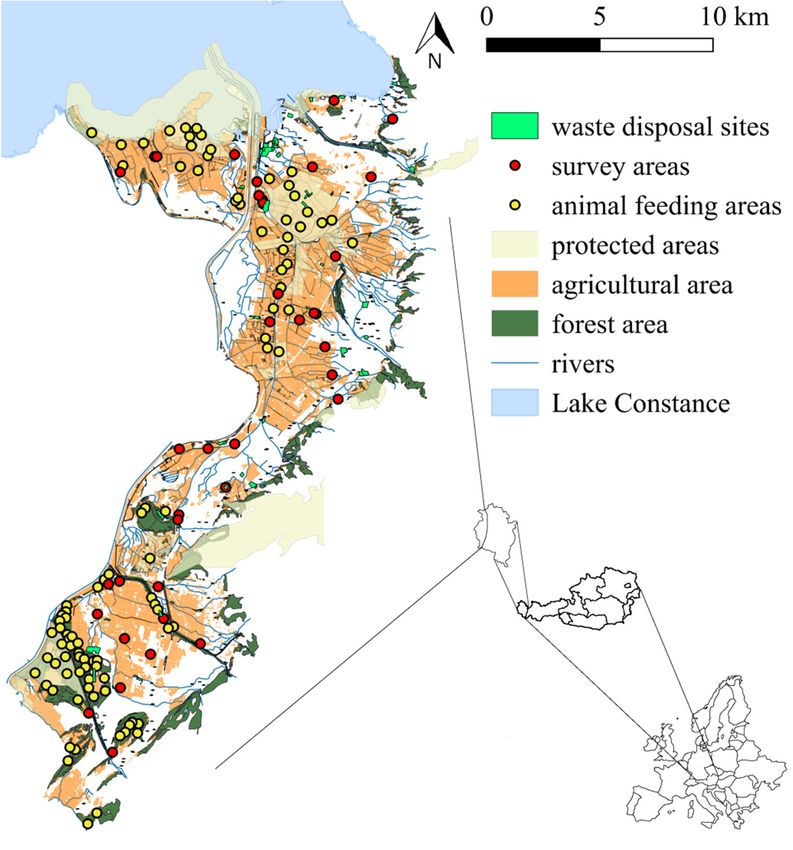
The impact of hunting on the abundance of C. corone, C. cornix, P. pica, and G. glandarius was
documented by comparing the hunting kills from official records for annual hunting seasons in
Vorarlberg (http://www.vorarlberg.at/pdf/wildabschussentwicklungab.pdf) with the counts of the
respective species from the Bodensee–Brutvogelatlas 2000 [57]. We calculated the percentage of increase
or decrease in the number of individuals per species occurring in Vorarlberg reported over a period of
20 years.
Data points were logged with the program GPS Tours on iPhone 4S and the parameters date,
taxon, time, GPS coordinate, location, accuracy, and individual number. The resulting data were
analyzed with the software “R” (R 3.0.2 GUI 1.62 Snow Leopard build (6558)) and IBM SPSS 19 (IBM,
Armonk, NY, USA) for generalized linear mixed models (GLMM) of geographic data.
3. Results
During the survey, we recorded 8323 individuals of Corvus corone and C. cornix at 866 survey
points. No crows were observed at 67 survey points. The best model explaining the abundance of
crows (C. corone and C. cornix) included capacity value, distance to the nearest waste disposal site,
the number of waste disposal sites within 2.5 km, distance to animal feeding areas, the number of
animal feeding areas within 2.5 km, distance to the nearest agricultural area, river, Lake Constance,
and protected area, and excluded the distance to the nearest animal feeding area, daytime, and season
(Table 1).
Table 1. Models with delta AICc below 6.
Model Intercept Predictors df logLik AICc delta weight
220 1944 1/ 4/ 6/ 7/ 8/ 9 −9875.68 19,769.60 0.00 0.43
224 1878 1/ 3/ 4/ 6/ 7/ 8/ 10 −9875.17 19,770.60 1.03 0.26
252 1949 1/ 4/ 5/ 6/ 7/ 8/ 10 −9875.42 19,771.10 1.54 0.20
256 1886 1/ 2/ 3/ 4/ 5/ 6/ 7/ 8/ 11 −9874.97 19,772.20 2.68 0.11
Term Codes: 1: capacity value; 2: season; 3: daytime; 4: distance to nearest animal feeding area; 5: distance to Lake
Constance; 6: number of waste disposal sites within 2.5 km; 7: number of animal feeding areas within 2.5 km; and 8:
auto-covariation. Model 256 represents the full model. df: degrees of freedom; LogLik: logistical likelihood; AICc:
corrected Akaike Information Criterion; delta: difference of AICc between the models; weight: model weight.
In the averaged model, on average two crows were observed (y-intercept = 1.92; GLM: z863 = 27.5;
see Table 2). In agricultural areas with high capacity value, an increased abundance of crows was
observed (GLM: z863 = 46.7; see Table 2). Decreasing number of waste sites within 2.5 km was correlated
with crow abundance (GLM: z863 = −14.2; see Table 2). Similarly, decreasing distance to animal feeding
areas (GLM: z863 = −4.7; see Table 2) increased the abundance of crows, and the number of animal
feeding areas predicted higher abundance (GLM: z863 = 11.0; see Table 2). No significant influence
of the distance to Lake Constance (GLM: z863 = −0.3; see Table 2) and daytime (GLM: z863 = 0.5;
see Table 2) was found. Fall (GLM: z863 = 8.9; see Table 2) and spring (GLM: z863 = 19.1; see Table 2)
showed lower abundances of crows than summer, while winter had a higher abundance of crows than
summer (GLM: z863 = 8.3; see Table 2). For detailed results, see Table 2.Animals 2019, 9, 215 7 of 15
Table 2. Summary results of crow abundance after model averaging: effects of each parameter on
crow abundance.
Parameter Estimate Unconditional SE CI Relative Importance
(Intercept) 1.921 0.070 (1.784, 2.05)
Capacity value 0.001 0.000 (0.00081, 0.00089) 1.00
Season 2 * −0.279 0.031 (−0.340, −0.218) 1.00
Season 3 0.229 0.027 (0.175, 0.283) 1.00
Season 4 −0.680 0.035 (−0.750, −0.611) 1.00
Distance to feeding area 0.00004 0.000 (0.000024, 0.000059) 1.0
Auto-covariation 0.006 0.002 (0.0020, 0.0094) 1.0
Number or waste disposal sites −0.011 0.001 (−0.0125, −0.0095) 1.0
Number of animal feeding sites 0.021 0.002 (0.018, 0.025) 1.0
Daytime 0.00003 0.000 (−0.000088, 0.000268) 0.37
Distance to lake of Constance −0.0000003 0.000 (−0.0000034, 0.0000017) 0.31
* Season 1 was the reference category; summer = 1, fall = 2, winter = 3, and spring = 4.
In Model 2, the abundance of crows in areas of biogas-, green-waste sites, and transfer stations
differed significantly from reference sites (GLMM: F42,301 = 5.499; p > 0.001). We found an increased
abundance (estimated mean > 10) of individuals of C. corone and C. cornix at seven waste related sites
(Table 3).
Table 3. Survey sites with high abundance of crows in the Vorarlberger Rhine Valley, Austria. All survey
points where the mean number of crows observed (Corvus corone and C. cornix) exceeded 10 are listed.
Values represent estimates from generalized linear model analysis.
Number of Crows/Site
Survey Point Number/Description
Mean SE Minimum Maximum
ID4/Biogas 19.0 6.7 9.5 37.9
ID9/Biogas 88.2 27.6 47.7 163.2
ID11/Biogas 14.1 5.4 6.6 29.9
ID26/Biogas 56.3 15.0 33.3 95.1
ID27/Transfer station 46.6 16.0 23.7 91.5
ID29/Green waste 16.8 5.4 9.0 31.5
ID32/Biogas 15.4 5.3 7.8 30.5
Crow abundance did not differ in daytime in Model 2 (GLMM: F1, 337 = 9.639; p < 0.05). Seasonal
differences in the abundance of C. corone and C. cornix were recorded (GLMM: F3, 301 = 1.245; p = 0.265)
at the survey points (Figure 2). Abundance was higher in winter compared to spring (GLMM: pair-wise
comparison, ß = 1.064; SE = 0.206; t = 5.156, p = 0.006), summer (GLMM: pair-wise comparison,
ß = 0.787; SE = 0.224; t = 3.505; p = 0.006), and fall (GLMM: pair-wise comparison, ß = 0.652; SE = 0.235;
t = 2.772; p = 0.04). In fall, tendentiously fewer individuals were observed at survey points compared
to summer (GLMM: pair-wise comparison, ß = −0.413; SE = 0.167; t = −2.476; p = 0.084), while no
difference in crow abundance was recorded between summer and fall (GLMM: pair-wise comparison,
ß = −0.135; SE = 0.186; t = −0.729; p = 1) as well as spring and summer (GLMM: pair-wise comparison,
ß = −0.277; SE = 0.139; t = −1.995; p = 0.282) (Figure 2).Animals 2019, 9, 215 8 of 15
Animals 2019, 8, x FOR PEER REVIEW 8 of 15
Animals 2019, 8, x FOR PEER REVIEW 8 of 15
Figure
Figure 2.2.Estimated
Figure2. Estimatedmean
Estimated meannumber
mean number (±SE)
number (±SE) of
(±SE) Corvus
of Corvus corone
Corvuscorone and
coroneand C.
andC. cornix
C.cornix observed
observedinin
cornixobserved four
infour
four seasons
inin
seasons
seasons in the
thethe
federal
federalstate
federalstate of
stateof Vorarlberg,
of Vorarlberg,Austria.
Vorarlberg, Austria.
Austria.
Crow
Crowhunting
Crow huntingkills
hunting increased
kills
kills increased
increasedduring thethe
during
during lastlast
the 25 25
last years (Figure
25 years
years 3). In
(Figure
(Figure 3).the
3). years
InInthe 19881988
theyears
years to 1990,
1988 2.6
toto1990,times
1990,2.62.6
(161%)
times more
(161%) crow
morehunting
crow kills
hunting were registered.
kills were registered.
times (161%) more crow hunting kills were registered.
Figure3.3.Hunting
Figure Hunting kills
kills of
of corvid
corvid species
species (Corvus corone, C.
(Corvus corone, C. cornix,
cornix, C.
C. corax,
corax,Pica
Picapica,
pica,and Garrulus
andGarrulus
Figure 3. Hunting
glandarius) during
glandarius) kills
duringthe
the of corvid
annual
annual species
hunting
hunting (Corvus
seasons
seasons fromcorone,
from 1988 toC. cornix,
2013 C. corax, Pica
in Vorarlberg,
in Vorarlberg, pica, and Garrulus
Austria.
Austria.
glandarius) during the annual hunting seasons from 1988 to 2013 in Vorarlberg, Austria.Animals 2019, 9, 215 9 of 15
Animals 2019, 8, x FOR PEER REVIEW 9 of 15
The decennial development
The decennial development from from 1990
1990to
to2000
2000demonstrated
demonstrateda afurther
furtherincrease
increaseofof118%
118%and
anda
arising
rising trend in the following years [57]. The population size in the years 1980–1982, 1990–1992,
trend in the following years [57]. The population size in the years 1980–1982, 1990–1992, and
and 2000–2002 denoted
2000–2002 denoted an increase
an increase in thein number
the number of individuals
of individuals (Figure
(Figure 4). 4).
Figure 4.
4. Changes
Changes ininpopulation
populationsizes
sizesofofcorvid
corvid species
species (Corvus
(Corvus corone,
corone, C. cornix,
C. cornix, C. corax,
C. corax, Pica Pica
pica, pica,
and
and Garrulus
Garrulus glandarius).
glandarius). Census
Census resultsresults
from the from
yearsthe years 1980–1981,
1980–1981, 1990–1992,1990–1992, and 2000–2002.
and 2000–2002. Graphical
Graphical representations
representations developed
developed from data offrom data of the “Brutvogelatlas”
the “Brutvogelatlas” [57]. Data are[57].
not Data are notdescribed
necessarily necessarily
by
described
linear by linear
increase increase
but are but are
presented presented
as lines as lines
in order in order
to enhance to enhance
their visibility.their visibility.
In 2000, the
the carrion
carrioncrow
crowpopulation
populationwaswas1.6
1.6times
timeshigher
higherthan
thaninin1980, with
1980, anan
with increase of of
increase 36% in
36%
the first decade and further 17% in the second decade. Carrion crows increased
in the first decade and further 17% in the second decade. Carrion crows increased from 2784 from 2784 individuals
in 1980 to 3796
individuals individuals
in 1980 in the year 1990
to 3796 individuals and
in the up1990
year to 4456
andinup2000–2002
to 4456 in[57]. Population
2000–2002 changes of
[57]. Population
carrion crows in Austria between 1998 and 2016 report a stable long-term trend without
changes of carrion crows in Austria between 1998 and 2016 report a stable long-term trend without statistically
significant
statisticallyvariation [58].
significant variation [58].
4. Discussion
4. Discussion
The
The number
number of of recorded
recorded crows
crows increased closer to
increased closer to animal
animal feeding
feeding areas
areas and
and Lake
Lake Constance.
Constance.
Similarly,
Similarly, higher
higher crow
crow abundance
abundance was was found
found in in areas
areas with
with higher
higher agricultural
agricultural capacity
capacity values
values and
and
more
more waste- and animal feeding sites. Our findings demonstrate that the abundance increased
waste- and animal feeding sites. Our findings demonstrate that the abundance of crows of crows
in developed
increased areas with areas
in developed anthropogenic food sources.
with anthropogenic foodAlthough
sources. the best model
Although maymodel
the best not predict the
may not
absolute number
predict the of crows,
absolute number it clearly
of crows,exhibited
it clearlytheexhibited
relative importance
the relativeofimportance
anthropogenic food sources.
of anthropogenic
Crow abundance was particularly high in areas with supplementary
food sources. Crow abundance was particularly high in areas with supplementary or easily or easily accessible food sources
accessible
in or close to human settlements.
food sources in or close to human settlements.
Our
Our findings
findings agreeagreewith
withthose
thoseofofother
otherstudies
studiesreporting
reportinglocal
localincreases
increases inin
crow population
crow population size in
size
areas with frequent human activity, food sources, water, and nest site availability,
in areas with frequent human activity, food sources, water, and nest site availability, e.g., in common e.g., in common
ravens
ravens [21,24].
[21,24]. A A spatial
spatial correlation
correlation between
between the the abundance
abundance of of corvid
corvid species
species and
and waste
waste disposal
disposal sites
sites
has also been observed in other provinces of Austria [59]. In the capital Vienna,
has also been observed in other provinces of Austria [59]. In the capital Vienna, the number of the number of wintering
rooks counted
wintering rooksatcounted
roostingatsites increased
roosting sites by more than
increased 50% from
by more than 1992/93
50% from to 1994/95. A large-scale
1992/93 to 1994/95. A
large-scale waste disposal site provided food for the most dense roosting site that contained
approximately 100,000 rooks [60]. In a further census of rook’s wintering grounds in 1997, 188,719Animals 2019, 9, 215 10 of 15
waste disposal site provided food for the most dense roosting site that contained approximately
100,000 rooks [60]. In a further census of rook’s wintering grounds in 1997, 188,719 individuals were
counted, representing a doubling of the population size within 10 years [61]. Nevertheless, increases
in overwintering populations in cities might result from immigration of birds from more northern and
eastern populations (Poland, Finland, Belarus, etc.). Thus, the increase in the number of wintering
birds is likely to be related to high productivity during the breeding season in more northern and
eastern areas.
The higher abundance of crows close to waste management areas was confirmed in our comparison
of waste and non-waste survey points. The seven areas with the highest numbers of crows were in
locations of biogas sites, green-waste disposal sites, and transfer stations with uncovered waste that
provided a permanent food supply to birds. Predicted abundances from the model with geographical
data showed increased abundance of crows when more waste sites are within 2.5 km. This effect might
be underestimated because of the inclusion of various waste disposal sites, including disposal sites
with no potential food items. The comparison of waste and non-waste sites, however, included only
food-related deposit sites and thereby demonstrated that the accessibility of waste in urban areas was
directly linked to a higher abundance of crows when comparing waste to non-waste survey points.
Our results correspond to recent findings in non-breeders of common ravens deployed with GPS
loggers. Analysis of spatial and temporal GPS data showed that ravens spend 75% of the time in close
vicinity to anthropogenic food sources [62]. As generalist omnivore, dietary shifts or the exploitation
of available food sources can occur rapidly due to the adaptability of corvids to novel resources [2,63].
Waste management changes from former waste disposal sites to transfer stations in Vorarlberg,
according regulations of the European Union, were developed to process garbage economically and
ecologically and to prohibit pollution of soil and rivers. The alterations in waste handling did not
target the management of anthropogenic food sources for birds or other animals. The transformation
from waste disposal to transfer stations did seemingly not influence the abundance of carrion crows
in the area. Although the amount of accessible waste at transfer stations is less than at former waste
disposal sites (MB, pers. obs.), waste, or rather food, remains available for crows, uncovered and
thereby easily accessible. Comprehensive, city-wide waste management in Berlin and the closure of
the last disposal area in 2005 resulted in a distinct reduction of rooks, hooded crows, and Western
jackdaws (C. monedula) [64]. Waste management in Berlin has set an example of how an area can
prohibit the incentive of additional food resources for corvid species. The implementation of only
closed waste treatment facilities reduced the native breeding population of C. corone and the migration
of C. frugilegus [64].
An increased crow abundance was also related to higher capacity value of agricultural land
(e.g., higher production of crops), as well as distance to, and number of, agricultural areas. Since human
population density is inversely related to agriculture land use, this result demonstrated that increased
crow abundance is not restricted to human areas and several anthropogenic food sources facilitate
colonization. The majority of protected areas in the Vorarlberger Rhine valley were established to
protect the biodiversity of the respective region. Nevertheless, these areas are often used intensively
for agriculture, with sufficiently high capacity values or crop production; similarly to areas where
animal feeding takes place, these locations provide accessible food sources for crows.
Crow abundance did not increase in the proximity to Lake Constance. The Vorarlberger Rhine
Valley is a plain located at low altitude surrounded by high mountains. Hence, our results do not
predict that crows are observed at higher abundance in the vicinity of Lake Constance. Still, carrion
crows prefer areas up to 1500 m above sea level [65]. The possible influence of low altitude water bodies
and surrounding mountains on the abundance of carrion crows suggests that habitat composition can
act as a restricting factor for habitat use. This effect, however, was not further investigated in this study,
as no observations were made along a wide range of elevations.
On average, two crows could be observed at each observation point in the area of the Vorarlberger
Rhine Valley. This observation corresponds to the social structure of territorial corvid species, whichAnimals 2019, 9, 215 11 of 15
occupy territories in pairs [41,43,66]. Seasonal abundance differences were consistent with the behavior
of territorial crows. In winter, defense of territorial boundaries by carrion crows is diminished or
absent [41,43] thereby allowing a higher abundance of crows [67]. We hypothesize that areas defended
by territorial pairs are mainly used by two individuals, while areas that are not defended by a territorial
pair are potentially overtaken by a larger number of non-breeding individuals, as suggested by data
on ravens [29,68]. Non-breeding flocks form during the winter period, but the individual density is
limited by the abundance of food sources [69] unless accessory food or foraging sites are available.
Additionally, an increase in the number of individuals within non-breeder flocks might be based on
migratory birds joining juvenile and subadult non-breeder flocks (also see [67]). Territories are formed
in early spring before the breeding period [41,43,66,69], and crows are less dependent on additional
anthropogenic food sources [3], which corresponds to the seasonal observations in our study that
showed a decreased abundance during spring. The availability of natural food is presumably higher
during this period and not restricted to anthropogenic food sources.
The comparison of population growth and hunting efforts suggests that continuous hunting
activities over the past two decades have not achieved the expected reduction in population size of
C. corone and C. cornix. Although population increase might have been slowed as a result, hunting
of corvids has been questioned as ineffective and not sustainable [29]. Monitoring of the correct use
of granted derogations in order to control corvid populations was advised [70]. The infectivity of a
population decrease by hunting might be based on either (i) a high rate of population increase (possibly
based on surplus of food availability), which is only slightly curbed by hunting; (ii) most hunting
occurring in winter, when many non-resident birds are present, thereby having little impact on the
resident local population; or (iii) population growth also resulting from the predominant hunting-kills
of territorial breeding pairs. Breeding pairs can be detected in particular territories and thus are
more easily located. Similar to common ravens, crows occupy large areas and defend their territory
together against competing non-breeding opponents [66], thereby displaying intraspecific spatial
avoidance [68,71]. However, if a pair-partner is killed the other partner also leaves the territory [72].
We presume that consequently these territories will be colonized by a larger number of non-breeders,
as observed also in common ravens [29]. We suggest the hunting of territorial pairs in addition to
anthropogenic food sources promotes the population increase of crows [29]. Accordingly, we assume
that due to the abundance of fewer breeding pairs, intraspecific competition for territories and food is
reduced. Thus, fewer breeding pairs are able to successfully breed or use more nesting attempts during
one year due to subsidized food and additional resources, which in turn can increase the survival
rate of juveniles [17,69,73,74]. This leads to a possible increase of number of individuals within the
non-breeder flock. Furthermore, large areas without suitable habitat (e.g., agricultural land), as found
in our survey areas, offer little or no nesting sites, additionally constrain territorial breeding pairs,
and may increase the number of individuals in non-breeder flocks [20,69]. We suggest the constant
population growth originates from the vast anthropogenic food resources, and a sustainable effect of
hunting remains questionable even in seasons of high hunting returns [73].
Admittedly, the interpretation of our data is limited as our corvid census data collection took place
over a single year and research detailing movement and dispersal patterns are needed. The size of
the population under investigation might also change across years according to weather fluctuations,
agricultural production, etc. The found characteristics might be specific to the observed time period;
however, urbanization of highly adaptive corvids is a global phenomenon. Several corvids utilize large
home ranges, including a variety of habitats as well as diverse food resources [60,75,76]. We suggest
that relatively simple waste control measures could decrease food sources and provide an un-invasive
method to limit corvid abundance in urban areas. We assume equal detectability between sites
and types of sites, which might influence the recorded data and our results but was used as an
approximation. Although the measuring points along a fixed route were travelled several times, each
observation was tracked exactly with a GPS. That is to say, there are single points in their proximity we
surveyed several times. However, there are also numerous points at which only one survey has beenAnimals 2019, 9, 215 12 of 15
carried out. Therefore, we have not used a repeated measurements account with potential influences
on the calculation of variance.
5. Conclusions
While most observations focus on the abundance of corvids in cities, the current study showed
that human activity and anthropogenic food sources influence the abundance of crows. Agricultural
areas; their capacity value; uncovered waste sites; and animal feeding areas, in particular, increase
the abundance of crows. Even increased hunting efforts have seemingly had no influence on crow
population size in recent years [70]. Following the results of the current and previous studies, we
suggest that the sustainable long-term reduction of generalist bird species like Corvus corone and
C. cornix can only be achieved if anthropogenic food sources are limited [64,77]. The current study
analyzed for the first time the relationship between anthropogenic food availability and the abundance
of crows in Vorarlberg and provides a foundation for management recommendations. Continued
studies and surveys would help to identify factors influencing the long-term pattern of population
change, as well as effective strategies to reduce crow abundance in human settlements.
Author Contributions: Conceptualization, M.B.; methodology and data collection, M.B. and B.S.; formal analysis,
M.B. and D.K.; investigation, M.B.; writing—original draft preparation, D.P. and M.B.; writing—review and
editing, D.P. and M.B.; visualization, M.B.; project administration, M.B.; funding acquisition, M.B.
Funding: This research was funded by Inatura—Naturschau Dornbirn GmbH with the follwing project “name
“Populationsrelevante Einflüsse von Biogas-, Grünmüllanlagen und ehemaligen Deponien auf die Corvidenfauna
im Vorarlberger Rheintal: historische und rezente Entwicklungen” and was granted to Markus Boeckle.
Acknowledgments: We thank R. Swoboda, C. Tschisner, G. Friebe, and the Inatura—Naturschau Dornbirn GmbH
for the support of the project. We thank BirdLife Vorarlberg, specifically H. Salzgeber, for the assistance in data
collection and the colleagues of the ground-breeding bird project for their collaboration and critical comments.
We thank VoGis for the usage of maps downloaded at http://vogis.cnv.at (© Land Vorarlberg) and three anonymous
reviewers for very helpful comments on the manuscript.
Conflicts of Interest: The authors declare no conflict of interest.
References
1. Kövér, L.; Gyüre, P.; Balogh, P.; Huettmann, F.; Lengyel, S.; Juhász, L. Recent colonization and nest site
selection of the Hooded Crow (Corvus corone cornix L.) in an urban environment. Landsc. Urban Plan. 2015,
133, 78–86. [CrossRef]
2. Marzluff, J.M.; Neatherlin, E. Corvid response to human settlements and campgrounds: Causes, consequences,
and challenges for conservation. Biol. Conserv. 2006, 130, 301–314. [CrossRef]
3. Marzluff, J.M.; McGowan, K.J.; Donnelly, R.; Knight, R.L. Causes and consequences of expanding American
Crow populations. In Avian Ecology and Conservation in an Urbanizing World; Springer: Berlin, Germany, 2001;
pp. 331–363.
4. Kristan, W.B., III; Boarman, W.I.; Crayon, J.J. Diet composition of common ravens across the urban-wildland
interface of the West Mojave Desert. Wildl. Soc. Bull. 2004, 32, 244–253. [CrossRef]
5. Tratalos, J.; Fuller, R.A.; Evans, K.L.; Davies, R.G.; Newson, S.E.; Greenwood, J.J.; Gaston, K.J. Bird densities
are associated with household densities. Glob. Chang. Biol. 2007, 13, 1685–1695. [CrossRef]
6. Withey, J.C.; Marzluff, J.M. Multi-scale use of lands providing anthropogenic resources by American Crows
in an urbanizing landscape. Landsc. Ecol. 2009, 24, 281. [CrossRef]
7. Withey, J.C.; Marzluff, J.M.; Brittingham, M. Dispersal by juvenile American crows (Corvus brachyrhynchos)
influences population dynamics across a gradient of urbanization. Auk 2005, 122, 205–221. [CrossRef]
8. Marzluff, J.M.; Withey, J.C.; Whittaker, K.A.; David Oleyar, M.; Unfried, T.M.; Rullman, S.; DeLap, J.
Consequences of habitat utilization by nest predators and breeding songbirds across multiple scales in an
urbanizing landscape. Condor 2007, 109, 516–534. [CrossRef]
9. Helb, H. Wissenschaftliche Begleituntersuchung an Elster (Pica pica) und Rabenkrähe (Corvus c. corone) in
Rheinland-Pfalz. Pollichia 1999, 15, 6–10.Animals 2019, 9, 215 13 of 15
10. Ramseier, H.; Vonlanthen-Rentsch, I. Krähenschäden im Kanton Bern. 2006. Available online:
https://www.vol.be.ch/vol/de/index/landwirtschaft/landwirtschaft/publikationen.assetref/dam/documents/
VOL/LANAT/de/Landwirtschaft/PUB_LANAT_LW_Kraehenschaeden_de.pdf (accessed on 30 April 2019).
11. Bugnyar, T.; Kotrschal, K. Movement coordination and signalling in ravens (Corvus corax): An experimental
field study. Acta Ethol. 2001, 3, 101–109. [CrossRef]
12. Wright, J.; Stone, R.E.; Brown, N. Communal roosts as structured information centres in the raven, Corvus corax.
J. Anim. Ecol. 2003, 72, 1003–1014. [CrossRef]
13. Sonerud, G.; Hansen, H.; Smedshaug, C. Individual roosting strategies in a flock-living bird: Movement and
social cohesion of hooded crows (Corvus corone cornix) from pre-roost gatherings to roost sites. Behav. Ecol.
Sociobiol. 2002, 51, 309–318. [CrossRef]
14. Boeckle, M.; Szipl, G.; Bugnyar, T. Who wants food? Individual characteristics in raven yells. Anim. Behav.
2012, 84, 1123–1130. [CrossRef]
15. Sonerud, G.A.; Smedshaug, C.A.; Bråthen, Ø. Ignorant hooded crows follow knowledgeable roost-mates to
food: Support for the information centre hypothesis. Proc. R. Soc. Lond. Ser. B Biol. Sci. 2001, 268, 827–831.
[CrossRef]
16. JNCC. Directive 2009/147/EC on the Conservation of Wild Birds (Codified Version). Available online:
http://jncc.defra.gov.uk/page-1373 (accessed on 28 February 2019).
17. Zduniak, P.; Kuczyński, L. Breeding biology of the hooded crow Corvus corone cornix in Warta River Valley
(W Poland). Acta Ornithol. 2003, 38, 143–150. [CrossRef]
18. Bivand, R.; Rundel, C. Rgeos: Interface to Geometry Engine-Open Source (GEOS). R Package ver. 0.3–3. 2013.
Available online: https://rdrr.io/cran/rgeos/ (accessed on 1 March 2019).
19. Vuorisalo, T.; Andersson, H.; Hugg, T.; Lahtinen, R.; Laaksonen, H.; Lehikoinen, E. Urban development from
an avian perspective: Causes of hooded crow (Corvus corone cornix) urbanisation in two Finnish cities.
Landsc. Urban Plan. 2003, 62, 69–87. [CrossRef]
20. Charles, J.K. Territorial Behavior and the Limitation of Population Size in Crows Corvus Corone and Corvus
Cornix. Ph.D. Thesis, University of Aberdeen, Aberdeen, Scotland, 1972.
21. Bui, T.V.D.; Marzluff, J.M.; Bedrosian, B. Common raven activity in relation to land use in western wyoming:
Implications for greater sage-grouse reproductive success. Condor 2010, 112, 65–78. [CrossRef]
22. Service, U.S. Human Influences on Predators of Nesting Birds on the North Slope of Alaska; Fish and Wildlife
Service: Fairbanks, AK, USA, 2003.
23. Boarman, W.I. Managing a subsidized predator population: Reducing common raven predation on desert
tortoises. Environ. Manag. 2003, 32, 205–217. [CrossRef]
24. Boarman, W.I.; Patten, M.A.; Camp, R.J.; Collis, S.J. Ecology of a population of subsidized predators: Common
ravens in the central Mojave Desert, California. J. Arid Environ. 2006, 67, 248–261. [CrossRef]
25. Jagdverordnung. In LGBl. Nr. 24/1995 10. Stück. Available online: http://www.ris.bka.gv.at/ (accessed on
1 March 2019).
26. Crook, J.H.; Ward, P. The Quelea Problem in Africa. In The Problems of Birds as Pests (Proceedings of a Symposium
Held at the Royal Geographical Society London); Murton, R.K., Wright, E.N., Eds.; Academic Press: London, UK;
New York, NY, USA, 1968.
27. Feare, C.J. Ecological studies of the rook (Corvus frugilegus L.) in north-east scotland. Damage and its control.
J. Appl. Ecol. 1974, 11, 897–914. [CrossRef]
28. Bomford, M. Review of Research on Control of Bird Pests in Australia; University of Nebraska-Lincoln: Lincoln,
NE, USA, 1992; pp. 93–96.
29. Reichholf, J.H. Rabenschwarze Intelligenz: Was wir von Krähen Lernen können; Piper Verlag GmbH: München,
Germany, 2011.
30. Baglione, V.; Marcos, J.M.; Canestrari, D. Cooperatively breeding groups of carrion crow (Corvus corone
corone) in northern Spain. Auk 2002, 119, 790–799.
31. Bedrosian, B. Nesting and post-fledging ecology of the common raven in Grand Teton National Park,
Wyoming. Master’s Thesis, Arkansas State University, Arkansas, AR, USA, 2005.
32. Braun, A.; Walsdorff, T.; Fraser, O.N.; Bugnyar, T. Socialized sub-groups in a temporary stable Raven flock?
J. Ornithol. 2012, 153, 97–104. [CrossRef] [PubMed]
33. Heinrich, B.; Kaye, D.; Knight, T.; Schaumburg, K. Dispersal and association among common ravens. Condor
1994, 96, 545–551. [CrossRef]Animals 2019, 9, 215 14 of 15
34. Heinrich, B.; Marzluff, J.; Marzluff, C. Common ravens are attracted by appeasement calls of food discoverers
when attacked. Auk 1993, 110, 247–254.
35. Boeckle, M.; Szipl, G.; Bugnyar, T. Raven food calls indicate sender’s age and sex. Front. Zool. 2018, 15, 5.
[CrossRef] [PubMed]
36. Szipl, G.; Boeckle, M.; Wascher, C.A.F.; Spreafico, M.; Bugnyar, T. With whom to dine? Ravens’ responses
to food-associated calls depend on individual characteristics of the caller. Anim. Behav. 2015, 99, 33–42.
[CrossRef] [PubMed]
37. Heinrich, B.; Marzluff, J. Do common ravens yell because they want to attract others? Behav. Ecol. Sociobiol.
1991, 28, 13–21. [CrossRef]
38. Bugnyar, T.; Kijne, M.; Kotrschal, K. Food calling in ravens: Are yells referential signals? Anim. Behav. 2001,
61, 949–958. [CrossRef]
39. Loretto, M.C.; Reimann, S.; Schuster, R.; Graulich, D.M.; Bugnyar, T. Shared space, individually used:
Spatial behaviour of non-breeding ravens (Corvus corax) close to a permanent anthropogenic food resource.
J. Ornithol. 2016, 157, 339–450. [CrossRef]
40. Epple, W. Zum Schutz der Rabenvögel; Niedersächsisches Landesamt für Ökologie, Abt. Naturschutz:
Hannover, Germany, 1997.
41. Glutz von Blotzheim, U.; Bauer, K.M. Handbuch der Vögel Mitteleuropas: Sittidae—Laniidae; Aula-Verlag:
Wiesbaden, Germany, 1993.
42. Parkin, D.T.; Collinson, M.; Helbig, A.J.; Knox, A.G.; Sangster, G. The taxonomic status of Carrion and
Hooded Crows. Br. Birds 2003, 96, 274–290.
43. Saino, N. Selection of foraging habitat and flocking by crow Corvus corone phenotypes in a hybrid zone.
Ornis Scand. 1992, 23, 111–120. [CrossRef]
44. Landesamt für Vermessung und Geoinformation Feldkirch. Geographical Data from the State of Vorarlberg.
Available online: http://vogis.cnv.at (accessed on 18 April 2016).
45. R Development Core Team. R: A Language and Environment for Statistical Computing; R Foundation for
Statistical Computing: Vienna, Austria, 2012.
46. Pebesma, E.J.; Bivand, R.S. Classes and methods for spatial data in R. R News 2005, 5, 9–13.
47. Bivand, R.S.; Pebesma, E.J.; Gómez-Rubio, V.; Pebesma, E.J. Applied Spatial Data Analysis with R; Springer:
Berlin, Germany, 2013; Volume 10.
48. Keitt, T.H.; Bivand, R.; Pebesma, E.; Rowlingson, B. Rgdal: Bindings for the Geospatial Data Abstraction
Library. Available online: https://r-forge.r-project.org/projects/rgdal/ (accessed on 30 April 2019).
49. Hijmans, R.J. Introduction to the ”Geosphere” Package, Version 1.3-11. 2014. Available online: https:
//mran.microsoft.com/snapshot/2014-10-25/web/packages/geosphere/vignettes/geosphere.pdf (accessed on
30 April 2019).
50. Bivand, R.; Wong, D.W.S. Comparing implementations of global and local indicators of spatial association.
Test 2018, 27, 716–748. [CrossRef]
51. Fortin, M.; Dale, M. Spatial autocorrelation. In The SAGE Handbook of Spatial Analysis; Fotheringham, A.S.,
Rogerson, P.A., Eds.; SAGE Publications: London, UK, 2008.
52. Paradis, E.; Schliep, K. ape 5.0: An environment for modern phylogenetics and evolutionary analyses in {R}.
Bioinformatics 2018, 35, 526–528. [CrossRef]
53. Bartoń, K. MuMIn: Multi-Model Inference; R Package Version 1.43.6. Available online: https://cran.r-project.org/
web/packages/MuMIn/MuMIn.pdf (accessed on 30 April 2019).
54. Bates, D.; Mächler, M.; Bolker, B.; Walker, S. Fitting linear mixed-effects models using lme4. J. Stat. Softw.
2015, 67, 1–48. [CrossRef]
55. Fox, J.; Weisberg, S. An {R} Companion to Applied Regression, 2nd ed.; Sage: Thousand Oaks, CA, USA, 2011.
56. Burnham, K.P.; Anderson, D.R. Model Selection and Multi-Model Inference: A Practical Information-Theoretic
Approach; Springer: London, UK, 2010.
57. Bauer, H.G.; Heine, G.; Bodensee-Brutvogelatlas 2000; Herausgegeben von der Ornithologischen
Arbeitsgemeinschaft Bodensee (OAB). Stand Oktober 2005. Available online: https://www.bodensee-
ornis.de/avifaunistik/brutvogelkartierung/ (accessed on 1 March 2019).
58. Teufelbauer, N.; Seaman, B.S.; Dvorak, M. Bestandsentwicklungen Häufiger Österreichischer Brutvögel im
Zeitraum 1998–2016—Ergebnisse des Brutvogel-Monitoring. Egretta 2017, 55, 43–76.
59. Mayer, G. Die Kolkraben im Windischgarstner Becken. Jahresbuch Mus. 1986, 131, 157–171.You can also read