Climate change and anthropogenic food manipulation interact in shifting the distribution of a large herbivore at its altitudinal range limit - Nature
←
→
Page content transcription
If your browser does not render page correctly, please read the page content below
www.nature.com/scientificreports
OPEN Climate change and anthropogenic
food manipulation interact
in shifting the distribution
of a large herbivore at its altitudinal
range limit
Julius G. Bright Ross1,2,10*, Wibke Peters3, Federico Ossi4,5, Paul R. Moorcroft1,
Emanuele Cordano6, Emanuele Eccel7, Filippo Bianchini4,8, Maurizio Ramanzin9 &
Francesca Cagnacci1,4
Ungulates in alpine ecosystems are constrained by winter harshness through resource limitation
and direct mortality from weather extremes. However, little empirical evidence has definitively
established how current climate change and other anthropogenic modifications of resource
availability affect ungulate winter distribution, especially at their range limits. Here, we used a
combination of historical (1997–2002) and contemporary (2012–2015) Eurasian roe deer (Capreolus
capreolus) relocation datasets that span changes in snowpack characteristics and two levels of
supplemental feeding to compare and forecast probability of space use at the species’ altitudinal
range limit. Scarcer snow cover in the contemporary period interacted with the augmented feeding
site distribution to increase the elevation of winter range limits, and we predict this trend will continue
under climate change. Moreover, roe deer have shifted from historically using feeding sites primarily
under deep snow conditions to contemporarily using them under a wider range of snow conditions
as their availability has increased. Combined with scarcer snow cover during December, January, and
April, this trend has reduced inter-annual variability in space use patterns in these months. These
spatial responses to climate- and artificial resource-provisioning shifts evidence the importance of
these changing factors in shaping large herbivore spatial distribution and, consequently, ecosystem
dynamics.
In temperate and boreal ecosystems, both the latitudinal and altitudinal distribution of species are often deter-
mined by winter conditions1,2. Ungulates and other large herbivores are particularly challenged by the presence of
snow, which decreases food accessibility3, affects vegetation phenology4, increases the costs of thermoregulation5,
and hampers movement6. While these constraints have driven some morphological adaptation in ungulates
living in snow-covered environments7, most temperate ungulates rely on space-use plasticity to meet the chal-
lenges posed by snow. Winter space-use tactics, whether migration8 or refuges within winter ranges9, minimize
the costs associated with winter conditions and are therefore crucial to ungulate survival in temperate regions.
1
Department of Organismic and Evolutionary Biology, Harvard University, Cambridge, MA,
USA. 2Wildlife Conservation Research Unit, Department of Zoology, University of Oxford, Oxford, UK. 3Department
of Biodiversity, Conservation and Wildlife Management, Bavarian State Institute of Forestry, Freising,
Germany. 4Department of Biodiversity and Molecular Ecology, Research and Innovation Centre, Fondazione
Edmund Mach, San Michele all’Adige, Italy. 5C3A ‑ Centro Agricoltura Alimenti Ambiente, Università degli Studi
di Trento, San Michele all’Adige, Italy. 6Rendena100, Engineering and Consultancy sole proprietorship, Tione di
Trento, Italy. 7Department of Sustainable Agro‑Ecosystems and Bioresources, Research and Innovation Centre,
Fondazione Edmund Mach, San Michele all’Adige, Italy. 8Department of Biology and Biotechnology ‘Charles
Darwin’, University of Rome ‘La Sapienza’, Rome, Italy. 9Department of Agronomy, Food, Natural resources,
Animals and Environment, University of Padova, Padova, Italy. 10Present address: Wildlife Conservation Research
Unit, Department of Zoology, University of Oxford, Oxford, UK. *email: jbrightross@gmail.com
Scientific Reports | (2021) 11:7600 | https://doi.org/10.1038/s41598-021-86720-2 1
Vol.:(0123456789)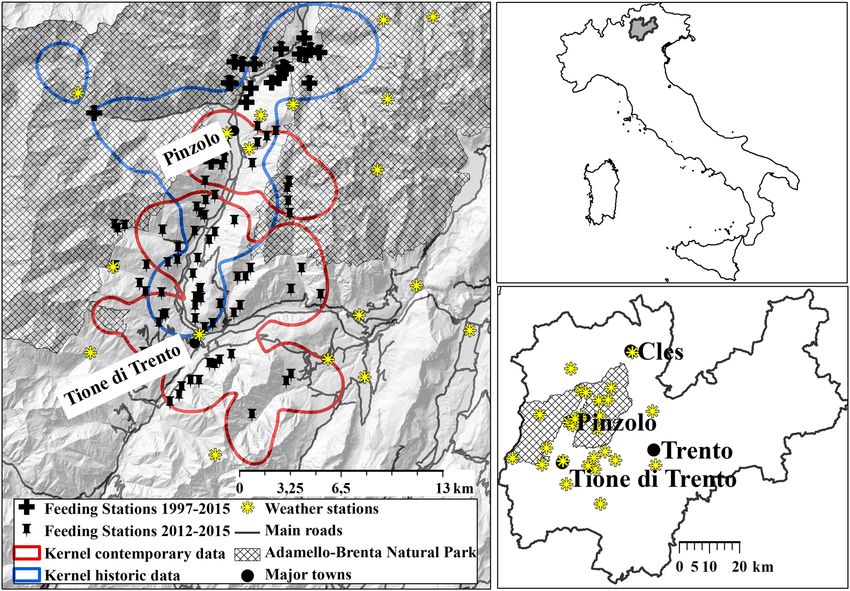
www.nature.com/scientificreports/
Figure 1. Study area in the Italian Alps, with insets of Italy (top right) and Trentino Province (bottom right).
Polygons are shown for the overlapping historical (blue) and contemporary (red) roe deer population (kernel
densities 99% based on radio-telemetry relocations). Supplemental feeding sites are indicated for each period as
well as the 23 weather stations used to run GEOtop simulations (Supplementary S2).
Ongoing changes in winter conditions stemming from anthropogenic climate change thus carry extensive
implications for space use in u ngulates10, and are most evident at the latitudinal and altitudinal range limits of
species . These changes, and particularly a reduction in the snowpack12, have been particularly noticeable in the
11
mid-elevations (~ 1000–1700 m, here and hereafter given as above sea level) of mountainous regions in the North-
ern Hemisphere such as the European Alps12, which form the altitudinal range limit of many species. Moreover,
in these alpine regions, climatic changes often co-occur with the alteration of ungulate resource availability
through supplemental f eeding13,14. This practice consists of the provisioning of abundant plant-based food (grain
or maize seeds, grain and fiber pellets, hay, fruit), usually placed in ad hoc feeding sites during winter months.
Thus, the natural distribution of food resources, normally scarce in winter, is altered by point-source supplies of
highly concentrated f ood15. In spite of its high ecological relevance, studying the interplay between long-term
anthropogenic changes in the physical environment (the snowpack) and food availability (supplemental feed-
ing) in shaping ungulate space use patterns is challenging, due to the gradual nature of these changes and the
resulting need to have comparable measurements of space use that have been collected many years apart. Such
datasets are rare, as the advent of large herbivore tracking technology is relatively r ecent16.
In this study, we had the unique opportunity to contrast and compare “historical” (1999–2002) and “con-
temporary” (2012–2015) space use patterns of Eurasian roe deer (Capreolus capreolus) in a valley at the species’
altitudinal range limit in the Italian Alps (Fig. 1) under ongoing and forecasted changes in winter conditions
and food availability (Fig. 2). Roe deer exhibit high ecological plasticity17,18, making them uniquely suited as
a bellwether of the ongoing effects of such changes on ungulate winter spatial distribution. Winter harshness
(particularly deep snow) severely restricts roe deer movement and thus its spatial distribution, because of their
small body mass (18–49 kg) and short legs (50–60 cm)6. Under these constraints, roe deer living in snowy areas
adopt movement tactics at multiple spatiotemporal scales. First, roe deer exhibit a seasonal partial migration
strategy, with all individuals overwintering in ranges characterized by less extreme snow conditions, and only
some migrating to summer ranges (typically at higher elevations)8. Second, within winter ranges, we have pre-
viously documented third-order s election19 for shallow snow depth and dense forest c anopy20,21. Where sup-
plemental feeding is practiced, the presence of these anthropogenic resources also interacts with winter severity
to affect roe deer space u se14.
In our study area, winter temperatures (Fig. S1.2a) and the variability of snow cover at low-to-interme-
diate elevations have increased over the last two decades (Fig. 2a), as has the prevalence and distribution of
Scientific Reports | (2021) 11:7600 | https://doi.org/10.1038/s41598-021-86720-2 2
Vol:.(1234567890)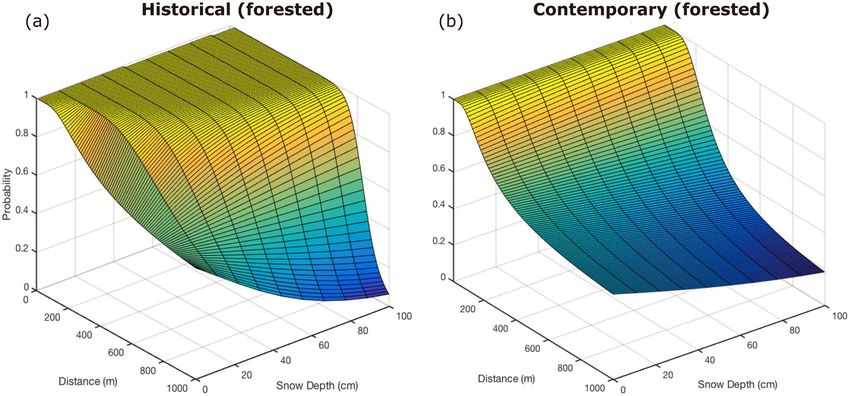
www.nature.com/scientificreports/
Figure 2. Snow cover duration for each winter season (Nov–Apr) as a function of altitude in the study area,
calculated using GEOtop 2.0 (Supplementary S2). Central continuous lines denote the 50th percentile, while
range between 25 and 75th percentiles is shown by the colored areas. RCP scenarios refer to the last decade of
the projection period (2046–2065).
supplemental feeding sites (Fig. 1). We performed an analysis of roe deer space-use data covering this timespan.
Specifically, our analysis used (i) a GPS dataset of contemporary roe deer relocations (2012–2015, hereafter
“contemporary period”) in a valley in the Italian Alps (Fig. 1); (ii) a VHF dataset of historical roe deer relocations
(1999–2002, hereafter “historical period”) in a largely overlapping area22; (iii) a detailed mapping of supplemen-
tal feeding site distribution and canopy cover in both periods; and (iv) an advanced surface-process predictive
hydrological model of snow depth23, to fit resource selection functions (RSFs) modelling relative probability-
of-use across the study area. We used these RSFs to predict and compare (by means of kappa c oefficients24 and
subtraction maps) the winter (November to April) distribution of roe deer at a high temporal resolution scale
(monthly) over the course of the two study periods. Utilizing two climate forecasts of “intermediate” or “severe”
thermal loading (the IPCC’s “Representative Concentration Pathways” for 2046–2065, modelling either interme-
diate or no restraint in emissions; hereafter RCP4.525 and RCP8.526, respectively), we then used the model built
with contemporary data to evaluate roe deer habitat selection under predicted future snow depth scenarios. We
thus evaluated the following set of hypotheses.
First, we hypothesized that winter distribution would be influenced by both (i) snow depth and (ii) the prox-
imity of supplemental feeding s ites20. We further hypothesized (iii) that there would be an interaction between
these two factors, with the availability of supplemental feeding affecting the response of roe deer to snow depth.
Specifically, we expected that the relative probability of space use would decrease with deep snow (> ~50 cm;
Prediction 1) and increase in the proximity of supplemental feeding sites (Prediction 2). Following hypothesis
(iii), we expected that as the availability of supplemental feeding sites increased between study periods, the rela-
tive probability of space use would concentrate around these sites irrespective of the presence of snow (Prediction
3)—i.e., the attraction of supplemental feeding sites at higher frequency would prevail over the negative effects
of snow. Consequently, we also expected that the predicted spatial distribution of roe deer would display higher
variability between the historical and the contemporary period than within either period, in response to the inter-
decadal changes in snow depth and the substantial increase in supplemental feeding site availability across the
study area (Prediction 4). Further, because the year-to-year differences within a given period should depend on
snow depth variability (given supplemental feeding sites are constant), we predicted that the increases in winter
variability in alpine regions (Fig. 2a) would produce more variability within the contemporary period than in the
historical one (Prediction 5a), and even further variability under forecasted warming scenarios (Prediction 5b).
Results
Snow trends. We observed inter-decadal trends in snow cover duration (days with snow depth > 5 cm) and
absolute snow depth, both as a function of elevation and of the winter months (November–April). The decade-
aggregated average of “snow cover days” from November–April (Fig. 2) showed higher variability in snow cover
duration within our study area from 2006 to 2015 (encompassing the contemporary study period) than in the
previous decade (from 1996 to 2005, encompassing the historical study period). This pattern was particularly
evident at low-to-intermediate elevations (500–1500 m; Fig. 2a). The same aggregated average also predicts that
snow cover duration will decrease as a function of continued climate change, again especially at lower elevations
(Fig. 2b). However, the comparison of snow depth between historical and contemporary study periods as a func-
tion of elevation (Fig. S2.2) showed that in early (November–December) and late (April) winter, snow depth
variability decreased in the contemporary period, as a consequence of scarcer snowfall in these months in recent
Scientific Reports | (2021) 11:7600 | https://doi.org/10.1038/s41598-021-86720-2 3
Vol.:(0123456789)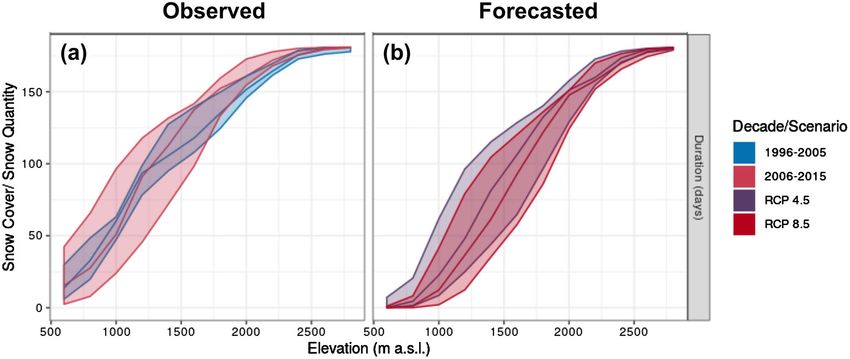
www.nature.com/scientificreports/
Figure 3. 3D prediction plots of relative probability-of-use of forested habitats (for unforested habitats, see
Fig. S3.1) in the two periods (1999–2002: (a); 2012–2015: (b)) covered by the analysis.
years. In contrast, the variability of snow depth over the central winter months (January–March) was relatively
high during both study periods.
Roe deer space use patterns. Contemporary and historical resource selection functions (hereafter
“RSFc” and “RSFh”, respectively) confirmed the hypothesized effects of snow and supplemental feeding (hypoth-
eses i and ii) on relative probability of space use by roe deer. In particular, roe deer avoided areas with high snow
depth (Prediction 1: βc = − 0.018 ± 0.002/cm; βh = − 0.174 ± 0.010/cm, both p < 0.001) and selected for areas close
to supplemental feeding sites (Prediction 2: βc = 351.750 ± 18.540; βh = 529.691 ± 26.650, both p < 0.001, for the
reciprocal of distance from the closest feeding site, “1/DistFS”). Further, in accordance with hypothesis (iii),
the selection for supplemental feeding sites was stronger at higher snow depths, but less so as the availability of
supplemental feeding sites increased between periods, as shown by the different magnitude of the interaction
terms (Prediction 3: βc = 4.282 ± 0.752; βh = 140.411 ± 8.432, both p < 0.001) (Fig. 3 and Fig. S3.1). The models
also indicated strong positive selection for canopy cover (βc = 0.8033 ± 0.067; βh = 1.217 ± 0.084, where 0 = open,
1 = forested, reference category: open; both p < 0.001), which changed relatively little between study periods.
The robustness of both RSFs for predicting relative probability-of-use under a variety of conditions was
established via spatial validation (each RSF in its own study period) and temporal validation ( RSFc hindcasted
to the historical period, see “Methods” section). Each validation was performed through a Kendall’s tau (τ) rank
correlation analysis (spatial RSFh: τ = 0.80, SD = 0.01, p < 0.05 for all months; spatial RSFc: τ = 0.70, SD = 0.23, all
p < 0.05 except November 2014, p = 1; temporal RSFc: τ = 0.76, SD = 0.13; all p < 0.05 except April 1999, p = 0.13;
see “Methods” section for explanation of τ and Supplement S5 for further information). The goodness-of-fit of
the fitted RSFs was confirmed by Receiver Operating Characteristic (ROC) area-under-the-curve (AUC) values
(AUCh = 0.86, AUCc = 0.82, ROC plots Fig. S3.2) and k-fold cross-validation, also using Kendall’s tau (fivefold,
mean historical τh = 0.75, two historical k-fold subsets p < 0.001, three subsets p < 0.05; mean contemporary
τc = 0.96, all contemporary k-fold subsets p < 0.001).
Temporal variation in patterns of space use. We used kappa coefficients (κ) to compare similarity
between predicted relative probability-of-use (Rp) maps within and between periods (κ = 1 for identical maps,
κ = − 1 for reverse-image maps). These coefficients indicated substantial inter-decadal shifts in Rp by roe deer
across our study area. In agreement with Prediction 4, inter-decadal variability in Rp was significantly higher
(lower κ) than year-to-year variability in all months of the contemporary period and in April of the historical
period (Fig. 4; November not shown because of limited sample size). However, the majority of historical year-
to-year monthly comparisons showed relatively low κ values, indicating high variability (Fig. 4a–d). Therefore,
contrary to our expectations (Prediction 5a), we found significantly lower year-to-year variability in the con-
temporary period than in the historical one during the months of December, January, and April (both pDec and
pJan < 0.001, pApr = 0.036, Fig. 4a,b,e), while the year-to-year variability in February and March was not signifi-
cantly different between the two periods (Fig. 4c,d). Similarly, we found this reduction in variability continued in
the forecasted warming scenarios (counter to Prediction 5b), with the inter-annual variability within forecasted
scenarios being significantly lower than in the historical period (Fig. 4).
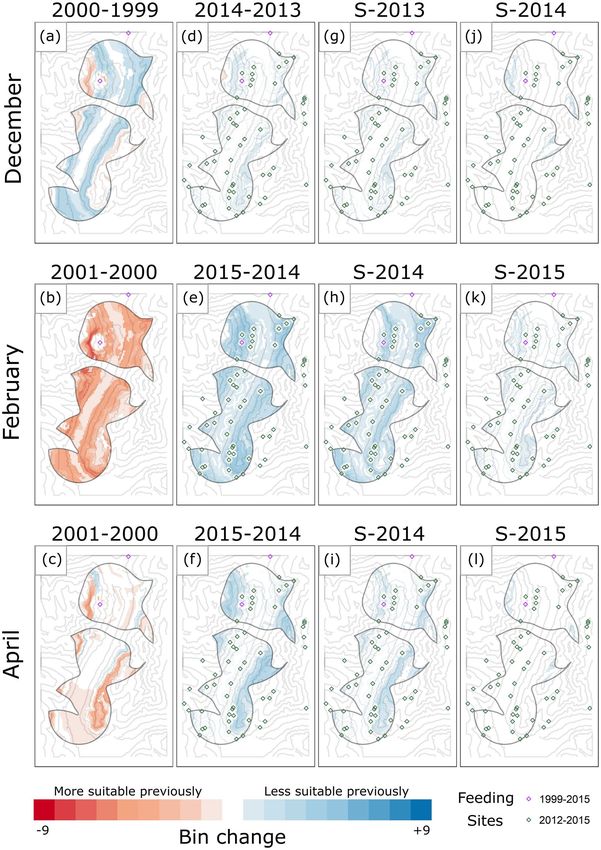
We have included subtraction maps comparing year-to-year relative Rp, in order to visualize the sole effect
of snow variation on roe deer winter distribution under constant supplemental feeding intensity (Fig. 5). For
both the historical and contemporary periods, when comparing a low-snow and high-snow winter (1999/2000
Scientific Reports | (2021) 11:7600 | https://doi.org/10.1038/s41598-021-86720-2 4
Vol:.(1234567890)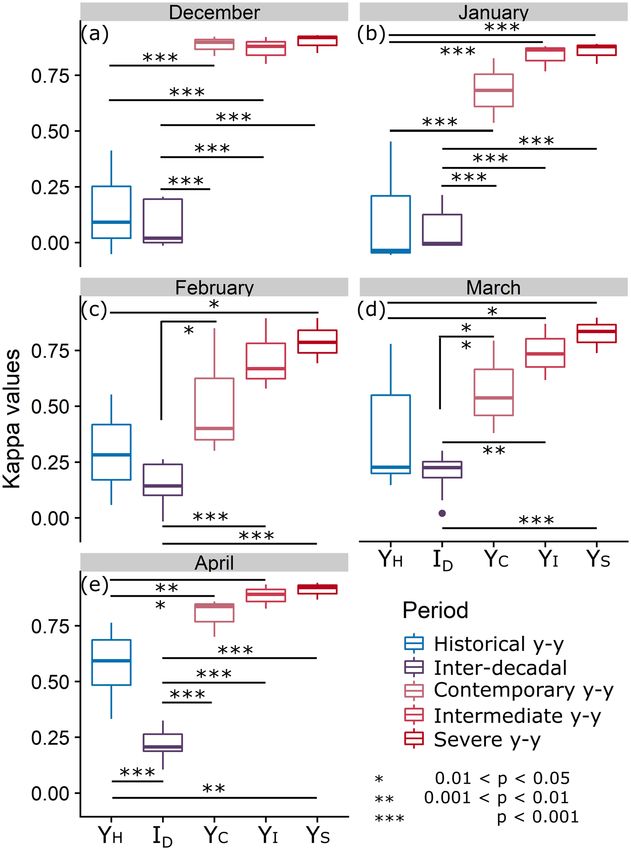
www.nature.com/scientificreports/
Figure 4. Kappa coefficients comparing the relative probability-of-use by month. Y H: year-to-year (y–y in the
legend) comparisons for historical study period using RSFh; ID: inter-decadal comparisons; Y C: year-to-year
comparisons for contemporary study period using RSFc; YI: year-to-year comparisons for intermediate forecast
scenario; YS: year-to-year comparisons for severe forecast scenario. Sample size varies based on the number
of years for which data was collected in that month (November not shown due to low sample size). Asterisks
denote pairwise significance of difference between categories of comparison (***, p < 0.001; **, p < 0.01; *,
p < 0.05).
and 2000/2001, respectively, for the historical period; 2014/2015 and 2013/2014 for the contemporary period;
see also Fig. S2.2), low-snow years exhibited an upslope shift of areas of high Rp out of the central valley. This
was particularly true in the snowier months of mid-winter (February in Fig. 5, panels b and e respectively for
the historical and contemporary periods). The comparison between the same two contemporary winters and
the severe warming forecasted scenario confirmed this pattern is likely to continue in the future (Fig. 5g–l).
Roe deer winter habitat suitability increased under predicted warming conditions, especially when compared
to the particularly snowy winter of 2013/2014 (Fig. 5g–i), while smaller shifts in high-Rp areas were seen when
comparing the forecast to the low-snow winter of 2014/2015 (Fig. 5j–l).
Scientific Reports | (2021) 11:7600 | https://doi.org/10.1038/s41598-021-86720-2 5
Vol.:(0123456789)www.nature.com/scientificreports/
Figure 5. Maps of change in relative probability-of-use (Rp). Each map represents the subtraction of one
binned Rp map from another (later map–earlier map). Pixel colors range from − 9, indicating extreme
preference for the pixel in the earlier year, to + 9, extreme preference in a later year. The spatial resolution is
10 m, and the contour lines indicate 250 m changes in elevation, with lowest values in the central valley (see also
Fig. 1). Panels (a–f) show subtractions within the historical period (a–c, low-snow year subtracted from high-
snow year) and within the contemporary period (d–f, high-snow year subtracted from low-snow year); panels
(g–l) show subtractions of contemporary years (high-snow: 2013/2014 winter; low-snow: 2014/2015 winter)
from the same year predicted using the severe forecast scenario.
Scientific Reports | (2021) 11:7600 | https://doi.org/10.1038/s41598-021-86720-2 6
Vol:.(1234567890)www.nature.com/scientificreports/
Discussion
By making use of two tracking datasets separated by a decade and a half of anthropogenic change, we were able to
empirically link an ungulate’s changing winter distribution to long-term ongoing and forecasted changes in abi-
otic constraints and anthropogenic resource availability. Specifically, our findings forecast a distributional upslope
shift in relative probability of space use for an opportunistic, snow-constrained ungulate under current climate
change, as a consequence of snow depth and snowpack changes. In our empirical setting, this response was
made more complex by the attraction of animals to supplemental feeding sites, evidencing how snow depth and
supplemental feeding can combine to modify the seasonal spatial distribution of ungulates and other mammals.
Resource selection models confirmed Predictions 1 and 2 in both study periods, showing a steep drop-off
in relative probability-of-use at snow depths exceeding ~ 50 cm and at increasing distances from supplemental
feeding sites. However, in the historical period, the attraction to supplemental feeding sites increased with snow
depth (i.e., the relative probability-of-use was higher close to feeding sites in the case of deep snow), suggesting
a mitigating behavioral response to the constraints associated with widespread heavy s nowfall3,6. Conversely,
in the contemporary period, these sites now attract roe deer almost irrespective of snow depth (i.e., the relative
probability-of-use remained high close to feeding sites under almost any snow condition) (Prediction 3). As
expected, we observed a substantial shift in roe deer’s relative probability of space use (i.e. distribution) from one
decade to the next in response to an increased number and spread of supplemental feeding sites, together with
the upwards shift of the snowline (Prediction 4). However, increased snow variability in contemporary years
(given that the distribution of feeding sites is relatively static within this period) did not produce the expected
increase in inter-annual Rp variability. Conversely, we found a decrease in inter-annual Rp variability in the
early and late winter months (December, January, and April), and projections that this variability will continue
decreasing in the forecasted scenarios (Prediction 5).
In the historical period, supplemental feeding sites mitigated the negative effects of deep snow, with higher Rp
values extending in a radius of up to ~ 600–700 m from supplemental feeding sites (Fig. 3a). In the contemporary
period, instead, higher Rp values extend only up to 200–300 m from feeding sites under the same snow conditions
(Fig. 3b). Notably, Rp in close proximity to feeding sites remains high in the contemporary period under almost
any snow conditions, showing a decreased mitigation effect, but stronger dependence on these artificial sources
of food. These findings raise the question of the extent to which anthropogenic modifications of resource avail-
ability affect ungulate populations—particularly those facing particularly limiting winter c onditions27. Potential
drawbacks of supplementing feeding include, but are not limited to, transforming feeding sites into “ecological
traps”28, where disease transmission29,30 or competition-induced stress increases15,31 can severely affect population
dynamics. Behavioral responses may enable animals to adapt to anthropogenic changes32–34, but in many cases,
these responses may be insufficient and even maladaptive28,35. For instance, supplemental feeding sites may make
animals more susceptible to harsh snowfall in the studied population, as they congregate in areas they would
normally avoid in the winter and lose the capacity to rely on natural food resources15,36, potentially with negative
effects on their health37,38. Anecdotally, five of our collared roe deer died in one week in March 2014 following an
intense snowfall, despite sustained use of feeding sites. Increased predation risk due to artificially elevated local
density of roe deer around feeding sites may prove another unanticipated drawback of the practice39. While this
effect is currently not a major issue in our study system (only brown bears, Ursus arctos, may predate on adult
roe deer, but they hibernate in winter), it could be increasingly be the case as large carnivores expand through
Europe40,41. Thus, even as the positive effects of supplemental feeding practice remain c ontroversial42, there is
rising concern around the pitfalls of the practice and its far-reaching effects on b ehavior43–45.
While the increase in supplemental feeding sites played the largest role in driving inter-decadal shifts in space
use, snow variability exerted a fundamental role in shaping year-to-year variation in relative probability of space
use. Remarkably, we observed the high variability expected in the contemporary period (Prediction 5a) only
during the central months of the winter (February–March), while in the historical period deer exhibited relatively
high space use variability all winter long. The low variability in contemporary space use patterns detected for the
months of December, January, and April (Fig. 4) was likely due to scarce-to-absent snowfall in these months in
contemporary years. Therefore, milder conditions at the beginning and end of winter reduced the constraint of
snow cover on roe deer winter distribution and allowed relative probability-of-use to remain highly consistent
from year to year during these months. Conversely, the unexpected variability in historical space use is arguably
the standard variability to be expected from year-to-year changes in snow patterns, and should be contrasted
with the climate change-driven lowered year-to-year variability of the contemporary period and forecasted sce-
narios. These patterns presage the speed with which climate-driven changes in snow cover and related animal
behavioral responses are happening. The continued upward shift of the snowline along the elevation gradient
in our climate change forecasts (Prediction 5b) confirms this trend and in turn forecasts substantial upslope
expansion of suitable winter habitat for roe deer in the Alps.
Our work empirically supports the theoretically predicted effects of a decrease in snow coverage in the North-
ern Hemisphere46 on distribution range shifts and movement patterns of varied mammal s pecies47. Such changes
have been found to affect the probability of seasonal migration from summer to winter ranges in several ungulate
species8,48,49, with deep snowpacks driving moose (Alces alces) to modify their fine-scale movements to search
for conifer patches within mixed stands50, and Sitka deer (Odocoileus hemionus sitkensis) selecting for different
successional stages of forest within their winter range according to snow depth v ariability51.
This study expands these findings by providing rare empirical evidence of the interplay between anthropo-
genic changes in climate and food supply32 in driving behavioral responses in a large herbivore at the altitudinal
limit of its distribution. Moreover, it examines behavioral responses at the inter-decadal scale at which changes
in the snowpack become measurable and sustained. Although our analysis is confined to the alpine watershed in
which our study was executed, it is applicable to a broad guild of temperate and arctic ungulates. More generally,
Scientific Reports | (2021) 11:7600 | https://doi.org/10.1038/s41598-021-86720-2 7
Vol.:(0123456789)www.nature.com/scientificreports/
it provides an example of the general effects of interacting pressures on space use patterns at the range limits of
all species11,27. Under predicted changes, species may change their d istribution47, undergo local e xtirpations52,
or adapt within their current range, as observed in this study.
Therefore, the topic is of great relevance—particularly to ungulates, as their proximate behavioral responses
will likely have cascading effects on local ecosystems27, e.g. through changing browsing pressure, nitrogen cycling,
and seed d ispersal53, or through inter-specific c ompetition54. We therefore encourage other animal ecologists to
make use of localized climatological and movement data to shed light on these and other important questions
linking environmental change with space use trends. Further, future research should consider the demographic
consequences of these ongoing changes, particularly by linking expanding habitat suitability to population
dynamics at the range limits of snow-constrained species under climate change.
Methods
Study area. All research was carried out in a 400 km2 mountainous area ranging in altitude from 400 to
3500 m in the north-eastern Italian Alps (Val Rendena and Valli Giudicarie, Autonomous Province of Trento,
Italy; see Supplement S1 for details on climate, flora, and fauna). Over the study period, the area saw an increase
in supplemental feeding for roe deer, from 20 to 95 actively managed sites (Fig. 1), due to modifications in hunt-
ing management regulations. The overall population density of roe deer in the area has remained relatively low
and constant throughout the last two decades (i.e., between three and five deer/100 ha)55,56.
Movement data. The dataset of contemporary roe deer relocations was collected from December 18th
2012 to April 20th 2015, for a total of 33,399 winter GPS relocations (1 Nov–30 Apr; one fix every 3 h) from 23
roe deer (9 males, 14 females). Animals were captured using box traps and drop nets during two field campaigns
in the winters of 2012–2013 and 2013–2014 and outfitted with GPS-GSM radio-collars (VECTRONIC Aero-
space GmbH).
The dataset of historical roe deer relocations was collected from March 7th 1999 to April 30th 2002, for a
total of 4529 winter VHF radio-collar relocations (one fix per animal per day22) from 32 roe deer (10 males, 22
females), captured using box traps and drop nets, then outfitted with VHF transmitters (Televilt International
AB).
All animal handling practices for capturing and marking roe deer complied with Italian laws on animal welfare
and were approved by the Wildlife Committee of the Autonomous Province of Trento.
Environmental data. We used the GEOtop 2.0 Hydrological M
odel23 (hereafter “GEOtop”) to generate a
25-year long time series (1989–2015) of daily variation in snow depth at a spatial resolution of 100 m. GEOtop
is a water- and energy-balance model that produces snow depth area maps from meteorological data, taking into
account snow melting processes across the landscape (see Supplement S2 for details). We also used GEOtop in
conjunction with a regional climate model (COSMO-CLM)57 to generate two further 25-year long time series
(hereafter “intermediate” and “severe” scenarios) using forecasts of radiative forcing from greenhouse gas emis-
sion scenarios of differing severity (IPCC RCP4.525 and RCP8.526). We assessed the accuracy of GEOtop output
for our study area by comparing predicted snow depth data to empirically measured snow depth measurements
collected from 2012 to 2 01520, and we applied a correction coefficient to remedy slight overprediction of GEO-
top in forested areas (see Supplement S2). For each generated timeseries separately, we obtained monthly snow
depth maps for the entire study area by averaging the daily GEOtop snow depth values over each winter month
(November–April).
We derived canopy cover maps for the historical and contemporary periods, respectively, from CORINE 2000
and 2012 land cover maps (European Environment Agency 2000 and 2012, available at https://land.copernicus.
eu/pan-european/corine-land-cover; hereafter "CLC 2000" and "CLC 2012"). For both maps, we ranked broad-
leaf forest, coniferous forest, and mixed forest land classes as “closed” canopy, and all other classes as “open”.
Finally, we gathered supplemental feeding site locations from local hunters and wildlife managers. We used
ArcGIS software (ESRI, Redlands, CA, USA) to compute two maps (one for each study period) of 3D path-
distance to the nearest supplemental feeding site.
Predicting habitat selection. We estimated two resource selection functions (RSFs) to predict roe deer
space use patterns across the study area in the historical and in the contemporary periods. RSFs are functions
proportional to the probability a given animal will select a resource unit. They are commonly used to under-
stand species’ distributions and space use by characterizing the relative probability-of-use of a given site as a
log-linear product of its characteristics and appropriate selection or avoidance coefficients (see Eq. 1 below)58.
We calculated these RSF coefficients by fitting a logistic regression to telemetry-derived locations used by roe
deer (case = 1) between 1999 and 2002 (historical RSF, “RSFh”) or 2012–2015 (contemporary RSF, “RSFc”) and
to available locations (case = 0)59. After confirming the consistency between daily and nocturnal versions of the
GPS-based RSFc (see Supplement S4), we retained only GPS relocations between sunrise and sunset for the R SFc
used in the analysis (daylight deduced using the suncalc R package60). Limitation to daylight hours was done to
permit strict comparison of the VHF- (historical) and GPS-based (contemporary) models, since VHF data had
been only gathered during daylight hours. For both RSFs, we randomly selected one used point per animal per
day (final used sample: GPS 4625 points, VHF 4013 points) in order to reduce autocorrelation between points
and to further strengthen the comparison between VHF- and GPS-based datasets, given their different temporal
resolutions. For both RSFs, available points were randomly sampled at a 1:1 ratio to used points61 within 99%
kernel density polygons (bivariate normal with reference bandwidth) of all VHF and GPS roe deer locations,
respectively.
Scientific Reports | (2021) 11:7600 | https://doi.org/10.1038/s41598-021-86720-2 8
Vol:.(1234567890)www.nature.com/scientificreports/
We estimated the historical (RSFh) and contemporary (RSFc) relative probability of space use (used/avail-
able) at a monthly scale, as a function of (i) monthly averages of GEOtop-derived snow depth (SD) (Prediction
1), (ii) the reciprocal of the distance between the location and the nearest supplemental feeding site (1/DistFS,
“proximity”) (Prediction 2), and (iii) the interaction between these two covariates (SD/DistFS) (Prediction 3),
while controlling for canopy cover as a fixed effect (CC). We chose 1/DistFS rather than the distance to supple-
mental feeding sites because, when predicting over large areas, an ever-decreasing linear effect of supplemental
feeding sites on habitat selection becomes biologically unrealistic beyond perception limits. All predictions of
relative probability-of-use (Rp) were based on a linear scaling (from 0 to 1, Eq. 2) of the log-linear form in Eq. 1
(typical for R SFs59):
1
SD
Rp = LinScale exp β1 (CC) + β2 (SD) + β3 + β4 (1)
DistFS DistFS
where
xi − min(x)
LinScale(xi ) = (2)
max(x) − min(x)
We evaluated the reliability of both RSFh and R SFc using Receiver Operating Characteristics (ROC) curves
and k-fold cross-validation59 with Kendall’s tau (τ) coefficients62 (which are typically more robust than Spearman’s
rho). In k-fold cross-validation, data are partitioned into k equal subsets (5 in this study), and each subset is used
to define a model. τ coefficients measure the correlation between rankings of model predictions in the remaining
data and area-adjusted frequencies of observed habitat u SFh to predict Rp for 1999–2002
se59. We also used R
and RSFc to predict Rp for 1999–2002 and 2012–2015, further using τ coefficients to spatially and temporally
validate the models’ ability to predict actual space use (Supplement S5). We thus considered significant τ coef-
ficients produced within a model’s respective study period to be a spatial validation of that model (spatial RSFh
τ in 1999–2002, spatial RSFc τ in 2012–2015) and significant τ coefficients produced in 1999–2002 for RSFc to
be a temporal validation of the contemporary model’s predictive ability (temporal R SFc).
Finally, we also forecasted Rp using RSFc and snow depths estimates from both forecast scenarios of climate
change (intermediate scenario = GEOtop monthly average outputs 2012–2015 with RCP4.5 correction + CLC
2012 + distribution of supplemental feeding sites in 2012–2015; severe scenario = GEOtop monthly average out-
puts 2012–2015 with RCP8.5 correction + CLC 2012 + distribution of supplemental feeding sites in 2012–2015).
Evaluating temporal changes in patterns of space use. We used weighted Kappa c oefficients24 to
examine how changes in snow patterns and supplemental feeding site distribution have affected variability in
spatial patterns of Rp of identical months between periods (“inter-decadal”, Prediction 4) and within a study
period (“year-to-year”, Prediction 5). Kappa coefficients (κ) provide a proportion of agreement (“similarity”)
between two maps’ binned Rp values (pixel-by-pixel), accounting for the probability of overlap between ran-
domly-distributed Rp values (e.g., 0.1 * 0.1 = 1% of the lowest 10% of Rp values should overlap by chance in any
two maps). κ coefficients take on a value of 1 for perfect agreement and values near 0 for agreement no larger
than expected by chance24, thus providing a robust means of comparison between entire spatial surfaces.
For each winter month (Nov–Apr) we extracted monthly Rp values (generated with the corresponding period’s
RSF) for 1000 random locations within the intersection of both study periods’ 99% kernel polygons and binned
these into 10 quantiles established from the pooled Rp values generated from R SFc across the entire study. We
then used these binned values to compute a κ coefficient, weighted by the degree of rank disagreement63. For a
given winter month, we thus calculated a κ coefficient for each possible annual pairwise combination (a) within
the historical study period (“intrah”), (b) within the contemporary study period (“intrac”), (c) between the two
study periods (“inter-decadal”), (d) within the intermediate scenario (“intrai”), and (e) within the severe scenario
(“intras”). For each month, we used a one-way ANOVA and post-hoc Tukey tests to evaluate the significance of
differences between the κ coefficients of these five categories.
Finally, we created subtraction maps to visually represent the comparisons captured by the κ coefficients
within each period (i.e. year-to-year), thus keeping fixed the availability of supplemental feeding sites. We chose
three months to represent different parts of the winter: December (early winter), February (mid-winter), and
April (late winter). For each month, we firstly created maps of Rp, binned into the same 10 quantiles developed for
calculating the κ coefficients. Then, we computed four subtraction maps in order to visually illustrate the areas of
highest difference in relative probability-of-use. Specifically, both for the historical study period ( intrah) and for
the contemporary one ( intrac), we compared a dry and a snowy winter (1999/2000 and 2000/2001, respectively,
for the historical period; 2014/2015 and 2013/2014 for the contemporary period; information on snow char-
acteristics in 2014 and 2015 were extracted from GEOtop layer, see also Fig. S2.2). We also created subtraction
maps to compare both contemporary winters with the maps predicted under the most severe warming scenario.
In all cases, the earlier map was subtracted from the later map.
Kernel polygons and path distances between pixels were generated in ArcGIS spatial software (ESRI, Redlands,
CA, USA). All other statistical analyses and spatial analyses were conducted using R 3.4.3 (key packages used:
irr64, ResourceSelection65, rgdal66, Kendall67).
Data availability
The data are available in the Eurodeer repository (http://www.eurodeer.org), accessible following user registra-
tion. The datasets are also available in Zenodo athttps://doi.org/10.5281/zenodo.4637674. (Bright Ross et al68,
https://doi.org/10.5281/zenodo.4637674).
Scientific Reports | (2021) 11:7600 | https://doi.org/10.1038/s41598-021-86720-2 9
Vol.:(0123456789)www.nature.com/scientificreports/
Received: 25 March 2020; Accepted: 13 January 2021
References
1. Weiner, J. Physiological limits to sustainable energy budgets in birds and mammals: ecological implications. Trends Ecol. Evol. 7,
384–388 (1992).
2. Mcnab, B. K. Food habits, energetics, and the population biology of mammals. Am. Nat. 116, 106–124 (1980).
3. Hovey, F. W. & Harestad, A. S. Estimating effects of snow on shrub availability for black-tailed deer in southwestern British Colum-
bia. Wildl. Soc. Bull. 20, 308–313 (1992).
4. Post, E. & Stenseth, N. Climatic variability, plant phenology, and northern ungulates. Ecology 80, 1322–1339 (1999).
5. Moen, A. N. Seasonal changes in heart rates, activity, metabolism, and forage intake of white-tailed deer. J. Wildl. Manag. 42,
715–738 (1978).
6. Holand, Ø., Mysterud, A., Wannag, A. & Linnell, J. D. C. Roe deer in northern environments: physiology and behaviour. In The
European Roe Deer: Biology of Success (eds Andersen, R. et al.) 117–137 (Scandinavian University Press, 1998).
7. Foromozov, A. N. Snow Cover as an Integral Factor of the Environment and Its Importance in the Ecology of Mammals and Birds
(The University of Alberta, 1963).
8. Cagnacci, F. et al. Partial migration in roe deer: migratory and resident tactics are end points of a behavioural gradient determined
by ecological factors. Oikos 120, 1790–1802 (2011).
9. Dussault, C., Courtois, R., Ouellet, J.-P. & Girard, I. Space use of moose in relation to food availability. Can. J. Zool. 83, 1431–1437
(2005).
10. Mysterud, A. & Sæther, B.-E. Climate change and implications for the future distribution and management of ungulates in Europe.
In Ungulate Management in Europe: Problems and Practices (eds Putman, R. et al.) 349–375 (Cambridge University Press, 2011).
11. Parmesan, C. Ecological and evolutionary responses to recent climate change. Annu. Rev. Ecol. Evol. Syst. 37, 637–669 (2006).
12. Scherrer, S. C., Wüthrich, C., Croci-Maspoli, M., Weingartner, R. & Appenzeller, C. Snow variability in the Swiss Alps 1864–2009.
Int. J. Climatol. 33, 3162–3173 (2013).
13. Milner, J. M., van Beest, F. M., Schmidt, K. T., Brook, R. K. & Storaas, T. To feed or not to feed? Evidence of the intended and
unintended effects of feeding wild ungulates. J. Wildl. Manag. 78, 1322–1334 (2014).
14. Ossi, F. et al. Plastic response by a small cervid to supplemental feeding in winter across a wide environmental gradient. Ecosphere
8, e01629 (2017).
15. Putman, R. & Staines, B. W. Supplementary winter feeding of wild red deer Cervus elaphus in Europe and North America: justifica-
tions, feeding practice and effectiveness. Mamm. Rev. 34, 285–306 (2004).
16. Cagnacci, F., Boitani, L., Powell, R. A. & Boyce, M. S. Animal ecology meets GPS-based radiotelemetry: a perfect storm of oppor-
tunities and challenges. Philos. Trans. R. Soc. B Biol. Sci. 365, 2157–2162 (2010).
17. Peters, W. et al. Migration in geographic and ecological space by a large herbivore. Ecol. Monogr. 87, 297–320 (2017).
18. Morellet, N. et al. Seasonality, weather and climate affect home range size in roe deer across a wide latitudinal gradient within
Europe. J. Anim. Ecol. 82, 1326–1339 (2013).
19. Johnson, D. H. The comparison of usage and availability measurements for evaluating resource preference. Ecology 61, 65–71
(1980).
20. Ossi, F., Gaillard, J. M., Hebblewhite, M. & Cagnacci, F. Snow sinking depth and forest canopy drive winter resource selection more
than supplemental feeding in an alpine population of roe deer. Eur. J. Wildl. Res. 61, 111–124 (2015).
21. Mysterud, A. & Østbye, E. Bed-site selection by European roe deer (Capreolus capreolus) in southern Norway during winter. Can.
J. Zool. 73, 924–932 (1995).
22. Ramanzin, M., Sturaro, E. & Zanon, D. Seasonal migration and home range of roe deer (Capreolus capreolus) in the Italian eastern
Alps. Can. J. Zool. 85, 280–289 (2007).
23. Endrizzi, S., Gruber, S., Dall’Amico, M. & Rigon, R. GEOtop 2.0: simulating the combined energy and water balance at and below
the land surface accounting for soil freezing, snow cover and terrain effects. Geosci. Model. Dev. 7, 2831–2857 (2014).
24. Cohen, J. A coefficient of agreement for nominal scales. Educ. Psychol. Meas. 20, 37–46 (1960).
25. Thomson, A. M. et al. RCP 4.5: a pathway for stabilization of radiative forcing by 2100. Clim. Change 109, 77–94 (2011).
26. Riahi, K. et al. RCP 8.5—a scenario of comparatively high greenhouse gas emissions. Clim. Change 109, 33–57 (2011).
27. Thomas, C. D. Climate, climate change and range boundaries. Divers. Distrib. 16, 488–495 (2010).
28. Penteriani, V. et al. Evolutionary and ecological traps for brown bears Ursus arctos in human-modified landscapes. Mamm. Rev.
48, 180–193 (2018).
29. Sorensen, A., van Beest, F. M. & Brook, R. K. Impacts of wildlife baiting and supplemental feeding on infectious disease transmis-
sion risk: a synthesis of knowledge. Prev. Vet. Med. 113, 356–363 (2014).
30. Mysterud, A., Viljugrein, H., Solberg, E. J. & Rolandsen, C. M. Legal regulation of supplementary cervid feeding facing chronic
wasting disease. J. Wildl. Manag. 83, 1667–1675 (2019).
31. Ceacero, F. et al. Benefits for dominant red deer hinds under a competitive feeding system: food access behavior, diet and nutrient
selection. PLoS ONE 7, e32780 (2012).
32. Beever, E. A. et al. Behavioral flexibility as a mechanism for coping with climate change. Front. Ecol. Environ. 15, 299–308 (2017).
33. Loe, L. E. et al. Behavioral buffering of extreme weather events in a high-Arctic herbivore. Ecosphere 7, e01374 (2016).
34. Sih, A., Ferrari, M. C. O. & Harris, D. J. Evolution and behavioural responses to human-induced rapid environmental change. Evol.
Appl. 4, 367–387 (2011).
35. Radchuk, V. et al. Adaptive responses of animals to climate change are most likely insufficient. Nat. Commun. 10, 3109 (2019).
36. Mysterud, A. Still walking on the wild side? Management actions as steps towards ‘semi-domestication’ of hunted ungulates. J.
Appl. Ecol. 47, 920–925 (2010).
37. Felton, A. M. et al. Interactions between ungulates, forests, and supplementary feeding: the role of nutritional balancing in deter-
mining outcomes. Mamm. Res. 62, 1–7 (2017).
38. Ricci, S. et al. Impact of supplemental winter feeding on ruminal microbiota of roe deer Capreolus capreolus. Wildl. Biol. 2019,
wlb.00572 (2019).
39. Lone, K. et al. Living and dying in a multi-predator landscape of fear: roe deer are squeezed by contrasting pattern of predation
risk imposed by lynx and humans. Oikos 123, 641–651 (2014).
40. Chapron, G. et al. Recovery of large carnivores in Europe’s modern human-dominated landscapes. Science (80-) 346, 1517–1519
(2014).
41. Milanesi, P., Breiner, F. T., Puopolo, F. & Holderegger, R. European human-dominated landscapes provide ample space for the
recolonization of large carnivore populations under future land change scenarios. Ecography (Cop.) 40, 1359–1368 (2017).
42. Pascual-Rico, R. et al. Is diversionary feeding a useful tool to avoid human-ungulate conflicts? A case study with the aoudad. Eur.
J. Wildl. Res. 64, 1–7 (2018).
43. van Beest, F. M., Loe, L. E., Mysterud, A. & Milner, J. M. Comparative space use and habitat selection of moose around feeding
stations. J. Wildl. Manag. 74, 219–227 (2010).
Scientific Reports | (2021) 11:7600 | https://doi.org/10.1038/s41598-021-86720-2 10
Vol:.(1234567890)www.nature.com/scientificreports/
44. Jerina, K. Roads and supplemental feeding affect home-range size of Slovenian red deer more than natural factors. J. Mamm. 93,
1139–1148 (2012).
45. Ranc, N. et al. Preference and familiarity mediate spatial responses of a large herbivore to experimental manipulation of resource
availability. Scientific Reports 10, 11946 (2020).
46. Brown, R. D. & Robinson, D. A. Northern Hemisphere spring snow cover variability and change over 1922–2010 including an
assessment of uncertainty. Cryosphere 5, 219–229 (2011).
47. Schloss, C. A., Nuñez, T. A. & Lawler, J. J. Dispersal will limit ability of mammals to track climate change in the Western Hemi-
sphere. Proc. Natl. Acad. Sci. U. S. A. 109, 8606–8611 (2012).
48. Gurarie, E. et al. A framework for modelling range shifts and migrations: asking when, whither, whether and will it return. J. Anim.
Ecol. 86, 943–959 (2017).
49. Rivrud, I. M. et al. Leave before it’s too late: anthropogenic and environmental triggers of autumn migration in a hunted ungulate
population. Ecology 97, 1058–1065 (2016).
50. Courtois, R., Dussault, C., Potvin, F. & Daigle, G. Habitat selection by moose (Alces alces) in clear-cut landscapes. Alces 38, 177–192
(2002).
51. Gilbert, S. L., Hundertmark, K. J., Person, D. K., Lindberg, M. S. & Boyce, M. S. Behavioral plasticity in a variable environment:
snow depth and habitat interactions drive deer movement in winter. J. Mamm. 98, 246–259 (2017).
52. Chevin, L. M., Lande, R. & Mace, G. M. Adaptation, plasticity, and extinction in a changing environment: towards a predictive
theory. PLoS Biol. 8, e1000357 (2010).
53. Bauer, S. & Hoye, B. J. Migratory animals couple biodiversity and ecosystem functioning worldwide. Science (80-) 344, 1242552
(2014).
54. Mason, T. H. E., Stephens, P. A., Apollonio, M. & Willis, S. G. Predicting potential responses to future climate in an alpine ungulate:
Interspecific interactions exceed climate effects. Glob. Change Biol. 20, 3872–3882 (2014).
55. Carnevali, L., Pedrotti, L., Riga, F. & Toso, S. Banca dati ungulati: Status, distribuzione, consistenza, gestione e prelievo venatorio
delle popolazioni di ungulati in Italia. Rapporto 2001–2005 Vol. 117 (Biologia e Conservazione della Fauna, 2009).
56. Provincia Autonoma di Trento. Analisi delle consistenze e dei prelievi di ungulati, tetraonidi e coturnice. Stagione Venatoria 2018
(Provincia Autonoma di Trento, 2018).
57. Rockel, B., Will, A. & Hense, A. The regional climate model COSMO-CLM (CCLM). Meteorol. Z. 17, 347–348 (2008).
58. Boyce, M. S. & McDonald, L. L. Relating populations to habitats using resource selection functions. Trends Ecol. Evol. 14, 268–272
(1999).
59. Boyce, M. S., Vernier, P. R., Nielsen, S. E. & Schmiegelow, F. K. A. Evaluating resource selection functions. Ecol. Modell. 157,
281–300 (2002).
60. Benoit, T. & Achraf, E. suncalc: compute sun position, sunlight phases, moon position and lunar phase. R package version 0.5.0.
https://cran.r-project.org/package=suncalc (2019).
61. DeCesare, N. J. et al. Transcending scale dependece in identifying habitat with resource selection functions. Ecol. Appl. 22,
1068–1083 (2012).
62. Kendall, M. A new measure of rank correlation. Biometrika 30, 81–89 (1938).
63. Cohen, J. Weighted kappa: nominal scale agreement with provision for scaled disagreement or partial credit. Psychol. Bull. 70,
213–220 (1968).
64. Gamer, M., Lemon, J., Fellows, I. & Singh, P. irr: various coefficients of interrater reliability and agreement. R package version
0.84.1. https://cran.r-project.org/package=irr (2019).
65. Lele, S. R., Keim, J. L. & Solymos, P. ResourceSelection: resource selection (probability) functions for use-availability data. R pack-
age version 0.3-5. https://cran.r-project.org/package=ResourceSelection (2019).
66. Bivand, R., Keitt, T. & Rowlingson, B. rgdal: bindings for the ‘Geospatial’ Data Abstraction Library. R package version 1.4-8. https://
cran.r-project.org/package=rgdal (2019).
67. McLeod, A. I. Kendall: Kendall rank correlation and Mann-Kendall trend test. R package version 2.2. https://cran.r-project.org/
package=Kendall (2011).
68. Bright Ross, J. G., Peters, W., Ossi, F., Moorcroft P. R., Cordano, E., Eccel, E., Bianchini, F., Ramanzin, M., and Cagnacci, F. Datasets
for "Climate change and anthropogenic food manipulation interact in shifting the distribution of a large herbivore at its altitudinal
range limit." https://doi.org/10.5281/zenodo.4637674 (2021).
Acknowledgements
This paper represents a collaborative effort within the framework of the EURODEER project (paper no. 13 of
the EURODEER paper series, www.eurodeer.org). The co-authors are grateful to all EURODEER members for
their support throughout the project. The EURODEER spatial database is hosted by Fondazione Edmund Mach.
F. Cagnacci, F. Ossi and W. Peters thank the Wildlife and Forestry Service and the Trentino Hunting Association
for support and help during captures. Thanks to L. Zollo and P. Mercogliano (CMCC) for the use of climate sce-
narios. Travel for study was partially funded by a Herchel Smith Fellowship and a Harvard University Museum of
Comparative Zoology Grant-In-Aid of Undergraduate Research, for which J. Bright Ross extends his most sincere
thanks. F. Cagnacci was supported by the Sarah and Daniel Hrdy Fellowship (2015–2016 at Harvard University
OEB) during part of the development of this manuscript. The majority of this analysis was undertaken as part of
J. Bright Ross’ undergraduate thesis with the Harvard University Department of Organismic and Evolutionary
Biology. Lastly, the authors are grateful to the two anonymous reviewers whose suggestions improved the clarity
and impact of this manuscript.
Author contributions
F.C., W.P., and F.O. conceived the concept; F.O., M.R., and F.B. collected the data; J.B., W.P., and F.C. designed
the methodology; J.B., W.P., and E.C. conducted the analysis; E.C. and E.E. generated climatological data; J.B.,
F.C., F.O., W.P., and P.M. led the writing of the manuscript. All authors contributed critically to drafts of the
manuscript and approved the final version for publication.
Competing interests
The authors declare no competing interests.
Additional information
Supplementary Information The online version contains supplementary material available at https://doi.org/
10.1038/s41598-021-86720-2.
Scientific Reports | (2021) 11:7600 | https://doi.org/10.1038/s41598-021-86720-2 11
Vol.:(0123456789)www.nature.com/scientificreports/
Correspondence and requests for materials should be addressed to J.G.B.R.
Reprints and permissions information is available at www.nature.com/reprints.
Publisher’s note Springer Nature remains neutral with regard to jurisdictional claims in published maps and
institutional affiliations.
Open Access This article is licensed under a Creative Commons Attribution 4.0 International
License, which permits use, sharing, adaptation, distribution and reproduction in any medium or
format, as long as you give appropriate credit to the original author(s) and the source, provide a link to the
Creative Commons licence, and indicate if changes were made. The images or other third party material in this
article are included in the article’s Creative Commons licence, unless indicated otherwise in a credit line to the
material. If material is not included in the article’s Creative Commons licence and your intended use is not
permitted by statutory regulation or exceeds the permitted use, you will need to obtain permission directly from
the copyright holder. To view a copy of this licence, visit http://creativecommons.org/licenses/by/4.0/.
© The Author(s) 2021
Scientific Reports | (2021) 11:7600 | https://doi.org/10.1038/s41598-021-86720-2 12
Vol:.(1234567890)You can also read