Early detection of amyloid load using 18F-florbetaben PET
←
→
Page content transcription
If your browser does not render page correctly, please read the page content below
Bullich et al. Alzheimer's Research & Therapy           (2021) 13:67
https://doi.org/10.1186/s13195-021-00807-6

 RESEARCH                                                                                                                                            Open Access

Early detection of amyloid load using
18
   F-florbetaben PET
Santiago Bullich1*† , Núria Roé-Vellvé1†, Marta Marquié2,3, Susan M. Landau4, Henryk Barthel5,
Victor L. Villemagne6,7, Ángela Sanabria2,3, Juan Pablo Tartari2, Oscar Sotolongo-Grau2, Vincent Doré7,8,
Norman Koglin1, Andre Müller1, Audrey Perrotin1, Aleksandar Jovalekic1, Susan De Santi9, Lluís Tárraga2,3,
Andrew W. Stephens1, Christopher C. Rowe7, Osama Sabri5, John P. Seibyl10 and Mercè Boada2,3

  Abstract
  Background: A low amount and extent of Aβ deposition at early stages of Alzheimer’s disease (AD) may limit the
  use of previously developed pathology-proven composite SUVR cutoffs. This study aims to characterize the
  population with earliest abnormal Aβ accumulation using 18F-florbetaben PET. Quantitative thresholds for the early
  (SUVRearly) and established (SUVRestab) Aβ deposition were developed, and the topography of early Aβ deposition
  was assessed. Subsequently, Aβ accumulation over time, progression from mild cognitive impairment (MCI) to AD
  dementia, and tau deposition were assessed in subjects with early and established Aβ deposition.
  Methods: The study population consisted of 686 subjects (n = 287 (cognitively normal healthy controls), n = 166
  (subjects with subjective cognitive decline (SCD)), n = 129 (subjects with MCI), and n = 101 (subjects with AD
  dementia)). Three categories in the Aβ-deposition continuum were defined based on the developed SUVR cutoffs:
  Aβ-negative subjects, subjects with early Aβ deposition (“gray zone”), and subjects with established Aβ pathology.
  Results: SUVR using the whole cerebellum as the reference region and centiloid (CL) cutoffs for early and
  established amyloid pathology were 1.10 (13.5 CL) and 1.24 (35.7 CL), respectively. Cingulate cortices and
  precuneus, frontal, and inferior lateral temporal cortices were the regions showing the initial pathological tracer
  retention. Subjects in the “gray zone” or with established Aβ pathology accumulated more amyloid over time than
  Aβ-negative subjects. After a 4-year clinical follow-up, none of the Aβ-negative or the gray zone subjects
  progressed to AD dementia while 91% of the MCI subjects with established Aβ pathology progressed. Tau
  deposition was infrequent in those subjects without established Aβ pathology.
  (Continued on next page)

* Correspondence: s.bullich@life-mi.com
†
 Santiago Bullich and Núria Roé-Vellvé contributed equally to this work.
1
 Life Molecular Imaging GmbH, Tegeler Str. 6-7, 13353 Berlin, Germany
Full list of author information is available at the end of the article

                                         © The Author(s). 2021 Open Access This article is licensed under a Creative Commons Attribution 4.0 International License,
                                         which permits use, sharing, adaptation, distribution and reproduction in any medium or format, as long as you give
                                         appropriate credit to the original author(s) and the source, provide a link to the Creative Commons licence, and indicate if
                                         changes were made. The images or other third party material in this article are included in the article's Creative Commons
                                         licence, unless indicated otherwise in a credit line to the material. If material is not included in the article's Creative Commons
                                         licence and your intended use is not permitted by statutory regulation or exceeds the permitted use, you will need to obtain
                                         permission directly from the copyright holder. To view a copy of this licence, visit http://creativecommons.org/licenses/by/4.0/.
                                         The Creative Commons Public Domain Dedication waiver (http://creativecommons.org/publicdomain/zero/1.0/) applies to the
                                         data made available in this article, unless otherwise stated in a credit line to the data.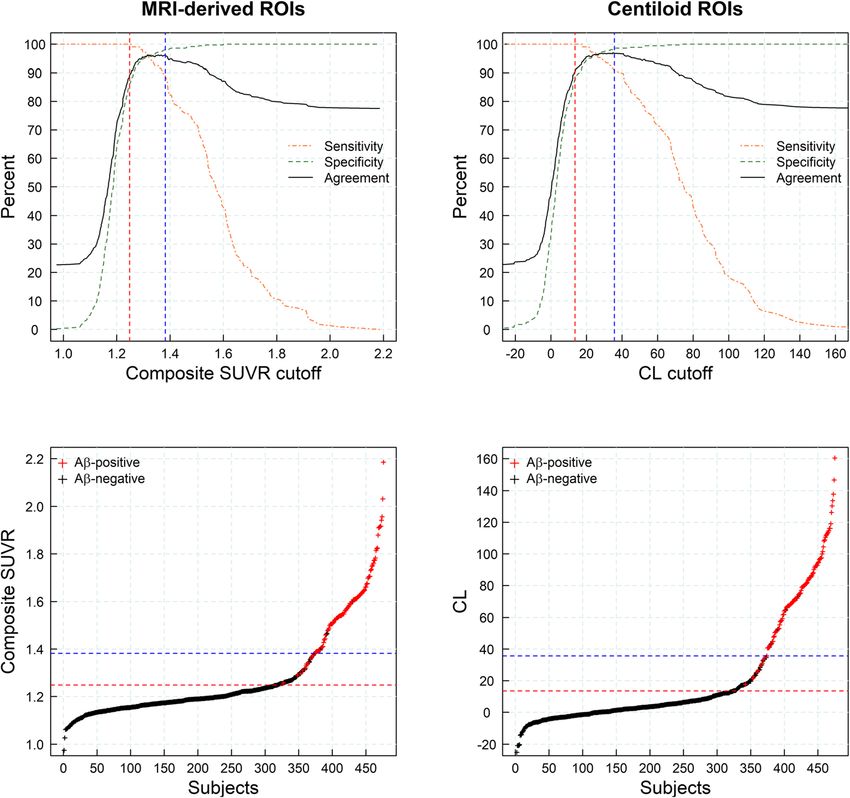
Bullich et al. Alzheimer's Research & Therapy   (2021) 13:67                                                    Page 2 of 15

  (Continued from previous page)
  Conclusions: This study supports the utility of using two cutoffs for amyloid PET abnormality defining a “gray
  zone”: a lower cutoff of 13.5 CL indicating emerging Aβ pathology and a higher cutoff of 35.7 CL where amyloid
  burden levels correspond to established neuropathology findings. These cutoffs define a subset of subjects
  characterized by pre-AD dementia levels of amyloid burden that precede other biomarkers such as tau deposition
  or clinical symptoms and accelerated amyloid accumulation. The determination of different amyloid loads,
  particularly low amyloid levels, is useful in determining who will eventually progress to dementia. Quantitation of
  amyloid provides a sensitive measure in these low-load cases and may help to identify a group of subjects most
  likely to benefit from intervention.
  Trial registration: Data used in this manuscript belong to clinical trials registered in ClinicalTrials.gov (NCT009283
  04, NCT00750282, NCT01138111, NCT02854033) and EudraCT (2014-000798-38).
  Keywords: Florbetaben, PET, Amyloid-beta, Subjective memory complainers, Mild cognitive impairment, Alzheimer’s
  disease

Background                                                     discriminating between subjects with established Aβ
Extracellular amyloid-beta (Aβ) aggregates are a key           pathology (e.g., AD) and other populations (e.g., cogni-
pathologic hallmark of Alzheimer’s disease (AD) [1]. Ag-       tively normal elderly subjects). Therefore, these global
gregation of Aβ is a slow and protracted process which         SUVR cutoffs are not optimal to detect the earliest ab-
may extend for more than two decades before the onset          normal pathophysiological accumulation of amyloid load
of clinical symptoms [2]. The lack of success of anti-Aβ       and do not provide topographical information. In
therapeutic clinical trials in reducing the cognitive de-      addition, several studies have shown that measures of
cline in AD [3, 4] has encouraged investigators to start       Aβ deposition below a threshold of established Aβ path-
intervention at the earliest possible phase when abnor-        ology carry critical information on initial pathological
malities in amyloid biomarkers are detectable even at          brain changes and may indicate appropriate time periods
the asymptomatic stage [5–8].                                  for interventions [19]. Moreover, the regional evolution
   Amyloid positron emission tomography (PET) with             of Aβ load may enable earlier identification of subjects
18
   F-florbetaben is an established biomarker of Aβ depos-      in the AD pathologic continuum and may overcome di-
ition [9]. Visual assessment of 18F-florbetaben PET is         chotomous measures [20]. Regional information has
used in the clinical setting to estimate Aβ neuritic           shown to be relevant in staging Aβ pathology [21–23],
plaque density and to classify scans as Aβ-positive or         tracking disease progression, and assessing the risk of
Aβ-negative. Visual assessment was validated against           cognitive decline [23–25].
histopathological confirmation of the presence of Aβ de-          The aim of this study was to characterize the popula-
position [9, 10], but it is dichotomous and may lack sen-      tion with the earliest abnormal pathophysiological Aβ
sitivity to assess longitudinal changes. In the research       accumulation using 18F-florbetaben PET and to identify
setting, a quantitative approach using composite stan-         those subjects that will likely accumulate Aβ over time.
dardized uptake value ratios (SUVRs) calculated from se-       To this end, a sample of young cognitively normal sub-
lected cerebral cortical areas is currently being used as a    jects (20–40 years) scanned with 18F-florbetaben PET
screening tool in clinical trials and is able to detect Aβ     was used to develop regional SUVR cutoffs to detect
changes either in clinical trials after an anti-Aβ drug is     early Aβ accumulation. Subsequently, the topography of
administered or in longitudinal observational studies          abnormal Aβ accumulation, Aβ accumulation over time,
[11]. 18F-Florbetaben PET SUVR abnormality cutoffs             progression to AD dementia, and tau deposition were
have also been developed to accurately categorize scans        assessed in older cognitively impaired or cognitively un-
[12]. An SUVR abnormality cutoff of 1.478 in a global          impaired individuals with early and established Aβ
cortical composite region relative to the cerebellar cor-      accumulation.
tex was developed using histopathological confirmation
as the standard of truth providing excellent sensitivity       Materials and methods
(89.4%) and specificity (92.3%) to detect established Aβ       Participants
pathology [9]. Other groups have developed other SUVR          The study population consisted of 686 subjects who
abnormality cutoffs for 18F-florbetaben PET ranging            underwent at least one 18F-florbetaben PET and T1-
from 1.38 to 1.45 using different populations, analytical      weighted MRI scans in established research cohort stud-
methods, and standards of truth [10, 12–18]. These             ies summarized in Table 1. The clinical diagnosis of the
SUVR cutoffs, however, were developed with the aim of          study participants included young and cognitively
Bullich et al. Alzheimer's Research & Therapy          (2021) 13:67                                                                                  Page 3 of 15

Table 1 Summary of the participants in the study
Dataset         Source                   Clinical         Number Age              M/F      Methods
identifier                               diagnosis
#1              NCT00928304†             yHC              65          27.4 ± 5.1 25/40     Sample of yHC (20–40 yrs) that underwent a 18F-florbetaben
                                                                                           PET scan. This subset was used to develop an SUVR cutoff for
                                                                                           early Aβ accumulation.
#2              NCT00750282 [13]         eHC              66          68.0 ± 6.9 28/38     All subjects underwent a 18F-florbetaben PET scan. This subset
                                         AD               73          71.0 ± 7.9 41/32     was used to develop an SUVR cutoff for established Aβ pathology
                                                                                           using ROC analysis.
#3              EudraCT: 2014-           SCD              168         64.9 ± 7.3 65/103 SCD patients from the Fundació ACE Healthy Brain Initiative
                000798-38 [26]                                                          (FACEHBI) study that underwent two 18F-florbetaben PET scans
                                                                                        at baseline and after 2 years. This subset was used to assess the
                                                                                        Aβ accumulation over time.
#4              NCT01138111 [18]         MCI              44          72.6 ± 6.6 28/16     MCI subjects that underwent three 18F-florbetaben PET scans at
                                                                                           baseline (n = 44), 1 yr (n = 40), and 2 yrs (n = 35) and a 4-year
                                                                                           clinical follow-up. This subset was used to assess the Aβ
                                                                                           accumulation over time and conversion to AD.
#5              NCT02854033              eHC              157         70.6 ± 6.1 62/95     Subjects from the ADNI3 study that underwent a 18F-florbetaben
                (ADNI3‡)                 MCI              85          71.7 ± 8.1 47/38     PET and a 18F-flortaucipir PET. This subset was used to assess
                                         AD               28          71.3 ± 7.0 18/10     the association between Aβ and tau deposition.
†
 Unpublished methods on the sample of yHC are provided in the supplemental material 1
‡
 Part of the data used in the preparation of this article were obtained from the Alzheimer’s Disease Neuroimaging Initiative (ADNI) database (adni.loni.usc.edu).
The ADNI was launched in 2003 as a public-private partnership, led by Principal Investigator Michael W. Weiner, MD. The primary goal of ADNI has been to test
whether serial magnetic resonance imaging, positron emission tomography, other biological markers, and clinical and neuropsychological assessment can be
combined to measure the progression of mild cognitive impairment and early Alzheimer’s disease. For up-to-date information, see www.adni-info.org
Abbreviations: yHC young healthy controls, eHC elderly healthy controls, AD Alzheimer’s disease dementia, SCD subjective cognitive decline, MCI mild cognitive
impairment, SUVR standardized uptake value ratio, PET positron emission tomography, M male, F female, Aβ amyloid-beta, ROC receiver operating characteristic

normal healthy controls (20–40 years) (yHC, n = 65), eld-                           publication of the studies used (Table 1). In short, all
erly healthy controls (eHC, n = 223), subjects with sub-                            subjects underwent a 20-min PET scan (4 × 5 min dy-
jective cognitive decline (SCD, n = 168), subjects with                             namic frames) starting at least 90 min after intraven-
mild cognitive impairment (MCI, n = 129), and subjects                              ous injection of 300 MBq ± 20% of 18F-florbetaben
with AD dementia (n = 101). The sample of yHC (n =                                  followed by a 10-mL saline flush. PET scans were re-
65) (dataset #1) was used to develop an SUVR cutoff for                             constructed using Ordered Subsets Expectation
early Aβ accumulation. A sample of eHC (n = 66) and                                 Maximization (OSEM) algorithm using 4 iterations
AD (n = 73) subjects (dataset #2) was used to develop an                            and 16 subsets (zoom = 2) or comparable reconstruc-
SUVR cutoff for established Aβ pathology using ROC                                  tion. Corrections were applied for attenuation, scatter,
analysis. A subset of participants with SCD and MCI                                 randoms, and dead time. Three-dimensional volumet-
(n = 212) (datasets #3 and #4) underwent two or three                               ric T1-weighted brain magnetic resonance imaging
18
   F-florbetaben PET scans to assess Aβ deposition over                             (MRI) data was also collected. Then, a Gaussian
time. A subset of MCI subjects (datasets #4) that under-                            smoothing kernel was applied to all the scans to
went three 18F-florbetaben PET scans at baseline (n =                               bring the 18F-florbetaben PET images from different
44), 1 year (n = 40), and 2 years (n = 35) and a 4-year                             scanner models to a uniform 8 × 8 × 8 mm spatial
clinical follow-up was used to assess conversion to AD                              resolution. The Gaussian smoothing kernel for each
dementia in addition to Aβ deposition over time. An-                                scanner was determined using previously acquired
other subset of participants (dataset #5) (n = 157 (eHC),                           Hoffman brain phantoms [27]. Image analysis of 18F-
n = 85 (MCI), n = 28 (AD)) underwent a 18F-flortaucipir                             florbetaben PET scans was conducted using SPM8
PET in addition to the 18F-florbetaben PET to assess the                            (https://www.fil.ion.ucl.ac.uk/spm/software/spm8/).
association between Aβ and tau deposition. Subjects                                 Motion correction was performed on each PET frame,
from the ADNI study were not assessed visually. The                                 and an average PET image was generated. Then, the
demographic characteristics of the samples and image                                average PET scan was co-registered to its associated
acquisition methods are summarized in Table 1 and sup-                              T1-weighted MRI scan. Subsequently, the MRI image
plemental material 1.                                                               was segmented into gray matter, white matter, and
                                                                                    cerebrospinal fluid, and spatially normalized to the
Image analysis                                                                      standard MNI (Montreal Neurological Institute) space.
18
  F-Florbetaben acquisition and image processing                                    The normalization transformation was applied to the
Details on the PET image acquisition and reconstruc-                                co-registered PET scans and gray matter probability
tion are provided in the respective original                                        maps.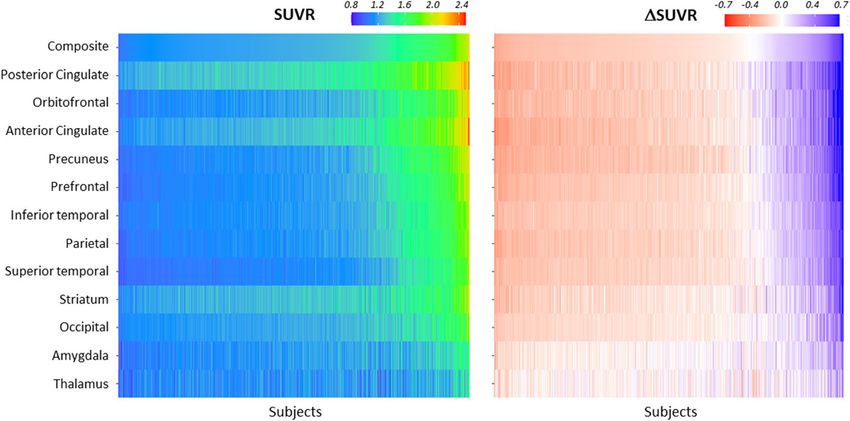
Bullich et al. Alzheimer's Research & Therapy   (2021) 13:67                                                      Page 4 of 15

MRI-derived ROIs Regions of interest (ROIs) were de-             analysis of 18F-flortaucipir PET scans was performed
fined as the intersection between the standard Auto-             using the same methods described for 18F-florbetaben
mated Anatomic Labeling (AAL) atlas [28] and the                 PET analysis. Cortical ROIs extracted from the AAL
normalized gray matter segmentation map thresholded              atlas included the mesial temporal (average of amygdala,
at a probability level of 0.2. ROIs included the cerebellar      hippocampus, and parahippocampus), fusiform gyrus, in-
gray matter and frontal (orbitofrontal and prefrontal),          ferior lateral temporal, parietal cortices, and cerebellar
lateral temporal (inferior and superior), occipital, par-        gray matter. SUVR was calculated as the ratio of the ac-
ietal, precuneus, anterior cingulate, posterior cingulate,       tivity in the cortical ROIs to the activity in the reference
striatum, amygdala, and thalamus. Mean radioactivity             region (cerebellar gray matter excluding vermis and an-
values were obtained from each ROI without correction            terior lobe cerebellar surrounding the vermis).
for partial volume effects applied to the PET data. SUVR
was calculated as the ratio of the activity in the target
ROI to the activity in the reference region ROI (cerebel-        Visual assessment
lar gray matter). A composite SUVR was calculated by             Amyloid PET scans from a subset of 416 participants
unweighted averaging the SUVR of the 6 cortical regions          (n = 65 (yHC), n = 66 (eHC), n = 168 (SCD), n = 44
(frontal, lateral temporal, occipital, parietal, anterior, and   (MCI), n = 73 (AD)) (datasets #1, #2, #3, and #4) were
posterior cingulate cortices) [29].                              visually assessed by independent blinded readers using
                                                                 the method described in Seibyl et al. [10]. The readers
Calibration to centiloid (CL) scale Given that SUVR              were blinded to any structural information (CT or MRI)
values may depend on the tracer used and analytical              and different for each of the studies included in the
methods, all the analysis of this paper were provided in         manuscript. The subjects used to generate cutoffs for
CL scale to make the cutoffs useful to other groups or           the detection of established Aβ amyloid pathology (data-
when using other amyloid tracers. Centiloid (CL) values          set #2) and MCI subjects (dataset #4) were read by 3 in-
were calculated for each 18F-florbetaben PET using the           dependent blinded readers with previous experience
method described by Klunk et al. [30]. ROIs downloaded           reading FBB scans and the final assessment was based
from the Global Alzheimer’s Association Interactive              on the majority read (i.e., agreement of the majority of
Network (GAAIN) website (http://www.gaain.org) for               readers).
the cerebral cortex and the whole cerebellum were ap-
plied to the normalized 18F-florbetaben PET. Cortical            SUVR cutoff development and definition of the gray zone
SUVR was calculated as the ratio of the activity in the          Development of an SUVR cutoff for the detection of early
cortex to the activity in the reference region ROI (whole        Aβ deposition (SUVRearly)
cerebellum). Finally, the CL values were calculated (CL =        A group of visually Aβ-negative cognitively normal yHC
 153.4 ⋅ SUVR − 154.9) [31]. The in-house implementa-            (dataset #1) were used to develop an SUVR cutoff to de-
tion of the standard CL analysis was validated using data        tect early amyloid deposition. A Shapiro-Wilk test was
freely accessible at the GAAIN website (http://www.              applied to ascertain that the distribution of each regional
gaain.org). SUVRs and CL values from the validation              SUVR was not significantly different from the Gaussian
dataset were compared by means of linear correlation to          distribution. Then, the regional SUVRearly cutoffs were
those reported by Klunk et al. [30] (SUVRKlunk, CLKlunk).        calculated as 2 standard deviations above the mean
The in-house implementation of standard CL analysis              SUVR of the yHC.
passed all the validation criteria described by Klunk
et al. [30] being SUVR = 1.01 SUVRKlunk − 0.01 (R2 =
0.998) and CL = 1.00 CLKlunk + 0.00 (R2 = 1.00) the re-          Development of an SUVR cutoff for the detection of
gression lines when the whole cerebellum was used as             established Aβ pathology (SUVRestab)
the reference region.                                            The established pathology SUVR cutoff was derived
                                                                 using receiver operating characteristic (ROC) analysis to
18
  F-Flortaucipir (18F-AV1451) acquisition and image              ascertain the optimal threshold for the sensitivity and
processing                                                       specificity calculation on a sample of visually Aβ-
Details on the PET image acquisition and reconstruction          negative eHC and visually Aβ-positive AD dementia pa-
are provided in ADNI3 PET technical procedures man-              tients (dataset #2) [13]. The SUVR that provided the
ual (https://adni.loni.usc.edu/wp-content/uploads/2012/1         highest Youden’s index (sensitivity + specificity − 1) was
0/ADNI3_PET-Tech-Manual_V2.0_20161206.pdf).           In         selected. In cases that several SUVR provided the same
short, all subjects underwent a 30-min PET scan (6 × 5           Youden’s index, the SUVR with higher specificity was se-
min dynamic frames) starting at 75 min after intravenous         lected. Global visual assessment as described by Seibyl
injection of 370 MBq ± 10% of flortaucipir. Image                et al. was used as the standard of truth [10].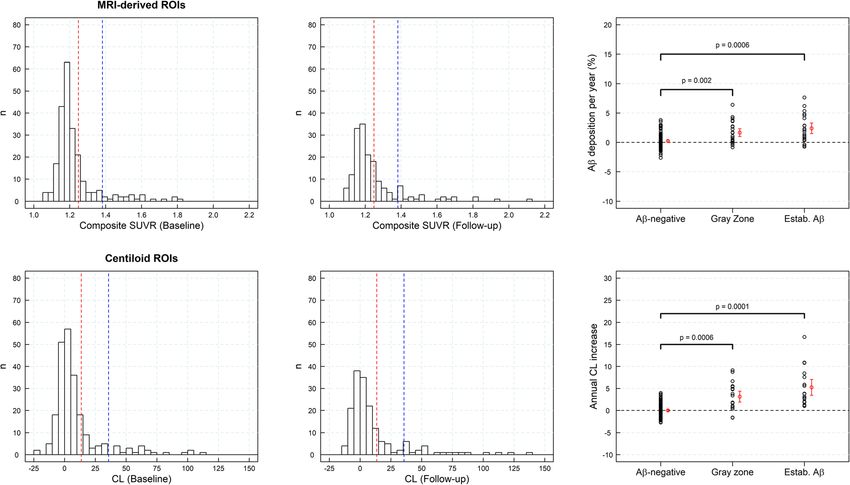
Bullich et al. Alzheimer's Research & Therapy      (2021) 13:67                                                     Page 5 of 15

Definition of the “gray zone”                                     subjects with AD dementia and negative values in those
Given the developed SUVR cutoffs, three groups were               subjects and regions that are close to SUVR of yHC.
defined within the SUVR continuum: Aβ-negative sub-               ΔSUVR score was compared across regions. Those re-
jects (SUVR < SUVRearly), early Aβ deposition or “gray            gions that reached half of the maximum amyloid carry-
zone” (SUVRearly ≤ SUVR ≤ SUVRestab), and Aβ-positive             ing capacity (ΔSUVR = 0) earlier were considered the
subjects with established amyloid pathology (SUVRestab <          regions that show earliest amyloid deposition. Amygdala,
 SUVR).                                                           thalamus, and striatum, which have a limited dynamic
                                                                  SUVR range between yHC and subjects with AD demen-
Characterization of earliest in vivo signal and SUVR cutoff       tia due to low tracer accumulation, were not included in
assessment                                                        the interpretation of ΔSUVRs.
Characterization of earliest in vivo signal in amyloid PET
images and topographical distribution
Given that each brain region may have different non-              Assessment of Aβ accumulation
specific binding and dynamic SUVR ranges, direct com-             In this study, it was hypothesized that subjects with
parison of SUVR across regions cannot be used to ex-              SUVR in the “gray zone” are in the initial stages of
tract the regions showing the earliest amyloid                    Aβ accumulation. To test this hypothesis, Aβ accu-
deposition. The assessment of early amyloid deposition            mulation was assessed in two samples of SCD and
assumed that amyloid accumulation follows a logistic              MCI subjects with longitudinal 18F-florbetaben PET
growth [32]:                                                      scans (datasets #3 and #4). To estimate the annual
                                                                  SUVR increase, a linear regression model was fitted
                                   K                              to each subject’s data, SUVR = α ⋅ t + β, where α and
    SUVRðt Þ ¼ NS þ
                           1þ   e − rðt − T 50 Þ                  β are the coefficients of the model, and t is the scan
                                                                  time in years. The annual SUVR increase was ob-
where t is the time through the accumulation process,             tained from α. The percent of Aβ deposition per year
SUVR(t) is the regional SUVR at time t, NS is the tracer          (Aβdep) was determined as Aβdep = 100 ⋅ α/SUVRB
non-specific binding, r is the exponential uninhibited            where SUVRB is the SUVR at baseline. Subsequently,
growth rate, K is the carrying capacity, and T50 is the           the average annual SUVR increase (α) in each sample
time of half-maximal Aβ carrying capacity. NS, K, r, and          was tested statistically by means of a t-test to demon-
T50 could be different for each region. However, the lo-          strate that those subjects in the “gray zone” are in
gistic growth model could not be fitted given the cross-          the process of accumulating Aβ (i.e., (H0 : α = 0; H1 :
sectional nature of the data used in this work (i.e., indi-       α > 0). Likewise, annual CL increase (αCL) was esti-
vidual times through the accumulation process are un-             mated using a linear regression model fitted to each
known). Instead, half of the maximum amyloid carrying             subject’s data, CL = αCL t + βCL, where αCL and βCL
capacity (SUVR(t = T50)) reached when t = T50 was used            are the coefficients of the model and t is the scan
to identify those regions that show earliest amyloid sig-         time in years.
nal using PET. In this study, it was hypothesized that
T50 will be smallest in regions with early amyloid
deposition.                                                       Assessment of tau deposition
                                                                  In subjects that underwent a tau PET scan (dataset #5),
                           K                                      18
                                                                     F-flortaucipir SUVR (mean ± SD) was estimated in the
    SUVRðt ¼ T 50 Þ ¼ NS þ
                           2                                      three cutoff-based groups (Aβ-negative subjects, subjects
where NS was estimated from the regional mean SUVR                in the “gray zone”, and Aβ-positive subjects with estab-
of the visually Aβ-negative yHCs (NS=SUVRyHC) and K               lished amyloid pathology) and compared by means of a
was estimated from the difference between the regional            t-test.
mean of visually Aβ-positive AD dementia subjects
(SUVRAD) and SUVRyHC (K = SUVRAD − SUVRyHC).                      Sensitivity of visual assessment to detect early amyloid
                            SUVRAD þ SUVRyHC                      accumulation
    SUVRðt ¼ T 50 Þ ¼                                             In those subjects assessed visually (datasets #1, #2, #3,
                                   2
                                                                  and #4), the proportion of visually Aβ-positive scans was
  Then, a regional ΔSUVR was derived to characterize              estimated in the three cutoff-based groups (Aβ-negative
the location of a subject in the AD continuum as fol-             subjects, subjects in the “gray zone”, and Aβ-positive
lows: ΔSUVR = SUVR − SUVR(t = T50). The ΔSUVR                     subjects with established amyloid pathology) to assess
takes positive values in those subjects and regions that          the sensitivity of visual assessment to detect early amyl-
are above SUVR(t = T50) and close to the SUVR of                  oid accumulation.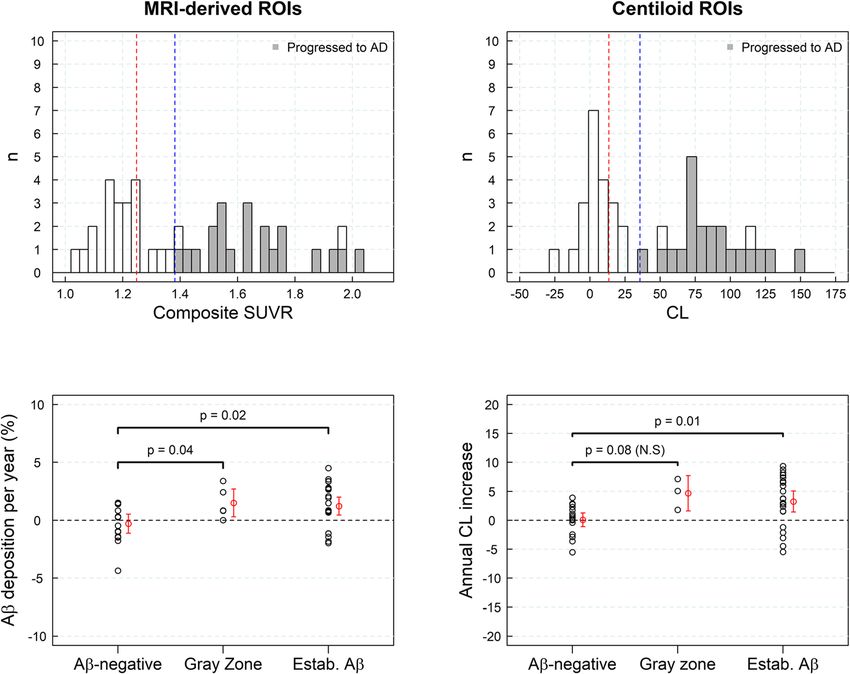
Bullich et al. Alzheimer's Research & Therapy           (2021) 13:67                                                              Page 6 of 15

Results                                                                           by means of ΔSUVR (ΔSUVR = SUVR − SUVR(t =
Development of SUVRearly cutoff                                                   T50)) to determine the regions that show earliest
A sample of cognitively normal yHC was used to de-                                amyloid accumulation (Fig. 3, right panel). Cingulate
velop the SUVR cutoff to detect early amyloid depos-                              cortices (anterior and posterior), precuneus, and orbi-
ition. The distribution of SUVRs in yHC did not                                   tofrontal were the regions that first showed patho-
statistically differ from a Gaussian distribution being the                       logical Aβ PET tracer retention followed by
Shapiro-Wilk test non-significant (p > 0.05) in any of the                        prefrontal, inferior lateral temporal, parietal, and oc-
regions analyzed (Fig. 1, Table 2). The composite SUVR                            cipital cortices (Fig. 3, right panel). Other regions that
using MRI-derived ROIs in the yHC was 1.16 ± 0.04                                 showed tracer retention and differences from yHC
(mean ± SD) resulting in a SUVRearly cutoff of 1.25                               were the striatum and the amygdala.
(Fig. 1, Table 2). The determined SUVRearly cutoff dif-
fered across regions ranging from 1.15 (lateral temporal
cortex) and 1.45 (posterior cingulate cortex) (Table 2).                          Aβ deposition in subjects with SCD
When the standard CL ROIs were applied, the mean of                               SUVR histograms derived from a sample of subjects with
the yHC was 1.03 ± 0.03 (2.82 ± 5.36 CL) and the result-                          SCD showed a peak coincident with the Gaussian func-
ing cutoff (CLearly) was 1.10 (13.5 CL) (Table 2).                                tion fitted to the sample of yHC with a tail with higher
                                                                                  SUVRs that increased numbers at follow-up (Fig. 4). The
Development of the SUVRestab cutoff                                               rate of amyloid accumulation increased significantly in
ROC analysis using visual assessment as the standard of                           those subjects with SUVR in the “gray zone” or with
truth resulted in SUVRestab cutoffs ranging from 1.26                             established Aβ deposition in comparison with Aβ-
(lateral temporal and parietal cortices) to 1.47 (posterior                       negative subjects (p < 0.002) (Fig. 4). The subjects with
cingulate cortex). The SUVR cutoff (MRI-derived ROIs)                             SUVRs in the “gray zone” and established Aβ deposition
for the composite region was 1.38 (Fig. 2, Table 3).                              had rates of Aβ accumulation statically different from
When the standard CL analysis was applied, the SUVRes-                            zero (p < 0.001) (1.66 ± 1.86%/year (composite) and
tab and CLestab cutoff obtained were 1.24 and 35.7 CL,                            2.40 ± 2.37%/year (composite), respectively) (Fig. 4, Table
respectively.                                                                     4). Similar results were obtained when the CL analysis
                                                                                  was used (1.81 ± 1.86 CL/year (p < 0.001)) (gray zone),
Earliest in vivo signal in amyloid PET images and                                 2.38 ± 1.82 CL/year (p < 0.001) (established Aβ path-
topographical distribution                                                        ology)). In general, the Aβ accumulation was signifi-
Posterior and anterior cingulate cortices followed by                             cantly larger for subjects in the gray zone and
precuneus, frontal, and inferior temporal cortices were                           established Aβ deposition than in Aβ-negative subjects
the regions that showed earlier elevated SUVR values                              (Fig. 4, Table 4).
(Fig. 3, left panel). However, given that each region
has a different non-specific uptake and SUVR dy-
namic range, the regional SUVRs were compared                                     Progression to AD dementia in MCI subjects
against the half maximum amyloid carrying capacity                                SUVR histograms obtained from the MCI subjects
                                                                                  showed a broad range of SUVRs (Fig. 5). In general, the
Table 2 SUVRs of yHC (dataset #1, n = 65) and cutoffs for the                     rate of amyloid accumulation increased significantly in
detection of early Aβ accumulation (between parenthesis)                          those subjects with SUVR in the “gray zone” or with
Method               Region                  SUVRyHC (cutoff)              p      established Aβ deposition in comparison with Aβ-
MRI-derived ROIs     Frontal                 1.09 ± 0.04 (1.16)            0.83   negative subjects (p < 0.05). However, the difference be-
                     Lateral temporal        1.09 ± 0.03 (1.15)            0.41   tween Aβ-negative subjects and subjects in the “gray
                     Occipital               1.18 ± 0.04 (1.26)            0.93   zone” did not reach statistical significance when CL
                     Parietal                1.12 ± 0.04 (1.20)            0.92
                                                                                  ROIs were used (Fig. 5). In the composite region, the
                                                                                  rate of Aβ accumulation in the “gray zone” (1.51 ±
                     Anterior cingulate      1.23 ± 0.07 (1.36)            0.13
                                                                                  1.38%/year (p = 0.04) and for “established Aβ deposition”
                     Posterior cingulate     1.28 ± 0.09 (1.45)            0.43   (1.23 ± 1.90%/year (p = 0.004)) was significantly different
                     Precuneus               1.12 ± 0.04 (1.21)            0.22   from zero (Fig. 5) while no accumulation was found in
                     Composite               1.16 ± 0.04 (1.25)            0.25   Aβ-negative subjects (− 0.29 ± 1.68%/year (p = 0.74))
CL ROIs              Cortex                  1.03 ± 0.03 (1.10)            0.32   (Table 5). None of the Aβ-negative subjects or subjects
                                             2.82 ± 5.36 CL (13.54 CL)            in the “gray zone” progressed to AD dementia after a 4-
yHC young healthy controls, SUVRyHC SUVR (mean ± SD) of the young healthy         year clinical follow-up. Twenty-one subjects (91%) with
controls, Aβ amyloid-beta, p p-values from the Shapiro-Wilk test to assess that   SUVR above SUVRestab progressed to AD dementia after
SUVR values are normally distributed (p < 0.05 = significant differences from
the normality)                                                                    4 years (Fig. 5).
Bullich et al. Alzheimer's Research & Therapy (2021) 13:67 Page 7 of 15
Fig. 1 Histograms of standardized uptake value ratios (SUVRs) and cortex centiloids (CLs) in young healthy controls (n = 65, dataset #1), fitted
Gaussian distribution (red), and SUVR cutoff derived for the detection of early Aβ pathology (red dashed line)
Association between Aβ load and tau deposition maximum agreement between visual assessment and
Figure 6 shows the association between amyloid load quantitative assessment was found for SUVR and CL
measured with 18F-florbetaben and tau load measured cutoffs in the upper range of the gray zone, while the
with [18F] flortaucipir (ρ = 0.35 (parietal)–0.54 (fusiform agreement decreased in the lower range of the gray zone
gyrus) (ρ: Spearman correlation coefficient); p < (Fig. 7).
0.0001) (Table 6, Fig. 6). Tau deposition was rarely ob-
served in Aβ-negative subjects and subjects in the gray Discussion
zone: (SUVR(18F-flortaucipir) =1.15 ± 0.08 (Aβ-negative), Currently, observational and interventional studies focus
1.16 ± 0.09 (gray zone) (Fusiform gyrus)), but increased on earlier stages of Aβ deposition, where established
in subjects with established Aβ pathology (SUVR(18F- SUVR cutoffs to discriminate AD dementia subjects
flortaucipir) = 1.35 ± 0.24 (Fusiform gyrus)) (Table 6). from elderly HC are of limited value. In this study, re-
gional and global quantitative SUVR cutoffs were devel-
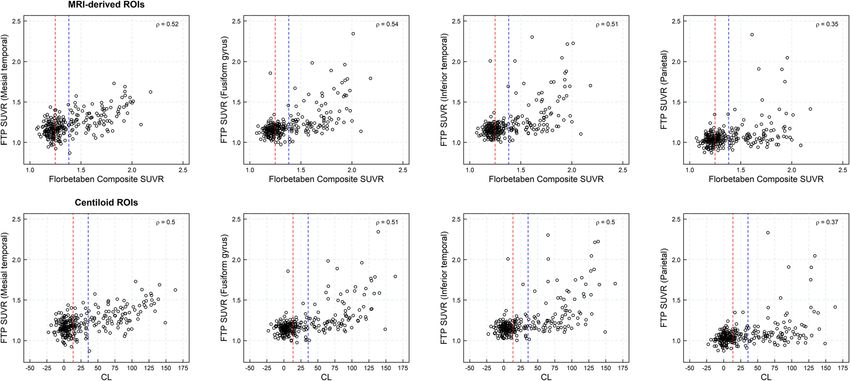
Sensitivity of visual assessment to detect early amyloid oped for the detection of early amyloid accumulation
accumulation and established Aβ pathology using 18F-florbetaben PET.
Most of the subjects with established Aβ pathology de- A gray zone was defined as the range of SUVR values in
fined either by SUVR (MRI-derived ROIs) or CL cutoffs subjects having higher SUVR than yHC and less than
were visually assessed as positive (93% and 95%, respect- the values previously used to define visual positivity in
ively), while all the subjects in the Aβ-negative group patients with AD dementia. The existence of a “gray
were visually assessed as negative (100%). In the gray zone” that may precede visual positivity and the feasibil-
zone, only 21.4% (MRI-derived ROIs) and 19.6% (CL) of ity of identifying subjects in the gray zone using 18F-flor-
the subjects were visually assessed as positive. The betaben PET were corroborated using two quantitativeBullich et al. Alzheimer's Research & Therapy (2021) 13:67 Page 8 of 15
Fig. 2 Receiver operating characteristic curves obtained using MRI-derived regions of interest (ROIs, left) and centiloid (right) used to derive
standardized uptake value ratio cutoffs for the established Alzheimer’s disease pathology from a group of elderly healthy controls (n = 66) and
subjects with AD dementia (n = 73, dataset #2)
methods (MRI-derived ROIs and CL ROIs). The popula- improve the detection of emerging Aβ pathology in ob-
tion in the “gray zone” represents early stages of Aβ de- servational, prevention, and therapeutic trials and is key
position characterized by accelerated Aβ accumulation for the screening of asymptomatic population in clinical
and pre-AD dementia levels of Aβ burden that may pre- trials and detection of subjects that will likely accumu-
cede the alteration of other biomarkers such as tau de- late amyloid. Subjects having amyloid values in the gray
position or clinical symptoms. Although assessment of zone may be the most likely to respond to pharmaco-
tau deposition using Flortaucipir PET in mesial temporal logical or non-pharmacological interventions because
structures could be biased due to adjacent choroid they have early evidence of disease without the cognitive
plexus uptake, the association between Aβ and tau was deficits and neuronal loss that signifies AD.
strong also in other regions assessed such as fusiform This study is in agreement with a number of recent
gyrus and inferior lateral temporal cortex. While the reports across different tracers converging to the util-
agreement between visual and quantitative assessments ity of using two cutoffs for amyloid PET abnormality,
was excellent for Aβ-negative subjects and subjects with an early cutoff around CL = 11–17 where pathology
established Aβ pathology, the agreement was modest in may be emerging, and a second around CL = 29–36
the “gray zone.” In these challenging cases, the use of where amyloid burden levels correspond to moderate
quantitation may help to detect subtle amyloid accumu- and frequent neuritic plaques (CERAD stages B–C,
lation. The appropriate definition of a “gray zone” can [33]) by neuropathology. Early cutoffs of 11, 14, and
Table 3 SUVRs of eHC (n = 66) and AD subjects (n = 73) (dataset #2) and cutoffs for the detection of established Aβ pathology
Method Region SUVReHC SUVRAD SUVRcutoff Sensitivity Specificity AUC
MRI-based ROIs Frontal 1.15 ± 0.07 1.57 ± 0.19 1.31 95% 97% 0.98
Lateral temporal 1.15 ± 0.05 1.51 ± 0.17 1.26 97% 98% 0.96
Occipital 1.20 ± 0.06 1.43 ± 0.16 1.29 88% 95% 0.94
Parietal 1.13 ± 0.08 1.51 ± 0.16 1.26 97% 98% 0.98
Anterior cingulate 1.28 ± 0.09 1.70 ± 0.22 1.43 92% 97% 0.98
Posterior cingulate 1.33 ± 0.09 1.77 ± 0.21 1.47 93% 97% 0.97
Precuneus 1.15 ± 0.08 1.60 ± 0.19 1.28 95% 98% 0.98
Composite 1.21 ± 0.06 1.58 ± 0.17 1.38 93% 100% 0.98
CL ROIs Cortex 1.05 ± 0.06 1.54 ± 0.22 1.24 95% 100% 0.98
6.8 ± 8.8 CL 81.0 ± 33.2 CL 35.7 CL
eHC elderly healthy controls, Aβ amyloid-beta, SUVReHC SUVR (mean ± SD) of the elderly healthy controls, SUVRAD SUVR (mean ± SD) of the Alzheimer’s disease
patients, AUC area under the receiver operating curve, SUVRcutoff SUVR cutoff obtained from the ROC analysis using visual assessment as standard of truth, MRI
magnetic resonance imaging, ROI region of interest, CL centiloidBullich et al. Alzheimer's Research & Therapy (2021) 13:67 Page 9 of 15 Fig. 3 Heat maps of standardized uptake value ratios (SUVRs, left) and ΔSUVRs (=SUVR − SUVR(t = T50)) (right) of all the participants in the analysis (n = 686, datasets #1, #2, #3, #4, and #5). Each column of the heat map represents one subject of the sample. The subjects were sorted according to their composite SUVR (increasing from left to right) 17 CL have been reported for the FACEHBI, ALFA+, denote established pathology [35]. Mormino et al. also and AMYPAD Prognostic and Natural History Study showed the biological relevance of slight 11C-PIB studies using Gaussian mixture models [34]. Similarly, elevations in elderly normal control subjects and Salvadó et al. identified two cutoffs based on a direct provided an estimate for the cutoffs defining the “gray comparison with established CSF Aβ42 thresholds: zone” using distribution volume ratios [36]. Finally, CL = 12 to rule out-amyloid pathology and CL = 29 to La Joie et al. and Doré et al. reported using Fig. 4 Histograms of composite standardized uptake value ratios (SUVRs) and centiloids (CLs) for the sample of subjective cognitive decline (SCD) (n = 168, dataset #3) subjects at baseline (first column) and at follow-up (central column). Red and blue lines represent the SUVR abnormality cutoffs for early Aβ detection and established Aβ pathology, respectively. The rate of Aβ accumulation in SCD (and 95% confidence interval in red) in three categories of the composite SUVR continuum (Aβ-negative, gray zone, and established Aβ deposition) is shown on the right column. ROI region of interest
Bullich et al. Alzheimer's Research & Therapy          (2021) 13:67                                                                                 Page 10 of 15

Table 4 Regional percent of Aβ deposition per year in a sample of subject with SCD (n = 168, dataset #3)
                                                              Percent Aβ deposition per year
Method                       Region                           Aβ-negative                         Gray zone                          Established Aβ pathology
MRI-based ROIs               Frontal                          − 0.01 ± 1.15 (p = 0.52)            1.08 ± 1.91 (p < 10−3)             2.72 ± 2.53 (p < 10−4)
                             Lateral temporal                 0.08 ± 0.99 (p = 0.21)              1.07 ± 1.61 (p < 10−4)             2.05 ± 2.18 (p < 10−3)
                                                                                 −3
                             Occipital                        0.36 ± 1.13 (p < 10 )               0.50 ± 1.74 (p = 0.38)             1.85 ± 2.18 (p < 10−3)
                             Parietal                         0.12 ± 1.29 (p = 0.16)              1.39 ± 2.10 (p = 0.02)             2.61 ± 2.28 (p < 10−5)
                             Anterior cingulate               0.17 ± 1.81 (p = 0.13)              1.42 ± 2.12 (p = 0.10)             2.37 ± 3.07 (p = 0.001)
                                                                                 −5
                             Posterior cingulate              0.71 ± 1.72 (p < 10 )               N.A                                3.14 ± 2.46 (p < 10−7)
                             Precuneus                        0.31 ± 1.37 (p = 0.006)             N.A                                N.A
                                                                                                                      −3
                             Composite                        0.24 ± 1.24 (p = 0.02)              1.66 ± 1.86 (p < 10 )              2.40 ± 2.37 (p < 10−3)
                                                                                                                      −3
CL                           Cortex                           0.00 ± 0.89 (p = 0.53)              1.81 ± 1.86 (p < 10 )              2.38 ± 1.82 (p < 10−4)
SCD subjective cognitive decline, N.A not available (As Aβ-negative, gray zone, and established Aβ pathology were defined regionally using cutoffs reported in
Tables 2 and 3, there were not enough regional standardized uptake values (SUVRs) to calculate percent Aβ deposition per year in some regions), Aβ amyloid-
beta, MRI magnetic resonance imaging, ROI region of interest, CL centiloid. p-values testing whether percent Aβ deposition per year is significantly larger than
zero are given in parenthesis

histopathological confirmation gray zones from 12.2–                                   followed by prefrontal, inferior lateral temporal parietal,
24.4 and 19–28 CLs, respectively [17, 37].                                             and occipital cortices. These results agree with previous
   This study also showed that topographical information                               publications using PET where precuneus, cingulate, and
can help identify increased signal earlier than traditional                            frontal cortices displayed higher PET signal earlier than
global cutoffs, with cingulate cortices (anterior and pos-                             the remaining neocortical regions [38–40]. However, re-
terior), precuneus, and orbitofrontal cortices being the                               cent publications suggest that other regions such as the
first regions to show pathological tracer retention,                                   banks of the superior temporal, not analyzed in this

  Fig. 5 Histograms of composite standardized uptake value ratios (SUVRs) and centiloids (CLs) for the sample of mild cognitive impairment (MCI)
  (n = 44, dataset #4) subjects are shown on the top row. Subjects that progressed to Alzheimer’s disease (AD) dementia after a 4-year clinical
  follow-up are shown in gray. Red and blue lines represent the SUVR abnormality cutoffs for early Aβ detection and established Aβ pathology,
  respectively. The rate of Aβ accumulation in MCI subjects (and 95% confidence interval in red) in three categories of the composite SUVR
  continuum: Aβ-negative, gray zone, and with established Aβ deposition, is shown on the bottom row. ROI region of interest
Bullich et al. Alzheimer's Research & Therapy (2021) 13:67 Page 11 of 15
Fig. 6 Scatter plots of Flortaucipir (FTP) standardized uptake value ratios (SUVRs) versus 18F-florbetaben composite SUVRs using MRI-based
regions of interest (ROIs, top row) and FTP SUVRs versus centiloids (CLs, bottom row) (n = 270, dataset #5). Red and blue lines represent the
composite SUVR abnormality cutoffs for early Aβ detection and established Aβ pathology, respectively
article, may also show early Aβ deposition and subjects volume effect), and quantitative methods used that may
with high Aβ in these regions are at increased risk of have an impact on the regional SUVR estimates. For this
cognitive decline [41]. Even though regions with “early” reason, topographically defined distribution and early Aβ
amyloid have been identified in this work, these early el- accumulation measured by PET may not necessarily
evations are subtle, occasionally may not be detectable agree with histopathology findings. Despite these dis-
at the individual level and the amyloid PET signal is crepancies with neuropathology results, several studies
highly correlated across all regions. These subtle differ- have shown the utility of amyloid PET topographical
ences across regions are consistent with some articles quantification in staging AD [21–23], determining the
reporting that a sigmoidal model fitting amyloid depos- risk of subsequent cognitive decline [23, 25], optimal
ition with the same T50 across brain regions is optimal subject selection for anti-amyloid interventional trials
[32]. In addition, amyloid PET is affected by several [22, 42], and reducing sample size in anti-amyloid inter-
technical factors such as the type of camera used, recon- ventional trials [43, 44]. Pascoal et al. also showed that
struction methods, corrections applied (e.g., partial the topographical pattern of individuals with MCI that
Table 5 Regional percent of Aβ deposition per year in a sample of MCI subjects (n = 44, dataset #4)
Percent Aβ deposition per year
Method Region Aβ-negative Gray zone Established Aβ pathology
MRI-based ROIs Frontal − 0.49 ± 2.52 (p = 0.73) 0.85 ± 2.20 (p = 0.19) 1.37 ± 2.02 (p = 0.002)
Lateral temporal 0.15 ± 1.83 (p = 0.40) 0.88 ± 1.58 (p = 0.08) 1.66 ± 1.90 (p < 10−3)
Occipital 0.30 ± 1.64 (p = 0.21) 0.24 ± 1.78 (p = 0.44) 0.94 ± 2.28 (p = 0.055)
Parietal − 0.48 ± 1.72 (p = 0.87) 1.39 ± 1.23 (p = 0.09) 1.12 ± 1.88 (p = 0.009)
Anterior cingulate − 0.79 ± 2.49 (p = 0.87) 0.97 ± 0.22 (p = 0.01) 0.76 ± 2.51 (p = 0.08)
Posterior cingulate 0.71 ± 1.41 (p = 0.04) N.A 1.58 ± 2.26 (p = 0.001)
Precuneus 0.01 ± 1.37 (p = 0.49) 1.24 ± 1.56 (p = 0.11) 1.44 ± 2.31 (p = 0.004)
Composite − 0.29 ± 1.68 (p = 0.74) 1.51 ± 1.38 (p = 0.04) 1.23 ± 1.90 (p = 0.004)
CL Cortex 0.08 ± 1.62 (p = 0.43) 2.62 ± 1.47 (p = 0.045) 1.41 ± 1.82 (p = 0.001)
MCI mild cognitive impairment, N.A not available (As Aβ-negative, gray zone, and established Aβ pathology were defined regionally using cutoffs reported in
Tables 2 and 3, there were not enough regional standardized uptake values (SUVRs) to calculate percent Aβ deposition per year in some regions), Aβ amyloid-
beta, MRI magnetic resonance imaging, ROI region of interest, CL centiloid. p-values testing whether percent Aβ deposition per year is significantly larger than
zero are given in parenthesisBullich et al. Alzheimer's Research & Therapy (2021) 13:67 Page 12 of 15
18
Table 6 Regional F-flortaucipir SUVRs by amyloid group (n = 270, dataset #5)
18
F-Flortaucipir SUVR
Method Region Aβ-negative Gray zone Established Aβ pathology
MRI-based ROI Mesial temporal 1.16 ± 0.09 1.18 ± 0.10 (p = 0.51) 1.32 ± 0.15 (p < 10−5)
Fusiform gyrus 1.15 ± 0.09 1.16 ± 0.08 (p = 0.91) 1.34 ± 0.24 (p < 10−5)
Inferior temporal 1.15 ± 0.10 1.17 ± 0.10 (p = 0.87) 1.32 ± 0.15 (p < 10−5)
Parietal 1.03 ± 0.07 1.05 ± 0.07 (p = 0.58) 1.15 ± 0.23 (p < 10−5)
CL Mesial temporal 1.16 ± 0.09 1.18 ± 0.11 (p = 0.45) 1.33 ± 0.15 (p < 10−5)
Fusiform gyrus 1.15 ± 0.08 1.16 ± 0.09 (p = 0.88) 1.35 ± 0.24 (p < 10−5)
Inferior temporal 1.15 ± 0.05 1.18 ± 0.11(p = 0.60) 1.38 ± 0.28 (p < 10−5)
Parietal 1.03 ± 0.06 1.06 ± 0.09 (p = 0.37) 1.16 ± 0.24 (p < 10−5)
SUVR F-flortaucipir SUVRs (mean ± SD), Aβ amyloid-beta, MRI magnetic resonance imaging, MRI magnetic resonance imaging, ROI region of interest, CL centiloid.
18
p-values using ANOVA to test whether 18F-flortaucipir SUVRs in each group are significantly larger than in Aβ-negative subjects are given in parenthesis
progress to dementia is “traditionally AD-like,” while SUVR is limited in determining the topographical distri-
that of non-converters includes more temporal and oc- bution of Aβ load.
cipital regions instead [24]. In this regard, even though As a limitation of this study, it should be mentioned
CL ROIs and composite SUVR from MRI-derived ROIs that SUVR cutoff for the detection of established amyl-
provided overall similar results when determining sub- oid pathology was derived using visual assessment as a
ject in the “gray zone,” the use of CL and composite standard of truth and this may bias the proportion of
Fig. 7 Sensitivities, specificities, and agreement rates between visual assessment and quantitative assessment when using several cutoffs to
dichotomize the sample (top row) and composite standardized uptake value ratio (SUVR) versus subject identifier (bottom row) (n = 416) (datasets
#1, #2, #3, and #4). Red and blue lines represent the composite SUVR abnormality cutoffs for early Aβ detection and established Aβ pathology,
respectively. ROI region of interest, CL centiloidBullich et al. Alzheimer's Research & Therapy (2021) 13:67 Page 13 of 15
visually positive scans per group. To clarify this potential A4, Pesini P7, Preckler S1, Roberto N1, Romero J7, Ramis M1, Rosende-Roca M1,
bias, a Gaussian mixture model was fitted to the whole Ruiz A1,2, Sarasa M7, Tejero MA5, Torres M6, Valero S1,2, Vargas L1, Vivas A5.
(1Fundacio ACE Institut Català de Neurociències Aplicades, Research Center
population of the study (datasets #1, #2, #3, #4, and #5) and Memory Unit – Universitat Internacional de Catalunya. Barcelona, Spain;
confirming the cutoffs previously reported in the manu- 2
CIBERNED, Center for Networked Biomedical Research on Neurodegenera-
script (14 and 32 CL), proportion of positive scans per tive Diseases, National Institute of Health Carlos III, Ministry of Economy and
Competitiveness, Spain. 3Cognitive Neurology and Aphasia Unit (UNCA). Uni-
group and accurate definition of the “gray zone” (supple- versity of Malaga. 4Servei de Medicina Nuclear, Hospital Clínic i Provincial,
mental material 2). A second limitation is that SUVR Barcelona, Spain; 5Departament de Diagnòstic per la Imatge. Clínica Cora-
may be biased as a surrogate marker of Aβ load by chan, Barcelona, Spain; 6Grifols®, 7Araclon Biothech®. Zaragoza, Spain).
changes in cerebral blood flow (CBF) or radiotracer
Authors’ contributions
clearance [45] and SUVR cutoffs may depend on meth-
All authors made a substantial contribution in interpreting of the study
odological aspects such as equipment, reconstruction, results and revising the manuscript critically for important intellectual
imaging window, image processing, smoothing, and cor- content and approved the final version to be published. SB and NRV
performed image and statistical analysis and prepared the first versions of
rections applied. To minimize this methodological limi-
the manuscript. SB, NRV, NK, AM, AP, AJ, SDS, and AS contributed to the
tation, a harmonization procedure was applied to concept, design, and interpretation of the study. VV, VD, and CR participated
convert all the images into a common resolution as de- in the acquisition and interpretation of data from MCI subjects MM, AS, JPT,
OSG, LT, and MB participated in the acquisition and interpretation of results
scribed in Joshi et al. [27]. Even so, the application of
from subjective memory complainers (FACEHBI study). HB and OS
cutoffs developed here should be applied with caution to participated in the acquisition and interpretation of results from elderly HC
studies using different methods or non-harmonized data. and AD subjects. JS participated in the acquisition and interpretation of
results from the young healthy volunteers. SML participated in the
interpretation of results from the young healthy volunteers and ADNI
Conclusions participants.
This study supports the utility of two cutoffs for 18F-flor-
betaben amyloid PET abnormality defining a “gray Authors’ information
Authors are on behalf of the AMYPAD consortium:
zone”: a first cutoff of 13.5 CL that indicated emerging Santiago Bullich, Núria Roé-Vellvé, Marta Marquié, Ángela Sanabria, Juan
Aβ pathology and a second cutoff of 35.7 CL where Pablo Tartari, Oscar Sotolongo-Grau, Norman Koglin, Andre Müller, Audrey
amyloid burden levels correspond to established AD Perrotin, Aleksandar Jovalekic, Lluís Tárraga, Andrew W. Stephens, Mercè
Boada.
neuropathology findings. These cutoffs define a subset Authors are on behalf of the FACEHBI study group:
of subjects characterized by pre-AD dementia levels of Marta Marquié, Ángela Sanabria, Juan Pablo Tartari, Oscar Sotolongo-Grau,
amyloid burden that may precede the alteration of other Lluís Tárraga, Mercè Boada.
biomarkers such as tau deposition or clinical symptoms
and accelerated amyloid accumulation. Amyloid PET Funding
Part of the data were acquired in clinical studies funded by Bayer Pharma
images in the “gray zone” are more likely to be ambigu- AG or Piramal Imaging.
ous by the current binary global visual assessment meth- Part of the data collection and sharing for this project was funded by the
odology. At the MCI stage, the determination of Alzheimer’s Disease Neuroimaging Initiative (ADNI) (National Institutes of
Health Grant U01 AG024904) and DOD ADNI (Department of Defense award
different amyloid loads, particularly low amyloid levels, number W81XWH-12-2-0012). ADNI is funded by the National Institute on
is useful in determining who will eventually progress to Aging, the National Institute of Biomedical Imaging and Bioengineering, and
dementia. Quantitation of amyloid provides a sensitive through generous contributions from the following: AbbVie, Alzheimer’s As-
sociation; Alzheimer’s Drug Discovery Foundation; Araclon Biotech; BioClinica,
measure in these low-load cases and may help to identify Inc.; Biogen; Bristol-Myers Squibb Company; CereSpir, Inc.; Cogstate; Eisai Inc.;
a group of subjects most likely to benefit from Elan Pharmaceuticals, Inc.; Eli Lilly and Company; EuroImmun; F. Hoffmann-La
intervention. Roche Ltd. and its affiliated company Genentech, Inc.; Fujirebio; GE Health-
care; IXICO Ltd.; Janssen Alzheimer Immunotherapy Research & Develop-
ment, LLC.; Johnson & Johnson Pharmaceutical Research & Development
Supplementary Information LLC.; Lumosity; Lundbeck; Merck & Co., Inc.; Meso Scale Diagnostics, LLC.;
Supplementary information accompanies this paper at https://doi.org/10. NeuroRx Research; Neurotrack Technologies; Novartis Pharmaceuticals Cor-
1186/s13195-021-00807-6. poration; Pfizer Inc.; Piramal Imaging; Servier; Takeda Pharmaceutical Com-
pany; and Transition Therapeutics. The Canadian Institutes of Health Research
is providing funds to support ADNI clinical sites in Canada. Private sector
Additional file 1. contributions are facilitated by the Foundation for the National Institutes of
Additional file 2. Health (www.fnih.org). The grantee organization is the Northern California In-
stitute for Research and Education, and the study is coordinated by the Alz-
heimer’s Therapeutic Research Institute at the University of Southern
Acknowledgements California. ADNI data are disseminated by the Laboratory for Neuro Imaging
The FACEHBI study group: Abdelnour C1,2, Aguilera N1, Alarcón-Martín E1, at the University of Southern California.
Alegret M1,2, Alonso-Lana S1, Berthier M3 Buendia M1, Campos F4, Cañabate Part of the data used in the preparation of this article were obtained from
P1,2, Cañada L1, Cuevas C1, de Rojas I1, Diego S1, Espinosa A1,2, Esteban-De the Alzheimer’s Disease Neuroimaging Initiative (ADNI) database (adni.loni.
Antonio E1, Gailhajenet A1, García P1, Giménez J5, Gómez-Chiari M5, Guitart usc.edu). As such, the investigators within the ADNI contributed to the
M1, Hernández I1,2, Ibarria, M1, Lafuente A1, Lomeña F4, López-Cuevas R1, design and implementation of ADNI and/or provided data but did not
Masip E1, Martín E1, Martínez J1, Mauleón A1, Moreno M1, Moreno-Grau S1,2, participate in the analysis or writing of this report. A complete listing of
Montrreal L1, Niñerola A4, Nogales AB1, Núñez L6, Orellana A1, Ortega G1, ADNI investigators can be found at http://adni.loni.usc.edu/wp-content/
Páez A6, Pancho A1, Pelejà E1, Pérez-Cordon A1, Pérez-Grijalba V7, Perissinotti uploads/how_to_apply/ADNI_Acknowledgement_List.pdfBullich et al. Alzheimer's Research & Therapy (2021) 13:67 Page 14 of 15
The FACEHBI study was supported by funds from Fundació ACE Institut in patients with mild to moderate Alzheimer disease. Arch Neurol. 2012;
Català de Neurociències Aplicades, Grifols, Life Molecular Imaging, Araclon 69(8):1002–10.
Biotech, Alkahest, Laboratorio de análisis Echevarne, and IrsiCaixa. 4. Uenaka K, Nakano M, Willis BA, Friedrich S, Ferguson-Sells L, Dean RA, et al.
This work has received support from the EU-EFPIA Innovative Medicines Ini- Comparison of pharmacokinetics, pharmacodynamics, safety, and tolerability
tiatives 2 Joint Undertaking (grant no. 115952). This communication reflects of the amyloid beta monoclonal antibody solanezumab in Japanese and
the views of the authors and neither IMI nor the European Union and EFPIA white patients with mild to moderate Alzheimer disease. Clin
are liable for any use that may be made of the information contained herein. Neuropharmacol. 2012;35(1):25–9.
5. Weninger S, Carrillo MC, Dunn B, Aisen PS, Bateman RJ, Kotz JD, et al.
Availability of data and materials Collaboration for Alzheimer’s prevention: principles to guide data and
The datasets generated and/or analyzed during the current study are not sample sharing in preclinical Alzheimer’s disease trials. Alzheimers Dement.
publicly available. 2016;12(5):631–2.
6. McDade E, Bateman RJ. Stop Alzheimer’s before it starts. Nature. 2017;
Declarations 547(7662):153–5.
7. Ritchie CW, Molinuevo JL, Truyen L, Satlin A, Van der Geyten S, Lovestone S.
Ethics approval and consent to participate Development of interventions for the secondary prevention of Alzheimer’s
All studies were conducted in accordance with the Declaration of Helsinki dementia: the European Prevention of Alzheimer’s Dementia (EPAD) project.
and after approval of the local ethics committees of the participating Lancet Psychiatry. 2016;3(2):179–86.
centers. All participants (or their legal representatives) provided written 8. Sperling RA, Jack CR Jr, Aisen PS. Testing the right target and right drug at
informed consent prior to recruitment. the right stage. Sci Transl Med. 2011;3(111):111cm33.
9. Sabri O, Sabbagh MN, Seibyl J, Barthel H, Akatsu H, Ouchi Y, et al.
Consent for publication Florbetaben PET imaging to detect amyloid beta plaques in Alzheimer’s
Not applicable. disease: phase 3 study. Alzheimers Dement. 2015;11(8):964–74.
10. Seibyl J, Catafau AM, Barthel H, Ishii K, Rowe CC, Leverenz JB, et al. Impact
Competing interests of training method on the robustness of the visual assessment of 18F-
SB, NRV, NK, AM, AP, AJ, and AS are employees of Life Molecular Imaging florbetaben PET scans: results from a phase-3 study. J Nucl Med. 2016;57(6):
GmbH (formerly Piramal Imaging GmbH). SDS is an employee of Eisai Inc. 900–6.
and a former employee of Life Molecular Imaging Inc. (formerly Piramal 11. Bullich S, Villemagne VL, Catafau AM, Jovalekic A, Koglin N, Rowe CC, et al.
Pharma Inc). HB and OS received research support, consultant honoraria, and Optimal reference region to measure longitudinal amyloid-beta change
travel expenses from Piramal Imaging GmbH. Victor L. Villemagne has with 18F-florbetaben PET. J Nucl Med. 2017;58(8):1300–6.
received speaker’s honoraria from Piramal Imaging, GE Healthcare, Avid 12. Bullich S, Seibyl J, Catafau AM, Jovalekic A, Koglin N, Barthel H, et al.
Pharmaceuticals, AstraZeneca, and Hoffmann-La Roche and consulting fees Optimized classification of 18F-florbetaben PET scans as positive and
for Novartis, Lundbeck, Abbvie, Shanghai Green Valley Pharmaceutical Co. negative using an SUVR quantitative approach and comparison to visual
LTD, and Hoffmann-La Roche. Christopher C. Rowe has received research assessment. Neuroimage Clin. 2017;15:325–32.
grants from Bayer Schering Pharma, Piramal Imaging, Avid Radiopharmaceu- 13. Barthel H, Gertz HJ, Dresel S, Peters O, Bartenstein P, Buerger K, et al.
ticals, Navidea, GE Healthcare, AstraZeneca, and Biogen. John Seibyl holds Cerebral amyloid-beta PET with florbetaben (18F) in patients with
equity in Invicro and consulting fees from LMI, Roche, Biogen, AbVie, and Alzheimer’s disease and healthy controls: a multicentre phase 2 diagnostic
Invicro. M. Boada has received research funds from the following private do- study. Lancet Neurol. 2011;10(5):424–35.
nors: Grifols SA, Caixabank S.A., Piramal Imaging, Araclon Biotech, Laborator- 14. Jennings D, Seibyl J, Sabbagh M, Lai F, Hopkins W, Bullich S, et al. Age
ios Echevarne, Fundació Castell de Peralada, and Fundació La Pedrera and dependence of brain beta-amyloid deposition in Down syndrome: an [18F]
has participated in advisory boards of Araclon Biotech, Biogen, Bioibérica, florbetaben PET study. Neurology. 2015;84(5):500–7.
Eisai, Grifols, Lilly, Merck, Nutricia, Roche, Schwabe Farma, Servier, and Kyowa 15. Tuszynski T, Rullmann M, Luthardt J, Butzke D, Tiepolt S, Gertz HJ, et al.
Kirin. Evaluation of software tools for automated identification of neuroanatomical
No other potential conflict of interest relevant to this article was reported. structures in quantitative beta-amyloid PET imaging to diagnose Alzheimer’s
disease. Eur J Nucl Med Mol Imaging. 2016;43(6):1077–87.
Author details 16. Villemagne VL, Ong K, Mulligan RS, Holl G, Pejoska S, Jones G, et al. Amyloid
1 imaging with (18)F-florbetaben in Alzheimer disease and other dementias. J
Life Molecular Imaging GmbH, Tegeler Str. 6-7, 13353 Berlin, Germany.
2 Nucl Med. 2011;52(8):1210–7.
Fundació ACE Institut Català de Neurociències Aplicades, Research Center
and Memory Unit - Universitat Internacional de Catalunya (UIC), Barcelona, 17. Doré V, Bullich S, Rowe CC, Bourgeat P, Konate S, Sabri O, et al. Comparison
Spain. 3Centro de Investigación Biomédica en Red Enfermedades of 18F-florbetaben quantification results using the standard centiloid, MR-
Neurodegenerativas (CIBERNED), Instituto de Salud Carlos III, Madrid, Spain. based, and MR-less CapAIBL((R)) approaches: validation against
4
Helen Wills Neuroscience Institute, University of California, Berkeley and histopathology. Alzheimers Dement. 2019;15(6):807–16.
Lawrence Berkeley National Laboratory, Berkeley, CA, USA. 5Department of 18. Ong K, Villemagne VL, Bahar-Fuchs A, Lamb F, Chételat G, Raniga P, et al.
Nuclear Medicine, University Hospital Leipzig, Leipzig, Germany. 6Department (18)F-florbetaben Abeta imaging in mild cognitive impairment. Alzheimers
of Psychiatry, University of Pittsburgh, Pittsburgh, PA, USA. 7Departments of Res Ther. 2013;5(1):4.
Medicine and Molecular Imaging, University of Melbourne, Austin Health, 19. Bischof GN, Jacobs HIL. Subthreshold amyloid and its biological and clinical
Melbourne, Victoria, Australia. 8The Australian e-Health Research Centre, meaning: long way ahead. Neurology. 2019;93(2):72–9.
Health and Biosecurity, CSIRO, Melbourne, Victoria, Australia. 9Life Molecular 20. Fantoni E, Collij L, Lopes Alves I, Buckley C, Farrar G. AMYPAD consortium.
Imaging Inc, Boston, MA, USA. 10Invicro, New Haven, CT, USA. The spatial-temporal ordering of amyloid pathology and opportunities for
PET imaging. J Nucl Med. 2020;61(2):166–71.
Received: 23 December 2020 Accepted: 10 March 2021 21. Grothe MJ, Barthel H, Sepulcre J, Dyrba M, Sabri O, Teipel SJ. In vivo staging
of regional amyloid deposition. Neurology. 2017;89(20):2031–8.
22. Mattsson N, Palmqvist S, Stomrud E, Vogel J, Hansson O. Staging beta-
References amyloid pathology with amyloid positron emission tomography. JAMA
1. Braak H, Braak E. Frequency of stages of Alzheimer-related lesions in Neurol. 2019;76(11):1319–29.
different age categories. Neurobiol Aging. 1997;18(4):351–7. 23. Collij LE, Heeman F, Salvadó G, Ingala S, Altomare D, de Wilde A, et al.
2. Villemagne VL, Burnham S, Bourgeat P, Brown B, Ellis KA, Salvado O, et al. Multitracer model for staging cortical amyloid deposition using PET
Amyloid beta deposition, neurodegeneration, and cognitive decline in imaging. Neurology. 2020;95(11):e1538–53.
sporadic Alzheimer’s disease: a prospective cohort study. Lancet Neurol. 24. Pascoal TA, Therriault J, Mathotaarachchi S, Kang MS, Shin M, Benedet AL,
2013;12(4):357–67. et al. Topographical distribution of Abeta predicts progression to dementia
3. Blennow K, Zetterberg H, Rinne JO, Salloway S, Wei J, Black R, et al. Effect of in Abeta positive mild cognitive impairment. Alzheimers Dement (Amst).
immunotherapy with bapineuzumab on cerebrospinal fluid biomarker levels 2020;12(1):e12037.You can also read