Clustering of activated microglia occurs before the formation of dystrophic neurites in the evolution of Aβ plaques in Alzheimer's disease.
←
→
Page content transcription
If your browser does not render page correctly, please read the page content below
Free Neuropathology 1:20 (2020)                                                                                                                                   Patrick Jarmo Paasila et al
doi: https://doi.org/10.17879/freeneuropathology-2020-2845                                                                                                                     page 1 of 18

                                                                                                                                                                    Original Paper

Clustering of activated microglia occurs before the formation of
dystrophic neurites in the evolution of Aβ plaques in Alzheimer’s
disease.
Patrick Jarmo Paasila2, Danielle Suzanne Davies1, Greg Trevor Sutherland2, Claire Goldsbury1
1
    Discipline of Anatomy and Histology, School of Medical Sciences, Faculty of Medicine and Health, The University
    of Sydney, NSW 2006, Australia
2
    Discipline of Pathology, School of Medical Sciences, Faculty of Medicine and Health, The University of Sydney,
    NSW 2006, Australia

Corresponding author:
Dr Claire Goldsbury PhD · Brain and Mind Centre · 94 Mallett Street · Camperdown, NSW 2050 · Australia · Tel +61 2 9351 0878
claire.goldsbury@sydney.edu.au

Submitted: 16 June 2020                      ·        Accepted: 29 July 2020                 ·      Copyedited by: Jeffrey Nirschl                       ·       Published: 04 August 2020

Abstract
Alzheimer’s disease (AD) is a late-onset disease that has proved difficult to model. Microglia are implicated in
AD, but reports vary on precisely when and how in the sequence of pathological changes they become in-
volved. Here, post-mortem human tissue from two differentially affected regions of the AD brain and from
non-demented individuals with a high load of AD-type pathology (high pathology controls) was used to model
the disease time course in order to determine how microglial activation relates temporally to the deposition of
hallmark amyloid-β (Aβ) and hyperphosphorylated microtubule associated protein tau pathology. Immunofluo-
rescence against the pan-microglial marker, ionised calcium-binding adapter molecule 1 (IBA1), Aβ and tau,
was performed in the primary motor cortex (PMC), a region relatively spared of AD pathological changes, and
compared to the severely affected inferior temporal cortex (ITC) in the same cases. Unlike the ITC, the PMC in
the AD cases was spared of any degenerative changes in cortical thickness and the density of Betz cells and
total neurons. The clustering of activated microglia was greatest in the PMC of AD cases and high pathology
controls compared to the ITC. This suggests microglial activation is most prominent in the early phases of AD
pathophysiology. Nascent tau inclusions were found in neuritic plaques in the PMC but were more numerous in
the ITC of the same case. This shows that tau positive neuritic plaques begin early in AD which is likely of path-
ogenic importance, however major tau deposition follows the accumulation of Aβ and clustering of activated
microglia. Importantly, findings presented here demonstrate that different states of microglial activation, cor-
responding to regional accumulations of Aβ and tau, are present simultaneously in the same individual; an im-
portant factor for consideration if targeting these cells for therapeutic intervention.

Keywords: Alzheimer’s disease, Inferior temporal cortex, Microglia, Post-mortem human brain tissue, Primary motor cortex

Copyright: © 2020 The author(s). This is an open access article distributed under the terms of the Creative Commons Attribution 4.0 International License (https://creativecommons.org/licenses/by/4.0/),
which permits unrestricted use, distribution, and reproduction in any medium, provided the original author and source are credited, a link to the Creative Commons license is provided, and any changes
are indicated. The Creative Commons Public Domain Dedication waiver (https://creativecommons.org/publicdomain/zero/1.0/) applies to the data made available in this article, unless otherwise stated.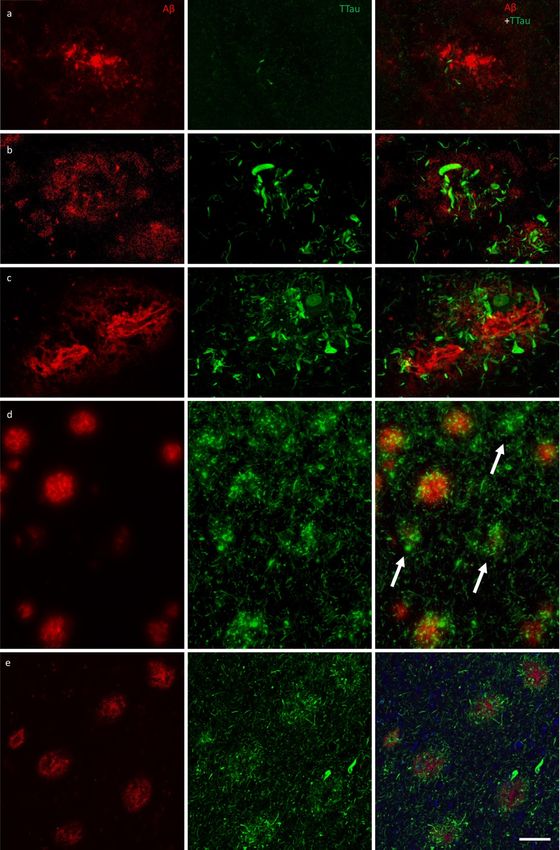
Free Neuropathology 1:20 (2020)                                                             Patrick Jarmo Paasila et al
doi: https://doi.org/10.17879/freeneuropathology-2020-2845                                               page 2 of 18

                                                             (13). NPs that retain sparse DNs but show minimal
Introduction                                                 Aβ staining have previously been described and
                                                             were termed ‘remnant plaques’ which were pro-
      Alzheimer’s disease (AD) is neuropathological-         posed to result from glial phagocytosis of insoluble
ly characterised by inclusions of microtubule-               Aβ (14).
associated protein tau (tau) and extracellular de-
posits of β-amyloid (Aβ). Intraneuronal tau pathol-                There remains significant debate as to the se-
ogy includes neurofibrillary tangles (NFTs) in the           quence of the neuropathological changes that pre-
cell soma and neuropil threads (NTs), which occur            cede the onset of AD symptomatology. The amyloid
mostly in the dendritic compartment, but also in             cascade hypothesis posits Aβ, and in particular the
the axonal domain though to a lesser extent (1, 2).          soluble, oligomeric, non-fibrillar fraction, as the
NFTs and NTs are both comprised of paired helical            initiating factor (15-20). A competing view is of-
filaments and straight filaments of polymerised              fered by others who contend that the sequence of
hyperphosphorylated tau protein (3, 4). The extent           pathological events begins with neurofibrillary pa-
of tau pathology follows a predictable spatiotem-            thology (21, 22) which precedes the formation of
poral progression through functionally integrated            insoluble Aβ pathology (23). Indeed, there is evi-
brain regions (5, 6) and there is an extensive body          dence that tau pathology occurs prior to Aβ pa-
of literature that demonstrates an inverse correla-          thology as it is more common in the brains of non-
tion between the accumulation of NFTs and cogni-             demented individuals (21) but this might represent
tive status (7) such that the spread and regional            a non-AD scenario described as primary age-related
level of NFTs reflects the severity of dementia with         tauopathy (PART) (24). Notwithstanding the order
time (8).                                                    of events, both hypotheses suggest that an activat-
                                                             ed glial response is an integral component of the
      Contrastingly, Aβ plaques follow a seemingly           pathogenesis of AD.
more haphazard regional pattern of accumulation
throughout the neocortex, indeed plateauing rela-                 The study of microglia morphology in post-
tively early in the disease time course (9, 10), and         mortem human brain tissue presents a simple
therefore correlate poorly with disease status until         method with which to gauge the involvement of
substantial argyrophilic neuritic tau pathology is           microglia in instances of changed physiological
also present (5, 7, 11). Whilst Aβ load may be an            conditions or to the development of a disease. Mi-
unreliable indicator of disease severity, it is gener-       croglia with a ramified morphology, characterised
ally accepted that the extent of its spread, in com-         by thin, evenly distributed, highly branched pro-
bination with tau pathology, is useful for staging           cesses with a small, spherical soma, represent the
purposes (9). Aβ plaques can be classified with              healthy cell population (25-27). Activated microglia
immunostaining into at least three morphologically           are characterised by reduced morphological com-
distinct categories: diffuse, fibrillar, or dense-cored.     plexity including hypertrophy of the soma and pro-
Diffuse plaques have long been proposed to be a              cesses and may also display the formation of distal
structural precursor of other plaque forms, but              phagosomes (23, 25, 28). Dystrophic microglia dis-
whether these categories represent separate enti-            play features consistent with cellular senescence
ties with independent mechanisms of development              (29), including a loss of processes, tortuosity of
or are temporally linked is still unclear. Neuritic          remaining processes, and discontinuous IBA1-
plaques (NPs) are those Aβ plaques that also fea-            immunolabelling (30-32). Lastly, clusters of activat-
ture dystrophic neurites (DNs) with silver staining.         ed microglia in AD have been noted previously in
DNs can occur in all these morphological subtypes            post-mortem human brain tissue and represent the
of Aβ plaques, though more commonly in dense-                direct interaction between microglia and Aβ and
cored and fibrillar plaques than morphologically             tau pathology (10, 32, 33).
diffuse plaques (12). Most DNs are tau-positive and
                                                                  By investigating brain regions differentially af-
morphologically similar to NTs which are elongated
                                                             fected by AD-type pathology in non-demented and
in shape, but may also be globular, and possibly
                                                             demented individuals it may be possible to model
represent swollen presynaptic (axonal) terminals
                                                             the sequence of pathological changes in the dis-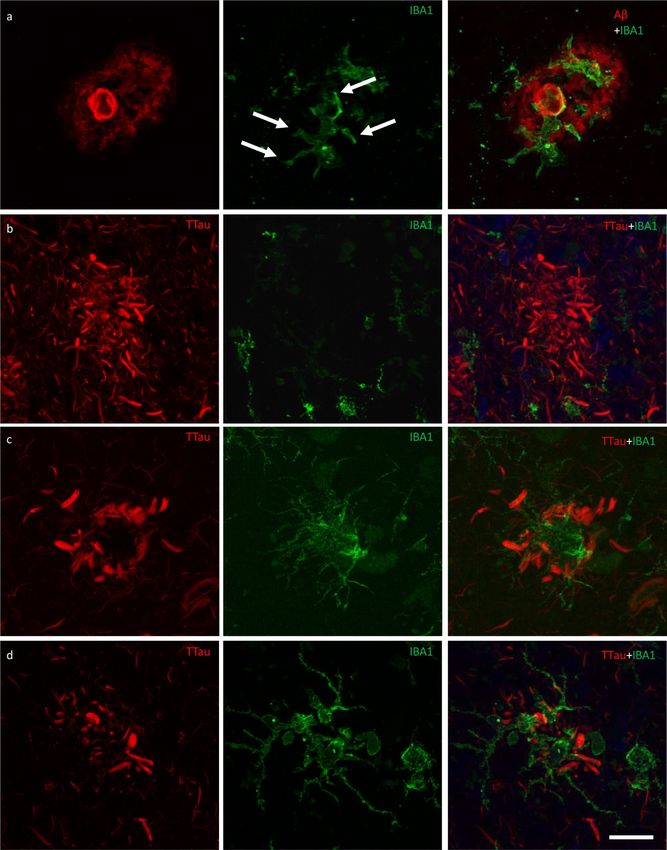
Free Neuropathology 1:20 (2020)                                                             Patrick Jarmo Paasila et al
doi: https://doi.org/10.17879/freeneuropathology-2020-2845                                               page 3 of 18

ease, in particular the activated microglial re-             demonstrate that nascent NTs and DNs in the PMC
sponse. Previously we demonstrated an increased              begin early in the pathogenesis of AD, but follow
density of activated microglia in the inferior tem-          the clustering of activated microglia. By contrast,
poral cortex (ITC) of non-demented controls with             looking at the severely affected ITC in the same
similar levels of AD-type pathology (‘high pathology         cases, findings suggest that microglial clustering at
controls’ – HPCs) as clinically and neuropathologi-          plaques dissipates once tau and Aβ pathology is
cally-confirmed AD cases (26). This suggested that           long established and there is also a substantial loss
the microglial response occurs in the preclinical            of IBA1-immunoreactivity (26, 34). Although an
phases of AD but we wished to confirm this finding           early toxic microglial gain of function cannot be
in a belatedly affected region of the AD brain, the          ruled out, these findings appear most consistent
primary motor cortex (PMC), compared to an earli-            with a scenario where microglial activation is neu-
er and more severely affected region, the ITC, of            roprotective early in the pathogenesis of AD. We
the same cases. Further, we wished to determine              suggest that this is followed by a gradual exhaus-
the sequence of Aβ, tau, and microglia pathological          tion of microglial function that contributes to cog-
changes that occur in the cortex. The findings here          nitive deterioration in the AD brain.

Table 1. Cohort characteristics.
Free Neuropathology 1:20 (2020)                                                             Patrick Jarmo Paasila et al
doi: https://doi.org/10.17879/freeneuropathology-2020-2845                                               page 4 of 18

                                                             MABN92) was carried out as previously described
Methods                                                      (34). TTau immunostaining of NFTs, NTs, and DNs
                                                             has previously been demonstrated to give compa-
      This study was approved by the University of           rable immunostaining to standard phosphotau
Sydney’s Human Research Ethics Committee                     antibodies (12E8 and AT8) (36). Briefly, heat-
(HREC#2015/477). All tissue samples for this study,          retrieval was performed with sodium citrate (pH
as well as demographic and clinical information,             6.0) for 10 minutes at 100°C, before permeabilising,
were supplied by the New South Wales Brain Tissue            blocking with BSA, and incubating in primary anti-
Resource Centre (NSWBTRC) and the Sydney Brain               bodies for three hours at room temperature or
Bank (SBB), collectively the New South Wales Brain           overnight at 4°C, and finally incubating in second-
Banks (NSWBB), following approval from their Sci-            ary antibodies (1:200; Invitrogen: AF555 goat anti-
entific Advisory Committee. Methods for case as-             mouse, A214424; AF647 goat anti-rabbit, A21244).
certainment and tissue preparation by NSWBB                  Hoechst 33342 was added to counterstain nuclei
have been previously published (35). The demo-               and sections were mounted in ProLong Gold Anti-
graphic and clinicopathological characteristics of           fade.
the cohort (Table 1) and data from the ITC have
been previously published (26).                              Image acquisition and analysis
Immunofluorescence                                                  Aβ and IBA1 double-labelled sections were
                                                             imaged using a Zeiss LSM 800 confocal microscope
     Immunofluorescence staining procedures                  using the ‘tile scan’ function at the Advanced Mi-
were performed on free-floating 45 μm fixed sec-             croscopy Facility, Bosch Institute, The University of
tions derived from the caudal aspect of the super-           Sydney. A previously validated modified disector
omedial area of the PMC of controls (n = 10), HPCs           sampling approach that utilises one section per
(n = 5), and pathologically confirmed AD cases (n =          individual was used here for the analysis of the Aβ
8) as previously described (26). Double-labelled             and IBA1 immunostained sections (37). Briefly, a
sections using antibodies against Aβ, total tau              total of three cortical strips per section from areas
(TTau), and the pan-microglial marker ionised calci-         where the pial surface and the grey-white bounda-
um-binding adapter molecule 1 (IBA1), were used              ry were strictly in parallel were acquired for the
for the quantification of Aβ and tau loads and mi-           quantification of microglia, Aβ plaques and Aβ-
croglial morphological subtypes.                             positive pixels. These cortical strips were con-
      For Aβ and IBA1 quantification, heat-induced           structed of serial images 500 μm in width, 6 μm in
epitope retrieval was performed using a sodium               z-depth with three z-slices (z-step = 3 μm), span-
citrate solution (pH 8.5) at 60°C overnight, followed        ning all of the cortical laminae of the PMC using a
by a 12-minute formic acid (90%) incubation at               20×/0.8 numerical aperture (NA) objective. Clusters
room temperature. Blocking was performed in 10%              of microglia and individual microglia, which were
normal goat serum (Gibco #16210072), and prima-              categorised as having either a ramified, activated,
ry (mouse Aβ, 1:1000, BioLegend 803002; rabbit               or dystrophic morphology as previously described
IBA1, 1:1000, Wako 019-19741) and secondary                  (26), were enumerated in image analysis software
(1:200; Thermo Scientific: Alexa Fluor (AF) 488 goat         (Fiji; NIH). The terminology used to describe the
anti-mouse, #A11001; AF 568 goat anti-rabbit,                different populations of morphologically diverse
#A11011) antibody incubations were performed at              populations of microglia was informed by previous
4°C with gentle agitation. Nuclear counterstaining           investigations (25, 28, 30). Microglia with thin,
was performed in the last 40 minutes of the sec-             highly branched processes, and a spherical nucleus
ondary antibody incubation by the addition of                were categorised as ‘Ramified’. ‘Activated’ micro-
Hoechst 33342 dye (1 µg/mL; Thermo Scientific                glia (previously termed ‘deramified’ (34)) included
62249). Sections were mounted using Prolong Dia-             those cells that displayed hypertrophy of the soma
mond Antifade (Invitrogen P36961). Double-                   or processes with retraction of secondary or ter-
immunolabelling of TTau (rabbit; 1:500; Dako                 tiary processes. ‘Dystrophic microglia’ were identi-
K9JA/A0024) and IBA1 (mouse; 1:50; Millipore                 fied on the basis of a loss of processes with the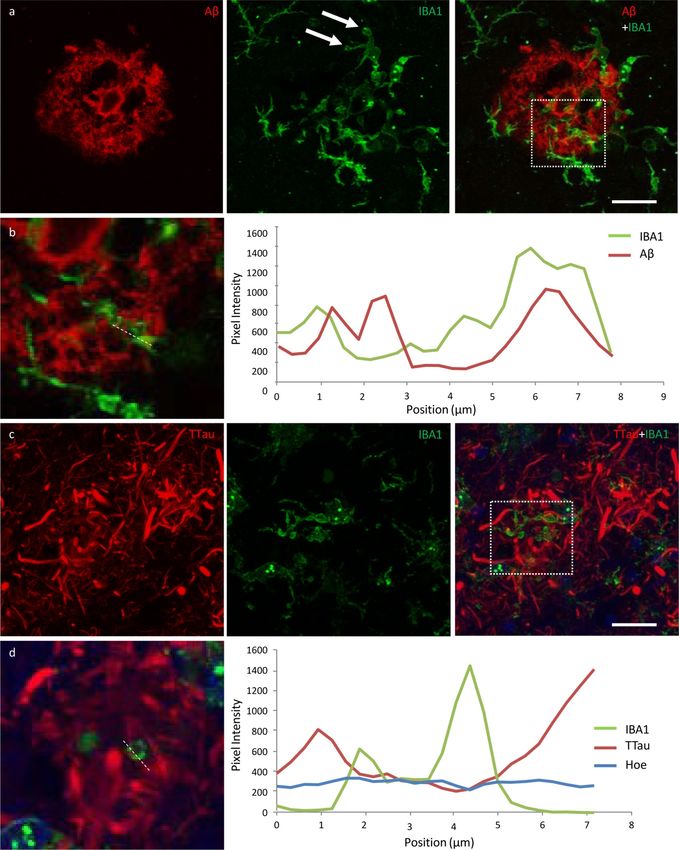
Free Neuropathology 1:20 (2020)                                                             Patrick Jarmo Paasila et al
doi: https://doi.org/10.17879/freeneuropathology-2020-2845                                               page 5 of 18

remaining processes displaying significant tortuosi-         urement of cortical thickness and neuronal counts.
ties or discontinuous IBA1-immunolabelling with or           Sections were incubated in 0.1% cresyl violet ace-
without blebbing or punctate IBA1-labelling (previ-          tate (0.02% glacial acetic acid; added immediately
ously dystrophic microglia were subcategorised as            before use) for 15 minutes at 60°C. Differentiation
either ‘punctate’ or ‘discontinuous’ to reflect these        was achieved by sequentially washing sections for
observations (34)). A ‘Cluster of microglia’ was             three minutes in 70% and 95% ethanol. The final
counted if three or more soma occurred within, or            level of staining was adjusted by briefly dipping
were touching the margins of, a 20 μm2 virtual grat-         sections in 100% ethanol and confirmed by light
icule subregion. Larger clusters were counted as             microscopy before clearing in xylene for ten
one cluster if the graticule subregion could be              minutes and mounting in DPX. Cortical thickness
moved and still incorporate at least three somata.           measurements and neuronal counts were per-
Clusters were counted whilst visualising only the            formed on three cortical strips from one section
568 nm (IBA1-positive) channel to distinguish these          per individual using an eyepiece graticule on an
from individual microglia and to minimise potential          Olympus BX50 microscope using a 20×/0.75 NA
false-positive counts in the presence of either Aβ-          objective. A height measure of 45 μm was used in
or TTau-immunostaining. The total number of mi-              determining density estimates to eliminate artefac-
croglia counted per section averaged 519 with a              tual tissue shrinkage during staining; with the mi-
coefficient of error (CE) of ≤0.2 for all counts of          crotome accuracy to cut precise sections having
morphological subtypes, with the exception of mi-            been previously validated (37). CEs using the modi-
croglial clusters (CE ≤0.3) which were relatively rare       fied disector technique outlined above were
Free Neuropathology 1:20 (2020)                                                                        Patrick Jarmo Paasila et al
doi: https://doi.org/10.17879/freeneuropathology-2020-2845                                                          page 6 of 18

Results                                                                 tion (% TTau) and the density of NFTs was higher in
                                                                        the PMC of AD cases compared to controls (%TTaup =
The Alzheimer’s disease primary motor cortex                            0.001; NFTp = 0.001) and HPCs (%TTaup = 0.007; NFTp =
exhibits mild tau and β-amyloid deposition but                          0.01) (Table 2).
no evidence of neurodegeneration
                                                                             Amongst the AD cases, the PMC had signifi-
      This study involved 23 autopsy cases that had                     cantly reduced % Aβ (p = 0.006), total Aβ plaques
previously been clinicopathologically characterised                     (0.001), and fibrillar plaques (p = 0.0002), but not
as ‘probable AD’ or controls based on ABC score                         dense-cored plaques (p = 0.2) compared to the ITC.
and clinical dementia rating (Table 1) (39). AD cases                   The % TTau (p = 0.02) and the density of NFTs (p =
(n=8) included individuals with an intermediate–                        0.02) were also significantly reduced in the PMC
high likelihood of AD dementia following routine                        compared to the ITC of AD cases. Amongst controls
neuropathological diagnostic testing (38) and who                       the % TTau was significantly reduced in the PMC
presented with typical AD dementia prior to death.                      compared to the ITC (p = 0.04). There were no oth-
‘High pathology controls’ (HPC) (n=5) were grouped                      er regional differences in terms of pathological load
as such on the basis of no cognitive impairment but                     in controls, including amongst HPCs (Table 3).
satisfied a diagnosis of intermediate AD likelihood                           In the ITC, all of the control, HPC, and AD cas-
on post-mortem examination. Controls (n=10) in-                         es had neuritic tau pathology at varied levels. Aβ
cluded individuals with a range of ABC scores (A0–                      pathology in the ITC occurred in 4/10 controls, and
3; B0–2; C0–3), though only satisfying a ‘Not’ or                       all HPCs and AD cases. The clustering of activated
‘Low’ outcome after diagnostic testing.                                 microglia in the ITC was apparent in 6/10 controls
          There was no cortical atrophy (Fig. 1a) or neu-               (including three with only tau pathology), and all of
ronal loss (Fig. 1b), including the prominent layer                     the HPCs and AD cases except one (M12) (ITC case
Vb Betz cells (Fig. 1c), in the PMC of AD cases or                      data is shown in Fig. 1d). In the PMC, neuritic tau
HPCs compared with controls. Following a positive                       pathology was present in 7/10 controls, 4/5 HPCs,
pixel analysis, grey matter Aβ areal fraction (% Aβ)                    and all AD cases, while Aβ deposition in the PMC
was higher in the PMC of AD cases compared to                           occurred in 6/10 controls, 4/5 HPCs, and all AD
controls (p = 0.0005), but not HPCs (p = 0.07). The                     cases. Microglial clustering in the PMC was ob-
density of total Aβ plaques, fibrillar, and dense-                      served in 5/10 controls, and all of the HPCs and AD
cored plaques was also significantly higher in AD                       cases, with the exception of one case (M12) (PMC
cases compared to controls (Totalp = 0.003; Fibrillarp =                case data is shown in Fig. 1e). In controls, the %
0.002; Dense-coredp = 0.004) but not HPCs (Totalp = 0.1;                TTau correlated with age in the PMC (r2 = 0.44, p =
Fibrillar
         p = 0.06; Dense-coredp = 0.2). Total tau areal frac-           0.04) but not in the ITC, which was near significant
                                                                        (r2 = 0.39, p = 0.05).

               Table 2. Summary of neuronal and neuropathological data of the primary motor cortexa

           a
             Mean ± standard deviation.
           b
             ANOVA results; see text for p-values of pairwise comparisons.
           c
            Inclusive of Betz cells.
           d
             Density of Betz cells in layer V.
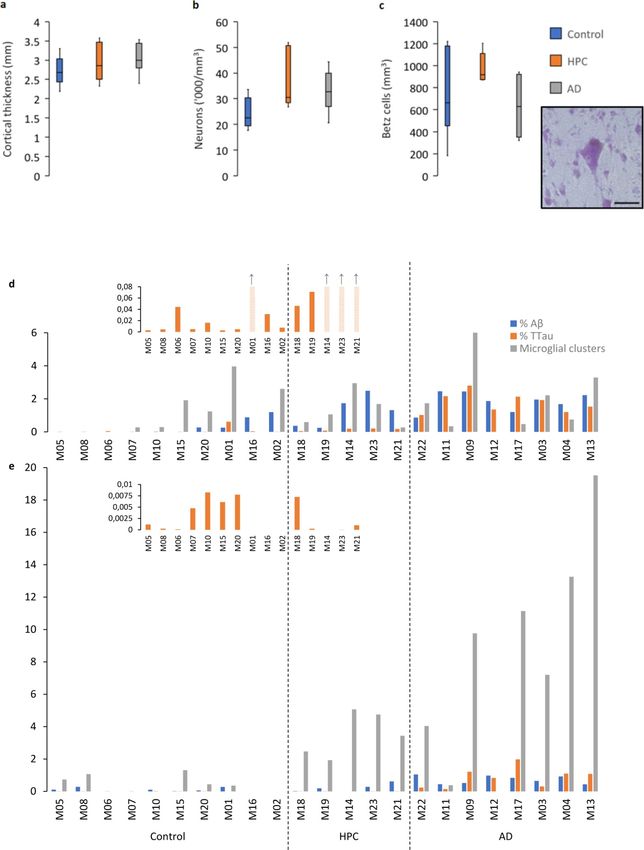
Free Neuropathology 1:20 (2020)                                                                                Patrick Jarmo Paasila et al
doi: https://doi.org/10.17879/freeneuropathology-2020-2845                                                                  page 7 of 18

Figure 1 Characteristics of the PMC and regional neuropathological comparisons. a–c The PMC is spared of AD-related neurodegenera-
tive changes as measured by cortical thickness (a), total neuronal density (b), and the density of layer Vb Betz cells (inset demonstrates
a pyramidal Betz cell with multiple asymmetrically distributed perisomatic neurites, a prominent nucleolus, and a dark dense deposit of
cytoplasmic lipofuscin) (c). d–e A cohort wide comparison of the percentage of Aβ and TTau immunolabelling and microglial clustering
in the ITC (d) and PMC (e) demonstrates age-related tau build-up in a majority of control brains in both regions and an early build-up of
Aβ in HPCs (that were scored as A2-3, B2, C0-3 on diagnostic slides) with a concomitant microglial clustering response that is more
prevalent in the PMC compared to the ITC and which appears to dissipate with severe AD pathology in the ITC. Scale bar = 50 μm (c)
Free Neuropathology 1:20 (2020)                                                                  Patrick Jarmo Paasila et al
doi: https://doi.org/10.17879/freeneuropathology-2020-2845                                                    page 8 of 18

                                        Table 3. Regional neuropathological comparisonsa.

                  a
                      Mean ± standard deviation.

Clusters of activated microglia are more com-                    ramified microglia (p = 0.002) were reduced in the
monly found in the PMC than the ITC of HPCs                      ITC compared to the PMC of AD cases. Immunoflu-
and AD cases                                                     orescent double-labelling for Aβ and IBA1 in the
                                                                 PMC showed that the clusters of activated micro-
      The density of individual activated (Fig. 2a–e),           glia, occurred preferentially within the boundaries
ramified (Fig. 2f), dystrophic (Fig. 2g–h), or total             of fibrillar Aβ plaques, with a significant correlation
microglia did not differ between any of the three                in a combined analysis of control and AD brains
groups in the PMC (Table 4). Microglial clusters                 (Spearman ρ = 0.54, p = 0.006; Fig. 3a). The per-
(Fig. 2i–j), although a small proportion of total mi-            centage of Aβ plaques associated with a cluster of
croglia, were significantly more common in HPCs                  activated microglia in the PMC ranged from a mean
(Fig. 2k) and AD (Fig. 2l) cases compared to controls            of 41% in controls and 43% in AD cases to 60% in
in the PMC (HPCp = 0.01; ADp = 0.04).                            HPCs, with one control (M15), two HPCs (M14 and
                                                                 M18), and one AD case (M13) having a higher den-
      Clusters in the PMC were also higher than in
                                                                 sity of microglial clusters than Aβ plaques.
the ITC of HPCs (p = 0.02) and AD cases (p = 0.03)
(Fig. 3a), whilst the density of total (p = 0.04) and
Free Neuropathology 1:20 (2020) Patrick Jarmo Paasila et al
doi: https://doi.org/10.17879/freeneuropathology-2020-2845 page 9 of 18
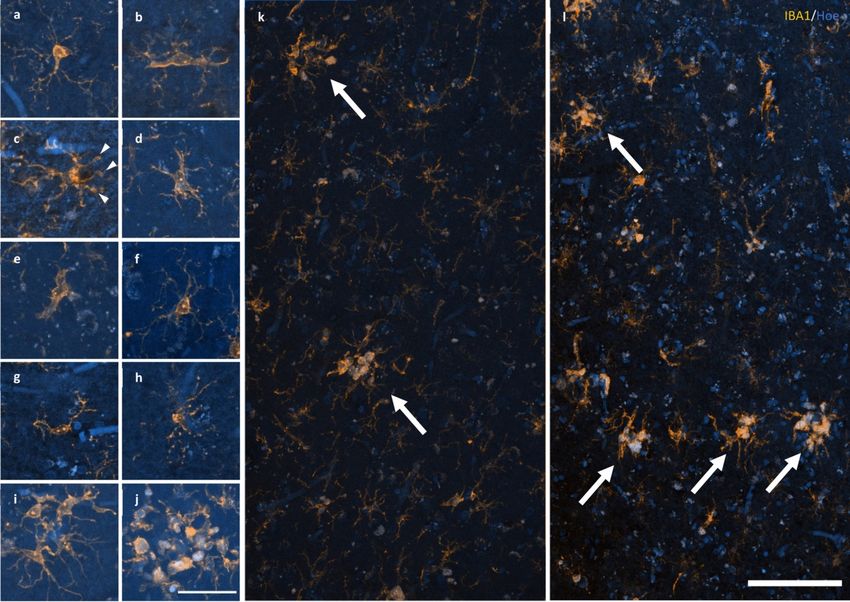
Figure 2 Response of microglia to AD pathology. a–e A spectrum of microglial activation can be identified by a series of morphological
changes including an enrichment of IBA1 labelling of the soma and primary processes (a), hypertrophy of the primary processes (b),
retraction of tertiary processes ± the formation of morphological features consistent with phagosomes (arrow heads) (c), further retrac-
tion of secondary processes (d), until amoeboid in shape (e). f–h Healthy ramified microglia have a small, spherical soma and thin, even-
ly distributed processes (f), contrasting with dystrophic microglia that have either deramified and tortuous processes (g) or pseudo-
fragmentation of processes when marked with IBA1 (h). i–j Microglia that form a cluster within the boundary of an Aβ plaque may be
either dystrophic or have reached a phase of early (i) or late/amoeboid (j) activation. k–l Mosaics of IBA1 staining demonstrating the
size and distribution of microglial clusters (arrows), defined as three or more somata occurring within, or touch the boundaries of, a 20
μm2 virtual graticule subregion, in the PMC of an HPC (k; M23) and AD case (l; M13). Scale bar in j = 40 μm (a–j); in l = 100 μm (k–l)
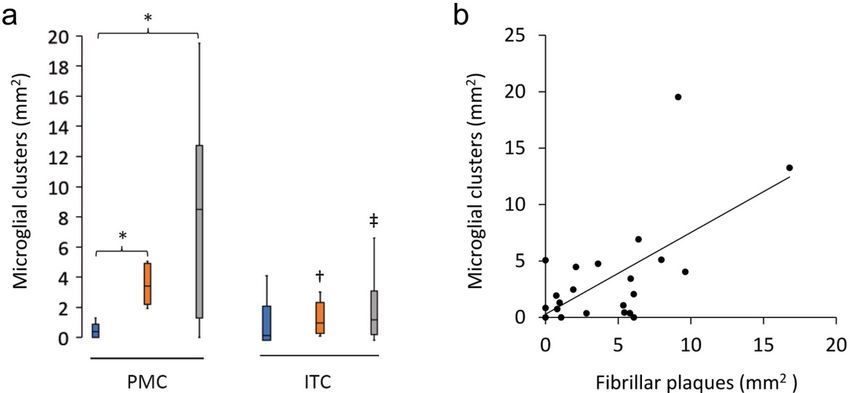
Figure 3 Characteristics of microglial clustering in the PMC. a The density of microglial clusters was significantly greater in the PMC of
HPCs and AD cases compared to controls. b Microglial clusters were more frequently associated with fibrillar neuritic plaques in a com-
† ‡
bined group analysis; Spearman ρ = 0.54, p = 0.006. Significantly reduced compared to PMC of HPCs; Significantly reduced compared
*†‡
to PMC of AD cases. pFree Neuropathology 1:20 (2020) Patrick Jarmo Paasila et al
doi: https://doi.org/10.17879/freeneuropathology-2020-2845 page 10 of 18
Table 4. Quantification of the morphological subtypes of microglia in the primary motor cortexa
a 2
Cells/mm ; mean ± standard deviation.
b
ANOVA results; see text for p-values of pairwise comparisons of microglial clusters.
A graded extent of neuritic tau pathology and munolabelling that closely associated with the Aβ
clustering of microglia occurs within nascent Aβ element in the periphery and core of plaques (Fig.
plaques, with the persistence of dystrophic neu- 6a; Fig. 7a). As previously reported for the ITC, su-
rites and the loss of IBA1-immunoreactivity and perior frontal gyrus, and primary visual cortex, the
Aβ-immunoreactivity occurring in established overall density of dystrophic microglia was inverse-
neuritic plaques ly correlated with brain pH in the PMC (r2 = 0.3, p =
0.01) (26). However, it was also noted that individ-
All of the Aβ plaques examined in the ITC, and
ual plaques with dense DNs, that were associated
a majority in the PMC, contained DNs. However,
with weak or absent Aβ staining which were more
the extent of the accumulated neuritic tau patholo-
abundant in the ITC, were associated with dys-
gy within each plaque was lower in the PMC (Fig.
trophic microglia (Fig. 6b) rather than a cluster of
4a) than the ITC of the same case (Fig. 4b). Both Aβ
activated microglia which more commonly oc-
deposits and globular DNs were seen perivascularly
curred where the extent of DNs was not yet fully
(Fig. 4c), consistent with previous observations
developed (Fig. 6c–d). Confocal views showed co-
(39). The density of DNs was greatest in the ITC of
localisation of microglial cell processes with Aβ in
AD cases (Fig. 4c), which also had the highest densi-
AD (Fig. 7a–b), but no co-localisation with tau pa-
ty of remnant plaques characterised by accumula-
thology (Fig. 7c–d).
tions of DNs associated with weak or absent Aβ-
immunoreactivity (Fig. 4d). In the ITC a diffuse lat- Discussion
tice of elongated NTs occurred throughout the neu-
ropil and independently of Aβ plaques (Fig. 4e). AD is a uniquely human disease with a long
DNs appeared radially projecting from Aβ plaques prodrome and has proved difficult to model. The
(Fig. 4e) and showed either elongated or globular combination of using different regions of post-
morphology (Fig. 5a). Hoechst dye marked cell nu- mortem brain tissue from individuals with or with-
clei around the periphery of Aβ plaques and also out dementia and with variable amounts of AD-
partly stained the fibrillar deposits of Aβ (Fig. 5a). type pathology may allow the pathological se-
Hoechst has previously been reported to stain Aβ quence of events to be elucidated. For example,
plaques in transgenic mice (40). Immunofluores- the level of disease severity could be ordered from
cent double-labelling showed no colocalisation of lowest to highest as follows: PMC-controls < ITC-
Aβ and TTau (Fig. 5b). controls < PMC-HPC < ITC-HPC < PMC-AD < ITC-AD.
In particular, regions such as the ITC in HPCs and
Microglia cell processes exhibiting evidence of the PMC in AD cases could harbour the pre-
phagocytic activity are interspersed around the symptomatic targets required to therapeutically
periphery and core of Aβ plaques delay or prevent AD. Prior to using this model to
understand the role of microglia in AD, a quantita-
Microglia that occurred in proximity to diffuse, tive neuropathological analysis of the PMC was
fibrillar, and cored plaques commonly displayed carried out to ensure that it met expectations for
structures morphologically consistent with phago- being a relatively unaffected region of the AD brain.
somes on distal processes with enriched IBA1 im-Free Neuropathology 1:20 (2020) Patrick Jarmo Paasila et al doi: https://doi.org/10.17879/freeneuropathology-2020-2845 page 11 of 18 Figure 4 Immunofluorescent double-labelling for Aβ and TTau. a–c The majority of Aβ plaques examined here were associated tau- positive dystrophic neurites, with a clear gradation visible between the PMC (a) and ITC (b) in controls (M01 pictured in a and b) and AD cases (ITC of M09 pictured in c). AD cases had the most extensive build-up of DNs in fibrillar and dense-cored plaques, as well as peri- vascular (capillary) Aβ deposits (c). d Remnant plaques (arrows) are characterised by absent or weak Aβ staining and dense accumula- tions of tau pathology and were much more common in the ITC than the PMC (also seen in b). e Severely affected regions of the AD brain, such as the ITC, showed a diffuse network of elongated NTs throughout the parenchyma as well radially projecting DNs. Scale bar = 20 μm (a–c), 60 μm (d), 40 μm (e)
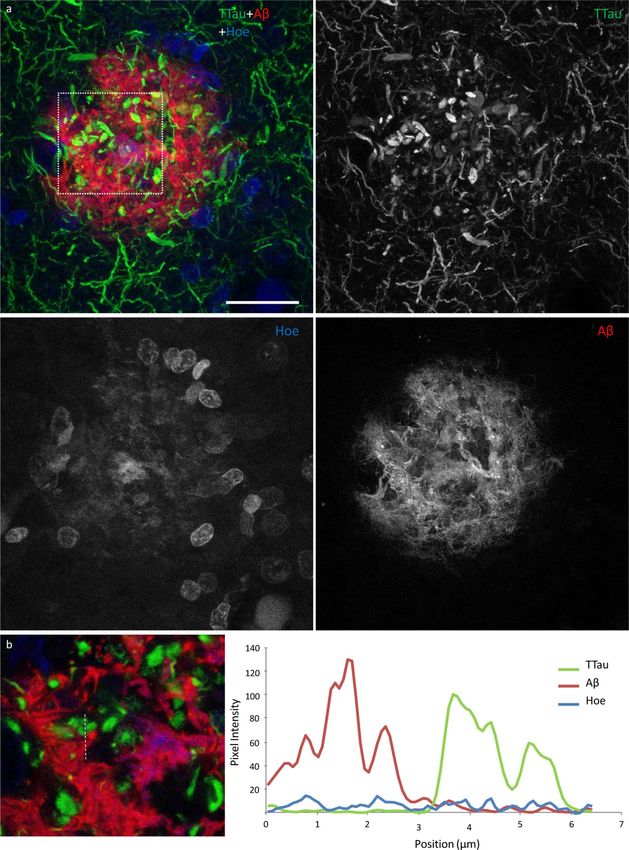
Free Neuropathology 1:20 (2020)                                                                              Patrick Jarmo Paasila et al
doi: https://doi.org/10.17879/freeneuropathology-2020-2845                                                               page 12 of 18

Figure 5 High power image of an Aβ plaque in AD. a Image panel showing a fibrillar neuritic plaque in an AD case (M03) with globular
and threadlike DNs distributed throughout the plaque, which is also surrounded by a network of NTs (dotted box in merged image
demonstrates ROI shown in b). Hoechst staining labelled cell nuclei around the periphery of the plaque as well as the fibrillar Aβ com-
ponent inside the plaque. b Colocalisation study showed no coincidence Aβ and TTau staining in any of the sections examined here
(dotted line represents a 6.5 μm length along which pixel intensities have been compared in this exemplar ROI). Scale bar = 20 μm (a)
Free Neuropathology 1:20 (2020)                                                                            Patrick Jarmo Paasila et al
doi: https://doi.org/10.17879/freeneuropathology-2020-2845                                                             page 13 of 18

Figure 6 Responses of microglia to AD neuropathology. a The ITC of a control case (M01) demonstrating activated microglia with mor-
phological features consistent with the formation of phagosomes (arrows) responding to peripheral and core elements of an Aβ plaque.
b In the ITC of AD cases (M17 pictured), dystrophic microglia were more commonly associated with plaques that contained dense accu-
mulations of dystrophic neurites, however the overall density of dystrophic microglia was inversely correlated with brain pH and not
with AD. c–d Conversely, plaques with a lower density of dystrophic neurites were more commonly associated with a cluster of activat-
ed microglia (M01 pictured) in both the PMC (c) and ITC (d). Scale bar = 20 μm (a–d)
Free Neuropathology 1:20 (2020)                                                                                 Patrick Jarmo Paasila et al
doi: https://doi.org/10.17879/freeneuropathology-2020-2845                                                                  page 14 of 18

Figure 7 Exemplars from an investigation into the potential internalisation of Aβ and tau pathology by microglia. a Activated microglia in
an Aβ plaque in the ITC of a control case with morphological features consistent with the formation of phagosomes (arrows) (M01;
dotted box represents region of interest in b). b Coincidence of Aβ and IBA1 pixel intensities along a 7.8 μm length (dotted line) suggests
potential internalisation of Aβ by microglia. c Activated microglia in close proximity to tau-positive DNs in the ITC of an AD case (M17;
dotted box represents region of interest in d). d There was no evidence of the internalisation of tau pathology by microglia in any of the
sections investigated here; exemplar shows Aβ and TTau staining intensities over a 7.2 μm length (dotted line). Scale bar 20 μm (a, c)
Free Neuropathology 1:20 (2020)                                                             Patrick Jarmo Paasila et al
doi: https://doi.org/10.17879/freeneuropathology-2020-2845                                              page 15 of 18

      As expected, the PMC of AD cases had a signif-         response correlating with the deposition of Aβ. We
icantly higher % Aβ, Aβ plaque count, % TTau, and            have demonstrated clusters of activated microglia
NFT density compared controls. There were no                 that display phagocytic capabilities in the mildly
NFTs observed in the PMC of controls and HPCs,               affected PMC before the development of extensive
which also had very similar levels of % TTau (which          tau pathology. It is conceivable that once the phag-
correlated with increasing age), but differed in their       ocytic potential of microglia is overwhelmed, a
level of % Aβ. HPCs were defined according to                transition to a more neurotoxic proinflammatory
standard neuropathological diagnostic criteria –             phenotype occurs and that this represents a pivotal
having an intermediate ABC score (38). Incidentally,         moment preceding tau-related neurofibrillary de-
HPCs and AD cases (intermediate–high ABC scores)             generation. Studies in mouse models of Aβ overex-
were similar in their Aβ load but differed in their          pression suggest proinflammatory microglia, which
tau levels in both regions. In contrast to the prima-        may be induced by the binding of oligomeric and
ry visual cortex previously investigated (26), the           fibrillar Aβ species to NLR Family Pyrin Domain
PMC in AD did have significantly reduced levels of           Containing 3, Receptor for Advanced Glycation
Aβ and overall tau pathology, including NFTs as              Endproducts, Scavenger receptors, and Toll-like
well evidenced elsewhere (41-46), compared to the            receptors, among others (52-58), are associated
ITC of the same cases. Overall there was no evi-             with poorer cognitive and survival outcomes, have
dence of neurodegeneration in the PMC of AD cas-             impaired phagocytic capabilities (59), and are ca-
es, unlike the ITC, with cortical thickness, number          pable of secreting an expansive complement of
of total neurons, and giant layer Vb pyramidal Betz          neurotoxic compounds including reactive oxygen
cells remaining unchanged as expected (47, 48).              species, nitric oxide, peroxynitrite, tumour necrosis
                                                             factor α, interleukin 1 β, and prostaglandin-E2 (60).
      Examination of the microglial morphologies in          However Aβ-independent mechanisms of microglia
the PMC using the previously validated modified              activation or exhaustion in human AD cannot be
disector sampling approach across all cortical lami-         excluded and require further research considering
nae yielded no significant differences between               the so far limited efficacy of the pharmacological
controls, HPCs, and AD cases. However, group dif-            clearance of Aβ in clinical trials (61, 62).
ferences could be seen locally around AD-type pa-
thology within the cortex with an increase in clus-                Activated microglia tended to be associated
tering of activated microglia in the PMC of HPCs             with fibrillar NPs, and higher resolution confocal
compared to controls, and in the PMC compared to             photomicrographs showed evidence of Aβ internal-
the ITC of AD cases. Moreover, a higher percentage           isation by microglia in both regions. The latter may
of plaques contained clusters of microglia in HPCs           explain the remnant plaques observed here (that
than in AD cases and also a portion of microglia             contain weak or absent Aβ-immunolabelling; in
clusters that were not spatially associated with Aβ.         which higher levels of Aβ were associated with
The presence of a strong microglial clustering re-           activated microglia, but dystrophic microglia where
sponse in the PMC of AD cases and in the HPCs                Aβ-immunoreactivity was very minimal or absent,
aligns with PET imaging studies demonstrating ear-           particularly where dystrophic neurites were exten-
ly activation of microglia in preclinical AD cases           sive) and described elsewhere (14) and is potential-
(49). Although the presence of clusters unrelated to         ly relevant to the proposed dynamic equilibrium
Aβ pathology may be a non-specific observation, it           between soluble Aβ oligomers and insoluble fibrils
is interesting to note that a previous animal study          (63). However, it will be important to confirm the
using a 5×FAD model also reported the presence of            internalisation of Aβ by microglia with super reso-
microgliosis prior to the formation of insoluble Aβ          lution techniques such as direct stochastic optical
plaques (50), with another mouse model also indi-            reconstruction microscopy (dSTORM). In contrast,
cating microglial activation in relation to synaptic         microglia did not specifically cluster around any of
dysfunction prior to Aβ deposition (51).                     the three forms of tau pathology, NFTs, NTs and
                                                             DNs, nor did they appear to internalise tau in co-
    Here it is suggested that clusters of activated          localisation studies, although processes of microglia
microglia in the PMC represent a neuroprotective             were coincidentally found adjacent to DNs. The
Free Neuropathology 1:20 (2020) Patrick Jarmo Paasila et al
doi: https://doi.org/10.17879/freeneuropathology-2020-2845 page 16 of 18
microglial clustering response dissipated over the beneficial in one brain region but detrimental in
modelled disease course with advanced stages, another. In future work the genetic characterisa-
represented by the ITC of AD cases, being charac- tion of subjects investigated here may also provide
terised by reduced IBA1 immunoreactivity, as re- further insight into how genotype affects individual
ported elsewhere (31, 64). This suggests a process susceptibility to differential microglial function,
of microglial incapacitation in the context of in- represented by the highly variable clustering re-
creased tau load, a concept which is supported by a sponse of microglia in HPCs and AD cases in par-
growing body of literature (65, 66). From these ticular. Overall, findings from the post-mortem
results it is hypothesised that the activation of mi- model used here suggest that the clustering of acti-
croglia coincides with cortical Aβ deposition. Neu- vated microglia occurs concomitantly with the for-
ritic inclusions of tau in the cortex are evident early mation of Aβ plaques, and that tau-related neuritic
in the disease process, represented here by the degeneration follows these changes along with a
PMC of AD cases, but mainly develop after the loss of clustering.
deposition Aβ and the activation of microglia.
This sequence of pathological changes is os- Acknowledgements
tensibly consistent with the amyloid cascade hy-
pothesis for AD pathogenesis (19) given the pres- The authors would like to thank the donors
ence of elevated Aβ in the PMC of HPCs, however it and their families for their kind gift. Brain tissue
should be stressed that the levels of Aβ and tau was received from the NSW Brain Tissue Resource
pathology were present at similar levels in the PMC Centre and Sydney Brain Bank. These brain banks
of confirmed AD cases. Therefore it could be ar- are supported by the NHMRC of Australia, The Uni-
gued that insoluble Aβ and tau deposits begin versity of New South Wales, Neuroscience Re-
forming concurrently in the cerebral cortex of AD search Australia, and the National Institute of Alco-
brains. This would be consistent with those arguing hol Abuse and Alcoholism (NIH (NIAAA)
in favour of the pathogenetic importance of tau R24AA012725). The authors also acknowledge the
deposition (22, 23, 67, 68) and the possibility that it facilities used at The Bosch Institute and Microsco-
in fact acts as a causative factor behind AD-related py Australia at the Australian Centre for Microsco-
microglial activation (69). Certainly, animal models py & Microanalysis both at The University of Syd-
suggest that microglial activation augments tau ney.
pathology and specifically tau phosphorylation (70).
This scenario would then be consistent with our Data availability statement
observation that microglial activation wanes with
increased tau deposition and with the idea that The data that support the findings of this
ageing impairs the housekeeping functions of mi- study are available from the corresponding author
croglia (71). Finally, even in the presence of exten- upon reasonable request.
sive tau pathology, the increased presence of rem-
nant plaques in the ITC suggests that microglia re-
tain the ability to clear Aβ peptides.
Understanding the functional significance of
these dynamic spatiotemporal changes in microgli-
al activity along the time course of AD pathophysi-
ology will be critical before new treatments target-
ing these cells can be imagined. Given that micro-
glia of different brain regions display different acti-
vation states simultaneously depending on the
graded extent of AD-type pathology present, the
implementation of either anti- or pro-inflammatory
microglia-based therapies would presumably beFree Neuropathology 1:20 (2020) Patrick Jarmo Paasila et al
doi: https://doi.org/10.17879/freeneuropathology-2020-2845 page 17 of 18
References
1. Braak E, Braak H, Mandelkow EM. A sequence of cytoskeleton neurodegeneration in Alzheimer's disease. Ann Neurol.
changes related to the formation of neurofibrillary tangles and 1999;46(6):860-6.
neuropil threads. Acta Neuropathol. 1994;87(6):554-67.
19. Selkoe DJ, Hardy J. The amyloid hypothesis of Alzheimer's disease
2. Perry G, Kawai M, Tabaton M, Onorato M, Mulvihill P, Richey P, et al. at 25 years. EMBO Mol Med. 2016;8(6):595-608.
Neuropil threads of Alzheimer's disease show a marked alteration of
20. Hardy J, Selkoe DJ. The amyloid hypothesis of Alzheimer's disease:
the normal cytoskeleton. J Neurosci. 1991;11(6):1748-55.
progress and problems on the road to therapeutics. Science.
3. Barghorn S, Davies P, Mandelkow E. Tau paired helical filaments 2002;297(5580):353-6.
from Alzheimer's disease brain and assembled in vitro are based on
21. Braak H, Del Tredici K. The pathological process underlying
beta-structure in the core domain. Biochemistry. 2004;43(6):1694-703.
Alzheimer's disease in individuals under thirty. Acta Neuropathol.
4. Fitzpatrick AWP, Falcon B, He S, Murzin AG, Murshudov G, Garringer 2011;121(2):171-81.
HJ, et al. Cryo-EM structures of tau filaments from Alzheimer's disease.
22. Braak H, Thal DR, Ghebremedhin E, Del Tredici K. Stages of the
Nature. 2017;547(7662):185-90.
pathologic process in Alzheimer disease: age categories from 1 to 100
5. Braak H, Braak E. Neuropathological stageing of Alzheimer-related years. J Neuropathol Exp Neurol. 2011;70(11):960-9.
changes. Acta Neuropathol. 1991;82(4):239-59.
23. Streit WJ, Braak H, Del Tredici K, Leyh J, Lier J, Khoshbouei H, et al.
6. Franzmeier N, Neitzel J, Rubinski A, Smith R, Strandberg O, Microglial activation occurs late during preclinical Alzheimer's disease.
Ossenkoppele R, et al. Functional brain architecture is associated with Glia. 2018;66(12):2550-62.
the rate of tau accumulation in Alzheimer's disease. Nat Commun.
24. Crary JF, Trojanowski JQ, Schneider JA, Abisambra JF, Abner EL,
2020;11(1):347.
Alafuzoff I, et al. Primary age-related tauopathy (PART): a common
7. Nelson PT, Alafuzoff I, Bigio EH, Bouras C, Braak H, Cairns NJ, et al. pathology associated with human aging. Acta Neuropathol.
Correlation of Alzheimer disease neuropathologic changes with 2014;128(6):755-66.
cognitive status: a review of the literature. J Neuropathol Exp Neurol.
25. Kettenmann H, Hanisch UK, Noda M, Verkhratsky A. Physiology of
2012;71.
microglia. Physiol Rev. 2011;91.
8. Arriagada PV, Growdon JH, Hedley-Whyte ET, Hyman BT.
26. Paasila PJ, Davies DS, Kril JJ, Goldsbury C, Sutherland GT. The
Neurofibrillary tangles but not senile plaques parallel duration and
relationship between the morphological subtypes of microglia and
severity of Alzheimer's disease. Neurology. 1992;42(3 Pt 1):631-9.
Alzheimer's disease neuropathology. Brain Pathol. 2019.
9. Thal DR, Rub U, Orantes M, Braak H. Phases of A beta-deposition in
27. Bachstetter AD, Van Eldik LJ, Schmitt FA, Neltner JH, Ighodaro ET,
the human brain and its relevance for the development of AD.
Webster SJ, et al. Disease-related microglia heterogeneity in the
Neurology. 2002;58(12):1791-800.
hippocampus of Alzheimer's disease, dementia with Lewy bodies, and
10. Serrano-Pozo A, Mielke ML, Gomez-Isla T, Betensky RA, Growdon hippocampal sclerosis of aging. Acta Neuropathol Commun. 2015;3:32.
JH, Frosch MP, et al. Reactive glia not only associates with plaques but
28. Streit WJ, Walter SA, Pennell NA. Reactive microgliosis. Prog
also parallels tangles in Alzheimer's disease. Am J Pathol.
Neurobiol. 1999;57(6):563-81.
2011;179(3):1373-84.
29. Streit WJ, Sammons NW, Kuhns AJ, Sparks DL. Dystrophic microglia
11. Mirra SS, Heyman A, McKeel D, Sumi SM, Crain BJ, Brownlee LM, et
in the aging human brain. Glia. 2004;45(2):208-12.
al. The Consortium to Establish a Registry for Alzheimer's Disease
(CERAD). Part II. Standardization of the neuropathologic assessment of 30. Streit WJ, Braak H, Xue QS, Bechmann I. Dystrophic (senescent)
Alzheimer's disease. Neurology. 1991;41(4):479-86. rather than activated microglial cells are associated with tau pathology
and likely precede neurodegeneration in Alzheimer's disease. Acta
12. Dickson TC, Vickers JC. The morphological phenotype of beta-
Neuropathol. 2009;118(4):475-85.
amyloid plaques and associated neuritic changes in Alzheimer's
disease. Neuroscience. 2001;105(1):99-107. 31. Tischer J, Krueger M, Mueller W, Staszewski O, Prinz M, Streit WJ,
et al. Inhomogeneous distribution of Iba-1 characterizes microglial
13. Yasuhara O, Kawamata T, Aimi Y, McGeer EG, McGeer PL. Two
pathology in Alzheimer's disease. Glia. 2016;64(9):1562-72.
types of dystrophic neurites in senile plaques of Alzheimer disease and
elderly non-demented cases. Neurosci Lett. 1994;171(1-2):73-6. 32. Sanchez-Mejias E, Navarro V, Jimenez S, Sanchez-Mico M, Sanchez-
Varo R, Nunez-Diaz C, et al. Soluble phospho-tau from Alzheimer's
14. Oide T, Kinoshita T, Arima K. Regression stage senile plaques in the
disease hippocampus drives microglial degeneration. Acta
natural course of Alzheimer's disease. Neuropathol Appl Neurobiol.
Neuropathol. 2016;132(6):897-916.
2006;32(5):539-56.
33. Walker DG, Tang TM, Mendsaikhan A, Tooyama I, Serrano GE, Sue
15. Yu L, Petyuk VA, Tasaki S, Boyle PA, Gaiteri C, Schneider JA, et al.
LI, et al. Patterns of Expression of Purinergic Receptor P2RY12, a
Association of Cortical beta-Amyloid Protein in the Absence of
Putative Marker for Non-Activated Microglia, in Aged and Alzheimer's
Insoluble Deposits With Alzheimer Disease. JAMA Neurol. 2019.
Disease Brains. Int J Mol Sci. 2020;21(2).
16. Lesne SE, Sherman MA, Grant M, Kuskowski M, Schneider JA,
34. Davies DS, Ma J, Jegathees T, Goldsbury C. Microglia show altered
Bennett DA, et al. Brain amyloid-beta oligomers in ageing and
morphology and reduced arborization in human brain during aging and
Alzheimer's disease. Brain. 2013;136(Pt 5):1383-98.
Alzheimer's disease. Brain Pathol. 2017;27(6):795-808.
17. Lue LF, Kuo YM, Roher AE, Brachova L, Shen Y, Sue L, et al. Soluble
35. Sutherland GT, Sheedy D, Stevens J, McCrossin T, Smith CC, van
amyloid beta peptide concentration as a predictor of synaptic change
Roijen M, et al. The NSW brain tissue resource centre: Banking for
in Alzheimer's disease. Am J Pathol. 1999;155(3):853-62.
alcohol and major neuropsychiatric disorders research. Alcohol.
18. McLean CA, Cherny RA, Fraser FW, Fuller SJ, Smith MJ, Beyreuther 2016:33-9.
K, et al. Soluble pool of Abeta amyloid as a determinant of severity ofFree Neuropathology 1:20 (2020) Patrick Jarmo Paasila et al
doi: https://doi.org/10.17879/freeneuropathology-2020-2845 page 18 of 18
36. Rahman T, Davies DS, Tannenberg RK, Fok S, Shepherd C, Dodd PR, 53. Halle A, Hornung V, Petzold GC, Stewart CR, Monks BG, Reinheckel
et al. Cofilin rods and aggregates concur with tau pathology and the T, et al. The NALP3 inflammasome is involved in the innate immune
development of Alzheimer's disease. J Alzheimers Dis. response to amyloid-beta. Nat Immunol. 2008;9(8):857-65.
2014;42(4):1443-60.
54. Salminen A, Ojala J, Kauppinen A, Kaarniranta K, Suuronen T.
37. Kril JJ, Halliday GM, Svoboda MD, Cartwright H. The cerebral cortex Inflammation in Alzheimer's disease: amyloid-beta oligomers trigger
is damaged in chronic alcoholics. Neuroscience. 1997;79(4):983-98. innate immunity defence via pattern recognition receptors. Prog
Neurobiol. 2009;87(3):181-94.
38. Montine TJ, Phelps CH, Beach TG, Bigio EH, Cairns NJ, Dickson DW,
et al. National Institute on Aging-Alzheimer's Association guidelines for 55. Heneka MT, Kummer MP, Stutz A, Delekate A, Schwartz S, Vieira-
the neuropathologic assessment of Alzheimer's disease: a practical Saecker A, et al. NLRP3 is activated in Alzheimer's disease and
approach. Acta Neuropathol. 2012;123(1):1-11. contributes to pathology in APP/PS1 mice. Nature. 2013;
493(7434):674-8.
39. Hansra GK, Popov G, Banaczek PO, Vogiatzis M, Jegathees T,
Goldsbury CE, et al. The neuritic plaque in Alzheimer's disease: 56. Heneka MT, Golenbock DT, Latz E. Innate immunity in Alzheimer's
Perivascular degeneration of neuronal processes. Neurobiology of disease. Nat Immunol. 2015;16(3):229-36.
Aging. 2019.
57. Heneka MT, Kummer MP, Latz E. Innate immune activation in
40. Uchida Y, Takahashi H. Rapid detection of Abeta deposits in APP neurodegenerative disease. Nat Rev Immunol. 2014;14(7):463-77.
transgenic mice by Hoechst 33342. Neurosci Lett. 2008;448(3):279-81.
58. Hanisch U-K, Kettenmann H. Microglia: active sensor and versatile
41. Murray ME, Graff-Radford NR, Ross OA, Petersen RC, Duara R, effector cells in the normal and pathologic brain. Nat Neurosci.
Dickson DW. Neuropathologically defined subtypes of Alzheimer's 2007;10(11):1387-94.
disease with distinct clinical characteristics: a retrospective study.
59. Koenigsknecht-Talboo J, Landreth GE. Microglial phagocytosis
Lancet Neurol. 2011;10(9):785-96.
induced by fibrillar beta-amyloid and IgGs are differentially regulated
42. Arendt T, Bruckner MK, Gertz HJ, Marcova L. Cortical distribution of by proinflammatory cytokines. J Neurosci. 2005;25(36):8240-9.
neurofibrillary tangles in Alzheimer's disease matches the pattern of
60. Block ML, Zecca L, Hong JS. Microglia-mediated neurotoxicity:
neurons that retain their capacity of plastic remodelling in the adult
uncovering the molecular mechanisms. Nat Rev Neurosci.
brain. Neuroscience. 1998;83(4):991-1002.
2007;8(1):57-69.
43. Geula C, Mesulam MM, Saroff DM, Wu CK. Relationship between
61. Howard R, Liu KY. Questions EMERGE as Biogen claims
plaques, tangles, and loss of cortical cholinergic fibers in Alzheimer
aducanumab turnaround. Nature Reviews Neurology. 2020;16(2):63-4.
disease. J Neuropathol Exp Neurol. 1998;57(1):63-75.
62. Cummings J, Lee G, Ritter A, Sabbagh M, Zhong K. Alzheimer's
44. Golaz J, Bouras C, Hof PR. Motor cortex involvement in presenile
disease drug development pipeline: 2019. Alzheimers Dement (N Y).
dementia: report of a case. J Geriatr Psychiatry Neurol. 1992;5(2):85-
2019;5:272-93.
92.
63. Wang ZX, Tan L, Liu J, Yu JT. The Essential Role of Soluble Aβ
45. Petersen C, Nolan AL, de Paula Franca Resende E, Miller Z,
Oligomers in Alzheimer's Disease. Mol Neurobiol. 2016;53(3):1905-24.
Ehrenberg AJ, Gorno-Tempini ML, et al. Alzheimer's disease clinical
variants show distinct regional patterns of neurofibrillary tangle 64. Minett T, Classey J, Matthews FE, Fahrenhold M, Taga M, Brayne C,
accumulation. Acta Neuropathol. 2019;138(4):597-612. et al. Microglial immunophenotype in dementia with Alzheimer's
pathology. J Neuroinflammation. 2016;13(1):135.
46. Suva D, Favre I, Kraftsik R, Esteban M, Lobrinus A, Miklossy J.
Primary motor cortex involvement in Alzheimer disease. J Neuropathol 65. Streit WJ, Khoshbouei H, Bechmann I. Dystrophic microglia in late-
Exp Neurol. 1999;58(11):1125-34. onset Alzheimer's disease. Glia. 2020;68(4):845-54.
47. Arnold SE, Hyman BT, Flory J, Damasio AR, Van Hoesen GW. The 66. Navarro V, Sanchez-Mejias E, Jimenez S, Muñoz-Castro C, Sanchez-
topographical and neuroanatomical distribution of neurofibrillary Varo R, Davila JC, et al. Microglia in Alzheimer's Disease: Activated,
tangles and neuritic plaques in the cerebral cortex of patients with Dysfunctional or Degenerative. Front Aging Neurosci. 2018;10:140.
Alzheimer's disease. Cereb Cortex. 1991;1(1):103-16.
67. Iqbal K, Liu F, Gong CX, Alonso Adel C, Grundke-Iqbal I. Mechanisms
48. Genç B, Jara JH, Lagrimas AKB, Pytel P, Roos RP, Mesulam MM, et of tau-induced neurodegeneration. Acta Neuropathol. 2009;118(1):53-
al. Apical dendrite degeneration, a novel cellular pathology for Betz 69.
cells in ALS. Scientific reports. 2017;7:41765-.
68. Grinberg LT, Rub U, Ferretti RE, Nitrini R, Farfel JM, Polichiso L, et
49. Shen Z, Bao X, Wang R. Clinical PET Imaging of Microglial al. The dorsal raphe nucleus shows phospho-tau neurofibrillary
Activation: Implications for Microglial Therapeutics in Alzheimer's changes before the transentorhinal region in Alzheimer's disease. A
Disease. Front Aging Neurosci. 2018;10:314-. precocious onset? Neuropathol Appl Neurobiol. 2009;35(4):406-16.
50. Boza-Serrano A, Yang Y, Paulus A, Deierborg T. Innate immune 69. Felsky D, Roostaei T, Nho K, Risacher SL, Bradshaw EM, Petyuk V, et
alterations are elicited in microglial cells before plaque deposition in al. Neuropathological correlates and genetic architecture of microglial
the Alzheimer’s disease mouse model 5xFAD. Scientific Reports. activation in elderly human brain. Nature Communications.
2018;8(1):1550. 2019;10(1):409.
51. Hong S, Beja-Glasser VF, Nfonoyim BM, Frouin A, Li S, 70. Ising C, Venegas C, Zhang S, Scheiblich H, Schmidt SV, Vieira-
Ramakrishnan S, et al. Complement and microglia mediate early Saecker A, et al. NLRP3 inflammasome activation drives tau pathology.
synapse loss in Alzheimer mouse models. Science. Nature. 2019;575(7784):669-73.
2016;352(6286):712-6.
71. Vogels T, Murgoci AN, Hromadka T. Intersection of pathological tau
52. Cameron B, Tse W, Lamb R, Li X, Lamb BT, Landreth GE. Loss of and microglia at the synapse. Acta neuropathologica communications.
Interleukin Receptor-Associated Kinase 4 Signaling Suppresses Amyloid 2019;7(1):109.
Pathology and Alters Microglial Phenotype in a Mouse Model of
Alzheimer's Disease. The Journal of Neuroscience. 2012;
32(43):15112-23.You can also read